Embed Size (px)
Citation preview

IEEE SENSORS JOURNAL, VOL. 5, NO. 2, APRIL 2005 203
Nondestructive Defect Identification WithTerahertz Time-of-Flight Tomography
Hua Zhong, Jingzhou Xu, Xu Xie, Tao Yuan, Ron Reightler, Eric Madaras, and Xi-Cheng Zhang
Abstract—We demonstrate the application of terahertz (THz)time-of-flight tomographic imaging to identify the distribution ofdefects in foam materials. Based on THz time-domain spectroscopytechnology, THz imaging probes targets with picosecond pulsesof broad-band radiation in the frequency range from 100 GHz to3 THz. The reflected THz wave from the target is measured usingelectrooptic sampling, which provides two-dimensional imageswith phase and amplitude information, as well as the spectroscopicproperties of the object. The depth information is recorded inthe THz time-domain waveform. Several reconstruction modelsare developed for tomographic imaging of defects inside foam.Foam insulation of space shuttle fuel tanks, with prebuilt defects,are investigated with THz tomographic imaging. Most prebuiltdefects are pinpointed and models used to identify different kindsof defects are discussed.
Index Terms—Nondestructive identification, terahertz (THz)imaging, THz technology, THz time-domain spectroscopy, time-of-flight (TOF), tomography.
I. INTRODUCTION
PULSED terahertz (THz) imaging refers to imaging tech-niques which utilize picosecond pulses of broad-band ra-
diation in the frequency range from 100 GHz to 3 THz. Since thework of Hu et al. in 1995 [1], a number of THz wave imagingmodalities have emerged [2]. The pulsed nature and broad band-width of THz radiation has made it ideal for imaging appli-cations such as impulse ranging [3], biomedical, or chemicalspecimen identifications [4], [5]. The THz band is advantageoussince it includes very short wavelengths and, therefore, provideshigh resolution compared to traditional electromagnetic tomog-raphy at radio frequencies. It is also subject to significantly lessscattering than infrared light, which allows for improved recon-struction fidelity compared to infrared tomography techniques.
The earliest implementation of THz tomographic imagingapplied THz time-domain spectroscopy (THz TDS) tech-
Manuscript received January 1, 2004; revised August 27, 2004. This workwas supported in part by the Center for Subsurface Sensing and Imaging Sys-tems under the Engineering Research Centers Program of the National ScienceFoundation, Award EEC-9986821. The associate editor coordinating the reviewof this paper and approving it for publication was Dr. Krikor Ozanyan.
H. Zhong and T. Yuan are with the Center for Terahertz Research and theCenter for Subsurface Imaging and Sensing, Rensselaer Polytechnic Institute,Troy, NY 12180 USA (e-mail: [email protected]; [email protected]).
J. Xu, X. Xie, and X.-C. Zhang are with the Center for Terahertz Research,Rensselaer Polytechnic Institute, Troy, NY 12180 USA (e-mail: [email protected];[email protected]; [email protected]).
R. Reightler is with the Lockheed Martin Space Systems, Sunnyvale, CA94086 USA (e-mail: [email protected]).
E. Madaras is with the Center for Subsurface Imaging and Sensing, Rens-selaer Polytechnic Institute, Troy, NY 12180 USA, and also with the NASALangley Research Center, Hampton, VA 23681 USA (e-mail: [email protected]).
Digital Object Identifier 10.1109/JSEN.2004.841341
Fig. 1. Absorption coefficient and refractive index of SOFI in the THzfrequency range.
nology, as a method of the time-of-flight (TOF), to imagethree-dimensional (3-D) structures of THz wave transparentitems [6]. The THz computed tomography (THz CT) [7] adaptsreconstruction algorithms of X-ray CT to the THz band. OtherTHz tomographic imaging modalities, such as THz diffractiontomography [8] and THz tomography by Fresnel lens [9], andTHz multistatic imaging [10], [11] all benefit from the availabletechniques of neighboring bands or even other fields, whileopening a whole new area of capabilities for THz technology.Recently, interest in identification applications of THz TDSand THz tomographic imaging have grown considerably. Forexample, THz imaging is one of two potential modalities(the other is X-ray back-scattered radiography) useful in thedetection of defects in space shuttle foam insulation.
In this paper, we first discuss the feasibility of THz waveimaging in foam insulation defect inspection. Second, we de-scribe the imaging system setup and the experimental proce-dure. Then, we give several models to simulate the observedTHz waveforms of different kinds of defects and show recon-structed defect distributions based on those models. Finally, wediscuss the results and propose possible future improvements.
II. FEASIBILITY
Many foam insulation materials have low absorption in theTHz frequency range [12]. Fig. 1 illustrates the spectrum oflightweight polyurethane sprayed-on foam insulation (SOFI) inthe THz frequency range measured by THz TDS. SOFI has lowattenuation and a refractive index around 1.02, below 1 THz.This allows THz pulses to penetrate through inches of foam toidentify objects underneath. Compared to conventional tech-niques, which provide only intensity information of each pixel,THz time-domain imaging records the entire waveform of aTHz pulse for each pixel. As a result, THz imaging providestomographic information of scanned objects [6]. For example,
1530-437X/$20.00 © 2005 IEEE
204 IEEE SENSORS JOURNAL, VOL. 5, NO. 2, APRIL 2005
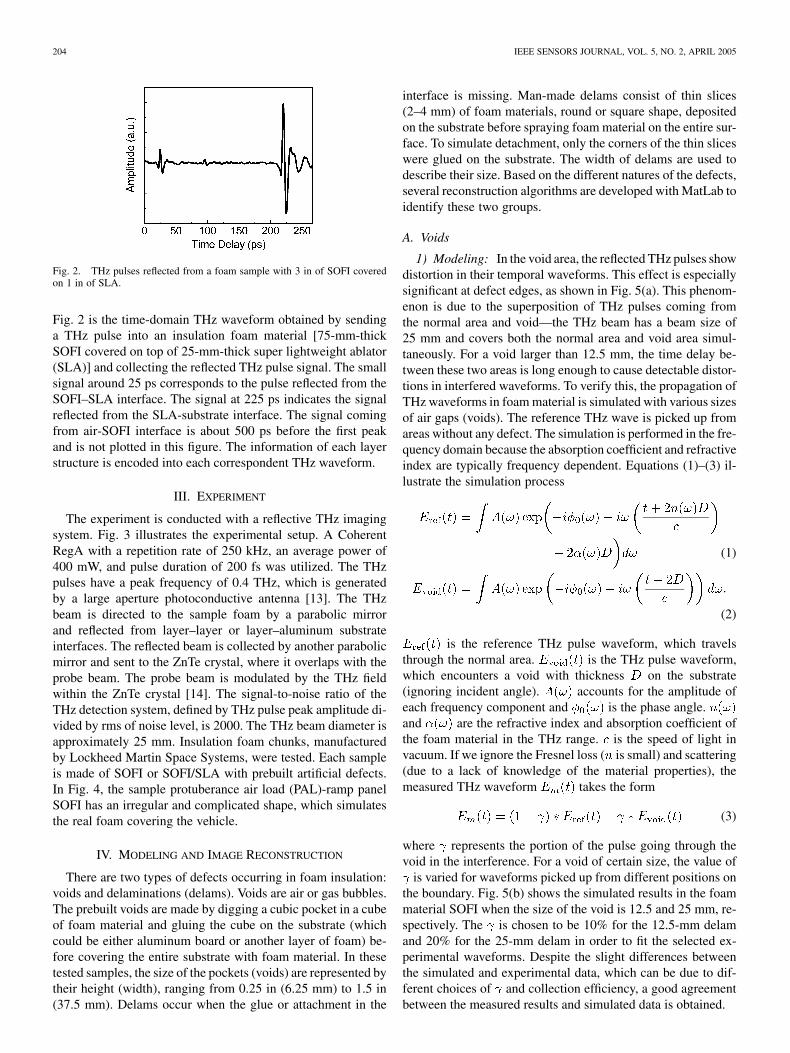
Fig. 2. THz pulses reflected from a foam sample with 3 in of SOFI coveredon 1 in of SLA.
Fig. 2 is the time-domain THz waveform obtained by sendinga THz pulse into an insulation foam material [75-mm-thickSOFI covered on top of 25-mm-thick super lightweight ablator(SLA)] and collecting the reflected THz pulse signal. The smallsignal around 25 ps corresponds to the pulse reflected from theSOFI–SLA interface. The signal at 225 ps indicates the signalreflected from the SLA-substrate interface. The signal comingfrom air-SOFI interface is about 500 ps before the first peakand is not plotted in this figure. The information of each layerstructure is encoded into each correspondent THz waveform.
III. EXPERIMENT
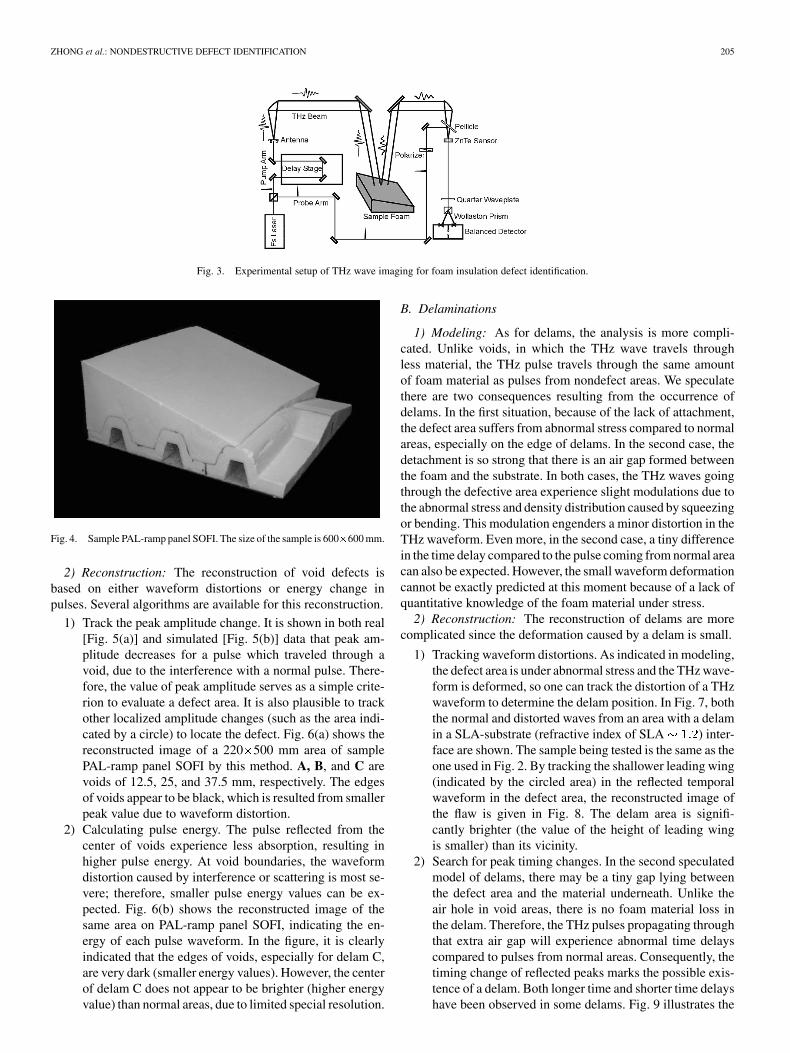
The experiment is conducted with a reflective THz imagingsystem. Fig. 3 illustrates the experimental setup. A CoherentRegA with a repetition rate of 250 kHz, an average power of400 mW, and pulse duration of 200 fs was utilized. The THzpulses have a peak frequency of 0.4 THz, which is generatedby a large aperture photoconductive antenna [13]. The THzbeam is directed to the sample foam by a parabolic mirrorand reflected from layer–layer or layer–aluminum substrateinterfaces. The reflected beam is collected by another parabolicmirror and sent to the ZnTe crystal, where it overlaps with theprobe beam. The probe beam is modulated by the THz fieldwithin the ZnTe crystal [14]. The signal-to-noise ratio of theTHz detection system, defined by THz pulse peak amplitude di-vided by rms of noise level, is 2000. The THz beam diameter isapproximately 25 mm. Insulation foam chunks, manufacturedby Lockheed Martin Space Systems, were tested. Each sampleis made of SOFI or SOFI/SLA with prebuilt artificial defects.In Fig. 4, the sample protuberance air load (PAL)-ramp panelSOFI has an irregular and complicated shape, which simulatesthe real foam covering the vehicle.
IV. MODELING AND IMAGE RECONSTRUCTION
There are two types of defects occurring in foam insulation:voids and delaminations (delams). Voids are air or gas bubbles.The prebuilt voids are made by digging a cubic pocket in a cubeof foam material and gluing the cube on the substrate (whichcould be either aluminum board or another layer of foam) be-fore covering the entire substrate with foam material. In thesetested samples, the size of the pockets (voids) are represented bytheir height (width), ranging from 0.25 in (6.25 mm) to 1.5 in(37.5 mm). Delams occur when the glue or attachment in the
interface is missing. Man-made delams consist of thin slices(2–4 mm) of foam materials, round or square shape, depositedon the substrate before spraying foam material on the entire sur-face. To simulate detachment, only the corners of the thin sliceswere glued on the substrate. The width of delams are used todescribe their size. Based on the different natures of the defects,several reconstruction algorithms are developed with MatLab toidentify these two groups.
A. Voids
1) Modeling: In the void area, the reflected THz pulses showdistortion in their temporal waveforms. This effect is especiallysignificant at defect edges, as shown in Fig. 5(a). This phenom-enon is due to the superposition of THz pulses coming fromthe normal area and void—the THz beam has a beam size of25 mm and covers both the normal area and void area simul-taneously. For a void larger than 12.5 mm, the time delay be-tween these two areas is long enough to cause detectable distor-tions in interfered waveforms. To verify this, the propagation ofTHz waveforms in foam material is simulated with various sizesof air gaps (voids). The reference THz wave is picked up fromareas without any defect. The simulation is performed in the fre-quency domain because the absorption coefficient and refractiveindex are typically frequency dependent. Equations (1)–(3) il-lustrate the simulation process
(1)
(2)
is the reference THz pulse waveform, which travelsthrough the normal area. is the THz pulse waveform,which encounters a void with thickness on the substrate(ignoring incident angle). accounts for the amplitude ofeach frequency component and is the phase angle.and are the refractive index and absorption coefficient ofthe foam material in the THz range. is the speed of light invacuum. If we ignore the Fresnel loss ( is small) and scattering(due to a lack of knowledge of the material properties), themeasured THz waveform takes the form
(3)
where represents the portion of the pulse going through thevoid in the interference. For a void of certain size, the value of
is varied for waveforms picked up from different positions onthe boundary. Fig. 5(b) shows the simulated results in the foammaterial SOFI when the size of the void is 12.5 and 25 mm, re-spectively. The is chosen to be 10% for the 12.5-mm delamand 20% for the 25-mm delam in order to fit the selected ex-perimental waveforms. Despite the slight differences betweenthe simulated and experimental data, which can be due to dif-ferent choices of and collection efficiency, a good agreementbetween the measured results and simulated data is obtained.
ZHONG et al.: NONDESTRUCTIVE DEFECT IDENTIFICATION 205
Fig. 3. Experimental setup of THz wave imaging for foam insulation defect identification.
Fig. 4. Sample PAL-ramp panel SOFI. The size of the sample is 600�600 mm.
2) Reconstruction: The reconstruction of void defects isbased on either waveform distortions or energy change inpulses. Several algorithms are available for this reconstruction.
1) Track the peak amplitude change. It is shown in both real[Fig. 5(a)] and simulated [Fig. 5(b)] data that peak am-plitude decreases for a pulse which traveled through avoid, due to the interference with a normal pulse. There-fore, the value of peak amplitude serves as a simple crite-rion to evaluate a defect area. It is also plausible to trackother localized amplitude changes (such as the area indi-cated by a circle) to locate the defect. Fig. 6(a) shows thereconstructed image of a 220 500 mm area of samplePAL-ramp panel SOFI by this method. A, B, and C arevoids of 12.5, 25, and 37.5 mm, respectively. The edgesof voids appear to be black, which is resulted from smallerpeak value due to waveform distortion.
2) Calculating pulse energy. The pulse reflected from thecenter of voids experience less absorption, resulting inhigher pulse energy. At void boundaries, the waveformdistortion caused by interference or scattering is most se-vere; therefore, smaller pulse energy values can be ex-pected. Fig. 6(b) shows the reconstructed image of thesame area on PAL-ramp panel SOFI, indicating the en-ergy of each pulse waveform. In the figure, it is clearlyindicated that the edges of voids, especially for delam C,are very dark (smaller energy values). However, the centerof delam C does not appear to be brighter (higher energyvalue) than normal areas, due to limited special resolution.
B. Delaminations
1) Modeling: As for delams, the analysis is more compli-cated. Unlike voids, in which the THz wave travels throughless material, the THz pulse travels through the same amountof foam material as pulses from nondefect areas. We speculatethere are two consequences resulting from the occurrence ofdelams. In the first situation, because of the lack of attachment,the defect area suffers from abnormal stress compared to normalareas, especially on the edge of delams. In the second case, thedetachment is so strong that there is an air gap formed betweenthe foam and the substrate. In both cases, the THz waves goingthrough the defective area experience slight modulations due tothe abnormal stress and density distribution caused by squeezingor bending. This modulation engenders a minor distortion in theTHz waveform. Even more, in the second case, a tiny differencein the time delay compared to the pulse coming from normal areacan also be expected. However, the small waveform deformationcannot be exactly predicted at this moment because of a lack ofquantitative knowledge of the foam material under stress.
2) Reconstruction: The reconstruction of delams are morecomplicated since the deformation caused by a delam is small.
1) Tracking waveform distortions. As indicated in modeling,the defect area is under abnormal stress and the THz wave-form is deformed, so one can track the distortion of a THzwaveform to determine the delam position. In Fig. 7, boththe normal and distorted waves from an area with a delamin a SLA-substrate (refractive index of SLA ) inter-face are shown. The sample being tested is the same as theone used in Fig. 2. By tracking the shallower leading wing(indicated by the circled area) in the reflected temporalwaveform in the defect area, the reconstructed image ofthe flaw is given in Fig. 8. The delam area is signifi-cantly brighter (the value of the height of leading wingis smaller) than its vicinity.
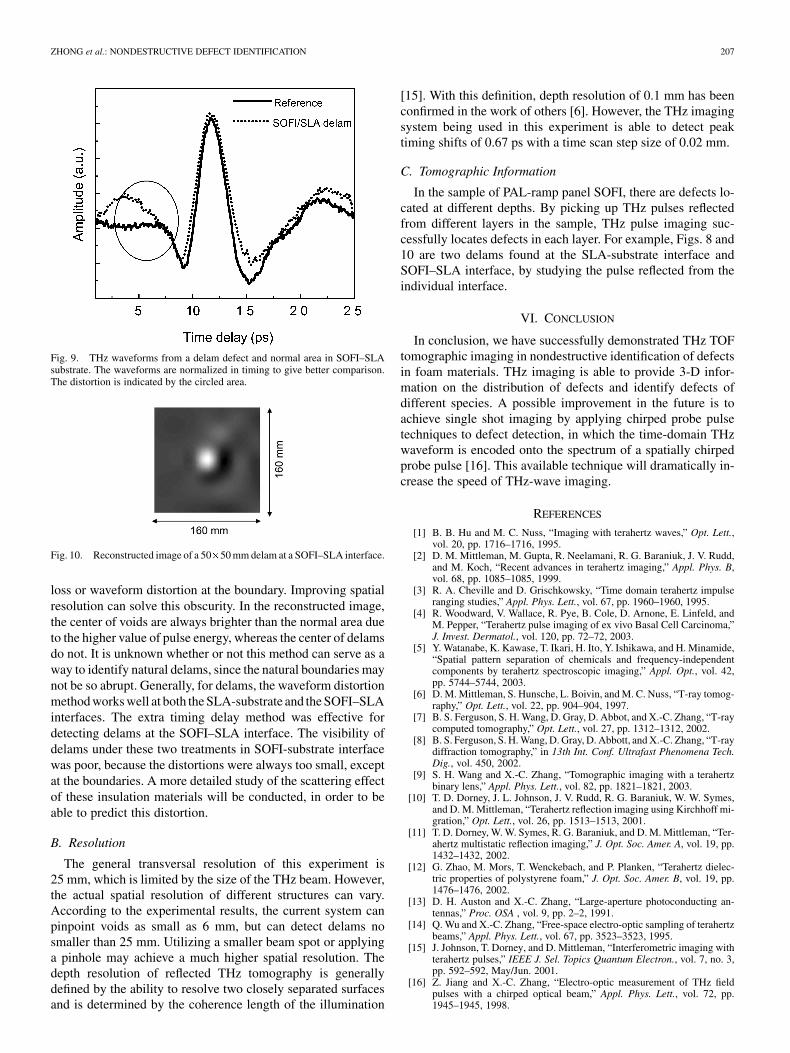
2) Search for peak timing changes. In the second speculatedmodel of delams, there may be a tiny gap lying betweenthe defect area and the material underneath. Unlike theair hole in void areas, there is no foam material loss inthe delam. Therefore, the THz pulses propagating throughthat extra air gap will experience abnormal time delayscompared to pulses from normal areas. Consequently, thetiming change of reflected peaks marks the possible exis-tence of a delam. Both longer time and shorter time delayshave been observed in some delams. Fig. 9 illustrates the

206 IEEE SENSORS JOURNAL, VOL. 5, NO. 2, APRIL 2005
Fig. 5. THz waveforms from void defects and normal area in PAL-ramp panel SOFI sample. (a) Experimental data. The waveforms are normalized in timing togive better comparison. (b) Simulated results.
Fig. 6. Reconstructed void distributions on part of the sample PAL-ramp SOFI. (a) Reconstructed by tracking local amplitude changes. (b) Reconstructed bycalculating pulse energy. The size of the sample is 200�500 mm. A, B, and C are voids of 12.5, 25, and 37.5 mm, respectively. D is a 50�50 mm delam. Thedelam D is shown because of the distinctive waveform distortion and energy loss at its boundary.
Fig. 7. THz waveforms from a delam defect and normal area in SLA-substrateinterface (refractive index n = 1:2). The waveforms are normalized in timingto provide better comparison. The distortion is indicated by the circled area.
reconstructed image of a delam at SOFI–SLA interfaces.The sample is the same as the one used in Figs. 2, 7, and8. The image is obtained by studying the peak time delaychange of the pulse reflected from the SOFI–SLA inter-face. A longer time delay was observed in the delam area
Fig. 8. Reconstructed image of a 50�50 mm delam in a SLA-substrateinterface.
which is represented by brighter color. Fig. 10 verifies thelocation of a delam in that area by showing distortion (in-dicated by the circled area) in the THz pulse waveform.
V. DISCUSSION
A. Validity of the Reconstruction Methods
For the voids, both peak amplitude change and pulse energygive nearly the same quality of reconstructed image. However, inSOFI samples, delams larger than 25 mm are always falsely iden-tified as voids by both methods as seen in delam D (50 50 mm)in Fig. 6(a) and (b). The reason is that in the artificial delams,pulses are scattered on the edge between the delam slice andsprayed area in its vicinity, which causes significant energy
ZHONG et al.: NONDESTRUCTIVE DEFECT IDENTIFICATION 207
Fig. 9. THz waveforms from a delam defect and normal area in SOFI–SLAsubstrate. The waveforms are normalized in timing to give better comparison.The distortion is indicated by the circled area.
Fig. 10. Reconstructed image of a 50�50 mm delam at a SOFI–SLA interface.
loss or waveform distortion at the boundary. Improving spatialresolution can solve this obscurity. In the reconstructed image,the center of voids are always brighter than the normal area dueto the higher value of pulse energy, whereas the center of delamsdo not. It is unknown whether or not this method can serve as away to identify natural delams, since the natural boundaries maynot be so abrupt. Generally, for delams, the waveform distortionmethod works well at both the SLA-substrate and the SOFI–SLAinterfaces. The extra timing delay method was effective fordetecting delams at the SOFI–SLA interface. The visibility ofdelams under these two treatments in SOFI-substrate interfacewas poor, because the distortions were always too small, exceptat the boundaries. A more detailed study of the scattering effectof these insulation materials will be conducted, in order to beable to predict this distortion.
B. Resolution
The general transversal resolution of this experiment is25 mm, which is limited by the size of the THz beam. However,the actual spatial resolution of different structures can vary.According to the experimental results, the current system canpinpoint voids as small as 6 mm, but can detect delams nosmaller than 25 mm. Utilizing a smaller beam spot or applyinga pinhole may achieve a much higher spatial resolution. Thedepth resolution of reflected THz tomography is generallydefined by the ability to resolve two closely separated surfacesand is determined by the coherence length of the illumination
[15]. With this definition, depth resolution of 0.1 mm has beenconfirmed in the work of others [6]. However, the THz imagingsystem being used in this experiment is able to detect peaktiming shifts of 0.67 ps with a time scan step size of 0.02 mm.
C. Tomographic Information
In the sample of PAL-ramp panel SOFI, there are defects lo-cated at different depths. By picking up THz pulses reflectedfrom different layers in the sample, THz pulse imaging suc-cessfully locates defects in each layer. For example, Figs. 8 and10 are two delams found at the SLA-substrate interface andSOFI–SLA interface, by studying the pulse reflected from theindividual interface.
VI. CONCLUSION
In conclusion, we have successfully demonstrated THz TOFtomographic imaging in nondestructive identification of defectsin foam materials. THz imaging is able to provide 3-D infor-mation on the distribution of defects and identify defects ofdifferent species. A possible improvement in the future is toachieve single shot imaging by applying chirped probe pulsetechniques to defect detection, in which the time-domain THzwaveform is encoded onto the spectrum of a spatially chirpedprobe pulse [16]. This available technique will dramatically in-crease the speed of THz-wave imaging.
REFERENCES
[1] B. B. Hu and M. C. Nuss, “Imaging with terahertz waves,” Opt. Lett.,vol. 20, pp. 1716–1716, 1995.
[2] D. M. Mittleman, M. Gupta, R. Neelamani, R. G. Baraniuk, J. V. Rudd,and M. Koch, “Recent advances in terahertz imaging,” Appl. Phys. B,vol. 68, pp. 1085–1085, 1999.
[3] R. A. Cheville and D. Grischkowsky, “Time domain terahertz impulseranging studies,” Appl. Phys. Lett., vol. 67, pp. 1960–1960, 1995.
[4] R. Woodward, V. Wallace, R. Pye, B. Cole, D. Arnone, E. Linfeld, andM. Pepper, “Terahertz pulse imaging of ex vivo Basal Cell Carcinoma,”J. Invest. Dermatol., vol. 120, pp. 72–72, 2003.
[5] Y. Watanabe, K. Kawase, T. Ikari, H. Ito, Y. Ishikawa, and H. Minamide,“Spatial pattern separation of chemicals and frequency-independentcomponents by terahertz spectroscopic imaging,” Appl. Opt., vol. 42,pp. 5744–5744, 2003.
[6] D. M. Mittleman, S. Hunsche, L. Boivin, and M. C. Nuss, “T-ray tomog-raphy,” Opt. Lett., vol. 22, pp. 904–904, 1997.
[7] B. S. Ferguson, S. H. Wang, D. Gray, D. Abbot, and X.-C. Zhang, “T-raycomputed tomography,” Opt. Lett., vol. 27, pp. 1312–1312, 2002.
[8] B. S. Ferguson, S. H. Wang, D. Gray, D. Abbott, and X.-C. Zhang, “T-raydiffraction tomography,” in 13th Int. Conf. Ultrafast Phenomena Tech.Dig., vol. 450, 2002.
[9] S. H. Wang and X.-C. Zhang, “Tomographic imaging with a terahertzbinary lens,” Appl. Phys. Lett., vol. 82, pp. 1821–1821, 2003.
[10] T. D. Dorney, J. L. Johnson, J. V. Rudd, R. G. Baraniuk, W. W. Symes,and D. M. Mittleman, “Terahertz reflection imaging using Kirchhoff mi-gration,” Opt. Lett., vol. 26, pp. 1513–1513, 2001.
[11] T. D. Dorney, W. W. Symes, R. G. Baraniuk, and D. M. Mittleman, “Ter-ahertz multistatic reflection imaging,” J. Opt. Soc. Amer. A, vol. 19, pp.1432–1432, 2002.
[12] G. Zhao, M. Mors, T. Wenckebach, and P. Planken, “Terahertz dielec-tric properties of polystyrene foam,” J. Opt. Soc. Amer. B, vol. 19, pp.1476–1476, 2002.
[13] D. H. Auston and X.-C. Zhang, “Large-aperture photoconducting an-tennas,” Proc. OSA , vol. 9, pp. 2–2, 1991.
[14] Q. Wu and X.-C. Zhang, “Free-space electro-optic sampling of terahertzbeams,” Appl. Phys. Lett., vol. 67, pp. 3523–3523, 1995.
[15] J. Johnson, T. Dorney, and D. Mittleman, “Interferometric imaging withterahertz pulses,” IEEE J. Sel. Topics Quantum Electron., vol. 7, no. 3,pp. 592–592, May/Jun. 2001.
[16] Z. Jiang and X.-C. Zhang, “Electro-optic measurement of THz fieldpulses with a chirped optical beam,” Appl. Phys. Lett., vol. 72, pp.1945–1945, 1998.

208 IEEE SENSORS JOURNAL, VOL. 5, NO. 2, APRIL 2005
Hua Zhong received the B.S. degree in physics fromPeking University, Beijing, China, and the M.S. de-gree in physics from Rensselaer Polytechnic Institute(RPI), Troy, NY, in 2000 and 2002, respectively. Sheis currently pursuing the Ph.D. degree at the Centerfor Terahertz Research, RPI, in nondestructive evalu-ation with both pulsed- and CW-terahertz radiation.
Jingzhou Xu was born in Yanshan, Hebei, China, in1971. He received the B.S. degree in physics fromPeking University, Beijing, China, in 1995, and thePh.D. degree in optical physics from the Institute ofPhysics, Chinese Academy of Science, China.
He joined the Terahertz Group, Rensselaer Poly-technic Institute (RPI), Troy, NY, as a PostdoctoralResearch Associate in 2002. Currently, he is a Re-search Assistant Professor at the Center for TerahertzResearch, RPI. Since beginning his Ph.D. thesisresearch in 1996, he spent more than eight years re-
searching terahertz-wave science and technology. His current research interestsinclude two-dimensional terahertz-wave imaging, terahertz-wave microscopy,terahertz-wave nondestructive inspection, and high-efficient terahertz sourceand sensor development.
Xu Xie received the B.S. and M.S. degrees in physicsfrom Peking University, Beijing, China, in 2000 and2002, respectively. He is currently pursuing the Ph.D.degree at the Center for Terahertz Research, Rens-selaer Polytechnic Institute, Troy, NY, where he isworking on pulsed-terahertz imaging and terahertznonlinear optics.
Tao Yuan received the B.E. degree in engineeringphysics and the M.S. degree in physics from Ts-inghua University, Beijing, China, in 1995 and1998, respectively. He is currently pursuing thePh.D. degree at the Center for Terahertz Research,Rensselaer Polytechnic Institute, Troy, NY, where heis working on terahertz microscopy.
Ron Reightler, photograph and biography not available at the time of publica-tion.
Eric Madaras, photograph and biography not available at the time of publica-tion.
Xi-Cheng Zhang is the J. Erik Jonsson Professor ofScience, a Professor of physics, applied physics, andastronomy, and a Professor of electrical, computer,and systems engineering at Rensselaer PolytechnicInstitute, Troy, NY. He first became interested in gen-eration and detection of terahertz radiation in 1987when he joined Columbia University, New York, asResearch Scientist. He has authored and coauthoredeight books and book chapters and more than 250 ref-ereed journal papers. He has also delivered over 300colloquium, seminars, invited conference presenta-
tions, and 250 contributed conference talks since 1990.Dr. Zhang is a Fellow of the American Physics Society and the Optical Society
of America.

![[Report] POSCO Energy#1 GT RTR Inspection Report...4.0 Nondestructive Testing(NDT) 4.1 Defect testing was performed using Nondestructive Testing(NDT) with Magnetic Particle Testing(MT)](https://img.dokumen.tips/doc/110x75/5e6970b7f07857121f49cd8d/report-posco-energy1-gt-rtr-inspection-report-40-nondestructive-testingndt.jpg)


![Martin S. Heimbeck Henry O Everitt Amy E. Frees · I. INTRODUCTION . Terahertz radiation has recently gained attention for its usefulness in nondestructive imaging [1]](https://img.dokumen.tips/doc/110x75/5b5b40a77f8b9ac7498dae99/martin-s-heimbeck-henry-o-everitt-amy-e-i-introduction-terahertz-radiation.jpg)