Embed Size (px)
Citation preview
Roldán-Alzate et al. Journal of Cardiovascular Magnetic Resonance 2014, 16:23http://jcmr-online.com/content/16/1/23
RESEARCH Open Access
Non-invasive assessment of cardiac function andpulmonary vascular resistance in an canine modelof acute thromboembolic pulmonaryhypertension using 4D flow cardiovascularmagnetic resonanceAlejandro Roldán-Alzate1,2, Alex Frydrychowicz1,3, Kevin M Johnson2, Heidi Kellihan4, Naomi C Chesler5,Oliver Wieben1,2 and Christopher J François1*
Abstract
Background: The purpose of this study was to quantify right (RV) and left (LV) ventricular function, pulmonaryartery flow (QP), tricuspid valve regurgitation velocity (TRV), and aorta flow (QS) from a single 4D flow cardiovascularmagnetic resonance (CMR) (time-resolved three-directionally motion encoded CMR) sequence in a canine model ofacute thromboembolic pulmonary hypertension (PH).
Methods: Acute PH was induced in six female beagles by microbead injection into the right atrium. Pulmonaryarterial (PAP) and pulmonary capillary wedge (PCWP) pressures and cardiac output (CO) were measured by rightheart catheterization (RHC) at baseline and following induction of acute PH. Pulmonary vascular resistance (PVRRHC)was calculated from RHC values of PAP, PCWP and CO (PVRRHC = (PAP-PCWP)/CO). Cardiac magnetic resonance(CMR) was performed on a 3 T scanner at baseline and following induction of acute PH. RV and LV end-diastolic(EDV) and end-systolic (ESV) volumes were determined from both CINE balanced steady-state free precession(bSSFP) and 4D flow CMR magnitude images. QP, TRV, and QS were determined from manually placed cutplanes inthe 4D flow CMR flow-sensitive images in the main (MPA), right (RPA), and left (LPA) pulmonary arteries, thetricuspid valve (TRV), and aorta respectively. MPA, RPA, and LPA flow was also measured using two-dimensionalflow-sensitive (2D flow) CMR.
Results: Biases between 4D flow CMR and bSSFP were 0.8 mL and 1.6 mL for RV EDV and RV ESV, respectively, and0.8 mL and 4 mL for LV EDV and LV ESV, respectively. Flow in the MPA, RPA, and LPA did not change afterinduction of acute PAH (p = 0.42-0.81). MPA, RPA, and LPA flow determined with 4D flow CMR was significantlylower than with 2D flow (p < 0.05). The correlation between QP/TRV and PVRRHC was 0.95. The average QP/QS was0.96 ± 0.11.
Conclusions: Using both magnitude and flow-sensitive data from a single 4D flow CMR acquisition permitssimultaneous quantification of cardiac function and cardiopulmonary hemodynamic parameters important in theassessment of PH.
Keywords: Pulmonary hypertension, Pulmonary vascular resistance, Heart function, 4D flow cardiovascular magneticresonance, Thromboembolic pulmonary hypertension, Canine model
* Correspondence: [email protected] of Radiology, Clinical Science Center, University of Wisconsin -Madison, 600 Highland Avenue, Madison, Wisconsin 53792-3252, USAFull list of author information is available at the end of the article
© 2014 Roldán-Alzate et al.; licensee BioMed CCreative Commons Attribution License (http:/distribution, and reproduction in any medium
entral Ltd. This is an Open Access article distributed under the terms of the/creativecommons.org/licenses/by/2.0), which permits unrestricted use,, provided the original work is properly credited.
Roldán-Alzate et al. Journal of Cardiovascular Magnetic Resonance 2014, 16:23 Page 2 of 9http://jcmr-online.com/content/16/1/23
BackgroundPulmonary hypertension (PH) is an ultimately fatal diseasecharacterized by an abnormal increase in the meanpulmonary artery pressure (mPAP) that ultimately leadsto right ventricular (RV) failure [1]. The initial evaluationof patients with suspected PH includes non-invasive im-aging with echocardiography because of its ability to non-invasively estimate pulmonary artery pressures, pulmonaryvascular resistance (PVR) and cardiac function [2]. De-pending upon the results of the initial assessment withechocardiography, further imaging work-up to identify theunderlying cause and determine appropriate managementof PH may include ventilation/perfusion scintigraphyin patients with known or suspected chronic thrombo-embolic PH, computed tomography to assess for diffuselung disease, and invasive right heart catheterization(RHC) [3] to confirm the diagnosis. Currently, RHC isconsidered the reference standard for assessing PHpatients and providing definite diagnosis, because thecategorization of the type of PH is based on the observedpulmonary artery pressures (mPAP > 25 mmHg), pulmon-ary capillary wedge pressure (PCWP < than 15 mmHg)and pulmonary vascular resistance (PVR > 3WU) [4].Cardiovascular magnetic resonance (CMR) is increas-
ingly being used to monitor pulmonary hemodynamicsand cardiac function in patients with PH. Flow-sensitiveCMR sequences can be used to measure pulmonary ar-tery flow (QP) flow and TRV, and thereby estimate PVR(PVRRHC ∝ TRV/Qp) using a method analogous to thatused by Abbas et al. for echocardiography [5]. Using thismodel, TRV is used as a surrogate of peak systolic pul-monary arterial pressure and reflects the trans-tricuspidgradient. With respect to cardiac size and function, CMRis considered the gold standard for quantification of left[6-8] and right [9-11] ventricular size and function withtime-resolved “CINE” balanced steady-state free preces-sion (bSSFP) imaging due to its high reproducibility.In this study we have investigated an alternative CMR
approach to assess flow and ventricular function using asingle 4D flow MR sequence that uses a radially under-sampled, time-resolved, 3-dimensional, 3-directionallyvelocity-encoded imaging scheme [12]. Ventricular sizeand function were measured using the time-resolvedmagnitude images and compared with values obtainedusing standard CINE bSSFP and two-dimensional flow-sensitive (2D flow) imaging. Tricuspid valve, pulmonaryartery and aorta flow was quantified using the time-resolved phase images and compared with ventricularstroke volumes obtained using volumetric methods. Inaddition, the ratio of TRV/QP was correlated to PVRRHC
to determine if this method could also be used to esti-mate PVR non-invasively. A benefit of using the samesequence for measuring cardiac chamber volumes andflow includes an overall shortened examination acquisition
time (particularly in cases where numerous flow measure-ments are required). In addition, a free-breathing acquisi-tion is beneficial in patients who have difficulty with thenumerous breath holds required using standard cardiacMR sequences. Although not explored in this study, 4Dflow MR has been shown to be of use in assessing add-itional hemodynamic characteristics of normal and abnor-mal flow in a variety of cardiovascular diseases [13].
MethodsAcute canine thromboembolic pulmonary hypertensionmodelAll studies were approved by the institutional local ani-mal care and use committee (RARC). Acute PAH wasinduced by injection of micro-beads (150–500 μm) inthe right atrium and ventricle in six adult female beagles(8.3 ± 2.4 kg). Dogs were anesthetized with propofol(10 mg/kg body weight), intubated, and maintainedunder anesthesia with isoflurane (1 to 3%) with 100% oxy-gen. During anesthesia, ventilation was adjusted to keepend-tidal CO2 within normal limits (30–50 mmHg). Afemoral arterial catheter was inserted and systemic arterialpressure (SAP) and arterial blood gases were monitored.The femoral and external jugular veins were catheterizedfor RHC access, delivery of emboli, delivery of contrast forangiography and blood sampling.While maintaining the dog under anesthesia, CMR and
RHC were repeated twice, the first prior to induction ofPH to obtain baseline data, and the second repeating allacquisitions after successful induction of thromboembolicPH (confirmed by > twofold increase in baseline mPAP).The dogs were euthanized according to the RARC proto-col after the post-embolization CMR study.
Right heart catheterizationAfter induction of anesthesia, dogs were granted a restingperiod of approximately 30 minutes to ensure adaptationof the circulation to anesthesia. Baseline pulmonary arter-ial pressure (PAP), pulmonary capillary wedge pressure(PCWP) and right ventricular cardiac output (QP) weremeasured. Measurements were made using a 7.5-French,fluid-filled catheter connected to an analog pressure re-corder. PVR [in Woods units (WU)] was calculated usingthe formula, analogous to Ohm’s law for electrical circuits:PVRRHC =ΔP/QP, where ΔP is the trans-pulmonary pres-sure gradient (ΔP =mPAP - PCWP) [14] and QP is theflow in the pulmonary artery measured by thermodilution.
Magnetic resonance imagingCMR measurements were performed prior to and follow-ing induction of PH resulting in a total of 12 measure-ments on a 3.0 T clinical systems (MR750, GE Healthcare,Waukesha, WI). Contiguous axial CINE bSSFP slices wereobtained covering the entire heart. Parameters for CINE
Roldán-Alzate et al. Journal of Cardiovascular Magnetic Resonance 2014, 16:23 Page 3 of 9http://jcmr-online.com/content/16/1/23
bSSFP imaging included: 310 × 190 mm field of view,224 × 192 acquisition matrix, 7 mm slice thickness, 0 mmgap, ±125 kHz bandwidth, 45° flip angle, TR/TE = 3.1/1.1 ms (fractional echo readout), and a prospectivelygated, k-space segmented acquisition (12 views per seg-ment), for an acquired temporal resolution of 37 ms. 20temporally interpolated time frames were reconstructed ateach slice location. Between 13 and 16 slices were ac-quired depending on subject anatomy. Each slice wasacquired within an 8 to 10 second time interval of sus-pended ventilation.2D and 4D flow CMR were performed following the
administration of 0.1 mmol/kg of Gd-based intravenouscontrast (gadobenate dimeglumine, Bracco Diagnostics,Inc., Princeton, NJ). A standard 2D flow CMR sequencewas used to assess flow through the main, right, and leftpulmonary arteries (MPA, RPA and LPA, respectively).Parameters for 2D flow imaging were: 160-220 × 160-176 mm field of view, 256 × 128 acquisition matrix,5 mm slice thickness, TR/TE = 5.53-5.93/3.17-3.44 ms,and a prospectively gated, k-space segmented acquisi-tion. Temporal resolution was 22.11-35.44 ms and datawere interpolated to 20 reconstructed time frames foreach location. 2D flow CMR acquisitions were per-formed during a breath-hold at end-expiration.4D flow CMR was performed using a previously de-
scribed 3D radial sequence [15]. Parameters were: imagingvolume = 320 × 320 × 220 mm, readout length = 256 sam-ples, TR/TE = 6.7/2.4 ms, flip angle 10-20°, spatial reso-lution = 1.3 mm isotropic. Retrospective ECG-gating wasused. Respiratory triggering with bellows allowed forbreathing compensation with an acceptance rate of 50%,resulting in a scan duration of 10–12 min during freebreathing. Data were retrospectively sorted into 20 timeframes according to their position in the cardiac cycle.Subsequently, image reconstruction was performed utiliz-ing a compressed sensing reconstruction and a temporalfilter for view sharing [16]. To minimize the number ofslices needing manual segmentation for measuring ven-tricular volumes, three contiguous slices were averaged. Inaddition, time-resolved 4D flow CMR magnitude imageswere reformatted into the left-ventricular short-axis (SA)orientation using home-built MatLab software, for a sec-ond, more convenient LV segmentation.
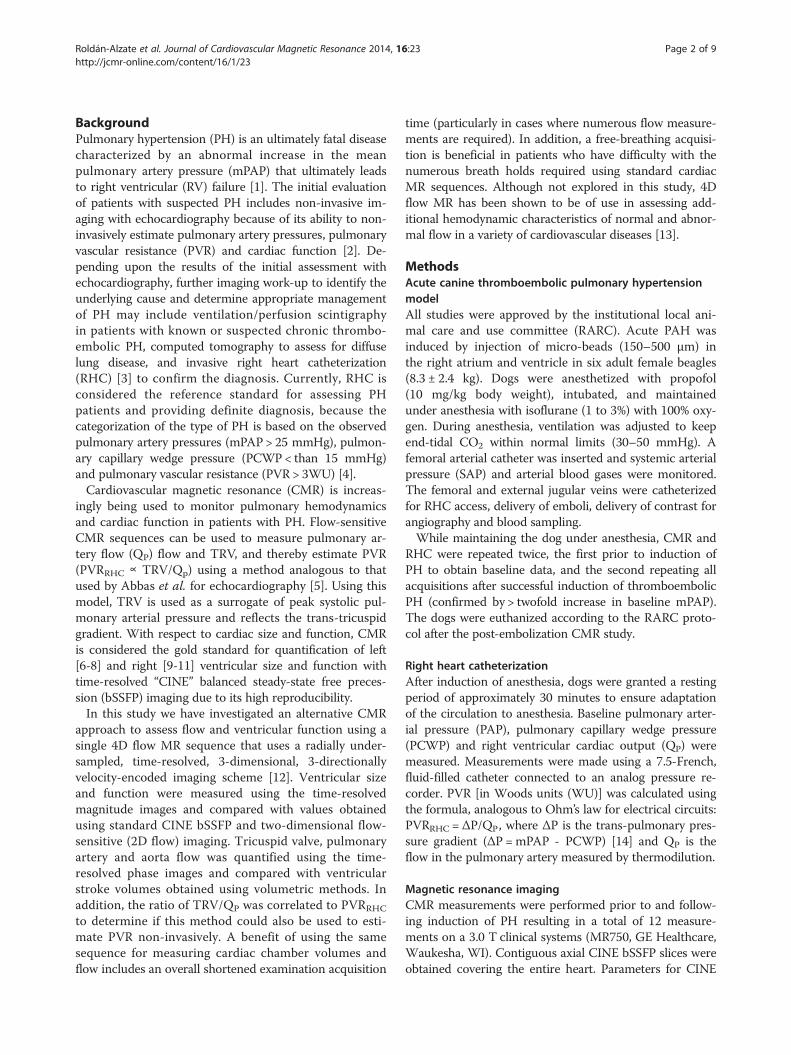
CMR analysisRV and LV functionRV and LV end-diastolic (EDV) and end-systolic (ESV)volumes were determined from manually segmentedcontours of end-diastolic and end-systolic bSSFP and 4Dflow CMR images (Figure 1), respectively. Segmentationof bSSFP images was accomplished using ReportCard(GE Healthcare, Waukesha, WI). Segmentation of 4Dflow CMR images was conducted using Osirix (Pixmeo,
Geneva, Switzerland). Stroke volume (SV = EDV-ESV)and ejection fraction (EF = SV/EDV) were also determinedfor both bSSFP and 4D flow CMR.
Flow quantificationAnalysis of the 2D flow CMR data was performed withCV flow (Medis, Leiden, the Netherlands). The MPA,RPA, and LPA were manually segmented at each phaseof the cardiac cycle. Net flow per heart beat was re-corded for each location. Average velocity was recordedfor the MPA only. PVR was estimated from 2D flow and2D CINE bSSFP data using the following equationPVRCMR (WU) = 19.38 – [4.62 · lnPA average velocity] –[0.08 · RVEF] [17].Quantitative flow analysis of the 4D flow CMR data-
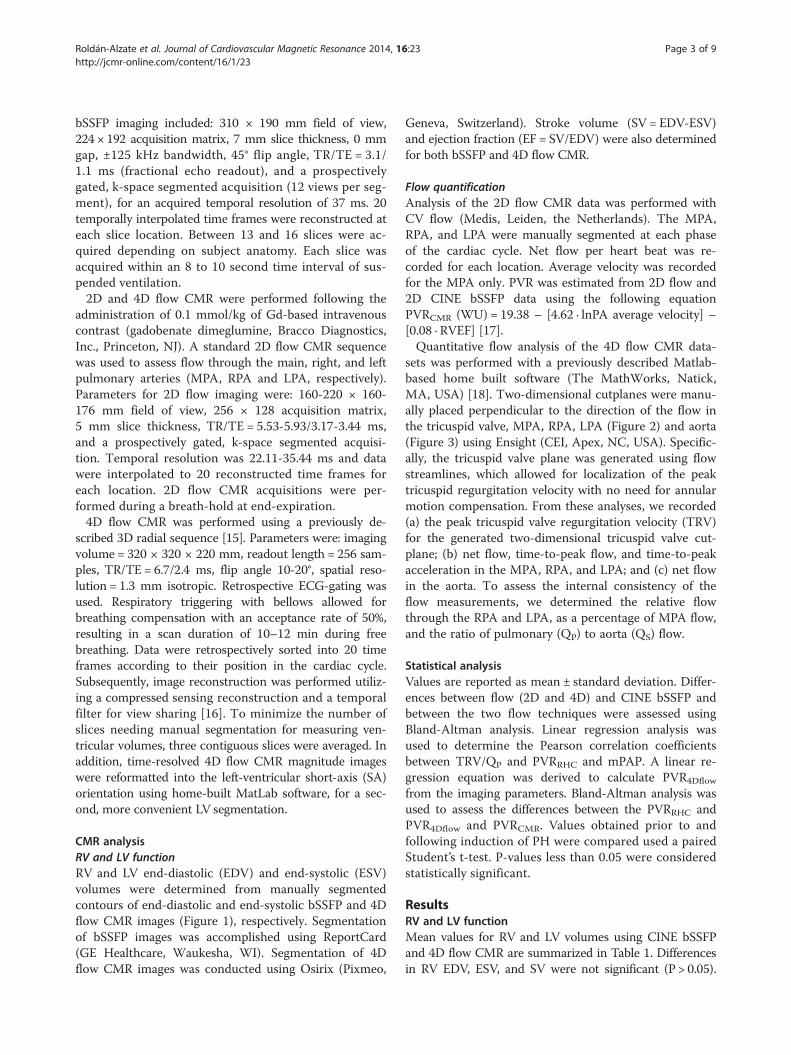
sets was performed with a previously described Matlab-based home built software (The MathWorks, Natick,MA, USA) [18]. Two-dimensional cutplanes were manu-ally placed perpendicular to the direction of the flow inthe tricuspid valve, MPA, RPA, LPA (Figure 2) and aorta(Figure 3) using Ensight (CEI, Apex, NC, USA). Specific-ally, the tricuspid valve plane was generated using flowstreamlines, which allowed for localization of the peaktricuspid regurgitation velocity with no need for annularmotion compensation. From these analyses, we recorded(a) the peak tricuspid valve regurgitation velocity (TRV)for the generated two-dimensional tricuspid valve cut-plane; (b) net flow, time-to-peak flow, and time-to-peakacceleration in the MPA, RPA, and LPA; and (c) net flowin the aorta. To assess the internal consistency of theflow measurements, we determined the relative flowthrough the RPA and LPA, as a percentage of MPA flow,and the ratio of pulmonary (QP) to aorta (QS) flow.
Statistical analysisValues are reported as mean ± standard deviation. Differ-ences between flow (2D and 4D) and CINE bSSFP andbetween the two flow techniques were assessed usingBland-Altman analysis. Linear regression analysis wasused to determine the Pearson correlation coefficientsbetween TRV/QP and PVRRHC and mPAP. A linear re-gression equation was derived to calculate PVR4Dflow
from the imaging parameters. Bland-Altman analysis wasused to assess the differences between the PVRRHC andPVR4Dflow and PVRCMR. Values obtained prior to andfollowing induction of PH were compared used a pairedStudent’s t-test. P-values less than 0.05 were consideredstatistically significant.
ResultsRV and LV functionMean values for RV and LV volumes using CINE bSSFPand 4D flow CMR are summarized in Table 1. Differencesin RV EDV, ESV, and SV were not significant (P > 0.05).
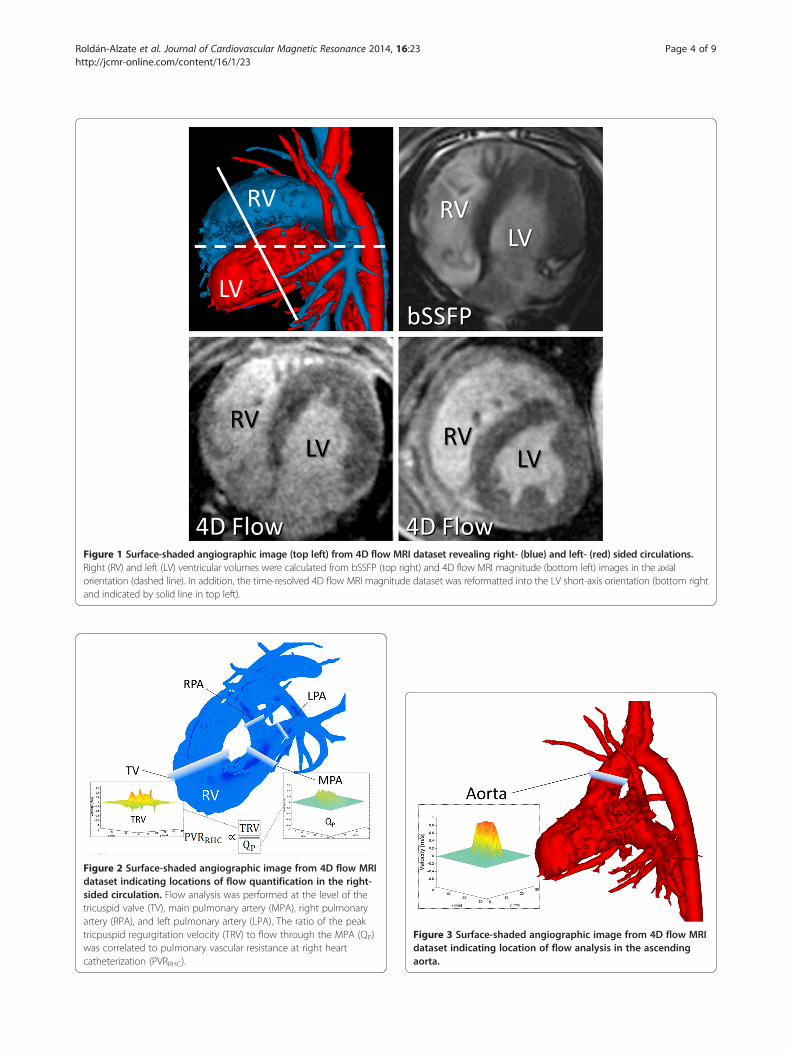
Figure 1 Surface-shaded angiographic image (top left) from 4D flow MRI dataset revealing right- (blue) and left- (red) sided circulations.Right (RV) and left (LV) ventricular volumes were calculated from bSSFP (top right) and 4D flow MRI magnitude (bottom left) images in the axialorientation (dashed line). In addition, the time-resolved 4D flow MRI magnitude dataset was reformatted into the LV short-axis orientation (bottom rightand indicated by solid line in top left).
Figure 2 Surface-shaded angiographic image from 4D flow MRIdataset indicating locations of flow quantification in the right-sided circulation. Flow analysis was performed at the level of thetricuspid valve (TV), main pulmonary artery (MPA), right pulmonaryartery (RPA), and left pulmonary artery (LPA). The ratio of the peaktricpuspid regurgitation velocity (TRV) to flow through the MPA (QP)was correlated to pulmonary vascular resistance at right heartcatheterization (PVRRHC).
Figure 3 Surface-shaded angiographic image from 4D flow MRIdataset indicating location of flow analysis in the ascendingaorta.
Roldán-Alzate et al. Journal of Cardiovascular Magnetic Resonance 2014, 16:23 Page 4 of 9http://jcmr-online.com/content/16/1/23
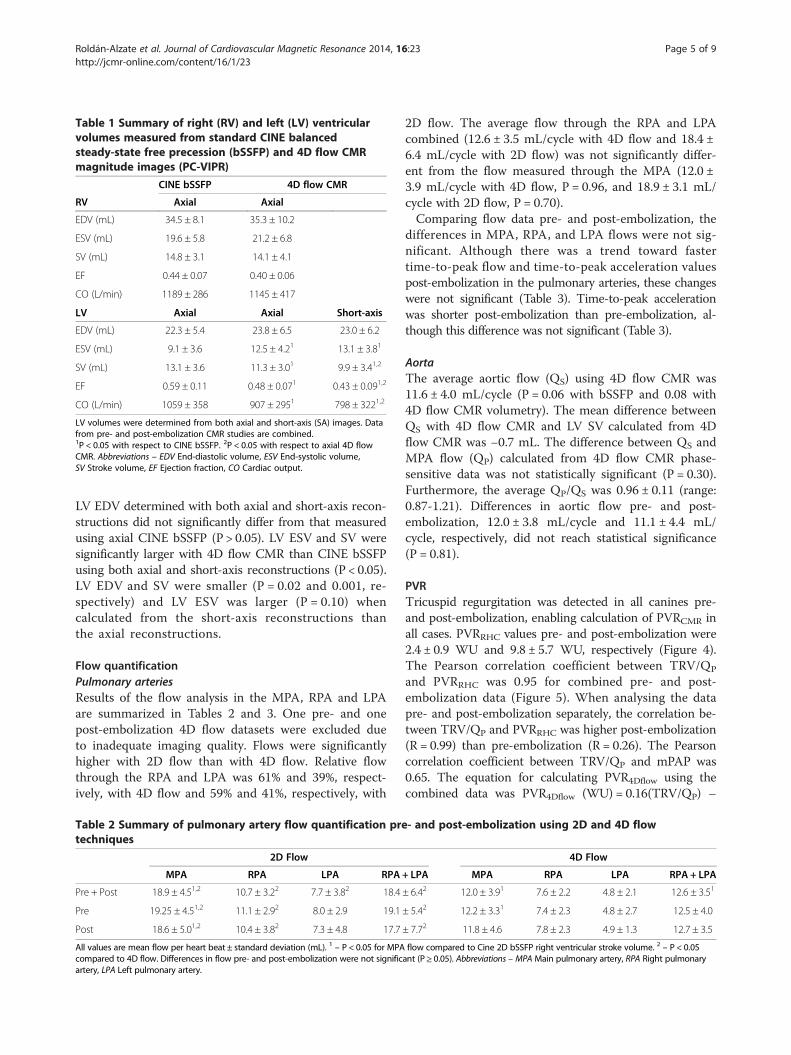
Table 1 Summary of right (RV) and left (LV) ventricularvolumes measured from standard CINE balancedsteady-state free precession (bSSFP) and 4D flow CMRmagnitude images (PC-VIPR)
CINE bSSFP 4D flow CMR
RV Axial Axial
EDV (mL) 34.5 ± 8.1 35.3 ± 10.2
ESV (mL) 19.6 ± 5.8 21.2 ± 6.8
SV (mL) 14.8 ± 3.1 14.1 ± 4.1
EF 0.44 ± 0.07 0.40 ± 0.06
CO (L/min) 1189 ± 286 1145 ± 417
LV Axial Axial Short-axis
EDV (mL) 22.3 ± 5.4 23.8 ± 6.5 23.0 ± 6.2
ESV (mL) 9.1 ± 3.6 12.5 ± 4.21 13.1 ± 3.81
SV (mL) 13.1 ± 3.6 11.3 ± 3.01 9.9 ± 3.41,2
EF 0.59 ± 0.11 0.48 ± 0.071 0.43 ± 0.091,2
CO (L/min) 1059 ± 358 907 ± 2951 798 ± 3221,2
LV volumes were determined from both axial and short-axis (SA) images. Datafrom pre- and post-embolization CMR studies are combined.1P < 0.05 with respect to CINE bSSFP. 2P < 0.05 with respect to axial 4D flowCMR. Abbreviations – EDV End-diastolic volume, ESV End-systolic volume,SV Stroke volume, EF Ejection fraction, CO Cardiac output.
Roldán-Alzate et al. Journal of Cardiovascular Magnetic Resonance 2014, 16:23 Page 5 of 9http://jcmr-online.com/content/16/1/23
LV EDV determined with both axial and short-axis recon-structions did not significantly differ from that measuredusing axial CINE bSSFP (P > 0.05). LV ESV and SV weresignificantly larger with 4D flow CMR than CINE bSSFPusing both axial and short-axis reconstructions (P < 0.05).LV EDV and SV were smaller (P = 0.02 and 0.001, re-spectively) and LV ESV was larger (P = 0.10) whencalculated from the short-axis reconstructions thanthe axial reconstructions.
Flow quantificationPulmonary arteriesResults of the flow analysis in the MPA, RPA and LPAare summarized in Tables 2 and 3. One pre- and onepost-embolization 4D flow datasets were excluded dueto inadequate imaging quality. Flows were significantlyhigher with 2D flow than with 4D flow. Relative flowthrough the RPA and LPA was 61% and 39%, respect-ively, with 4D flow and 59% and 41%, respectively, with
Table 2 Summary of pulmonary artery flow quantification pretechniques
2D Flow
MPA RPA LPA RPA
Pre + Post 18.9 ± 4.51,2 10.7 ± 3.22 7.7 ± 3.82 18.4
Pre 19.25 ± 4.51,2 11.1 ± 2.92 8.0 ± 2.9 19.1
Post 18.6 ± 5.01,2 10.4 ± 3.82 7.3 ± 4.8 17.7
All values are mean flow per heart beat ± standard deviation (mL). 1 – P < 0.05 for MPAcompared to 4D flow. Differences in flow pre- and post-embolization were not significartery, LPA Left pulmonary artery.
2D flow. The average flow through the RPA and LPAcombined (12.6 ± 3.5 mL/cycle with 4D flow and 18.4 ±6.4 mL/cycle with 2D flow) was not significantly differ-ent from the flow measured through the MPA (12.0 ±3.9 mL/cycle with 4D flow, P = 0.96, and 18.9 ± 3.1 mL/cycle with 2D flow, P = 0.70).Comparing flow data pre- and post-embolization, the
differences in MPA, RPA, and LPA flows were not sig-nificant. Although there was a trend toward fastertime-to-peak flow and time-to-peak acceleration valuespost-embolization in the pulmonary arteries, these changeswere not significant (Table 3). Time-to-peak accelerationwas shorter post-embolization than pre-embolization, al-though this difference was not significant (Table 3).
AortaThe average aortic flow (QS) using 4D flow CMR was11.6 ± 4.0 mL/cycle (P = 0.06 with bSSFP and 0.08 with4D flow CMR volumetry). The mean difference betweenQS with 4D flow CMR and LV SV calculated from 4Dflow CMR was −0.7 mL. The difference between QS andMPA flow (QP) calculated from 4D flow CMR phase-sensitive data was not statistically significant (P = 0.30).Furthermore, the average QP/QS was 0.96 ± 0.11 (range:0.87-1.21). Differences in aortic flow pre- and post-embolization, 12.0 ± 3.8 mL/cycle and 11.1 ± 4.4 mL/cycle, respectively, did not reach statistical significance(P = 0.81).
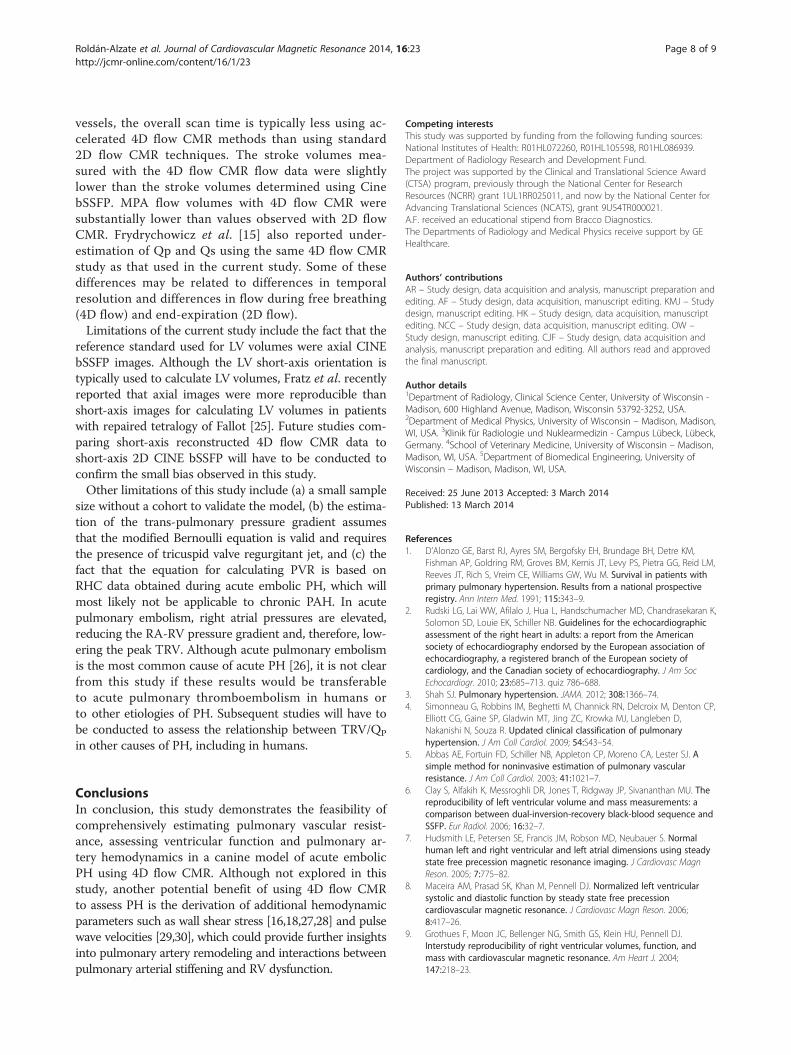
PVRTricuspid regurgitation was detected in all canines pre-and post-embolization, enabling calculation of PVRCMR inall cases. PVRRHC values pre- and post-embolization were2.4 ± 0.9 WU and 9.8 ± 5.7 WU, respectively (Figure 4).The Pearson correlation coefficient between TRV/QP
and PVRRHC was 0.95 for combined pre- and post-embolization data (Figure 5). When analysing the datapre- and post-embolization separately, the correlation be-tween TRV/QP and PVRRHC was higher post-embolization(R = 0.99) than pre-embolization (R = 0.26). The Pearsoncorrelation coefficient between TRV/QP and mPAP was0.65. The equation for calculating PVR4Dflow using thecombined data was PVR4Dflow (WU) = 0.16(TRV/QP) –
- and post-embolization using 2D and 4D flow
4D Flow
+ LPA MPA RPA LPA RPA + LPA
± 6.42 12.0 ± 3.91 7.6 ± 2.2 4.8 ± 2.1 12.6 ± 3.51
± 5.42 12.2 ± 3.31 7.4 ± 2.3 4.8 ± 2.7 12.5 ± 4.0
± 7.72 11.8 ± 4.6 7.8 ± 2.3 4.9 ± 1.3 12.7 ± 3.5
flow compared to Cine 2D bSSFP right ventricular stroke volume. 2 – P < 0.05ant (P≥ 0.05). Abbreviations – MPA Main pulmonary artery, RPA Right pulmonary
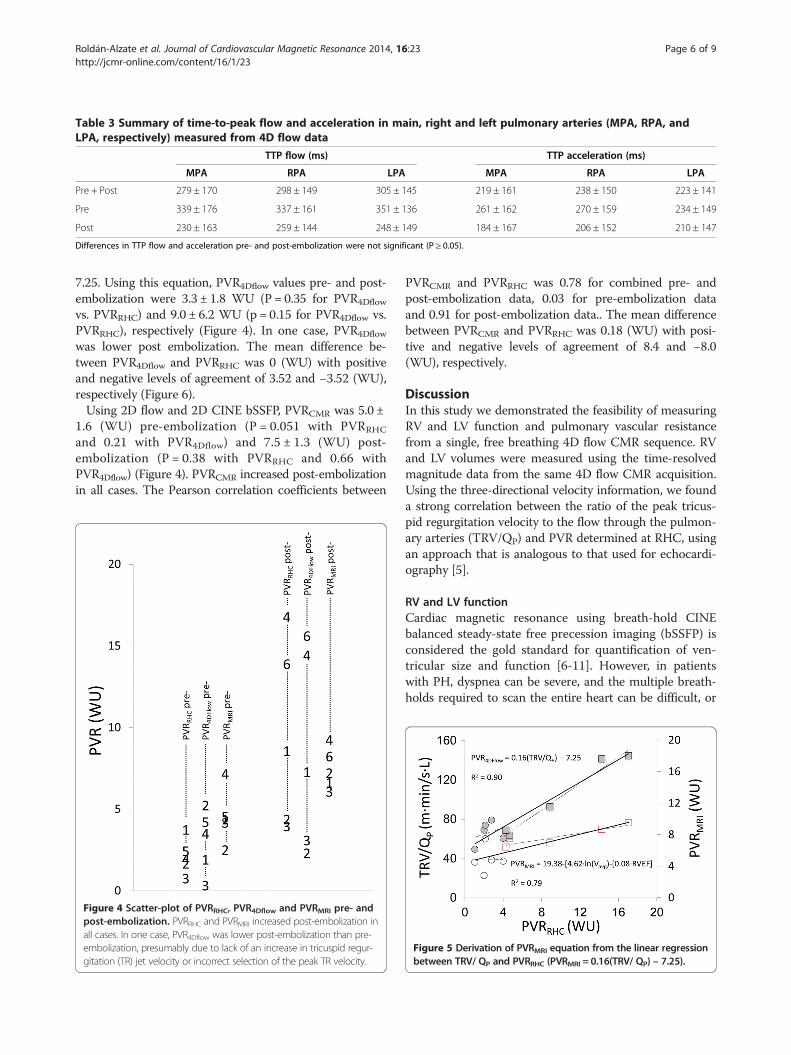
Table 3 Summary of time-to-peak flow and acceleration in main, right and left pulmonary arteries (MPA, RPA, andLPA, respectively) measured from 4D flow data
TTP flow (ms) TTP acceleration (ms)
MPA RPA LPA MPA RPA LPA
Pre + Post 279 ± 170 298 ± 149 305 ± 145 219 ± 161 238 ± 150 223 ± 141
Pre 339 ± 176 337 ± 161 351 ± 136 261 ± 162 270 ± 159 234 ± 149
Post 230 ± 163 259 ± 144 248 ± 149 184 ± 167 206 ± 152 210 ± 147
Differences in TTP flow and acceleration pre- and post-embolization were not significant (P ≥ 0.05).
Roldán-Alzate et al. Journal of Cardiovascular Magnetic Resonance 2014, 16:23 Page 6 of 9http://jcmr-online.com/content/16/1/23
7.25. Using this equation, PVR4Dflow values pre- and post-embolization were 3.3 ± 1.8 WU (P = 0.35 for PVR4Dflow
vs. PVRRHC) and 9.0 ± 6.2 WU (p = 0.15 for PVR4Dflow vs.PVRRHC), respectively (Figure 4). In one case, PVR4Dflow
was lower post embolization. The mean difference be-tween PVR4Dflow and PVRRHC was 0 (WU) with positiveand negative levels of agreement of 3.52 and −3.52 (WU),respectively (Figure 6).Using 2D flow and 2D CINE bSSFP, PVRCMR was 5.0 ±
1.6 (WU) pre-embolization (P = 0.051 with PVRRHC
and 0.21 with PVR4Dflow) and 7.5 ± 1.3 (WU) post-embolization (P = 0.38 with PVRRHC and 0.66 withPVR4Dflow) (Figure 4). PVRCMR increased post-embolizationin all cases. The Pearson correlation coefficients between
Figure 4 Scatter-plot of PVRRHC, PVR4Dflow and PVRMRI pre- andpost-embolization. PVRRHC and PVRMRI increased post-embolization inall cases. In one case, PVR4Dflow was lower post-embolization than pre-embolization, presumably due to lack of an increase in tricuspid regur-gitation (TR) jet velocity or incorrect selection of the peak TR velocity.
PVRCMR and PVRRHC was 0.78 for combined pre- andpost-embolization data, 0.03 for pre-embolization dataand 0.91 for post-embolization data.. The mean differencebetween PVRCMR and PVRRHC was 0.18 (WU) with posi-tive and negative levels of agreement of 8.4 and −8.0(WU), respectively.
DiscussionIn this study we demonstrated the feasibility of measuringRV and LV function and pulmonary vascular resistancefrom a single, free breathing 4D flow CMR sequence. RVand LV volumes were measured using the time-resolvedmagnitude data from the same 4D flow CMR acquisition.Using the three-directional velocity information, we founda strong correlation between the ratio of the peak tricus-pid regurgitation velocity to the flow through the pulmon-ary arteries (TRV/QP) and PVR determined at RHC, usingan approach that is analogous to that used for echocardi-ography [5].
RV and LV functionCardiac magnetic resonance using breath-hold CINEbalanced steady-state free precession imaging (bSSFP) isconsidered the gold standard for quantification of ven-tricular size and function [6-11]. However, in patientswith PH, dyspnea can be severe, and the multiple breath-holds required to scan the entire heart can be difficult, or
Figure 5 Derivation of PVRMRI equation from the linear regressionbetween TRV/ QP and PVRRHC (PVRMRI = 0.16(TRV/ QP) – 7.25).
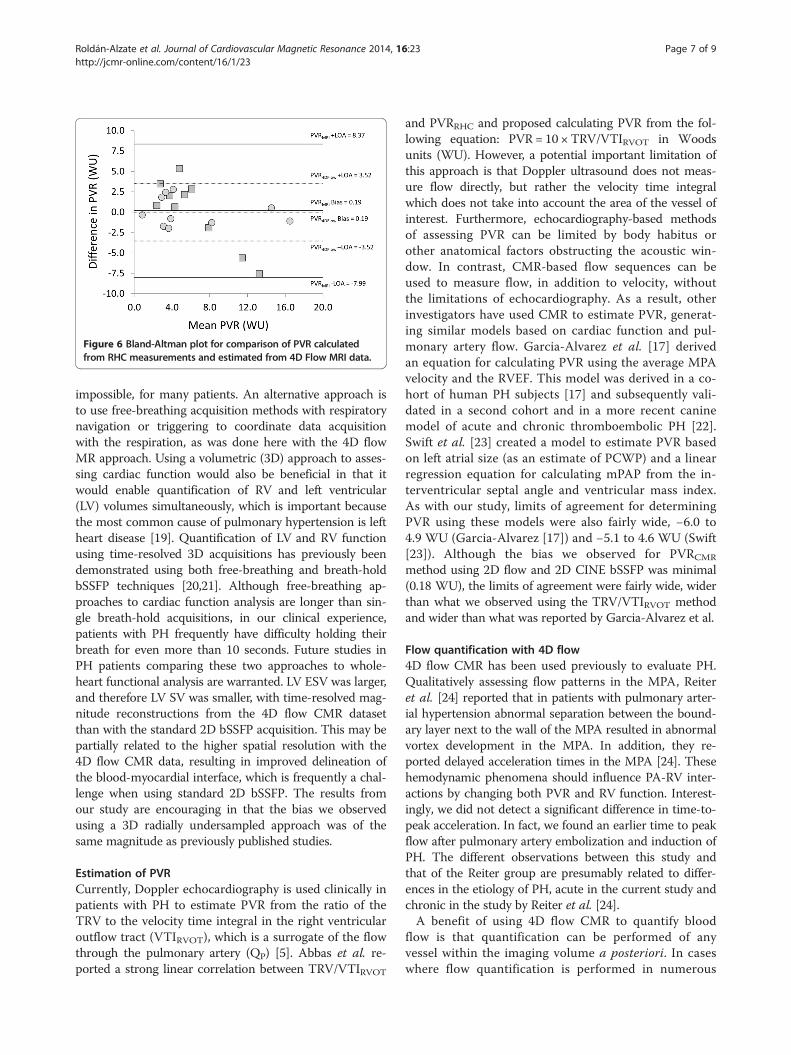
Figure 6 Bland-Altman plot for comparison of PVR calculatedfrom RHC measurements and estimated from 4D Flow MRI data.
Roldán-Alzate et al. Journal of Cardiovascular Magnetic Resonance 2014, 16:23 Page 7 of 9http://jcmr-online.com/content/16/1/23
impossible, for many patients. An alternative approach isto use free-breathing acquisition methods with respiratorynavigation or triggering to coordinate data acquisitionwith the respiration, as was done here with the 4D flowMR approach. Using a volumetric (3D) approach to asses-sing cardiac function would also be beneficial in that itwould enable quantification of RV and left ventricular(LV) volumes simultaneously, which is important becausethe most common cause of pulmonary hypertension is leftheart disease [19]. Quantification of LV and RV functionusing time-resolved 3D acquisitions has previously beendemonstrated using both free-breathing and breath-holdbSSFP techniques [20,21]. Although free-breathing ap-proaches to cardiac function analysis are longer than sin-gle breath-hold acquisitions, in our clinical experience,patients with PH frequently have difficulty holding theirbreath for even more than 10 seconds. Future studies inPH patients comparing these two approaches to whole-heart functional analysis are warranted. LV ESV was larger,and therefore LV SV was smaller, with time-resolved mag-nitude reconstructions from the 4D flow CMR datasetthan with the standard 2D bSSFP acquisition. This may bepartially related to the higher spatial resolution with the4D flow CMR data, resulting in improved delineation ofthe blood-myocardial interface, which is frequently a chal-lenge when using standard 2D bSSFP. The results fromour study are encouraging in that the bias we observedusing a 3D radially undersampled approach was of thesame magnitude as previously published studies.
Estimation of PVRCurrently, Doppler echocardiography is used clinically inpatients with PH to estimate PVR from the ratio of theTRV to the velocity time integral in the right ventricularoutflow tract (VTIRVOT), which is a surrogate of the flowthrough the pulmonary artery (QP) [5]. Abbas et al. re-ported a strong linear correlation between TRV/VTIRVOT
and PVRRHC and proposed calculating PVR from the fol-lowing equation: PVR = 10 × TRV/VTIRVOT in Woodsunits (WU). However, a potential important limitation ofthis approach is that Doppler ultrasound does not meas-ure flow directly, but rather the velocity time integralwhich does not take into account the area of the vessel ofinterest. Furthermore, echocardiography-based methodsof assessing PVR can be limited by body habitus orother anatomical factors obstructing the acoustic win-dow. In contrast, CMR-based flow sequences can beused to measure flow, in addition to velocity, withoutthe limitations of echocardiography. As a result, otherinvestigators have used CMR to estimate PVR, generat-ing similar models based on cardiac function and pul-monary artery flow. Garcia-Alvarez et al. [17] derivedan equation for calculating PVR using the average MPAvelocity and the RVEF. This model was derived in a co-hort of human PH subjects [17] and subsequently vali-dated in a second cohort and in a more recent caninemodel of acute and chronic thromboembolic PH [22].Swift et al. [23] created a model to estimate PVR basedon left atrial size (as an estimate of PCWP) and a linearregression equation for calculating mPAP from the in-terventricular septal angle and ventricular mass index.As with our study, limits of agreement for determiningPVR using these models were also fairly wide, −6.0 to4.9 WU (Garcia-Alvarez [17]) and −5.1 to 4.6 WU (Swift[23]). Although the bias we observed for PVRCMR
method using 2D flow and 2D CINE bSSFP was minimal(0.18 WU), the limits of agreement were fairly wide, widerthan what we observed using the TRV/VTIRVOT methodand wider than what was reported by Garcia-Alvarez et al.
Flow quantification with 4D flow4D flow CMR has been used previously to evaluate PH.Qualitatively assessing flow patterns in the MPA, Reiteret al. [24] reported that in patients with pulmonary arter-ial hypertension abnormal separation between the bound-ary layer next to the wall of the MPA resulted in abnormalvortex development in the MPA. In addition, they re-ported delayed acceleration times in the MPA [24]. Thesehemodynamic phenomena should influence PA-RV inter-actions by changing both PVR and RV function. Interest-ingly, we did not detect a significant difference in time-to-peak acceleration. In fact, we found an earlier time to peakflow after pulmonary artery embolization and induction ofPH. The different observations between this study andthat of the Reiter group are presumably related to differ-ences in the etiology of PH, acute in the current study andchronic in the study by Reiter et al. [24].A benefit of using 4D flow CMR to quantify blood
flow is that quantification can be performed of anyvessel within the imaging volume a posteriori. In caseswhere flow quantification is performed in numerous
Roldán-Alzate et al. Journal of Cardiovascular Magnetic Resonance 2014, 16:23 Page 8 of 9http://jcmr-online.com/content/16/1/23
vessels, the overall scan time is typically less using ac-celerated 4D flow CMR methods than using standard2D flow CMR techniques. The stroke volumes mea-sured with the 4D flow CMR flow data were slightlylower than the stroke volumes determined using CinebSSFP. MPA flow volumes with 4D flow CMR weresubstantially lower than values observed with 2D flowCMR. Frydrychowicz et al. [15] also reported under-estimation of Qp and Qs using the same 4D flow CMRstudy as that used in the current study. Some of thesedifferences may be related to differences in temporalresolution and differences in flow during free breathing(4D flow) and end-expiration (2D flow).Limitations of the current study include the fact that the
reference standard used for LV volumes were axial CINEbSSFP images. Although the LV short-axis orientation istypically used to calculate LV volumes, Fratz et al. recentlyreported that axial images were more reproducible thanshort-axis images for calculating LV volumes in patientswith repaired tetralogy of Fallot [25]. Future studies com-paring short-axis reconstructed 4D flow CMR data toshort-axis 2D CINE bSSFP will have to be conducted toconfirm the small bias observed in this study.Other limitations of this study include (a) a small sample
size without a cohort to validate the model, (b) the estima-tion of the trans-pulmonary pressure gradient assumesthat the modified Bernoulli equation is valid and requiresthe presence of tricuspid valve regurgitant jet, and (c) thefact that the equation for calculating PVR is based onRHC data obtained during acute embolic PH, which willmost likely not be applicable to chronic PAH. In acutepulmonary embolism, right atrial pressures are elevated,reducing the RA-RV pressure gradient and, therefore, low-ering the peak TRV. Although acute pulmonary embolismis the most common cause of acute PH [26], it is not clearfrom this study if these results would be transferableto acute pulmonary thromboembolism in humans orto other etiologies of PH. Subsequent studies will have tobe conducted to assess the relationship between TRV/QP
in other causes of PH, including in humans.
ConclusionsIn conclusion, this study demonstrates the feasibility ofcomprehensively estimating pulmonary vascular resist-ance, assessing ventricular function and pulmonary ar-tery hemodynamics in a canine model of acute embolicPH using 4D flow CMR. Although not explored in thisstudy, another potential benefit of using 4D flow CMRto assess PH is the derivation of additional hemodynamicparameters such as wall shear stress [16,18,27,28] and pulsewave velocities [29,30], which could provide further insightsinto pulmonary artery remodeling and interactions betweenpulmonary arterial stiffening and RV dysfunction.
Competing interestsThis study was supported by funding from the following funding sources:National Institutes of Health: R01HL072260, R01HL105598, R01HL086939.Department of Radiology Research and Development Fund.The project was supported by the Clinical and Translational Science Award(CTSA) program, previously through the National Center for ResearchResources (NCRR) grant 1UL1RR025011, and now by the National Center forAdvancing Translational Sciences (NCATS), grant 9U54TR000021.A.F. received an educational stipend from Bracco Diagnostics.The Departments of Radiology and Medical Physics receive support by GEHealthcare.
Authors’ contributionsAR – Study design, data acquisition and analysis, manuscript preparation andediting. AF – Study design, data acquisition, manuscript editing. KMJ – Studydesign, manuscript editing. HK – Study design, data acquisition, manuscriptediting. NCC – Study design, data acquisition, manuscript editing. OW –Study design, manuscript editing. CJF – Study design, data acquisition andanalysis, manuscript preparation and editing. All authors read and approvedthe final manuscript.
Author details1Department of Radiology, Clinical Science Center, University of Wisconsin -Madison, 600 Highland Avenue, Madison, Wisconsin 53792-3252, USA.2Department of Medical Physics, University of Wisconsin – Madison, Madison,WI, USA. 3Klinik für Radiologie und Nuklearmedizin - Campus Lübeck, Lübeck,Germany. 4School of Veterinary Medicine, University of Wisconsin – Madison,Madison, WI, USA. 5Department of Biomedical Engineering, University ofWisconsin – Madison, Madison, WI, USA.
Received: 25 June 2013 Accepted: 3 March 2014Published: 13 March 2014
References1. D’Alonzo GE, Barst RJ, Ayres SM, Bergofsky EH, Brundage BH, Detre KM,
Fishman AP, Goldring RM, Groves BM, Kernis JT, Levy PS, Pietra GG, Reid LM,Reeves JT, Rich S, Vreim CE, Williams GW, Wu M. Survival in patients withprimary pulmonary hypertension. Results from a national prospectiveregistry. Ann Intern Med. 1991; 115:343–9.
2. Rudski LG, Lai WW, Afilalo J, Hua L, Handschumacher MD, Chandrasekaran K,Solomon SD, Louie EK, Schiller NB. Guidelines for the echocardiographicassessment of the right heart in adults: a report from the Americansociety of echocardiography endorsed by the European association ofechocardiography, a registered branch of the European society ofcardiology, and the Canadian society of echocardiography. J Am SocEchocardiogr. 2010; 23:685–713. quiz 786–688.
3. Shah SJ. Pulmonary hypertension. JAMA. 2012; 308:1366–74.4. Simonneau G, Robbins IM, Beghetti M, Channick RN, Delcroix M, Denton CP,
Elliott CG, Gaine SP, Gladwin MT, Jing ZC, Krowka MJ, Langleben D,Nakanishi N, Souza R. Updated clinical classification of pulmonaryhypertension. J Am Coll Cardiol. 2009; 54:S43–54.
5. Abbas AE, Fortuin FD, Schiller NB, Appleton CP, Moreno CA, Lester SJ. Asimple method for noninvasive estimation of pulmonary vascularresistance. J Am Coll Cardiol. 2003; 41:1021–7.
6. Clay S, Alfakih K, Messroghli DR, Jones T, Ridgway JP, Sivananthan MU. Thereproducibility of left ventricular volume and mass measurements: acomparison between dual-inversion-recovery black-blood sequence andSSFP. Eur Radiol. 2006; 16:32–7.
7. Hudsmith LE, Petersen SE, Francis JM, Robson MD, Neubauer S. Normalhuman left and right ventricular and left atrial dimensions using steadystate free precession magnetic resonance imaging. J Cardiovasc MagnReson. 2005; 7:775–82.
8. Maceira AM, Prasad SK, Khan M, Pennell DJ. Normalized left ventricularsystolic and diastolic function by steady state free precessioncardiovascular magnetic resonance. J Cardiovasc Magn Reson. 2006;8:417–26.
9. Grothues F, Moon JC, Bellenger NG, Smith GS, Klein HU, Pennell DJ.Interstudy reproducibility of right ventricular volumes, function, andmass with cardiovascular magnetic resonance. Am Heart J. 2004;147:218–23.
Roldán-Alzate et al. Journal of Cardiovascular Magnetic Resonance 2014, 16:23 Page 9 of 9http://jcmr-online.com/content/16/1/23
10. Catalano O, Antonaci S, Opasich C, Moro G, Mussida M, Perotti M,Calsamiglia G, Frascaroli M, Baldi M, Cobelli F. Intra-observer andinterobserver reproducibility of right ventricle volumes, function andmass by cardiac magnetic resonance. J Cardiovasc Med (Hagerstown).2007; 8:807–14.
11. Maceira AM, Prasad SK, Khan M, Pennell DJ. Reference right ventricularsystolic and diastolic function normalized to age, gender and bodysurface area from steady-state free precession cardiovascular magneticresonance. Eur Heart J. 2006; 27:2879–88.
12. Gu T, Korosec FR, Block WF, Fain SB, Turk Q, Lum D, Zhou Y, Grist TM,Haughton V, Mistretta CA. PC VIPR: a high-speed 3D phase-contrastmethod for flow quantification and high-resolution angiography.AJNR Am J Neuroradiol. 2005; 26:743–9.
13. Markl M, Frydrychowicz A, Kozerke S, Hope M, Wieben O. 4D flow MRI.J Magn Reson Imaging. 2012; 36:1015–36.
14. Wood P. Pulmonary hypertension. Br Med Bull. 1952; 8:348–53.15. Frydrychowicz A, Wieben O, Niespodzany E, Reeder SB, Johnson KM,
Francois CJ. Quantification of thoracic blood flow using volumetricmagnetic resonance imaging with radial velocity encoding: in vivovalidation. Invest Radiol. 2013; 48:819–25.
16. Liu J, Wieben O, Jung Y, Samsonov AA, Reeder SB, Block WF. Singlebreathhold cardiac CINE imaging with multi-echo three-dimensionalhybrid radial SSFP acquisition. J Magn Reson Imaging. 2010; 32:434–40.
17. Garcia-Alvarez A, Fernandez-Friera L, Mirelis JG, Sawit S, Nair A, Kallman J,Fuster V, Sanz J. Non-invasive estimation of pulmonary vascular resistancewith cardiac magnetic resonance. Eur Heart J. 2011; 32:2438–45.
18. Stalder AF, Russe MF, Frydrychowicz A, Bock J, Hennig J, Markl M.Quantitative 2D and 3D phase contrast MRI: optimized analysis of bloodflow and vessel wall parameters. Magn Reson Med. 2008; 60:1218–31.
19. Oudiz RJ. Pulmonary hypertension associated with left-sided heartdisease. Clin Chest Med. 2007; 28:233–41.
20. Greil GF, Boettger T, Germann S, Klumpp B, Baltes C, Kozerke S, Bialkowski A,Urschitz MS, Miller S, Wolf I, Meinzer HP, Sieverding L. Quantitativeassessment of ventricular function using three-dimensional SSFP magneticresonance angiography. J Magn Reson Imaging. 2007; 26:288–95.
21. Peters DC, Korosec FR, Grist TM, Block WF, Holden JE, Vigen KK, Mistretta CA.Undersampled projection reconstruction applied to MR angiography.Magn Reson Med. 2000; 43:91–101.
22. Garcia-Alvarez A, Fernandez-Friera L, Garcia-Ruiz JM, Nuno-Ayala M, PeredaD, Fernandez-Jimenez R, Guzman G, Sanchez-Quintana D, Alberich-Bayarri A,Pastor-Escuredo D, Sanz-Rosa D, Garcia-Preito J, Gonzalez-Mirelis JG, PizarroG, Jimenez-Borreguero LJ, Fuster V, Sanz J, Ibanez B. Noninvasive monitoringof serial changes in pulmonary vascular resistance and acute vasodilatortesting using cardiac magnetic resonance. J Am Coll Cardiol. 2013;62:1621–31.
23. Swift AJ, Rajaram S, Hurdman J, Hill C, Davies C, Sproson TW, Morton AC,Capener D, Elliot C, Condliffe R, Wild JM, Kiely DG. Noninvasive estimationof PA pressure, flow, and resistance with CMR imaging: derivation andprospective validation study from the ASPIRE registry. JACC CardiovascImaging. 2013; 6:1036–47.
24. Reiter G, Reiter U, Kovacs G, Kainz B, Schmidt K, Maier R, Olschewski H,Rienmueller R. Magnetic resonance-derived 3-dimensional blood flowpatterns in the main pulmonary artery as a marker of pulmonaryhypertension and a measure of elevated mean pulmonary arterialpressure. Circ Cardiovasc Imaging. 2008; 1:23–30.
25. Fratz S, Schuhbaeck A, Buchner C, Busch R, Meierhofer C, Martinoff S, Hess J,Stern H. Comparison of accuracy of axial slices versus short-axis slices formeasuring ventricular volumes by cardiac magnetic resonance in patientswith corrected tetralogy of fallot. Am J Cardiol. 2009; 103:1764–9.
26. Hui-li G. The management of acute pulmonary arterial hypertension.Cardiovasc Ther. 2011; 29:153–75.
27. Bieging ET, Frydrychowicz A, Wentland A, Landgraf BR, Johnson KM, WiebenO, Francois CJ. In vivo three-dimensional MR wall shear stress estimationin ascending aortic dilatation. J Magn Reson Imaging. 2011; 33:589–97.
28. Frydrychowicz A, Berger A, Russe MF, Stalder AF, Harloff A, Dittrich S,Hennig J, Langer M, Markl M. Time-resolved magnetic resonanceangiography and flow-sensitive 4-dimensional magnetic resonanceimaging at 3 Tesla for blood flow and wall shear stress analysis. J ThoracCardiovasc Surg. 2008; 136:400–7.
29. Markl M, Wallis W, Brendecke S, Simon J, Frydrychowicz A, Harloff A.Estimation of global aortic pulse wave velocity by flow-sensitive 4D MRI.Magn Reson Med. 2010; 63:1575–82.
30. Wentland AL, Wieben O, Francois CJ, Boncyk C, Munoz Del Rio A, JohnsonKM, Grist TM, Frydrychowicz A. Aortic pulse wave velocity measurementswith undersampled 4D flow-sensitive MRI: comparison with 2D andalgorithm determination. J Magn Reson Imaging. 2013; 37:853–9.
doi:10.1186/1532-429X-16-23Cite this article as: Roldán-Alzate et al.: Non-invasive assessment ofcardiac function and pulmonary vascular resistance in an canine modelof acute thromboembolic pulmonary hypertension using 4D flowcardiovascular magnetic resonance. Journal of Cardiovascular MagneticResonance 2014 16:23.
Submit your next manuscript to BioMed Centraland take full advantage of:
• Convenient online submission
• Thorough peer review
• No space constraints or color figure charges
• Immediate publication on acceptance
• Inclusion in PubMed, CAS, Scopus and Google Scholar
• Research which is freely available for redistribution
Submit your manuscript at www.biomedcentral.com/submit