Embed Size (px)
Citation preview

Dust and Noise Evaluation
Noise and Dust Monitoring:
Copar Quarry
Westerly,
Rhode Island
Prepared for Town of Westerly
45 Broad Street
Westerly, Rhode Island
Prepared by Vanasse Hangen Brustlin, Inc.
Providence, Rhode Island
November 2013
\\RI-DATA\projects\72552.00\reports\Final Noise and Dust Report\Report\Privileged and Confidential Dust and Noise Evaluation_112013.docx
i Table of Contents
Table of Contents
1 Noise Evaluation ............................................................................................................. 1
1.1 Noise Analysis Background ....................................................................................... 1 1.2 Town of Westerly Noise Standards ............................................................................ 3 1.3 Noise Evaluation Methodology .................................................................................. 4 1.4 Measured Sound Levels and Noise Analysis ............................................................. 4 1.5 Westerly Noise Ordinance Comparison ................................................................... 11 1.6 Noise Conclusion ..................................................................................................... 11
2 Dust Evaluation ............................................................................................................. 12
2.1 Equipment and Monitoring Locations ....................................................................... 13 2.2 Approach .................................................................................................................. 15 2.3 Background, Regulatory Standards and Applicability .............................................. 15
2.3.1 Ambient – PM10 .......................................................................................... 15
2.3.2 Occupational – Crystalline Silica and Nuisance Dust ................................. 18
2.3.3 Ambient Crystalline Silica and Wipe Samples ............................................ 20
2.3.4 Summary of Applicable Regulatory Criteria ................................................ 22 2.4 PM10 Monitoring Results – September 16 through September 25, 2013 ........................ 23
2.4.1 Highest 24-Hour PM10 Average ................................................................. 25
2.4.2 Copar Quarry Blast – September 18, 2013 at 1:05 p.m. ............................. 25
2.4.3 Nighttime PM10 Example ............................................................................ 30
2.4.4 Comparison of PM10 24-Hour Averages .................................................... 32 2.5 Total Dust Monitoring Results – September 25 through October 4, 2013 ............... 33
2.5.1 Highest 24-Hour Total Dust Average .......................................................... 34
2.5.2 Nighttime Total Dust Example ..................................................................... 34
2.5.3 Comparison of Total Dust 24-Hour Averages ............................................. 38 2.6 Crystalline Silica Analysis ........................................................................................ 38 2.7 Wipe Sample Analysis ............................................................................................. 40 2.8 Dust Evaluation Study Summary ............................................................................. 41
3 Conclusions .................................................................................................................... 42
\\RI-DATA\projects\72552.00\reports\Final Noise and Dust Report\Report\Privileged and Confidential Dust and Noise Evaluation_112013.docx
ii Table of Contents
List of Tables
Table No. Description Page
1-1 Common Outdoor and Indoor Sound Levels.................................................... 2
1-2 Town of Westerly Noise Standards, dB(A)....................................................... 3
1-3 34 Quarry Road: Maximum Sound Levels During Quarry Operations
(4:30 a.m. to 7:00 p.m.) .................................................................................... 6
1-4 65 Quarry Road: Maximum Sound Levels During Quarry Operations
(4:30 a.m. to 7:00 p.m.) .................................................................................... 7
1-5 34 Quarry Road: Maximum Nighttime Sound Levels During Quarry
Operations (4:30 a.m. to 8:00 a.m.) ................................................................. 8
1-6 65 Quarry Road : Maximum Nighttime Sound Levels During
Quarry Operations (4:30 a.m. to 8:00 a.m.) ..................................................... 9
2-1 24-Hour PM10 Averages................................................................................ 32
2-2 24-Hour Total Dust ......................................................................................... 38
2-3 Total and Respirable Dust Crystalloine Silica Analysis Results ..................... 39
2-4 Wipe Sampling Results .................................................................................. 40

\\RI-DATA\projects\72552.00\reports\Final Noise and Dust Report\Report\Privileged and Confidential Dust and Noise Evaluation_112013.docx
iii Table of Contents
List of Figures
Figure No. Description Page
1 Noise Receptor Locations and Possible Noise Reduction Measures .............. 5
2 Dust Monitoring and Sampling Locations – Westerly, Rhode Island ............. 14
3 PM10 – September 16 through September 25 .............................................. 24
4 Highest 24-hour Average ............................................................................... 26
5 Copar Dust Monitoring Station and Blast Face Locations .............................. 28
6 Blast Detail – 24-hour Average ...................................................................... 29
7 Nighttime Example – Wind Direction NNW – 24-hour Average ..................... 31
8 Total Dustfall – September 25 through October 4.......................................... 34
9 Highest 24-hour Average – Total Dust .......................................................... 36
10 Nighttime Example – Wind Direction N – 24-hour Average ........................... 37
List of Photographs
Photograph No. Description Page
1 Dust Study – Week 1 –
Blast Captured September 18, 2013 @ 1:05 p.m. ......................................... 27

\\RI-DATA\projects\72552.00\reports\Final Noise and Dust Report\Report\Privileged and Confidential Dust and Noise Evaluation_112013.docx
1 Noise Evaluation
1 Noise Evaluation
The purpose of this noise report is to evaluate the sound levels associated with the
operations of the Copar Quarry (Quarry). The quarry is located in Westerly, Rh ode
Island and is bordered by residences to the north, west and east. The Town of Westerly
has indicated that residences, located to the north and west, have expressed concern with
noise associated with the quarry, which is made up of truck noise and impact noise.
The noise assessment includes noise monitoring to determine existing sound levels
within the study area and recommends potential noise mitigation measures.
1.1 Noise Analysis Background
Noise is defined as unwanted or excessive sound . Sound becomes unwanted when it
interferes with normal activities such as sleep, work, or recreation. The ind ividual
human response to noise is subject to considerable variability since there are many
emotional and physical factors that contribute to the d ifferences in reaction to noise.
Sound (noise) is described in terms of loud ness, frequency, and duration. Loudness is
the sound pressure level measured on a logarithmic scale in units of decibels (dB).
For community noise impact assessment, sound level frequency characteristics are
based upon human hearing, using an A-weighted [dB(A)] frequency filter. The
A-weighted filter is used because it approximates the way humans hear sound .
Table 1-1 presents a list of common outd oor and indoor sound levels. The duration
characteristics of sound account for the time-varying nature of sound sources.

\\RI-DATA\projects\72552.00\reports\Final Noise and Dust Report\Report\Privileged and Confidential Dust and Noise Evaluation_112013.docx
2 Noise Evaluation
Table 1-1 Common Outdoor and Indoor Sound Levels
Outdoor Sound Levels
Sound
Pressure
Pa*
Sound
Level
dB(A)**
Indoor Sound Levels
6,324,555 - 110 Rock Band at 5 m
Jet Over-Flight at 300 m - 105
2,000,000 - 100 Inside New York Subway Train
Gas Lawn Mower at 1 m - 95
632,456 - 90 Food Blender at 1 m
Diesel Truck at 15 m - 85
Noisy Urban AreaDaytime 200,000 - 80 Garbage Disposal at 1 m
- 75 Shouting at 1 m
Gas Lawn Mower at 30 m 63,246 - 70 Vacuum Cleaner at 3 m
Suburban Commercial Area - 65 Normal Speech at 1 m
20,000 - 60
Quiet Urban AreaDaytime - 55 Quiet Conversation at 1 m
6,325 - 50 Dishwasher Next Room
Quiet Urban AreaNighttime - 45
2,000 - 40 Empty Theater or Library
Quiet SuburbNighttime - 35
632 - 30 Quiet Bedroom at Night
Quiet Rural AreaNighttime - 25 Empty Concert Hall
Rustling Leaves 200 - 20
- 15 Broadcast and Recording Studios
63 - 10
- 5
Reference Pressure Level 20 - 0 Threshold of Hearing
Source: Highway Noise Fundamentals. Federal Highway Administration, September 1980.
* PA – MicroPascals, which describe pressure. The pressure level is what sound level monitors measure.
** dB(A) – A-weighted decibels, which describe pressure logarithmically with respect to 20 Pa (the reference pressure level).
Sound level d ata can be presented in statistical terms to help describe the noise
environment. A near infinite variation in sound levels (various intensities and
temporal patterns) can be combined into the same value. The following is a list of
sound level descriptors:
Leq is the A-weighted sound level, which averages the background sound
levels with short-term transient sound levels and provides a uniform method
for comparing sound levels that vary over time.
Lmax is the maximum A-weighted sound level measured during the time
period and ,
L90 is the A-weighted sound level that is exceeded for 90 percent of the time
during the time period . The L90 is generally considered to be the background

\\RI-DATA\projects\72552.00\reports\Final Noise and Dust Report\Report\Privileged and Confidential Dust and Noise Evaluation_112013.docx
3 Noise Evaluation
sound level since the L90 d oes not include transient noise events. During a
100-minute period , the L90 would be the sound level that was exceeded by
other sound levels for 90 minutes of the 100-minute period .
The following general relationships exist between noise levels and human
perception:
A 1 or 2 dB(A) increase is not perceptible to the average person.
A 3 dB(A) increase is a doubling of acoustic energy, bu t is just barely
perceptible to the human ear.
A 10 dB(A) increase is a tenfold increase in acoustic energy, but is perceived as a
doubling in loudness to the average person.
1.2 Town of Westerly Noise Standards
The Town of Westerly has developed noise standards that establish noise thresholds
deemed to result in adverse impacts. The noise analysis used these standards to evaluate
whether the quarry is generating sound levels that exceed the noise standards.
Under Chapter 171, Section 171-1 through 171-7 of the General Code/ Town
Ord inance for the Town of Westerly, RI , the Town has adopted regu lation for the
control of noise.1 These regu lations establish maximum allowable sound levels based
upon the land use of the site. Table 1-2 summarizes the noise standard for the various
land uses. These maximum allowable sound levels should not be exceeded during
the corresponding time period .
If a site is located in a resid ential zoning d istrict, the maximum noise level affecting
residential uses shall not exceed the Residential Noise Stand ard . The residential land
use noise stand ard is 65 dB(A) for daytime periods (8:00 a.m. to 10:00 p.m.) and
60 dB(A) for all other time periods (10:00 p.m. to 8:00 a.m.).
Table 1-2 Town of Westerly Noise Standards, dB(A)
Land Use Zone District
Daytime
(8:00 a.m. – 10:00 PM)
All Other Times
(10:00 p.m. – 8:00 a.m.)
Residential 65 60
Business/Professional 75 75
Manufacturing 70 60
Source: General Code/Town Ordinance Regulations for the Control of Noise in the in the Town of Westerly, RI (July, 2013)
1 Town of Westerly, RI, General Code (Town Ordinance)for the Town of Westerly, Chapter 171 Noise, Thursday, July 18, 2013.

\\RI-DATA\projects\72552.00\reports\Final Noise and Dust Report\Report\Privileged and Confidential Dust and Noise Evaluation_112013.docx
4 Noise Evaluation
1.3 Noise Evaluation Methodology
Noise monitoring data was collected at two locations, 65 and 34 Quarry Road ,
Westerly, RI (Locations 1 and 2, respectively, on Figure 1), over a continuous one
week period . The noise evaluation used the noise monitoring data to identify the
highest sound levels on a d aily basis from 4:30 a.m. to 7:00 p.m., which includes all
operational hours of the quarry. These sound levels were then grouped into 5 dB(A)
increments. Audio files recorded for the highest sounds levels were used to identify
noise sources, both quarry and non-quarry, as best as possible.
The results of the noise monitoring programs were compared to the Town of Westerly’s
noise standards to determine if the quarry is in compliance with the regulations. If the
operation of the quarry exceeds the Town of Westerly’s noise standards, noise mitigation
is proposed to reduce the sound levels associated with the quarry.
1.4 Measured Sound Levels and
Noise Analysis
A noise monitoring program was conducted for a continuous one week period
beginning from 3:38 p.m. on Wednesd ay, August 14, 2013 and ending at 2:20 p.m. on
Thursd ay, August 22, 2013. The noise monitoring program followed the procedures
outlined by the American National Stand ards Institute’s Stand ard Methods (ANSI).
A Type 1 noise monitor (Larson Davis 831) was used to cond uct the measurements.
The noise monitors were located at 65 Quarry Road and 34 Quarry Road , as shown in
Figure 1 as Locations 1 and 2, respectively.
Data from the noise monitoring program was used to identify and group the highest
sound levels into 5 dB(A) increments on a d aily basis. Each sound occurrence was
identified as non-quarry, quarry, or unknown. Non-quarry sounds include natural
sounds, such as animals, birds and insects, and neighborhood sound s, such as local
vehicular traffic, motorcycles and airplanes (Naval Auxiliary Air Station,
Charlestown and Westerly State Airport). Quarry sounds were broken into two
categories, quarry truck sounds, which can be attributed to truck traffic specific to the
quarry, and quarry impact sounds, which in cludes any sounds attribu ted the
handling and processing of the materials extracted at the quarry. The unknown
category includes sounds that could not be identified based on the aud io record ing,
or instances for which no aud io record ing was available.
Tables 1-3 and 1-4 show the maximum sounds levels from 4:30 a.m. to 7:00 p.m.,
which includes all operational hours of the quarry, for 34 Quarry Road and
65 Quarry Road , respectively. Tables 1-5 and 1-6 show the maximum sound levels
from 4:30 a.m. to 8:00 a.m., which is considered the nighttime period accord ing to the
Town of Westerly Noise Ord inance.

Church Street
Quarry Road
Woody H i l l Road Extended
Niantic Highway
Peckham Hollow Road
¬«216
¬«216
Extend Earth Berm toReduce Noise Impact
!(1
!(2
Vanasse Hangen Brustlin, Inc.
Noise Receptor Locations andPossible Noise Reduction Measures
Westerly, Rhode IslandOctober 2013
Figure 1
\\ridata\PROJECTS\72552.00\GIS\Project\Noise_Receptors.mxd
Sensitive Receptor
0 200 400 Feet
N
!(#

\\RI-DATA\projects\72552.00\reports\Final Noise and Dust Report\Report\Privileged and Confidential Dust and Noise Evaluation_112013.docx
6 Noise Evaluation
Table 1-3 34 Quarry Road: Maximum Sound Levels During Quarry Operations
(4:30 a.m. to 7:00 p.m.)
Number of Incidents at High Sound Levels
Date of Measurements Sound Origin
Sound Level =
70+
(dB(A))
Sound Level =
65 to 70
(dB(A))
Sound Level =
60 to 65
(dB(A)) Subtotal
8/14/2013 Non-Quarry 1 0 0 1
Wednesday Quarry (Truck) 0 0 0 0
Quarry (Other) 0 0 0 0
Unknown 0 0 0 0
Total 1 0 0 1
8/15/2013 Non-Quarry 0 0 6 6
Thursday Quarry (Truck) 0 0 1 1
Quarry (Other) 0 0 0 0
Unknown 0 0 0 0
Total 0 0 7 7
8/16/2013 Non-Quarry 1 1 2 4
Friday Quarry (Truck) 0 0 0 0
Quarry (Other) 0 0 0 0
Unknown 0 0 1 1
Total 1 1 3 5
8/17/2013 Non-Quarry 0 1 5 6
Saturday Quarry (Truck) 0 0 1 1
Quarry (Other) 0 0 0 0
Unknown 0 0 0 0
Total 0 1 6 7
8/19/2013 Non-Quarry 2 2 1 5
Monday Quarry (Truck) 0 0 0 0
Quarry (Other) 0 0 1 1
Unknown 0 0 1 1
Total 2 2 3 7
8/20/2013 Non-Quarry 0 1 6 7
Tuesday Quarry (Truck) 0 0 1 1
Quarry (Other) 0 0 0 0
Unknown 0 0 3 3
Total 0 1 10 11
8/21/2013 Non-Quarry 0 1 1 2
Wednesday Quarry (Truck) 0 0 1 1
Quarry (Other) 0 0 0 0
Unknown 0 0 2 2
Total 0 1 4 5
8/22/2013 Non-Quarry 1 0 2 3
Thursday Quarry (Truck) 0 0 0 0
Quarry (Other) 0 0 0 0
Unknown 0 0 1 1
Total 1 0 3 4

\\RI-DATA\projects\72552.00\reports\Final Noise and Dust Report\Report\Privileged and Confidential Dust and Noise Evaluation_112013.docx
7 Noise Evaluation
Table 1-4 65 Quarry Road: Maximum Sound Levels During Quarry Operations
(4:30 a.m. to 7:00 p.m.)
Number of Incidents at High Sound Levels
Date of Measurements Sound Origin
Sound Level = 70+
(dB(A))
Sound Level = 65 to 70
(dB(A))
8/14/2013 Non-Quarry 1 1
Wednesday Quarry (Truck) 0 0
Quarry (Other) 0 0
Unknown 0 0
Total 1 1
8/15/2013 Non-Quarry 0 1
Thursday Quarry (Truck) 0 0
Quarry (Other) 0 0
Unknown 0 0
Total 0 1
8/16/2013 Non-Quarry 1 3
Friday Quarry (Truck) 0 1
Quarry (Other) 0 0
Unknown 0 1
Total 1 5
8/17/2013 Non-Quarry 1 2
Saturday Quarry (Truck) 0 0
Quarry (Other) 0 0
Unknown 0 0
Total 1 2
8/19/2013 Non-Quarry 2 3
Monday Quarry (Truck) 0 0
Quarry (Other) 0 0
Unknown 0 0
Total 2 3
8/20/2013 Non-Quarry 0 0
Tuesday Quarry (Truck) 0 0
Quarry (Other) 0 0
Unknown 0 0
Total 0 0
8/21/2013 Non-Quarry 0 1
Wednesday Quarry (Truck) 0 0
Quarry (Other) 0 0
Unknown 0 1
Total 0 2
8/22/2013 Non-Quarry 1 0
Thursday Quarry (Truck) 0 0
Quarry (Other) 0 0
Unknown 1 0
Total 2 0

\\RI-DATA\projects\72552.00\reports\Final Noise and Dust Report\Report\Privileged and Confidential Dust and Noise Evaluation_112013.docx
8 Noise Evaluation
Table 1-5 34 Quarry Road: Maximum Nighttime Sound Levels During Quarry Operations
(4:30 a.m. to 8:00 a.m.)
Number of Incidents at
High Sound Levels
Date of
Measurements Sound Origin
Sound
Level = 70+
(dB(A))
Sound
Level =
65 to 70
(dB(A))
Sound
Level =
60 to 65
(dB(A))
Sound
Level =
55 to 60
(dB(A))
Sound
Level =
50 to 55
(dB(A)) Subtotal
8/14/2013 Non-Quarry 0 0 0 0 0 0
Wednesday Quarry (Truck) 0 0 0 0 0 0
Quarry (Other) 0 0 0 0 0 0
Unknown 0 0 0 0 0 0
Total 0 0 0 0 0 0
8/15/2013 Non-Quarry 0 0 1 1 1 3
0Thursday Quarry (Truck) 0 0 0 0 0 0
Quarry (Other) 0 0 0 0 0 0
Unknown 0 0 0 0 1 1
Total 0 0 1 1 2 4
8/16/2013 Non-Quarry 0 0 0 0 0 0
Friday Quarry (Truck) 0 0 0 0 0 0
Quarry (Other) 0 0 0 0 0 0
Unknown 0 0 0 0 2 2
Total 0 0 0 0 0 2
8/17/2013 Non-Quarry 0 0 0 0 1 1
Saturday Quarry (Truck) 0 0 0 0 0 0
Quarry (Other) 0 0 0 0 0 0
Unknown 0 0 0 0 1 1
Total 0 0 0 0 2 2
8/19/2013 Non-Quarry 0 0 0 0 0 0
Monday Quarry (Truck) 0 0 0 0 0 0
Quarry (Other) 0 0 0 0 0 0
Unknown 0 0 0 1 4 5
Total 0 0 0 1 4 5
8/20/2013 Non-Quarry 0 0 1 1 2 4
Tuesday Quarry (Truck) 0 0 0 0 0 0
Quarry (Other) 0 0 0 0 0 0
Unknown 0 0 0 0 2 2
Total 0 0 1 1 2 6
8/21/2013 Non-Quarry 0 0 1 1 0 2
Wednesday Quarry (Truck) 0 0 0 0 0 0
Quarry (Other) 0 0 0 0 0 0
Unknown 0 0 0 0 3 3
Total 0 0 1 1 3 5
8/22/2013 Non-Quarry 0 0 0 2 1 3
Thursday Quarry (Truck) 0 0 0 0 0 0
Quarry (Other) 0 0 0 0 0 0
Unknown 0 0 0 0 1 1
Total 0 0 0 2 2 4
\\RI-DATA\projects\72552.00\reports\Final Noise and Dust Report\Report\Privileged and Confidential Dust and Noise Evaluation_112013.docx
9 Noise Evaluation
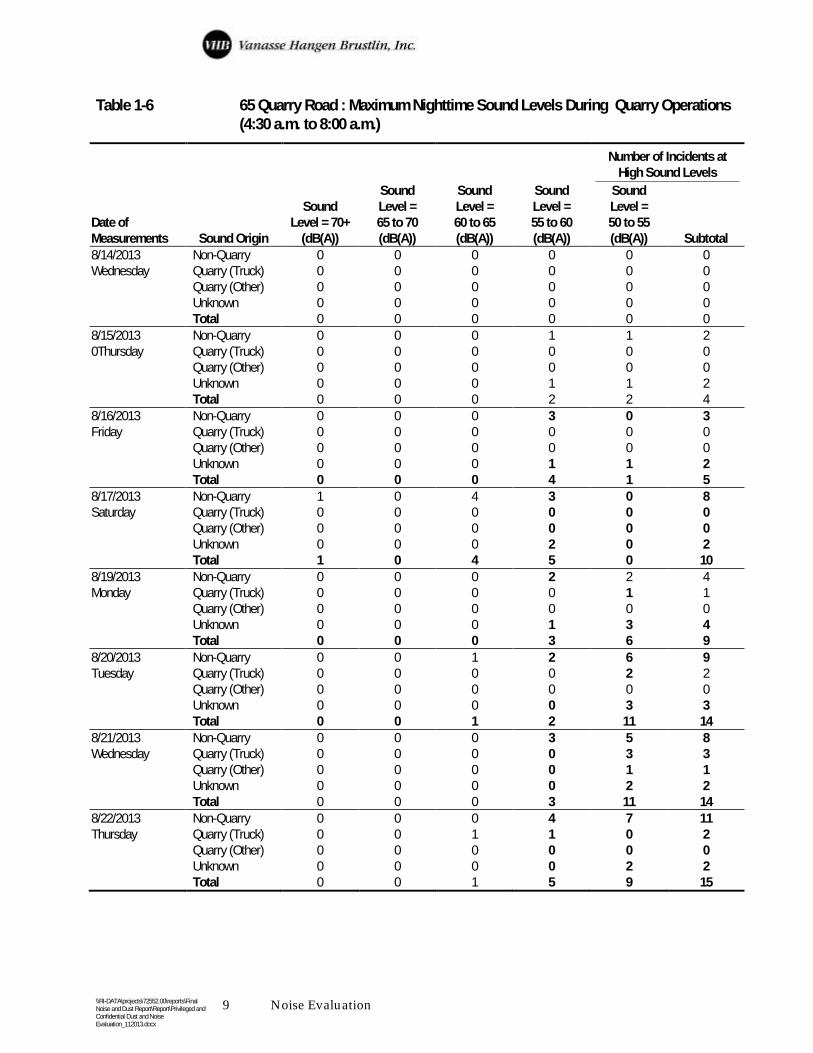
Table 1-6 65 Quarry Road : Maximum Nighttime Sound Levels During Quarry Operations
(4:30 a.m. to 8:00 a.m.)
Number of Incidents at
High Sound Levels
Date of
Measurements Sound Origin
Sound
Level = 70+
(dB(A))
Sound
Level =
65 to 70
(dB(A))
Sound
Level =
60 to 65
(dB(A))
Sound
Level =
55 to 60
(dB(A))
Sound
Level =
50 to 55
(dB(A)) Subtotal
8/14/2013 Non-Quarry 0 0 0 0 0 0
Wednesday Quarry (Truck) 0 0 0 0 0 0
Quarry (Other) 0 0 0 0 0 0
Unknown 0 0 0 0 0 0
Total 0 0 0 0 0 0
8/15/2013 Non-Quarry 0 0 0 1 1 2
0Thursday Quarry (Truck) 0 0 0 0 0 0
Quarry (Other) 0 0 0 0 0 0
Unknown 0 0 0 1 1 2
Total 0 0 0 2 2 4
8/16/2013 Non-Quarry 0 0 0 3 0 3
Friday Quarry (Truck) 0 0 0 0 0 0
Quarry (Other) 0 0 0 0 0 0
Unknown 0 0 0 1 1 2
Total 0 0 0 4 1 5
8/17/2013 Non-Quarry 1 0 4 3 0 8
Saturday Quarry (Truck) 0 0 0 0 0 0
Quarry (Other) 0 0 0 0 0 0
Unknown 0 0 0 2 0 2
Total 1 0 4 5 0 10
8/19/2013 Non-Quarry 0 0 0 2 2 4
Monday Quarry (Truck) 0 0 0 0 1 1
Quarry (Other) 0 0 0 0 0 0
Unknown 0 0 0 1 3 4
Total 0 0 0 3 6 9
8/20/2013 Non-Quarry 0 0 1 2 6 9
Tuesday Quarry (Truck) 0 0 0 0 2 2
Quarry (Other) 0 0 0 0 0 0
Unknown 0 0 0 0 3 3
Total 0 0 1 2 11 14
8/21/2013 Non-Quarry 0 0 0 3 5 8
Wednesday Quarry (Truck) 0 0 0 0 3 3
Quarry (Other) 0 0 0 0 1 1
Unknown 0 0 0 0 2 2
Total 0 0 0 3 11 14
8/22/2013 Non-Quarry 0 0 0 4 7 11
Thursday Quarry (Truck) 0 0 1 1 0 2
Quarry (Other) 0 0 0 0 0 0
Unknown 0 0 0 0 2 2
Total 0 0 1 5 9 15

\\RI-DATA\projects\72552.00\reports\Final Noise and Dust Report\Report\Privileged and Confidential Dust and Noise Evaluation_112013.docx
10 Noise Evaluation
Tables 1-3 and 1-4 show maximum sound levels from 4:30 a.m. to 7:00 p.m.. This time
period is made of both nighttime (4:30 a.m. to 8:00 a.m.) and daytime (8:00 a.m. to
7:00 p.m.) period s (accord ing to the Town standards). The Town designates d aytime
as 8:00 a.m. to 10:00 p.m. and nighttime as 10:00 p.m. to 8:00 a.m. periods. The Town
of Westerly Noise Stand ard s have maximum sound levels of 65 dB(A) during the
daytime and 60 dB(A) during the nighttime (Table 2). As shown in Tables 3 and 4,
the majority of noise sources were associated with non-quarry sounds; either
attributed to natural or neighborhood sounds. A total of nine sound occurrences can
be attribu ted to the quarry and are all within the 60 dB(A) to 65 dB(A) range. Eight
occurrences can be attribu ted to truck traffic specific to the quarry and one can be
attributed to the impact caused by the processing or handling of materials extracted
at the quarry. Of the eight occurrences attributed to truck traffic, four were record ed
at 34 Quarry Road with sounds levels over 60 dB(A) lasting for a total of 37 second s
over the week period , and four were recorded at 65 Quarry Road with sounds levels
over 60 dB(A) lasting for a total of 33 seconds over the week period . Only one impact
related quarry sound occurrence was recorded at 34 Quarry Road at sound levels
over 60 dB(A) and lasted for a total of 3 seconds. It is important to note that eight of
the nine quarry sound occurrences occurred during the daytime period and are
therefore in compliance with the Town of Westerly Noise Stand ards. The one sound
occurrence that d oes not comply with the stand ards occurred at 65 Quarry Road , is
attributed to truck traffic, and sound levels over 60 dB(A) lasted for only one second .
None of the quarry sound occurrences at 34 Quarry Road and 65 Quarry Road are
duplicates.
Tables 1-5 and 1-6, present a subset of Tables 1-2 and 1-3 and show the maximum
sound levels du ring the 4:30 a.m. to 8:00 a.m. period , which is considered nighttime
and has a maximum sound level of 60 dB(A) accord ing to the Town of Westerly
Noise Stand ards. These tables identify two additional ranges of sound occurrences,
50 dB(A) to 55 dB(A) and 55 dB(A) to 60 dB(A), levels which can be considered a
nuisance. It is important to note that sound occurrences within these ranges are in
accord ance with the Town of Westerly Noise Stand ard s.
Mitigation was considered to address the noise concerns of the local residents.
Figure 1 graphically depicts the proposed mitigation to reduce noise d isturbances at
the residences. As shown in Tables 3 through 6, the primary source of noise from the
quarry is associated with truck traffic. Truck traffic is p rimarily isolated to the
northeastern corner of the quarry where a partial earth berm currently exists.
Construction of an extension to the existing earth berm to wrap around the area used
by trucks is proposed to provide noise blockage for the local residences.

\\RI-DATA\projects\72552.00\reports\Final Noise and Dust Report\Report\Privileged and Confidential Dust and Noise Evaluation_112013.docx
11 Noise Evaluation
1.5 Westerly Noise Ordinance Comparison
VHB evaluated residential sound criteria in other communities for comparison to the
Westerly standard . The following table presents some other community standard s in
relation to Westerly’s:
City/Town Residential Sound Criteria
Daytime Nighttime
Westerly, RI 65 60
Warwick, RI 60 50
North Smithfield , RI 53 43
Boston, MA 60 50
Charlestown, NH 56 49
Enfield , CT 61 51
As can be seen from the table, Westerly’s sound ord inance criteria are high in
comparison to these com munities.
1.6 Noise Conclusion
The noise analysis evaluated the sound levels associated with the operation of the
Copar Quarry and identified noise mitigation measures to substantially reduce the
sound levels. In August of 2013, VHB collected noise measuremen ts over a
consecutive week period at two locations. Analysis of the noise data identified sound
occurrences specific to quarry operations, and based on aud io record ings the cause of
the each occurrence was id entified as best as possible. Truck traffic specific to quarry
activities was found to be the primary source of noise occurrences attributed to the
quarry. Based on the noise analysis there was only one quarry -related sound
occurrence that d oes not comply with the stand ards which occurred at 65 Quarry
Road , and is attributed to truck traffic. The sound levels for this occurrence was over
60 dB(A) and lasted for only one second .
An extension to an existing earth berm was identified as an appropriate noise
mitigation measure. The earth berm will provide noise blockage to local residences
and provide substantial sound level reductions. Consideration should also be given
to ad justing the noise ord inance level to criteria more consistent with other rural
communities.

\\RI-DATA\projects\72552.00\reports\Final Noise and Dust Report\Report\Privileged and Confidential Dust and Noise Evaluation_112013.docx
12 Dust Evaluation
2 Dust Evaluation
The purpose of the dust study was to evaluate the presence and frequency of “dust”
in and around the Copar Quarry in Westerly, Rhode Island . Dust was monitored on
a daily basis as particu late matter less than 10 microns in d iameter (PM10) and as
total particulate matter greater than 10 microns in d iameter (total dust). Respirable
samples of particu late matter less than 4 microns (PM4) were collected for analysis of
crystalline silica. As mentioned in Section 1.0, the quarry is located in Westerly,
Rhode Island and is bordered by residences to the north, west and east. The Town of
Westerly has ind icated that residents, located to the north and west, have expressed
concern with the amount of dust migrating from the Copar Quarry onto their
properties.
The dust evaluation was conducted between September 16, 2013 and October 4, 2013
and consisted of the following activities:
Monitoring PM10 at 5 Locations (3 residences, Bradford School, Copar
Quarry) for One Week;
Collection of Total Dust Data at 4 Locations (3 residences and Bradford
School) for One Week;
Collection of One 8-hr PM4 Sample and One 8-hr Total Dust Sample for
Analysis of Crystalline Silica (quartz) at 5 locations (3 residences, Bradford
School, Copar Quarry) in Week One;
Collection of One 8-hr PM 4 Sample and One 8-hr Total Dust Sample for
Analysis of Crystalline Silica (quartz) at 4 locations (3 residences and Bradford
School) in Week Two;
Collection of Surface Wipe Samples for Analysis of Crystalline Silica (quartz)
at five Locations (3 residences, Bradford School, Bradford Water Tank) on
Two Occasions;
Monitoring of Wind Speed and Direction; and
Installation of motion-activated Cameras to Document Activities/ Disturbance
at Stations.

\\RI-DATA\projects\72552.00\reports\Final Noise and Dust Report\Report\Privileged and Confidential Dust and Noise Evaluation_112013.docx
13 Dust Evaluation
2.1 Equipment and Monitoring Locations
Dust monitoring and / or weather stations were located at the following locations as
shown on Figure 2:
Copar Quarry: Dust Monitoring Station, Weather Station, and Camera (Week
1);
34 Quarry Road: Dust Monitoring Station and Camera (Weeks 1 and 2),
Weather Station (Week 2);
170 Church Street: Dust Monitoring Station and Camera (Weeks 1 and 2);
180 Church Street: Dust Monitoring Station and Camera (Weeks 1 and 2);
Bradford School: Dust Monitoring Station, Weather Station and Camera
(Weeks 1 and 2).
Wipe samples were also collected at the residential p roperties, the Bradford School,
and the Water Tank on Woody Hill Road .
The equipment utilized during the study included the following:
TSI DustTrak 8520 Aerosol Monitor and Environmental Enclosure;
PM10 measurements every minute;
Date, Time, PM10 (mg/ m3);
TSI AM510 SidePak Personal Aerosol Monitor and Environmental Enclosure :
Dust measurements (independent of particle size) every minute;
Vantage Pro2 Weather Station:
Wind Speed , Wind Direction, Date, Time, Temperature, Dew Point,
Gusts, Rain;
Field Cameras:
Date, Time, Day/ Night Vision, Motion Sensor Activated ;
Respirable Dust Cyclone Sampler (PM4) for Crystalline Silica Analysis; and
Surface Wipe Samples for Total Crystalline Silica Analysis.

Figure 2 Dust Monitoring and Sampling Locations
Westerly, RI

\\RI-DATA\projects\72552.00\reports\Final Noise and Dust Report\Report\Privileged and Confidential Dust and Noise Evaluation_112013.docx
15 Dust Evaluation
2.2 Approach
Monitoring stations were installed and allowed to run 24 hours/ d ay every day for
the duration of the field program. Data collected from the dust stations and the
weather stations was downloaded d aily and exported into Excel Spread sheets for
data calcu lations, evaluation and graphing. The weekly data was graphed
collectively and evaluated for highest measurement intervals and / or most activity.
These intervals were segregated into 24-hour increments based on the highest
recorded measurements and the 24-hour average PM10 or total dust values were
calculated . The camera footage and weather station data corresponding to the weekly
highs and the highest ind ividual and 24-hour averages were reviewed in an effort to
correlate quarry activities with the identified highs.
2.3 Background, Regulatory Standards and
Applicability
The term “silica” refers to silicon d ioxide (SiO2 Chemical Abstract Service (CAS)
Number 7631-86-9) which occurs naturally in a variety of crystalline and amorphous
(non-crystalline) forms.2 Unless otherwise stated , silica as used in this report refers to
crystalline silica. Silica exists primarily as quartz . Crystalline silica is a recognized
occupational hazard by the Occupational Safety and Health Administration (OSHA),
National Institute for Occupational Safety and Health (NIOSH), and other similar
organizations, and is used in a variety of industrial and commercial operations.
Stud ies regard ing non-occupational exposure (ambient) to silica are limited . Ambient
crystalline silica is emitted into the environment as a fractional component of
particu late emissions. The critical regulatory particle size is < 10 microns (μm) mass
median aerodynamic d iameter (MMAD).3 The U.S. Environmental Protection
Agency (U.S. EPA) has established a National Ambient Air Quality Stand ard
(NAAQS) for particulate matter < 10 μm identified as PM10.
2.3.1 Ambient – PM10
Environmental emissions of silica (i.e. ambient levels) can occur from natural as well
as industrial/ commercial operations, however; ambient samples have not been
routinely analyzed for crystalline silica content. The U.S. EPA and the Rhode Island
Department of Environmental Management (RIDEM) publish national, regional and
local ambient PM10 levels. The U.S. EPA information regard in g PM10 can be found
2 U.S. Environmental Protection Agency, Office of Research and Development, Health Issue Assessment EPA/600/R-95/115: Ambient Levels and Noncancer Health Effects of Inhaled Crystalline and Amorphous Silica: Health Issue Assessment (Washington, DC, November 1996), 1.1.
3 Ibid., p. 3-1.

\\RI-DATA\projects\72552.00\reports\Final Noise and Dust Report\Report\Privileged and Confidential Dust and Noise Evaluation_112013.docx
16 Dust Evaluation
at http:/ / www.epa.gov/ airtrends/ aqtrnd 95/ pm10.html. The U.S. EPA PM10
NAAQS is app licable ambient air. Relevant information from the U.S. EPA website
regard ing regulation of PM10 is paraphrased below:
Particulate matter is the term for solid or liquid particles found in the air;
The PM10 stand ard focuses on smaller particles that are likely responsible for
adverse health effects because of their ability to reach the lower r egions of the
respiratory tract;
The PM10 stand ards includ e particles with a d iameter of 10 micrometers or
less (0.0004 inches or one-seventh the wid th of a human hair);
U.S. EPA’s health-based NAAQS for PM10 measured as a daily concentration
(24-hour average) is 150 micrograms/ cubic meter (μg/ m3);
Major human health concerns from exposure to PM10 include: effects on
breathing and resp iratory systems, damage to lung tissue, cancer, and
premature death;
New scientific stud ies suggest that smaller particles m ay cause serious
adverse health effects and as such the U.S. EPA is considering whether setting
new stand ards or revising the current PM10 standard is warranted .
The NAAQS PM10 stand ard is a 24-hour average concentration that cannot be
exceeded more than once/ year on average for 3 years.
The RIDEM is requ ired , under federal regulation, to monitor ambient concentrations
of pollu tants for which the U.S. EPA has established NAAQS, includ ing PM10. The
RIDEM annually publishes their Monitoring Network Plan which describes the air
monitoring network in the state and the trends associated with sampling, analysis,
and measurement of NAAQS across the state. The most recent RIDEM report is
entitled “Rhode Island 2013 Annual Monitoring Network Plan” dated June 11, 2013,
which is available for download on the RIDEM’s internet website.
The RIDEM has been cond ucting PM10 measurements at stations throughout the
state since approximately 1988. For approximately the last 10 years, the following
stations have been being monitored for PM10:
Alton Jones (Background Location began PM10 monitoring in 1994);
Johnson & Wales University (JWU) (Dorrance Street Roof);
Prairie Avenue (Providence); and
Vernon Street (Pawtucket).

\\RI-DATA\projects\72552.00\reports\Final Noise and Dust Report\Report\Privileged and Confidential Dust and Noise Evaluation_112013.docx
17 Dust Evaluation
Twenty-four hour PM10 measurements are recorded every 6 days throughout the
year. These results are reported to, and available on the U.S. EPA website previously
referenced . The following information was obtained from the U.S. EPA website for
the Rhode Island monitoring stations:
Rhode Island Highest 24-Hr Average September 2012
Alton Jones= 11 ug/ m3 (September 6)
Providence= 25 ug/ m3 (September 18)
Rhode Island Highest 24-Hr Average 2012
Alton Jones= 22 ug/ m3 (May 27)
Providence= 51 ug/ m3 (January 12)
The RIDEM also has a series of state-specific air regulations enumerated as Air
Regulation Numbers 1 through 49. Particulate matter is regulated as an air
contaminant by the RIDEM. RIDEM Air Resources Regulations that may be
applicable to the operations at Copar Quarry (depending on emission rates,
equipment, pollu tion controls, etc.) include, but may not be limited to the following:
Air Pollu tion Control (APC) Regulation No. 3 “Particulate Emissions from
Industrial Processes;”
APC Regulation No. 5 “Fugitive Dust;”
APC Regulation No. 7 “Emission of Air Contaminants Detrimental to Person
or Property;”
APC Regulation No. 9 “Air Pollution Control Permits;”
APC Regulation No. 16 “Operation of Pollution Control Equipment;”
APC Regulation No. 22 “Air Toxics;”
APC Regulation No. 34 “Rhode Island Motor Vehicle
Inspection / Maintenance;”
APC Regulation No. 42 “Heavy Duty Diesel Engine Stand ards;” and
APC Regulation No. 45 “Rhode Island Diesel Engine Anti-Id ling Program.”
VHB was not asked to evaluate or comment on Copar’s regulatory compliance with
these or other Rhode Island Regulations as part of this project. Compliance with
many of these regulations is dependent on calculations of processing rates associated
with the business operations, in add ition to the types of pollution control equipment
available on the processing equipment. APC Regulation Nos. 5 and 7 are more
d irectly app licable to the operations of Copar Quarry. Specifically, APC Regulation
No. 5 is applicable as follows:

\\RI-DATA\projects\72552.00\reports\Final Noise and Dust Report\Report\Privileged and Confidential Dust and Noise Evaluation_112013.docx
18 Dust Evaluation
Applicable to the generation of airborne particu late matter from activities
includ ing, but not limited to:
Material stockpiles and earth moving activities which cause airborne
particu late matter;
Vehicles transporting materials that cause airborne particulate
matter;
Paved roads onto which earth or other material has been deposited
by trucking or earth moving equipment, by erosion by water, by
sanding/ salting road ways or by other means; and
Commercial mining and / or quarrying operations includ ing the
construction, maintenance, and operation of a commercial mining
and / or quarrying facility, as well as activities which involve the use
of explosive materials which cause airborne particu late matter;
Regulation No. 5 states that “no person shall cause or permit any materials,
includ ing bu t not limited to sand , gravel, soil, aggregate and any other
organic or inorganic solid matter capable of releasing dust, to be hand led ,
transported , mined , quarried , stored or otherwise utilized in any way so as to
cause airborne particulate matter to travel beyond the property line of the
emission source without taking adequate precautions to prevent particu late
matter from becoming airborne;
No numerical stand ard is associated with Regulation No. 5.
APC Regulation No. 7 is applicable as follows:
No person shall emit any contaminant which either alone or in connection
with other emissions, by reason of their concentration or duration, may be
injurious to human, plant or animal life, or cause damage to property or
which unreasonable interferes with the enjoyment of life and property.
The determination of compliance with this regulation is referenced as
compliance with the NAAQS.
2.3.2 Occupational – Crystalline Silica and Nuisance Dust
The U.S. Department of Labor, OSHA was created to “assure safe and healthful
working conditions for working men and women by setting and enforcing stand ards
and by provid ing training, outreach, education, and assistance.”4 OSHA Standard s
4 United States Department of Labor, Occupational Safety and Health Administration, About OSHA, https://www.osha.gov/about.html (November 2013).

\\RI-DATA\projects\72552.00\reports\Final Noise and Dust Report\Report\Privileged and Confidential Dust and Noise Evaluation_112013.docx
19 Dust Evaluation
are applicable to work places and , therefore, are not d irectly app licable to the
residential and school properties stud ied during this p roject. OSHA Stand ard s are,
however, d irectly app licable to measurements made at the Copar Quarry property.
OSHA has established a Permissible Exposure Limit (PEL) for “Silica: Crystalline
Quartz” as both respirable and total fractions. OSHA PELs are 8-hour, time weighted
averages (TWA). OSHA regulates silica exposure using the PEL which is “the
maximum amount of airborne dust an employee may be exposed to during a full
work shift.”5 The PEL is dependent on the amount of crystalline silica in the dust as
calculated by the equation below:6
PELrespirable
=
PELtotal
=
Respirable crystalline silica samples are collected through a cyclone , while the total
dust sample was taken by removing the cyclone. For respirable samples that contain
100% SiO2, the PEL
respirable equals approximately 100 μg/m
3. For total dust samples that
contain 100% SiO2, the PEL
total equals approximately 300 μg/m
3.
OSHA issued a Proposed Rule Change in the September 12, 2013 Federal Register to
reduce the PELrespirable
for crystalline silica to 50 μg/m3,.7 The rulemaking also proposes
eliminating the PEL for crystalline silica in total dust and clarifies definitions and
methodologies consistent with the American Conference for Governmental
Industrial Hygienists (ACGIH), the National Institu te for Occupational Health
(NIOSH), and the European Committee for Stand ard ization (CEN). The comment
period is open until December 11, 2013.
OSHA Table Z-3 Mineral Dusts also lists a PELrespirable
and PELtotal
for “Inert” or
“Nuisance Dust” of 5 mg/m3 (5,000 μg/m
3) and 15 mg/m
3 (15,000 μg/m
3), respectively.
Inert/ Nuisance Dust is defined in a footnote to the table as “All inert or nuisance
dusts, whether mineral, inorganic, or organic, not listed specifically by substance
name are covered by this limit, which is the same as the Particu lates Not Otherwise
Regulated (PNOR) limit in Table Z-1.”
5 U nited States Department of Labor, Occupational Safety and Health Administration, eTools Silica Advisor, https://www.osha.gov/dsg/etools/silica/compare_to_limit/pel/pel.html (November 2013).
6 Ibid., (November 2013). 7 “29 CFR Parts 1910, 1915, and 1926 Occupational Exposure to Respirable Crystalline Silica; Proposed Rule,” 78
Federal Register 177 (September 12, 2013), p. 56274.
10
[% quartz + (% cristobalite x 2) + (% tridymite x 2) + 2]
30
[% quartz + (% cristobalite x 2) + (% tridymite x 2) + 2]

\\RI-DATA\projects\72552.00\reports\Final Noise and Dust Report\Report\Privileged and Confidential Dust and Noise Evaluation_112013.docx
20 Dust Evaluation
2.3.3 Ambient Crystalline Silica and Wipe Samples
There is currently no RIDEM or U.S. EPA ambient regulatory enforcement stand ard
established for crystalline silica, or for a concentration of total crystalline silica
obtained via wipe sampling.
California
California has established a chronic Reference Exposure Level (REL) for respirable
crystalline silica of 3 μg/m3 which is described as a continuous, lifetime exposure with
the “exposure metric” being an annual average exposure. Respirable refers to PM4.8
The California REL is not applicable in Rhode Island or on a federal level but is
provided for informational purposes.
New York City, World Trade Center
In 2003, the U.S. EPA, Region 2 issued an Interim Final Report d ated April 2003 and
entitled “World Trade Center Background Study Report” (hereinafter the WTC
Background Report). The WTC Background Report was prepared by the U.S. EPA,
Region 2, New York City Response and Recovery Operations Division. In response to
the September 11, 2001 attacks on the World Trade Center the EPA was tasked with
establishing procedures/ protocols for cleaning dust/ debris from the streets, and
sampling ambient air, among other things. Accord ing to the WTC Background
Report, residents of lower Manhattan were concerned about the efficacy of methods
being used to remove dust and debris from residential areas. As a result, a task force
was developed that included the U.S. EPA, the Federal Emergency Management
Agency (FEMA), and New York City (NYC). The task force set about establishing a
voluntary cleanup program for residential units and residents regard ing the
potential risks from exp osure to residual WTC dust and debris.9
One of the first items addressed by the task force was the identification of
Contaminants of Potential Concern (COPCs) for the area. The following COPCs were
selected for study: “asbestos, lead , d ioxins, polycyclic aromatic hydrocarbons
(PAHs), fibrous glass and minerals includ ing crystalline silica (i.e. quartz,
cristobalite, tridymite), calcite, gypsum, and portland ite.”10
In May of 2003, the report “World Trade Center Indoor Environment Assessment:
Selecting Contaminants of Potential Concern and Setting Health -Based Benchmarks”
was released (the Benchmark Report). The report was prepared by the COPC
Committee of the World Trade Center Ind oor Air Task Force Working Group with
8 California Office of Environmental Health Hazard Assessment, “Chronic Toxicity Summary: Silica (Crystalline, Respirable)” (Oakland, California, February 2005), 1.
9 United States Environmental Protection Agency, Region 2, New York City Response and Recovery Operations, “World Trade Center Background Study Report, Interim Final” (New York, New York, April 2003). 1.
10 Ibid., p.2.

\\RI-DATA\projects\72552.00\reports\Final Noise and Dust Report\Report\Privileged and Confidential Dust and Noise Evaluation_112013.docx
21 Dust Evaluation
contributions from the U.S. EPA, NYC Department of Health and Mental Hygiene,
Agency for Toxic Substances and Disease Registry (ASTDR), and OSHA. Section 3.0
of the Benchmark Report summarized the final health based benchmarks that were
developed to “be protective of long-term habitability of residential dwellings.” The
approach involved use of “relevant and appropriate environmental stand ards/
regulations; calculation of health -based benchmarks employing environmental risk
assessment guidance, and adaptation of occupational stand ards with ad d itional
safety factors.”11
Relative to silica in indoor air the report concluded “Therefore the
COPC Committee is recommending a benchmark of 5 ug/ m3, which is the lowest
amount that can be reliably reported in a reasonable sampling time.”12
The Benchmark Report and WTC Background Report describe collection of wipe
samples to evaluate the presence of silica and other contaminants in “settled dust.”
Section 3.4 of the Benchmark Report entitled “Health Based Benchmarks (Summary
Table)” describes the benchmarks developed for both indoor air concentrations and
settled dust. The report proposed no stand ard for crystalline silica in settled dust as
described in the following paragraph :
“Benchmarks for asbestos, fibrous glass and crystalline silica in settled du st are
not provided for the following reason. These three minerals exert their toxicity
primarily through the inhalation route of exposure. Therefore, a health -based
benchmark for settled dust would be a function of the relationship between the
mineral content in settled d ust and ind oor air. Limited stud ies (Millette and
Hays, 1994) have described the empirical relationships (referred to be (sic) the
authors as “K factors”) between concentrations of asbestos fibers in settled dust
and indoor air. These K factors were developed by studying matched air and
settled dust samples taken from indoor environments at varying levels of
activity. However, due to the numerous factors that influence the relationship
between fiber concentration in settled dust and indoor air, includ ing surface
porosity, activity patterns, air exchange rates, and interior volume, the COPC
Committee elected against setting benchmarks for COPC in settled dust based on
projected concentrations in indoor air.”13
The Benchmark Report add itionally notes the following relative to crystalline silica:
Settled dust and air samples were taken both in ind oor and outdoor areas of
residential bu ild ings;
These samples ind icated the presence of quartz (no other forms of crystalline
silica were detected);
11 Contaminants of Potential Concern (COPC) Committee of the World Trade Center Indoor Air Task Force Working Group, “World Trade Center Indoor Environment Assessment: Selecting Contaminants of Potential Concern and Setting Health-Based Benchmarks” (May 2003). 8.
12 Ibid., p. 10. 13 Ibid., p. 11.

\\RI-DATA\projects\72552.00\reports\Final Noise and Dust Report\Report\Privileged and Confidential Dust and Noise Evaluation_112013.docx
22 Dust Evaluation
Quartz was found in 49% of the settled dust samples from indoor air of
residential bu ild ings and all of the ou tdoor areas sampled outside the dust
plume are (e.g. uptown Manhattan);
Since quartz is a common material in sand , find ing this mineral in a city
where there is a great deal of concrete is not unusual;
Comparison of quartz levels in dust from residential areas outside the WTC
collapse dust plume (e.g. uptown Manhattan) revealed substantially lower
levels than those in lower Manhattan.
2.3.4 Summary of Applicable Regulatory Criteria
EPA PM10 = 150 μg/ m3 (0.15 mg/ m
3) as 24 Hour Average
Applicable and Enforceable to the Project Area
OSHA Silica: Crystalline Quartz PELRESP
= 100 μg/ m3 (0.10 mg/ m
3)
Applicable and Enforceable at Quarry Location and for Quarry Workers
Not Applicable at Residential Properties
OSHA Silica: Crystalline Quartz PELTOT
= 300 μg/ m3 (0.30 mg/ m
3)
Applicable and Enforceable at Quarry Location and for Quarry Workers
Not Applicable at Residential Properties
OSHA Inert/ Nuisance Dust PELRESP
= 5,000 μg/ m3 (5 mg/ m
3)
Applicable and Enforceable at Quarry Location and for Quarry Workers
Not Applicable at Residential Properties
OSHA Inert/ Nuisance Dust PELTOT
= 15,000 μg/ m3 (15 mg/ m
3)
Applicable and Enforceable at Quarry Location and for Quarry Workers
Not Applicable at Residential Properties

\\RI-DATA\projects\72552.00\reports\Final Noise and Dust Report\Report\Privileged and Confidential Dust and Noise Evaluation_112013.docx
23 Dust Evaluation
2.4 PM10 Monitoring Results – September 16
through September 25, 2013
Figure 3 is a graphical representation of the week long PM10 monitoring results. The
graph plots all of the monitoring locations together. Each location is represented by a
d ifferent line color. Relevant information regard ing the graph is as follows:
Horizontal Axis:
Date;
Day of the Week;
Predominant Wind Direction (over the entire day);
Time (based on a 24-hour clock).
Vertical Axis:
PM10 measurement in milligrams/ cubic meter (mg/ m3);
Graphical scale running from 0 mg/ m3 to 1.0 mg/ m
3 (1,000 μg/ m
3).
Highest 24-Hour Average PM10 Measurement During the Week;
Location of the Highest 24-Hour Average PM10 Measurement (September 20-
21);
Dominant Wind Direction within the 24-Hours Corresponding to the Highest
Average;
Call out of Various Peak Measurements with the Noted Wind Speed and
Direction Corresponding to the Date/ Time;
Ind ication of Peak Associated with Blasting at the Quarry;
Yellow Horizontal Line:
U.S. EPA NAAQS for PM10 = 150 μg/ m3 (0.150 mg/ m
3);
Red Horizontal Line:
Highest 24-Hour Average Concentration Recorded for the Week.
The axes labels, symbols, and designations shown on Figure 3 are also applicable to
Figures 4-7.

0.9
0.561
0.528 0.523
0.133
0.39
0.463
0.322
0.228
0.083
0.386
0.285
0.198
0.219
0
0.1
0.2
0.3
0.4
0.5
0.6
0.7
0.8
0.9
1
12
:04
14
:37
17
:10
19
:43
22
:16
0:4
93
:22
5:5
58
:28
11
:01
13
:34
16
:07
18
:40
21
:13
23
:46
2:1
94
:52
7:2
59
:58
12
:31
15
:04
17
:37
20
:10
22
:43
1:1
63
:49
6:2
28
:55
11
:28
14
:01
16
:34
19
:07
21
:40
0:1
32
:46
5:1
97
:52
10
:25
12
:58
15
:31
18
:04
20
:37
23
:10
1:4
34
:16
6:4
99
:22
11
:55
14
:28
17
:01
19
:34
22
:07
0:4
03
:13
5:4
68
:19
10
:52
13
:25
15
:58
18
:31
21
:04
23
:37
2:1
04
:43
7:1
69
:49
12
:22
14
:55
17
:28
20
:01
22
:34
1:0
73
:40
6:1
38
:46
11
:19
13
:52
16
:25
18
:58
21
:31
0:0
42
:37
5:1
07
:43
10
:16
12
:49
9/16/2013Monday
NW
9/17/2013Tuesday
N
9/18/2013Wednesday
WSW
9/19/2013Thursday
SW
9/20/2013FridaySSW
9/21/2013Saturday
S
9/22/2013Sunday
NW
9/23/2013Monday
NW
9/24/2013Tuesday
NW
9/25/2013Wednesday
WNW
Me
asu
rem
en
t m
g/m
3
PM 10 September 16 thru September 25
170 Church Street
34 Quarry Road
181 Church Street
Bradford School
Copar Quarry
EPA PM10
SSW @ 5 mph
N @ 9 mph
NNW @ 3 mph
WNW @ 1 mph
SSE @ 4 mph
W @ 1 mph
NW @ 5 mph
W @ 1 mph
WNW @ 2 mph
WNW @ 3 mph
N @ 2 mph
24-Hour Average
Highest 24-Hour Average AVG(170Church) = 0.0285 Dominant Wind SSW
Figure 3

\\RI-DATA\projects\72552.00\reports\Final Noise and Dust Report\Report\Privileged and Confidential Dust and Noise Evaluation_112013.docx
25 Dust Evaluation
2.4.1 Highest 24-Hour PM10 Average
Figure 4 is an enlargement of the highest 24-hour PM10 average during the week.
Relevant information about this interval:
The highest 24-hour PM10 average for the week occurred between 9 a.m. on
Friday morning September 20th and 9 a.m. on Saturday morning September
21st;
PM1024-High
= 0.0285 mg/ m3 measured at the 170 Church Street air monitoring
station;
Dominant Wind Direction within the 24-Hours was from the south-southwest (SSW);
PM1024-COPAR
= 0.024 mg/ m3 (24-hour measurement at Copar Quarry during the
same interval);
U.S. EPA PM10 = 0.150 mg/ m3. Recorded measurements do not exceed the
U.S. EPA PM10 Stand ard .
2.4.2 Copar Quarry Blast – September 18, 2013 at 1:05 p.m.
The camera mounted at Copar Quarry captured the image of a blast that occurred at
1:05 p.m. on Wednesday, September18th. Photograph 1 shows the image captured by the
camera at the quarry. VHB inspected the quarry on August 5, 2013 prior to establishing any
protocols for dust or noise monitoring. VHB was escorted by various Copar Quarry
personnel and legal counsel. During that inspection, VHB observed a blasting crew
preparing the northern working face of the quarry for a blast event. When asked about the
blasting processes, in particular use of blasting mats to minimize dust generation and rock
fly, VHB was informed by Copar that no blasting mats are used during blasting operations.
In the foreground of the photograph, the weather station is the piece of equipment to
the left of the photograph and the dust monitoring st ation is the piece of equipment
to the right. The resultant d ust cloud is also captured in the photograph. Figure 5
shows the approximate location of the monitoring equ ipment and the location of the
blast. Figure 6 is an enlargement of the 24-hour PM10 cycle associated with the blast
occurrence. Relevant information about this interval:
The spike associated with the blast is clearly visible and labeled on the graph;
The corresponding PM10 measurement “at that moment” was recorded as 0.198
mg/ m3;
The corresponding wind speed and d irection was recorded as 4 miles/ hour
(mph) from the south-southeast (SSE);
No corresponding spikes were recorded at the other air monitoring stations;

0.9
0.561
0.107
0.252
0.344
0.239
0.183
0.242
0
0.1
0.2
0.3
0.4
0.5
0.6
0.7
0.8
0.9
1
9:0
0
9:3
2
10
:04
10
:36
11
:08
11
:40
12
:12
12
:44
13
:15
13
:47
14
:19
14
:51
15
:23
15
:55
16
:27
16
:59
17
:31
18
:03
18
:35
19
:07
19
:39
20
:11
20
:43
21
:15
21
:47
22
:19
22
:51
23
:23
23
:55
0:2
7
0:5
9
1:3
1
2:0
3
2:3
5
3:0
7
3:3
9
4:1
1
4:4
3
5:1
5
5:4
7
6:1
9
6:5
1
7:2
3
7:5
5
8:2
7
8:5
9
Me
asu
rem
en
t m
g/m
3
24 Hour Time Clock
PM10September 20-21
(9:00-8:59)
170 Church Street
34 Quarry Road
181 Church Street
Bradford School
Copar Quarry
AVG(high) = 0.0285 mg/m3 @ 170 ChurchAVG(Copar) = 0.024 mg/m3
EPA PM10
24-Hour Average
NW @ 5 mph
N @ 2 mph
Figure 4 Highest 24-Hour Average

Figure 5 Copar Dust Monitoring Station and Blast Face Locations
(approximate)

Figure 6 Blast Detail
24-Hour Average
0.054
0.159
0.142
0.228
0.198
0.181
0
0.05
0.1
0.15
0.2
0.25
11
:00
11
:35
12
:10
12
:45
13
:20
13
:55
14
:30
15
:05
15
:40
16
:15
16
:50
17
:25
18
:00
18
:35
19
:10
19
:45
20
:20
20
:55
21
:30
22
:05
22
:40
23
:15
23
:50
0:2
5
1:0
0
1:3
5
2:1
0
2:4
5
3:2
0
3:5
5
4:3
0
5:0
5
5:4
0
6:1
5
6:5
0
7:2
5
8:0
0
8:3
5
9:1
0
9:4
5
10
:20
10
:55
Me
asu
rem
en
t m
g/m
3
24 Hour Time Clock
PM10September 18-19
(11:00-10:59)
170 Church Street
34 Quarry Road
181 Church Street
Bradford School
Copar Quarry
AVG(high) = 0.017 mg/m3 @ SchoolAVG (Copar) = 0.014 mg/m3
EPA PM10
24-Hour Average
Blast at Quarry
SSE @ 4 mph
ESE @ 1 mph
W @ 1 mph
WNW @ 2 mph
WNW @ 5 mph
WNW @ 4 mph
Trespassers at Quarry

\\RI-DATA\projects\72552.00\reports\Final Noise and Dust Report\Report\Privileged and Confidential Dust and Noise Evaluation_112013.docx
29 Dust Evaluation

\\RI-DATA\projects\72552.00\reports\Final Noise and Dust Report\Report\Privileged and Confidential Dust and Noise Evaluation_112013.docx
30 Dust Evaluation
A read ing of 0.034 mg/ m3 (34 μg/ m
3) was measured at the Bradford School 2
hours later, at approximately 3:05 p.m, and a read ing of 0.054 mg/ m3 (54
μg/ m3) was measured at 170 Church Street 7 hours later at approximately 8
p .m;
All monitoring stations recorded an increase in PM10 read ings on Thursday
morning, September 19th between approximately 7 a.m. and 10 a.m;
The wind d irection associated with this cluster of read ings was from the
west/ northwest (WNW) with speeds ranging from 1 mph to 5 mph;
The 24-hour average PM10 was calculated so as to capture the peak associated
with the blast and the cluster of readings recorded the morning of September 19th;
The highest PM1024
recorded during this interval for all the stations was 0.017
mg/ m3 (17 μg/ m
3) recorded at Bradford School;
PM1024-COPAR
= 0.014 mg/ m3 (24-hour measurement at Copar Quarry during the
same interval);
U.S. EPA PM10 = 0.150 mg/ m3. Recorded measurements do not exceed the
U.S. EPA PM10 Stand ard .
2.4.3 Nighttime PM10 Example
Through evaluation of the recorded data, some elevated dust measurements were
also identified at night. Figure 7 is an enlargement of the 24-hour PM10 cycle from
9:45 a.m. on Tuesday September 17 to 9:45 a.m. on Wednesday September 18th.
Relevant information about this interval:
Copar Quarry operations are clearly visible in the lower left portion of the
graph which corresponds to approximately 9:45 a.m. through approxim ately 5
p .m. on September 17th;
The highest ind ivid ual PM10 measurement recorded during the operating
hours was recorded as 0.285 mg/ m3 as shown on the graph, with a w ind
d irection from the north and a wind speed of 9 mph;
The cessation of active quarry operations can be seen by the flattened lines on
the graph between approximately 5 p .m. on Tuesday and 10 p.m. on Tuesd ay;
From approximately 10 p.m. on Tuesday September 17th until approximately 7
a.m. on Wednesday September 18th a series of PM10 measurements elevated
d isproportionally to the other stations were recorded ;
This series of read ings were recorded at 181 Church Street with the highest
read ing overnight being recorded as 0.463 mg/ m3 (463 μg/ m
3) at 4:19 a.m.
with a correspond ing wind d irection being from the NNW at a speed of 3
mph;

Figure 7 Nighttime Example-Wind Direction NNW
24-Hour Average
0.183
0.463
0.285
0
0.05
0.1
0.15
0.2
0.25
0.3
0.35
0.4
0.45
0.5
9:4
5
10
:20
10
:55
11
:30
12
:05
12
:40
13
:15
13
:50
14
:25
15
:00
15
:35
16
:10
16
:45
17
:20
17
:55
18
:30
19
:05
19
:40
20
:15
20
:50
21
:25
22
:00
22
:35
23
:10
23
:45
0:2
0
0:5
5
1:3
0
2:0
5
2:4
0
3:1
5
3:5
0
4:2
5
5:0
0
5:3
5
6:1
0
6:4
5
7:2
0
7:5
5
8:3
0
9:0
5
9:4
0
Me
asu
rem
en
t m
g/m
3
24 Hour Time Clock
PM10September 17-18
(9:45 - 9:44)
170 Church Street
34 Quarry Road
181 Church Street
Bradford School
Copar Quarry
AVG(high) = 0.025 mg/m3 @ CoparAVG(181Church) = 0.015 mg/m3
EPA PM10
24-Hour Average
N @ 9 mph
NNW @ 3 mph
WNW @ 4 mph
Lawn Mowing at School

\\RI-DATA\projects\72552.00\reports\Final Noise and Dust Report\Report\Privileged and Confidential Dust and Noise Evaluation_112013.docx
32 Dust Evaluation
Between approximately 6 and 7 a.m. on Wednesd ay the graph suggests the
recurrence of activities at the quarry as depicted by the blue lines;
The highest PM1024
recorded during this 24-hour interval for all the stations
was 0.025 mg/ m3 (25 μg/ m
3) recorded at Copar Quarry;
The second highest PM1024
= 0.015 mg/ m3 (recorded at 181 Church Street).
2.4.4 Comparison of PM10 24-Hour Averages
Table 2-1 provides a summary of the highest 24-hour PM10 averages calculated for
the week as compared to the U.S. EPA PM10 Stand ard . The table also includes
read ings taken by the RIDEM at their PM10 ambient air monitoring stations during
the same week but in 2012.
Table 2-1 24-Hour PM10 Averages
The information in this table shows that PM10 measurements recorded at the 5 Westerly
locations on September 18-19, 2013 and September 24-25, 2013 were consistent with PM10
measurements reported by RIDEM for the same dates in 2012. The Kent County/ Alton
Jones Campus is considered to represent background conditions by the RIDEM. The
average of the residential and school properties’ PM10 readings on September 18-19, 2013
was 12 μg/ m3 (Kent County/ Alton Jones = 10 μg/ m
3 September 18, 2012). Likewise, the
Date Sept. 17-18 Sept. 18-19 Sept. 20-21 Sept. 21-22 Sept. 23-24 Sept. 24-25
Time 9:45-9:44 11:00-10:59 9:00-8:59 11:00-10:59 6:00-5:59 7:00-6:59
Dominant Wind Direction N-WSW WSW SSW S-NW NW WNW
Day T-W W-R F-S S-Su M-T T-W
Units (ug/m3) (ug/m3) (ug/m3) (ug/m3) (ug/m3) (ug/m3) (ug/m3)
Copar 25 14 24 9 16 28
170 Church 8 14 29 10 6 9
181 Church 15 2 27 2 0.2 2
34 Quarry NA 15 * 9 3 5
School 5 17 27 8 1 3
RIDEM DATA 2012 Sept. 18 Sept. 24
Kent County/Alton Jones 10 5
Prov Station 1 17 7
Prov Station 2 16 19
Prov Station 3 25 8
*
U.S. EPA National
Ambient Air Quality
Standard (NAAQS)
PM10
2 hour data collection
150
U.S. EPA NAAQS for PM10: 24-hour average not to be exceeded more than once
per year on average over 3 years.

\\RI-DATA\projects\72552.00\reports\Final Noise and Dust Report\Report\Privileged and Confidential Dust and Noise Evaluation_112013.docx
33 Dust Evaluation
average residential and school properties’ PM10 readings on September 24-25, 2013 was
5 μg/ m3 (Kent County/ Alton Jones = 5 μg/ m
3 September 24, 2012).
The PM10 measurements collected at Copar are more consistent with the urban
Providence stations than the Alton Jones station. The average of the Providence PM10
readings on September 18, 2012 was 19 μg/ m3 (Copar = 14 μg/ m
3 September 18-19,
2013). Likewise, the average of the Providence PM10 readings on September 24, 2012 was
11 μg/ m3 (Copar = 28 μg/ m
3 September 24-25, 2013).
Accord ing to the Rhode Island ambient PM10 measurements reported by RIDEM to
the U.S. EPA and available on the U.S. EPA’s website, the highest 24-hour PM10
measurement in September of 2012 was 11 ug/ m3 on September 6, 2012 at Alton
Jones, and 25 ug/ m3 on Sep tember 18, 2012 in Providence. For the entirety of 2012,
the highest 24-hour PM10 read ing at Alton Jones was recorded as 22 ug/ m3 on
May 27, 2012, and in Providence was recorded as 51 ug/ m3 on January 1, 2012.
14
2.5 Total Dust Monitoring Results – September 25 through October 4, 2013
The dust monitoring station and weather station were removed from Copar Quarry
during the second week of monitoring. This was done at the suggestion of the town
and residential property owners due to concerns that Copar Quarry operators may
have been limiting their operations during the week they knew monitoring at
residential properties was going on. The residential property owners also requested
that the Bradford School monitoring stations be moved from the locat ion in front of
the school to behind the school so the station was no longer visible from the road .
Prior to the start of the total dust monitoring, VHB relocated the dust monitoring and
weather station to the back of the school property. The weather station that was
previously used at Copar Quarry was relocated to 34 Quarry Road .
Figure 8 is a graphical representation of the week long Total Dust monitoring results.
The graph plots all of the monitoring locations together. Each location is represented
by a d ifferent line color. Symbolism and axes designations are the same as depicted
on Figure 3 for the PM10 summary with the following exceptions:
Vertical Axis:
Total Dust measurement in milligrams/ cubic meter (mg/ m3);
Graphical scale running from 0 mg/ m3 to 0.3 mg/ m
3 (300 μg/ m
3).
Highest 24-Hour Average Total Dust Measurement During the Week;
Location of the Highest 24-Hour Total Dust Measurement (October 2-3);
Yellow Horizontal Line:
14 United States Environmental Protection Agency, Air Quality Division, Air Data, https://www.epa.gov/airquality/airdata (October 2013).

\\RI-DATA\projects\72552.00\reports\Final Noise and Dust Report\Report\Privileged and Confidential Dust and Noise Evaluation_112013.docx
34 Dust Evaluation
Represents U.S. EPA NAAQS for PM10 = 150 μg/ m3. Stand ard is for
reference only and is NOT applicable to Total Dust measurements.
The axes labels, symbols, and designations shown on Figure 8 are also applicable to
Figures 9- and 10.
2.5.1 Highest 24-Hour Total Dust Average
Figure 9 is an enlargement of the highest 24-hour Total Dust average cycle during
the week. Relevant information about this interval:
The highest 24-hour Total Dust average for the week occurred between 4:30
a.m. on Wednesday morning October 2nd
and 4:30 a.m. on Thursday morning
October 3rd
;
Total Dust24-High
= 0.0347 mg/ m3 (35 μg/ m
3) measured at the 181 Church Street
air monitoring station;
Dominant Wind Direction within the 24-Hours was from the NNW with
limited excursions from the south on October 2nd
;
The U.S. EPA PM10 = 0.150 mg/ m3 (150 μg/ m
3), although not applicable to
Total Dust measurements, was not exceeded by the 24-hour average.
2.5.2 Nighttime Total Dust Example
As with the PM10 d ata, some elevated Total Dust measurements were also identified
at night. Figure 10 is an enlargement of the 24-hour Total Dust cycle from 4:30 a.m.
on Frid ay September 27 to 4:30 a.m. on Saturd ay September 28th. Relevant
information about this interval:
The highest ind ivid ual Total Dust measurement recorded during this time
interval was 0.163 mg/ m3 at Bradford School at 9:30 p .m. as shown on the
graph, with a w ind d irection from the north and a wind speed of 2 mph;
Bookending this read ing are a series of measurements from approximately
7:30 p.m. on Frid ay September 27th until approximately 1 a.m. on Saturday
September 28th at the Bradford School. Although generally low measurements,
they are elevated in comparison to other surround ing measurements;

0.067
0.136
0.036 0.047
0.123
0.063 0.059
0.279 0.277
0.002
0.163
0.081
0.083
0
0.05
0.1
0.15
0.2
0.25
0.3
14
:04
16
:56
19
:48
22
:40
1:3
24
:24
7:1
61
0:0
81
3:0
01
5:5
21
8:4
42
1:3
60
:28
3:2
06
:12
9:0
41
1:5
61
4:4
81
7:4
02
0:3
22
3:2
42
:16
5:0
88
:00
10
:52
13
:44
16
:36
19
:28
22
:20
1:1
24
:04
6:5
69
:48
12
:40
15
:32
18
:24
21
:16
0:0
83
:00
5:5
28
:44
11
:36
14
:28
17
:20
20
:12
23
:04
1:5
64
:48
7:4
01
0:3
21
3:2
41
6:1
61
9:0
82
2:0
00
:52
3:4
46
:36
9:2
81
2:2
01
5:1
21
8:0
42
0:5
62
3:4
82
:40
5:3
28
:24
11
:16
14
:08
17
:00
19
:52
22
:44
1:3
64
:28
7:2
01
0:1
21
3:0
41
5:5
6
9/25/2013Wednesday
N
9/26/2013Thursday
NE
9/27/2013Friday
N
9/28/2013Saturday
ENE
9/29/2013Sunday
NE
9/30/2013Monday
N
10/1/2013Tuesday
NW
10/2/2013Wednesday
WSW
10/3/2013Thursday
SW
10/4/2013Friday
N
Me
asu
rem
en
t m
g/m
3
Total Dustfall September 25 thru October 4
34 Quarry Road
170 Church Street
181 Church Street
Bradford School
EPA PM10
24-Hour Average
NNE @ 7 mph
NNW @ 6 mph
N @ 2 mph
NNE @ 6 mph
NNE @ 7 mph
NNW @ 7 mph NNW @ 1 mph
NNW @ 2 mph
Highest 24-Hour Average AVG(181Church) = 0.0347 Dominant Wind WSW
Figure 8

Figure 9 Highest 24-Hour Average
Total Dust
0.076
0.123
0.06
0.279
0.145
0
0.05
0.1
0.15
0.2
0.25
0.3
4:3
0
5:0
6
5:4
2
6:1
8
6:5
4
7:3
0
8:0
6
8:4
2
9:1
8
9:5
4
10
:30
11
:06
11
:42
12
:18
12
:54
13
:30
14
:06
14
:42
15
:18
15
:54
16
:30
17
:06
17
:42
18
:18
18
:54
19
:30
20
:06
20
:42
21
:18
21
:54
22
:30
23
:06
23
:42
0:1
8
0:5
4
1:3
0
2:0
6
2:4
2
3:1
8
3:5
4
Me
asu
rem
en
t m
g/m
3
24 Hour Time Clock
TOTALOctober 2-3
(4:30-4:29)
34 Quarry Road
170 Church Street
181 Church Street
Bradford School
EPA PM10
N @ 3 mph
NNW @ 7 mph
NNW @ 7 mph
AVG(high) = 0.0347 mg/m3 @ 181 ChurchAVG(School) = 0.0328 mg/m3
24-Hour Average

Figure 10 Nighttime Example-Wind Direction N
24-Hour Average
0.067
0.032
0.05
0.163
0.047
0
0.02
0.04
0.06
0.08
0.1
0.12
0.14
0.16
0.18
4:3
0
5:0
6
5:4
2
6:1
8
6:5
4
7:3
0
8:0
6
8:4
2
9:1
8
9:5
4
10
:30
11
:06
11
:42
12
:18
12
:54
13
:30
14
:06
14
:42
15
:18
15
:54
16
:30
17
:06
17
:42
18
:18
18
:54
19
:30
20
:06
20
:42
21
:18
21
:54
22
:30
23
:06
23
:42
0:1
8
0:5
4
1:3
0
2:0
6
2:4
2
3:1
8
3:5
4
Me
asu
rem
en
t m
g/m
3
24 Hour Time Clock
TOTALSeptember 27-28
(4:30-4:29)
34 Quarry Road
170 Church Street
181 Church Street
Bradford School
EPA PM10
N @ 3 mph
NNW @ 6 mph
N @ 2 mph
AVG(high) = 0.0096 mg/m3 @ SchoolAVG(181 Church) = 0.0069 mg/m3
24-Hour Average

\\RI-DATA\projects\72552.00\reports\Final Noise and Dust Report\Report\Privileged and Confidential Dust and Noise Evaluation_112013.docx
38 Dust Evaluation
2.5.3 Comparison of Total Dust 24-Hour Averages
Table 2-2 provides a summary of the highest 24-hour Total Dust averages calculated for
the week. There is no state or federal standard applicable to total ambient dust levels.
Table 2-2 24-Hour Total Dust
The highest Total Dust 24-hour average of 35 μg/ m3 (recorded at 181 Church Street
on October 2-3, 2013) is greater than the highest PM10 24-hour average of 29 μg/ m3
(recorded at 170 Church Street on Septem ber 20-21, 2013).
2.6 Crystalline Silica Analysis
Crystalline silica analysis for both total and respirable fractions was performed by Galson
Laboratories (Galson) of East Syracuse, New York. Galson is a world leader in industrial
hygiene and monitoring solutions that has been in business for over 43 years. Galson
specializes in air monitoring, sampling and analysis programs conducted in association
with occupational and health and safety professionals. Galson is accredited by the
American Industrial Hygiene Association (AIHA). All dust monitoring stations,
sampling pumps, cyclones, filters and associated air sampling and analysis equipment
was provided to VHB after proper calibration and inspection by Galson personnel.
Samples submitted for crystalline silica analysis were collected in accordance with
the following general protocols:
1. An SKC Aluminum Cyclone respirable dust sampler was used with a collection
filter loaded into a three-piece cassette to allow for respirable dust sample
collection (Note: For Total Dust sample collection no cyclone was used with the
collection filter/ sampling pump assembly);
2. The cyclone-cassette assembly was attached to a sampling pump calibrated by
Galson;
Date Sept. 26-27 Sept. 27-28 Sept. 28-29 Sept. 29-30 9/30-10/01 Oct 1-2 Oct 2-3 Oct 3-4
Time 4:30-4:29 4:30-4:29 4:30-4:29 4:30-4:29 4:30-4:29 4:30-4:29 4:30-4:29 4:30-4:29
Dominant Wind Direction NNE NE-S NE/NW/S NNW-S NNW S-NNW S-NNW NNW
Day R-F F-S S-Su Su-M M-T T-W W-R R-F
Units (ug/m3) (ug/m3) (ug/m3) (ug/m3) (ug/m3) (ug/m3) (ug/m3) (ug/m3) (ug/m3)
Copar
170 Church 6 6 10 7 9 23 30 17
181 Church 5 7 12 8 9 22 35 12
34 Quarry 6 6 11 7 9 17 31 15
School 5 10 16 11 10 21 33 19
U.S. EPA National
Ambient Air
Quality Standard
(NAAQS)
No Standard
Not Tested

\\RI-DATA\projects\72552.00\reports\Final Noise and Dust Report\Report\Privileged and Confidential Dust and Noise Evaluation_112013.docx
39 Dust Evaluation
3. Samples were collected over an 8-hour duration;
4. After sampling, the filter cassette was removed and sealed for shipment to
Galson for analysis;
5. Pre- and post-sample pump flow rates were measured and recorded on
calculation sheets provided to Galson along with the sample and Chain -of-
Custod y paperwork;
Samples were analyzed for Respirable Dust and Crystalline Silica: Quartz in
accord ance with mod. NIOSH Method 0600/ 7500/ mod. OSHA ID-142; or analyzed
for Total Dust and Crystalline Silica: Quartz in accordance with mod. NIOSH
0500/ 7500/ mod. OSHA ID-142.
One set of Total and Respirable Dust samples for crystalline silica analysis were
collected each week. During the PM10 monitoring week, samples were collected on
September 20, 2013. During the Total Dust monitoring week, samples were collected
on September 27, 2013. It is important to note that highest PM10 24-hour average
occurred across the September 20th date. Table 2-3 summarizes the results of the
Total and Resp irable Dust Crystalline Silica analysis.
The only sample reported as containing any Crystalline Silica (CS): Quartz w as the
Total Dust sample collected at Copar Quarry on September 20, 2013. The sample was
reported as containing 100% crystalline silica (i.e. no crystabolite or tryd amite) and
the result was below the OSHA PEL. OSHA is proposing that the PEL for crystallin e
silica in total dust be eliminated and the PEL for crystalline silica in resp irable dust
be reduced to 50 μg/ m3.
15 All other sample resu lts were reported with no detections
at the concentrations noted in the table.
Table 2-3 Total and Respirable Dust Crystalloine Silica Analysis Results
Sampling
Location
September 20, 2013 September 27, 2013
Respirable Sample
PEL
(ug/m3)
Total Sample
PEL
(ug/m3)
Respirable Sample
PEL
(ug/m3)
Total Sample
PEL
(ug/m3) Dust
(ug/m3)
CS as
Quartz
(ug/m3)
%CS Dust
(ug/m3)
CS as
Quartz
(ug/m3)
%CS Dust
(ug/m3)
CS as
Quartz
(ug/m3)
%CS
Dust
(ug/
m3)
CS as
Quart
z
(ug/m
3)
%CS
Copar < 40 < 8 ND
5,000
< 48 13 100 300 NS NS NS
5,000
NS NS NS
170
Church < 40 < 8 ND < 47 < 10 ND
15,000
< 41 < 8 ND < 49 < 10 ND
15,000
181
Church < 41 < 8 ND < 48 < 10 ND < 42 < 8 ND < 43 < 9 ND
34 Quarry < 40 < 8 ND < 50 < 10 ND < 43 < 9 ND < 48 < 10 ND
Bradford
School < 41 < 8 ND < 49 < 10 ND < 41 < 8 ND < 49 < 10 ND
15 “29 CFR Parts 1910, 1915, and 1926 Occupational Exposure to Respirable Crystalline Silica; Proposed Rule,” 78 Federal Register 177 (September 12, 2013), pp. 56445-56446.

\\RI-DATA\projects\72552.00\reports\Final Noise and Dust Report\Report\Privileged and Confidential Dust and Noise Evaluation_112013.docx
40 Dust Evaluation
2.7 Wipe Sample Analysis
Samples were collected by using a filter media to wipe a 10 centimeter (cm) by 10 cm
wipe-sampling template provided by Galson (100 cm2). The sampling filter media
was sealed , labeled and delivered to Galson under proper Chain -of-Custody
procedures for total crystalline silica analysis by ana lytical method mod. NIOSH
7500/ MOD. OSHA ID-142. One wipe sample was collected during the PM10
monitoring week and the Total Dust monitoring week at each of the residences,
Bradford School, and on top of the Water Tank.
Residential wipe samples were collected at locations requested by the property
owners as follows:
Property Week 1 Location Week 2 Location
34 Quarry Road Interior Dining Room Window Sill Exterior Glass Table Top
170 Church Street Exterior Porch Window Sill Facing
Quarry
Adjacent to Week 1 Sample/
Same Location
181 Church Street Exterior Glass Table Top Adjacent to Week 1 Sample/
Same Location
Bradford School Exterior Top of AC Unit
East Side/ Northern Most Unit
Adjacent to Week 1 Sample/
Same Location
Water Tank Top of Water Tank Adjacent to Week 1 Sample/
Same Location
Table 2-4 Wipe Sampling Results
Sampling Location
September 20, 2013 September 27, 2013
Average
CS as Quartz
(mg/cm2)
CS as Quartz
(mg/cm2)
34 Quarry 0.0027 0.00042 0.00156
Water Tank 0.00072 0.00095 0.000835
Bradford School 0.0019 0.0010 0.00145
181 Church 0.00017 0.0017 0.000935
170 Church 0.0016 0.0023 0.00195
VHB could find no regulatory criteria for concentrations of total crystalline silica in
settled dust. Recommendations made in the WTC Background Study Report and
Benchmark Report which established health-based standards to be used during cleanup
of residential properties in lower Manhattan affected by the WTC collapse recommended
use of airborne criteria for crystalline silica concentrations and recommended no health
based standard for crystalline silica in settled dust. The report noted this
recommendation was made because the health risk posed by crystalline silica is in its
ability to become airborne, or re-entrained in the air, and thus inhaled.

\\RI-DATA\projects\72552.00\reports\Final Noise and Dust Report\Report\Privileged and Confidential Dust and Noise Evaluation_112013.docx
41 Dust Evaluation
2.8 Dust Evaluation Study Summary
The 24-hour PM10 averages recorded and calculated between September 16 and
September 25, 2013 d id not exceed the U.S. EPA NAAQS PM10 Standard of 150
μg/ m3. Results obtained during the PM10 monitoring were consistent with those
levels reported by the RIDEM for the ambient monitoring stations in the State of
Rhode Island .
Respirable Dust crystalline silica samples collected on September 20, 2013 (the
highest 24-hour average PM10 d ay) and on September 27, 2013 contained no levels of
repirable crystalline silica above the laboratory reporting limit (aka not detectable).
Total Dust crystalline silica samples collected on September 20 and 27, 2013 revealed total
crystalline silica in the sample collected at Copar Quarry on September 20 at a
concentration of 13 μg/ m3. The OSHA PEL of 300 μg/ m
3, and the proposed OSHA PEL
of 50 μg/ m3 were not exceeded. The OSHA proposed rule (78 FR 177, September 12,
2013) is recommending elimination of the total dust PEL for crystalline silica.
The dust evaluation d id not identify numeric exceed ances of established and
applicable standard s. Evaluation of the graphs for the study period ind icate that
wind d irection and wind speed during that interval varied over the course of the
weeks, days, and within the course of 24 hours. Cop ar activities during the week
VHB was on-site were observed to include crushing, screening, stockpiling, trucking,
load ing/ unload ing, and blasting. It is important to note that the monitoring resu lts
are affected by the entire combination of activities being conducted , wind speed and
d irection, and mitigative efforts. Therefore, results may be d ifferent at d ifferent times
of the year.

\\RI-DATA\projects\72552.00\reports\Final Noise and Dust Report\Report\Privileged and Confidential Dust and Noise Evaluation_112013.docx
42 Conclusions
3 Conclusions
The noise analysis evaluated the sound levels associated with the operation of the
Copar Quarry and identified noise mitigation measures to substantially reduce the
sound levels. Analysis of the noise d ata identified sound occurrences specific to
quarry operations, and based on aud io record ings the cause of the each occurrence
was identified as best as possible. Truck traffic specific to quarry activities was found
to be the primary source of noise occurrences attributed to the quarry. Based on the
noise analysis there was only one quarry-related sound occurrence that does not
comply with the stand ards which occurred at 65 Quarry Road , and is attribu ted to
truck traffic. The sound levels for this occurrence was over 60 dB(A) and lasted for
only one second . An extension to an existing earth berm was identified as an
appropriate noise mitigation measure. The earth berm would provide noise blockage
to local residences and provide substantial sound level reductions. Consideration
should also be given to ad justing the noise ord inance level to criteria more consistent
with other rural communities.
The dust evaluation d id not identify numeric exceed ances of established and
applicable standard s. Evaluation of the graphs for the study period ind icate that
wind d irection and wind speed during that interval varied over the course of the
weeks, days, and within the course of 24 hours. Copar activities during the week
VHB was on-site were observed to include crushing, screening, stockpiling, trucking,
load ing/ unload ing, and blasting. It is important to note that the monitoring resu lts
are affected by the entire combination of activities being conducted , wind speed and
d irection, and mitigative efforts. Therefore, results may be d ifferent at d ifferent times
of the year. Although dust suppression by means of water spraying is being
conducted at the quarry, the use of other mitigation efforts includ ing, but not limited
to, the following should be considered where appropriate and / or applicable:
Wind Breaks: Natural or constructed barriers that reduce wind velocity
through a site and thereby reduce the possibility of suspended par ticles.
These can include trees or shrubs, w ind fences, tarp curtains, or hay bales;
Stone: Stone can aid in minimizing dust generation on unpaved haul roads;
Tarping: Ensure trucks exiting the site are tarped to minimize dust;

\\RI-DATA\projects\72552.00\reports\Final Noise and Dust Report\Report\Privileged and Confidential Dust and Noise Evaluation_112013.docx
43 Conclusions
Speed Limits: Restrict speeds to 10-15 mph for unpaved haul road s to
minimize dust;
Dust Removal from Tires/ Undercarriage: Implement procedures to remove
mud and/ or d irt from the wheels of vehicles that have traveled through
unpaved quarry areas before leaving the site (i.e. a crushed stone or other
type of rumble strip);
Regrade Haul Road s: Period ically (i.e. monthly) regrade haul road s to
remove/ minimize loose/ fine material;
Wind Monitoring: Monitoring wind speed and d irection and modify/ ad just
quarry operations or increase du st suppression activities if predominant w ind
d irections are from the SSE and wind is gusting at speeds of concern;
Dust Collectors on Drill Bits: Consider the use of dust collectors on rock drills
to minimize emissions of fine dust particles;
Blast Mats: Evaluate the use of blast mats to minimize dust generation
and / or rock fly.