Embed Size (px)
Citation preview

Prepared by: C. Douglas Cloud
Professor Emeritus of Accounting
Pepperdine University
© 2011 Cengage Learning. All Rights Reserved. May not be copied, scanned, or duplicated, in whole or in part, except for use as
permitted in a license distributed with a certain product or service or otherwise on a password-protected website for classroom use.
Chapter 24
Differential Analysis and Product Pricing

© 2011 Cengage Learning. All Rights Reserved. May not be copied, scanned, or duplicated, in whole or in part, except for use as
permitted in a license distributed with a certain product or service or otherwise on a password-protected website for classroom use.
Learning Objectives
1. Prepare differential analysis reports for a
variety of managerial decisions.
2. Determine the selling price of a product,
using the product cost concept.
3. Compute the relative profitability of
products in bottleneck production
processes.

© 2011 Cengage Learning. All Rights Reserved. May not be copied, scanned, or duplicated, in whole or in part, except for use as
permitted in a license distributed with a certain product or service or otherwise on a password-protected website for classroom use.
Learning Objective 1
Prepare differential
analysis reports for a
variety of managerial
decisions.

© 2011 Cengage Learning. All Rights Reserved. May not be copied, scanned, or duplicated, in whole or in part, except for use as
permitted in a license distributed with a certain product or service or otherwise on a password-protected website for classroom use.
Managerial decision making involves
choosing between alternative courses of
action.
LO 1
Differential Analysis

© 2011 Cengage Learning. All Rights Reserved. May not be copied, scanned, or duplicated, in whole or in part, except for use as
permitted in a license distributed with a certain product or service or otherwise on a password-protected website for classroom use.
Managerial Decision Making
Step 1: Identify the
objective of
the decision
Step 2: Identify the
alternative
courses of
action
Step 3: Gather relevant
information and
perform differential
analysis.
Step 4: Make a
decision
Step 5: Review, analyze, and
assess the results of
the decision
Differential Analysis
LO 1

© 2011 Cengage Learning. All Rights Reserved. May not be copied, scanned, or duplicated, in whole or in part, except for use as
permitted in a license distributed with a certain product or service or otherwise on a password-protected website for classroom use.
Differential Analysis
LO 1
Bryant Restaurants, Inc.
Step 1: Identify the
objective of
the decision
Step 2: Identify the
alternative
courses of
action
Step 5: Review, analyze, and
assess the results of
the decision
Step 3: Gather relevant
information and
perform differential
analysis.
Step 4: Make a
decision
Tables Salad
Bar
Revenues $100,000 $120,000
Costs 60,000 65,000
Income $ 40,000 $ 55,000
Increase
its income.
Use floor
space for
existing
tables, or…
replace the
tables with a
salad bar.

© 2011 Cengage Learning. All Rights Reserved. May not be copied, scanned, or duplicated, in whole or in part, except for use as
permitted in a license distributed with a certain product or service or otherwise on a password-protected website for classroom use.
Differential Analysis
Differential analysis, sometimes called
incremental analysis, analyzes differential
revenues and costs to determine the
differential impact on income of two
alternative courses of action.
LO 1

© 2011 Cengage Learning. All Rights Reserved. May not be copied, scanned, or duplicated, in whole or in part, except for use as
permitted in a license distributed with a certain product or service or otherwise on a password-protected website for classroom use.
Differential Analysis
Differential revenue is the amount of
increase or decrease in revenue that is
expected from a course of action as
compared to an alternative.
LO 1

© 2011 Cengage Learning. All Rights Reserved. May not be copied, scanned, or duplicated, in whole or in part, except for use as
permitted in a license distributed with a certain product or service or otherwise on a password-protected website for classroom use.
Differential Analysis
Differential cost is the amount of increase or
decrease in cost that is expected from a
course of action as compared to an
alternative.
LO 1

© 2011 Cengage Learning. All Rights Reserved. May not be copied, scanned, or duplicated, in whole or in part, except for use as
permitted in a license distributed with a certain product or service or otherwise on a password-protected website for classroom use.
Differential Analysis
Differential income (loss) is the difference
between the differential revenue and the
differential costs.
Differential income indicates that a
particular decision is expected to be
profitable, while a differential loss indicates
that the decision is expected to decrease
income.
LO 1

© 2011 Cengage Learning. All Rights Reserved. May not be copied, scanned, or duplicated, in whole or in part, except for use as
permitted in a license distributed with a certain product or service or otherwise on a password-protected website for classroom use.
LO 1
Differential Analysis

© 2011 Cengage Learning. All Rights Reserved. May not be copied, scanned, or duplicated, in whole or in part, except for use as
permitted in a license distributed with a certain product or service or otherwise on a password-protected website for classroom use.
In this chapter, differential analysis is
illustrated for the following common
decisions:
1. Leasing or selling equipment
2. Discontinuing an unprofitable segment
3. Manufacturing or purchasing a needed part
4. Replacing fixed assets
5. Processing further or selling a product
6. Accepting additional business at a special price
LO 1
Differential Analysis

© 2011 Cengage Learning. All Rights Reserved. May not be copied, scanned, or duplicated, in whole or in part, except for use as
permitted in a license distributed with a certain product or service or otherwise on a password-protected website for classroom use.
Lease or Sell
On June 22, 2012, Marcus Company is considering
leasing or disposing of the following equipment: Cost of equipment $200,000
Less accumulated depreciation 120,000
Book value $ 80,000
Lease Option:
Total revenue for five-year lease 160,000
Total estimated repair, insurance, and
property tax expenses during life of lease 35,000
Residual value at end of 5th year of lease 0
Sell Option:
Sales price $100,000
Commission on sales 6%
LO 1
(continued)

© 2011 Cengage Learning. All Rights Reserved. May not be copied, scanned, or duplicated, in whole or in part, except for use as
permitted in a license distributed with a certain product or service or otherwise on a password-protected website for classroom use.
Lease or Sell
Marcus Company
uses differential
analysis to make the
decision. Exhibit 2
(next slide) provides
key information for
making this decision.
LO 1
(continued)

© 2011 Cengage Learning. All Rights Reserved. May not be copied, scanned, or duplicated, in whole or in part, except for use as
permitted in a license distributed with a certain product or service or otherwise on a password-protected website for classroom use.
Lease or Sell
Lease the
equipment
LO 1

© 2011 Cengage Learning. All Rights Reserved. May not be copied, scanned, or duplicated, in whole or in part, except for use as
permitted in a license distributed with a certain product or service or otherwise on a password-protected website for classroom use.
Lease or Sell
LO 1
The book value of equipment is a sunk cost
and is not considered in the differential
analysis.
Sunk costs are costs that have been
incurred in the past, cannot be recouped,
and are not relevant to future decisions.

© 2011 Cengage Learning. All Rights Reserved. May not be copied, scanned, or duplicated, in whole or in part, except for use as
permitted in a license distributed with a certain product or service or otherwise on a password-protected website for classroom use.
EE 24-1

© 2011 Cengage Learning. All Rights Reserved. May not be copied, scanned, or duplicated, in whole or in part, except for use as
permitted in a license distributed with a certain product or service or otherwise on a password-protected website for classroom use.
Discontinue a Segment or Product
Management may consider discontinuing a
product or segment of a business that is
generating losses. Based on the information in the
condensed income statement in Exhibit 3 (next
slide), management of Battle Creek Cereal Co. is
considering discontinuing Bran Flakes.
LO 1
B attle C reek

© 2011 Cengage Learning. All Rights Reserved. May not be copied, scanned, or duplicated, in whole or in part, except for use as
permitted in a license distributed with a certain product or service or otherwise on a password-protected website for classroom use.
Discontinue a Segment or Product
Don’t discontinue Bran Flakes!
LO 1
B attle C reek

© 2011 Cengage Learning. All Rights Reserved. May not be copied, scanned, or duplicated, in whole or in part, except for use as
permitted in a license distributed with a certain product or service or otherwise on a password-protected website for classroom use.
Discontinue a Segment or Product
LO 1
B attle C reek

© 2011 Cengage Learning. All Rights Reserved. May not be copied, scanned, or duplicated, in whole or in part, except for use as
permitted in a license distributed with a certain product or service or otherwise on a password-protected website for classroom use.
EE 24-2

© 2011 Cengage Learning. All Rights Reserved. May not be copied, scanned, or duplicated, in whole or in part, except for use as
permitted in a license distributed with a certain product or service or otherwise on a password-protected website for classroom use.
Make or Buy
Companies often
manufacture
products made up
of components that
are assembled into
a final product.
Should they make
or buy the parts?
LO 1

© 2011 Cengage Learning. All Rights Reserved. May not be copied, scanned, or duplicated, in whole or in part, except for use as
permitted in a license distributed with a certain product or service or otherwise on a password-protected website for classroom use.
Make or Buy
An automobile manufacturer has been purchasing
instrument panels for $240 a unit. The factory
currently operates at 80% of capacity. The cost per
unit of manufacturing a panel internally is
estimated as follows:
Direct materials $ 80
Direct labor 80
Variable factory overhead 52
Fixed factory overhead 68
Total estimated cost per unit $280
LO 1

© 2011 Cengage Learning. All Rights Reserved. May not be copied, scanned, or duplicated, in whole or in part, except for use as
permitted in a license distributed with a certain product or service or otherwise on a password-protected website for classroom use.
Make or Buy
LO 1

© 2011 Cengage Learning. All Rights Reserved. May not be copied, scanned, or duplicated, in whole or in part, except for use as
permitted in a license distributed with a certain product or service or otherwise on a password-protected website for classroom use.
EE 24-3

© 2011 Cengage Learning. All Rights Reserved. May not be copied, scanned, or duplicated, in whole or in part, except for use as
permitted in a license distributed with a certain product or service or otherwise on a password-protected website for classroom use.
EE 24-3

© 2011 Cengage Learning. All Rights Reserved. May not be copied, scanned, or duplicated, in whole or in part, except for use as
permitted in a license distributed with a certain product or service or otherwise on a password-protected website for classroom use.
Replace Equipment
On November 28, 2012, a business is
considering replacing the following machine:
Old Machine:
Book value $100,000
Estimated annual variable
manufacturing costs 225,000
Estimated selling price 25,000
Estimated remaining useful life 5 years
(continued)
LO 1

© 2011 Cengage Learning. All Rights Reserved. May not be copied, scanned, or duplicated, in whole or in part, except for use as
permitted in a license distributed with a certain product or service or otherwise on a password-protected website for classroom use.
Replace Equipment
The business is considering replacing the old
machine with a new one, as shown below: Old New
Book value $100,000
Cost of new machine $250,000
Estimated annual variable
manufacturing costs 225,000 150,000
Estimated selling price 25,000
Estimated residual value 0
Estimated remaining useful life 5 years 5 years
(continued)
LO 1

© 2011 Cengage Learning. All Rights Reserved. May not be copied, scanned, or duplicated, in whole or in part, except for use as
permitted in a license distributed with a certain product or service or otherwise on a password-protected website for classroom use.
Replace Equipment
LO 1
replace old
machine

© 2011 Cengage Learning. All Rights Reserved. May not be copied, scanned, or duplicated, in whole or in part, except for use as
permitted in a license distributed with a certain product or service or otherwise on a password-protected website for classroom use.
Replace Equipment
The revenue that is forgone from an
alternative use of an asset, such as cash, is
called an opportunity cost.
Although the opportunity cost is not
recorded in the accounting records, it is
useful in analyzing alternative courses of
action.
LO 1

© 2011 Cengage Learning. All Rights Reserved. May not be copied, scanned, or duplicated, in whole or in part, except for use as
permitted in a license distributed with a certain product or service or otherwise on a password-protected website for classroom use.
EE 24-4

© 2011 Cengage Learning. All Rights Reserved. May not be copied, scanned, or duplicated, in whole or in part, except for use as
permitted in a license distributed with a certain product or service or otherwise on a password-protected website for classroom use.
EE 24-4

© 2011 Cengage Learning. All Rights Reserved. May not be copied, scanned, or duplicated, in whole or in part, except for use as
permitted in a license distributed with a certain product or service or otherwise on a password-protected website for classroom use.
In some cases, a product can be sold at an
intermediate stage of production, or it can
be processed further and then sold.
LO 1
Process or Sell

© 2011 Cengage Learning. All Rights Reserved. May not be copied, scanned, or duplicated, in whole or in part, except for use as
permitted in a license distributed with a certain product or service or otherwise on a password-protected website for classroom use.
A business produces kerosene as follows:
Batch size 4,000 gallons
Cost of producing kerosene $2,400 per batch
Selling price $2.50 per gallon
Process or Sell
LO 1
(continued)

© 2011 Cengage Learning. All Rights Reserved. May not be copied, scanned, or duplicated, in whole or in part, except for use as
permitted in a license distributed with a certain product or service or otherwise on a password-protected website for classroom use.
The kerosene can be processed further to yield
gasoline as follows: Input batch size 4,000 gallons
Less evaporation (20%) 800 (4,000 x 20%)
Output batch size 3,200
Cost of producing
gasoline $3,050 per batch
Selling price $3.50 per gallon
(continued)
Process or Sell
LO 1

© 2011 Cengage Learning. All Rights Reserved. May not be copied, scanned, or duplicated, in whole or in part, except for use as
permitted in a license distributed with a certain product or service or otherwise on a password-protected website for classroom use.
Process or Sell
LO 1
process
further
© 2011 Cengage Learning. All Rights Reserved. May not be copied, scanned, or duplicated, in whole or in part, except for use as
permitted in a license distributed with a certain product or service or otherwise on a password-protected website for classroom use.
EE 24-5

© 2011 Cengage Learning. All Rights Reserved. May not be copied, scanned, or duplicated, in whole or in part, except for use as
permitted in a license distributed with a certain product or service or otherwise on a password-protected website for classroom use.
Accept Business at a Special Price
LO 1
The differential costs of accepting
additional business depend on whether the
company is operating at full capacity.
If the company is operating at full capacity,
any additional production increases fixed and variable manufacturing costs.
If the company is operating below full
capacity, any additional production does
not increase fixed manufacturing costs.

© 2011 Cengage Learning. All Rights Reserved. May not be copied, scanned, or duplicated, in whole or in part, except for use as
permitted in a license distributed with a certain product or service or otherwise on a password-protected website for classroom use.
Accept Business at a Special Price
LO 1
B-Ball Inc. manufactures basketballs as follows:
Monthly productive capacity 12,500 basketballs
Current monthly sales 10,000 basketballs
Normal (domestic) selling price $30.00 per basketball
Manufacturing costs:
Variable costs $12.50 per basketball
Fixed costs 7.50
Total $20.00 per basketball
(continued)

© 2011 Cengage Learning. All Rights Reserved. May not be copied, scanned, or duplicated, in whole or in part, except for use as
permitted in a license distributed with a certain product or service or otherwise on a password-protected website for classroom use.
Accept Business at a Special Price
LO 1
On March 10, 2012, B-Ball Inc. receives an offer from
an exporter for 5,000 basketballs at $18 each.
Production can be spread over three months, so these
basketballs can be manufactured using normal
capacity. The domestic market will not be affected.
(continued)

© 2011 Cengage Learning. All Rights Reserved. May not be copied, scanned, or duplicated, in whole or in part, except for use as
permitted in a license distributed with a certain product or service or otherwise on a password-protected website for classroom use.
Accept Business at a Special Price
LO 1

© 2011 Cengage Learning. All Rights Reserved. May not be copied, scanned, or duplicated, in whole or in part, except for use as
permitted in a license distributed with a certain product or service or otherwise on a password-protected website for classroom use.
EE 24-6

© 2011 Cengage Learning. All Rights Reserved. May not be copied, scanned, or duplicated, in whole or in part, except for use as
permitted in a license distributed with a certain product or service or otherwise on a password-protected website for classroom use.
EE 24-6
© 2011 Cengage Learning. All Rights Reserved. May not be copied, scanned, or duplicated, in whole or in part, except for use as
permitted in a license distributed with a certain product or service or otherwise on a password-protected website for classroom use.
Learning Objective 2
Determine the
selling price of a
product, using the
product cost
concept.

© 2011 Cengage Learning. All Rights Reserved. May not be copied, scanned, or duplicated, in whole or in part, except for use as
permitted in a license distributed with a certain product or service or otherwise on a password-protected website for classroom use.
Setting Normal Product Selling Prices
The basic approaches to setting prices are:
Market methods
Demand-based concept
Competition-based concept
Cost-plus methods
Total cost concept
Product cost concept
Variable cost concept
LO 2

© 2011 Cengage Learning. All Rights Reserved. May not be copied, scanned, or duplicated, in whole or in part, except for use as
permitted in a license distributed with a certain product or service or otherwise on a password-protected website for classroom use.
Setting Normal Product Selling Prices
The demand-based concept sets the price
according to the demand for the product.
The competition-based concept sets the
price according to the price offered by
competitors.
LO 2

© 2011 Cengage Learning. All Rights Reserved. May not be copied, scanned, or duplicated, in whole or in part, except for use as
permitted in a license distributed with a certain product or service or otherwise on a password-protected website for classroom use.
Under the product cost concept, only the
costs of manufacturing the product, termed
the product costs, are included in the cost
amount per unit to which the markup is
added.
LO 2
Product Cost Concept

© 2011 Cengage Learning. All Rights Reserved. May not be copied, scanned, or duplicated, in whole or in part, except for use as
permitted in a license distributed with a certain product or service or otherwise on a password-protected website for classroom use.
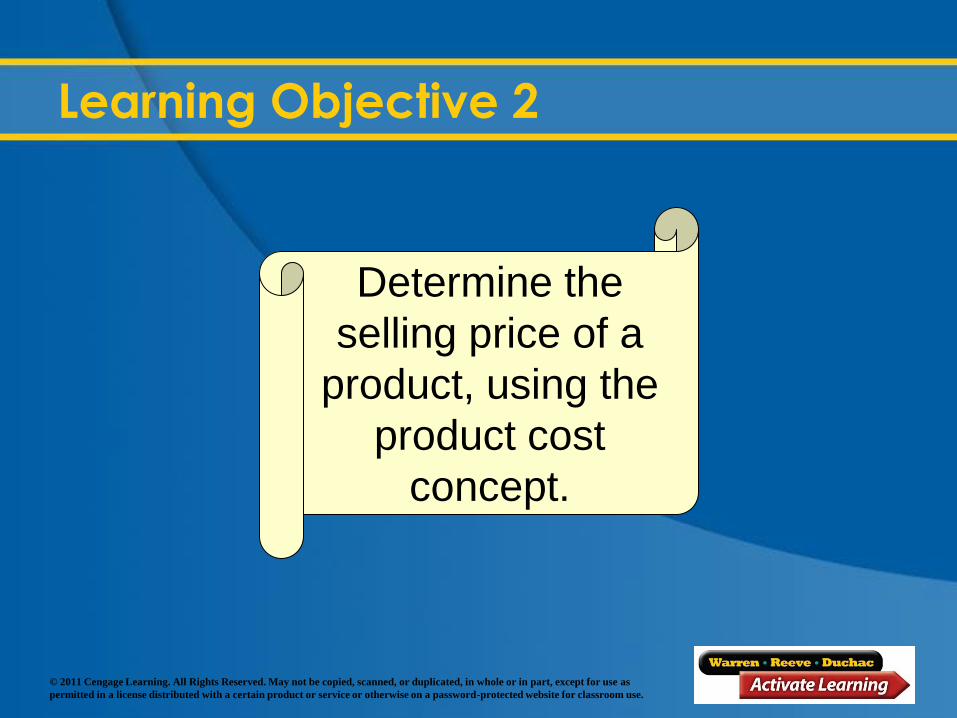
Step 1: Estimate the total product costs as
follows:
LO 2
Product costs:
Direct materials $XXX
Direct labor XXX
Factory overhead XXX
Total product cost $XXX
Product Cost Concept

© 2011 Cengage Learning. All Rights Reserved. May not be copied, scanned, or duplicated, in whole or in part, except for use as
permitted in a license distributed with a certain product or service or otherwise on a password-protected website for classroom use.
Step 2: Estimate the total selling and
administrative expenses.
LO 2
Product Cost Concept

© 2011 Cengage Learning. All Rights Reserved. May not be copied, scanned, or duplicated, in whole or in part, except for use as
permitted in a license distributed with a certain product or service or otherwise on a password-protected website for classroom use.
Step 3: Divide the total product cost by the
number of units expected to be
produced and sold to determine the
total product cost per unit, as shown
below.
Product Cost Concept
LO 2
Product Cost per unit = Total Product Cost
Estimated Units
Produced and Sold

© 2011 Cengage Learning. All Rights Reserved. May not be copied, scanned, or duplicated, in whole or in part, except for use as
permitted in a license distributed with a certain product or service or otherwise on a password-protected website for classroom use.
Step 4. Compute the markup percentage
as follows:
Product Cost Concept
LO 2
Markup Percentage =
Desired Profit + Total Selling
and Administrative Expenses
Total Product Cost

© 2011 Cengage Learning. All Rights Reserved. May not be copied, scanned, or duplicated, in whole or in part, except for use as
permitted in a license distributed with a certain product or service or otherwise on a password-protected website for classroom use.
Step 5. Determine the markup per unit by
multiplying the markup percentage
times the product cost per unit as
follows:
Product Cost Concept
LO 2
Markup per Unit = Markup Percentage x Product Cost per Unit

© 2011 Cengage Learning. All Rights Reserved. May not be copied, scanned, or duplicated, in whole or in part, except for use as
permitted in a license distributed with a certain product or service or otherwise on a password-protected website for classroom use.
Step 6. Determine the normal selling price
by adding the markup per unit to
the product cost per unit as follows:
Product Cost Concept
LO 2
Total product cost per unit $XXX
Markup per unit XXX
Normal selling price per unit $XXX

© 2011 Cengage Learning. All Rights Reserved. May not be copied, scanned, or duplicated, in whole or in part, except for use as
permitted in a license distributed with a certain product or service or otherwise on a password-protected website for classroom use.
Product Cost Concept
LO 2
Manufacturing costs:
Direct materials ($3.00 x 100,000) $ 300,000
Direct labor ($10.00 x 100,000) 1,000,000
Factory overhead 200,000
Total Manufacturing costs $1,500,000
Selling and administrative expenses 170,000
Total cost $1,670,000
Total assets $800,000
Desired rate of return 20%
Assume the following data for 100,000 calculators
that Digital Solutions Inc. expects to produce and sell
during the current year:
© 2011 Cengage Learning. All Rights Reserved. May not be copied, scanned, or duplicated, in whole or in part, except for use as
permitted in a license distributed with a certain product or service or otherwise on a password-protected website for classroom use.
Product Cost Concept
LO 2
Step 1: Estimate the total product cost as
follows:
Product costs:
Direct materials $ XXXXX
Direct labor XXXXX
Factory overhead XXX
Total product cost $1,500,000

© 2011 Cengage Learning. All Rights Reserved. May not be copied, scanned, or duplicated, in whole or in part, except for use as
permitted in a license distributed with a certain product or service or otherwise on a password-protected website for classroom use.
Step 2: Estimate the total selling and
administrative expenses.
Product Cost Concept
LO 2
Management expects total
selling and administrative
expenses to be $170,000.

© 2011 Cengage Learning. All Rights Reserved. May not be copied, scanned, or duplicated, in whole or in part, except for use as
permitted in a license distributed with a certain product or service or otherwise on a password-protected website for classroom use.
Step 3: Divide the total product cost by the
number of units expected to be
produced and sold to determine the
total product cost per unit, as shown
below.
Product Cost Concept
LO 2
Product Cost per Unit = Total Product Cost
Estimated Units Produced
and Sold
= $1,500,000
100,000 units = $15.00 per unit

© 2011 Cengage Learning. All Rights Reserved. May not be copied, scanned, or duplicated, in whole or in part, except for use as
permitted in a license distributed with a certain product or service or otherwise on a password-protected website for classroom use.
Step 4. Compute the markup percentage
as follows:
Product Cost Concept
LO 2
Markup Percentage =
Desired Profit + Total Selling and
Administrative Expenses
Total Product Cost
Markup Percentage = $160,000 + $170,000
$1,500,000
Markup Percentage = $330,000
$1,500,000 = 22%
Desired Rate of
Return x Total
Assets
0.20 x $800,000

© 2011 Cengage Learning. All Rights Reserved. May not be copied, scanned, or duplicated, in whole or in part, except for use as
permitted in a license distributed with a certain product or service or otherwise on a password-protected website for classroom use.
Product Cost Concept
LO 2
Step 5. Determine the markup per unit by
multiplying the markup percentage
times the product cost per unit as
follows:
Markup per Unit = Markup Percentage x Product Cost per Unit
Markup per Unit = 22% x $15.00 = $3.30 per unit

© 2011 Cengage Learning. All Rights Reserved. May not be copied, scanned, or duplicated, in whole or in part, except for use as
permitted in a license distributed with a certain product or service or otherwise on a password-protected website for classroom use.
Step 6. Determine the normal selling price
by adding the markup per unit to
the product cost per unit as follows:
LO 2
Total product cost per unit $15.00
Markup per unit 3.30
Normal selling price per unit $18.30
Product Cost Concept

© 2011 Cengage Learning. All Rights Reserved. May not be copied, scanned, or duplicated, in whole or in part, except for use as
permitted in a license distributed with a certain product or service or otherwise on a password-protected website for classroom use.
Product Cost Concept
LO 2
Manufacturing
Cost
Product Cost
Markup Administrative
Expense
+
Selling Expense
+
Desired Profit

© 2011 Cengage Learning. All Rights Reserved. May not be copied, scanned, or duplicated, in whole or in part, except for use as
permitted in a license distributed with a certain product or service or otherwise on a password-protected website for classroom use.
EE 24-7

© 2011 Cengage Learning. All Rights Reserved. May not be copied, scanned, or duplicated, in whole or in part, except for use as
permitted in a license distributed with a certain product or service or otherwise on a password-protected website for classroom use.
Target Costing
Target costing is a method of setting prices
that combines market-based pricing with a
cost-reduction emphasis. A future selling
price is anticipated, using the demand-
based or the competition-based methods.
LO 2
Target Cost = Expected Selling Price –
Desired Profit

© 2011 Cengage Learning. All Rights Reserved. May not be copied, scanned, or duplicated, in whole or in part, except for use as
permitted in a license distributed with a certain product or service or otherwise on a password-protected website for classroom use.
Target Costing
LO 2
The planned cost reduction is sometimes
referred to as the cost “drift.” Costs can be
reduced in a variety of ways such as:
Simplifying the design
Reducing the cost of direct materials
Reducing the direct labor costs
Eliminating waste

© 2011 Cengage Learning. All Rights Reserved. May not be copied, scanned, or duplicated, in whole or in part, except for use as
permitted in a license distributed with a certain product or service or otherwise on a password-protected website for classroom use.
Target Costing
LO 2

© 2011 Cengage Learning. All Rights Reserved. May not be copied, scanned, or duplicated, in whole or in part, except for use as
permitted in a license distributed with a certain product or service or otherwise on a password-protected website for classroom use.
Learning Objective 3
Compute the relative
profitability of
products in bottleneck
production processes.

© 2011 Cengage Learning. All Rights Reserved. May not be copied, scanned, or duplicated, in whole or in part, except for use as
permitted in a license distributed with a certain product or service or otherwise on a password-protected website for classroom use.
Production Bottlenecks, Pricing, and Profits
A production bottleneck (or constraint) is a
point in the manufacturing process where
the demand for the company’s product
exceeds the ability to produce the product.
LO 3

© 2011 Cengage Learning. All Rights Reserved. May not be copied, scanned, or duplicated, in whole or in part, except for use as
permitted in a license distributed with a certain product or service or otherwise on a password-protected website for classroom use.
Production Bottlenecks, Pricing, and Profits
The theory of constraints (TOC) is a
manufacturing strategy that focuses on
reducing the influence of bottlenecks on
production processes.
LO 3

© 2011 Cengage Learning. All Rights Reserved. May not be copied, scanned, or duplicated, in whole or in part, except for use as
permitted in a license distributed with a certain product or service or otherwise on a password-protected website for classroom use.
Production Bottlenecks and Profits
PrideCraft Tool Company makes
three types of wrenches: small,
medium, and large. All three
products are processed through a
heat treatment operation, which
hardens the steel tools. PrideCraft
Tool’s heat treatment process is
operating at full capacity and is a
production bottleneck.
LO 3
(continued)

© 2011 Cengage Learning. All Rights Reserved. May not be copied, scanned, or duplicated, in whole or in part, except for use as
permitted in a license distributed with a certain product or service or otherwise on a password-protected website for classroom use.
Production Bottlenecks and Profits
LO 3
Small Medium Large
Wrench Wrench Wrench
The product unit contribution margin and the
number of hours of heat treatment used by each
type of wrench are as follows:
Sales price per unit $130 $140 $160
Variable cost per unit 40 40 40
Contribution margin per unit $ 90 $100 $120
Heat treatment hours per unit 1 hr. 4 hrs. 8 hrs.
(continued)

© 2011 Cengage Learning. All Rights Reserved. May not be copied, scanned, or duplicated, in whole or in part, except for use as
permitted in a license distributed with a certain product or service or otherwise on a password-protected website for classroom use.
Production Bottlenecks and Profits
LO 3
= Unit Contribution Margin
Heat Treatment Hours per Unit
Small Wrenches
Unit Contribution Margin per
Production Bottleneck Hour =
$90
1 hr.
= $90 per hour
Medium Wrenches
Unit Contribution Margin per
Production Bottleneck Hour =
$100
4 hrs. = $25 per hour
Large Wrenches
Unit Contribution Margin per
Production Bottleneck Hour =
$120
8 hrs. = $15 per hour
Unit Contribution Margin per
Production Bottleneck Hour
$90 per hour
The small wrench is the
most profitable product
per bottleneck hour.

© 2011 Cengage Learning. All Rights Reserved. May not be copied, scanned, or duplicated, in whole or in part, except for use as
permitted in a license distributed with a certain product or service or otherwise on a password-protected website for classroom use.
PrideCraft Tool Company can improve the
profitability of producing the large wrenches by
any combination of the following:
Increase the selling price of the large
wrenches.
Decrease the variable cost per unit of the
large wrenches.
Decrease the heat treatment hours
required for the large wrenches.
Production Bottlenecks and Pricing
LO 3

© 2011 Cengage Learning. All Rights Reserved. May not be copied, scanned, or duplicated, in whole or in part, except for use as
permitted in a license distributed with a certain product or service or otherwise on a password-protected website for classroom use.
EE 24-8

© 2011 Cengage Learning. All Rights Reserved. May not be copied, scanned, or duplicated, in whole or in part, except for use as
permitted in a license distributed with a certain product or service or otherwise on a password-protected website for classroom use.
Production Bottlenecks and Pricing
LO 3
How much should PrideCraft Tool Co. charge for
the large wrench in order to deliver the same
contribution margin of $90 that is being provided
by the small wrench?
(continued)

© 2011 Cengage Learning. All Rights Reserved. May not be copied, scanned, or duplicated, in whole or in part, except for use as
permitted in a license distributed with a certain product or service or otherwise on a password-protected website for classroom use.
Production Bottlenecks and Pricing
LO 3
Contribution
Margin (per unit)
per Bottleneck
Hour for Small
Wrench
=
Revised Price of
Large Wrench
Variable Cost per Unit
for Large Wrench –
Bottleneck Hours per Unit for
Large Wrench
$90 =
Revised Price of
Large Wrench – $40
8
$720 = Revised Price of Large Wrench – $40
$760 = Revised Price of Large Wrench
(continued)

© 2011 Cengage Learning. All Rights Reserved. May not be copied, scanned, or duplicated, in whole or in part, except for use as
permitted in a license distributed with a certain product or service or otherwise on a password-protected website for classroom use.
Proof
Unit Contribution Margin
per Bottleneck Hour =
Unit Contribution Margin
Heat Treatment Hours per Unit
Unit Contribution Margin
per Bottleneck Hour =
$760 - $40
8 hrs.
Unit Contribution Margin
per Bottleneck Hour = $90 per hr.
Production Bottlenecks and Pricing
LO 3
(concluded)

© 2011 Cengage Learning. All Rights Reserved. May not be copied, scanned, or duplicated, in whole or in part, except for use as
permitted in a license distributed with a certain product or service or otherwise on a password-protected website for classroom use.
Appendix
Total and Variable
Cost Concepts to
Setting Normal Price
© 2011 Cengage Learning. All Rights Reserved. May not be copied, scanned, or duplicated, in whole or in part, except for use as
permitted in a license distributed with a certain product or service or otherwise on a password-protected website for classroom use.
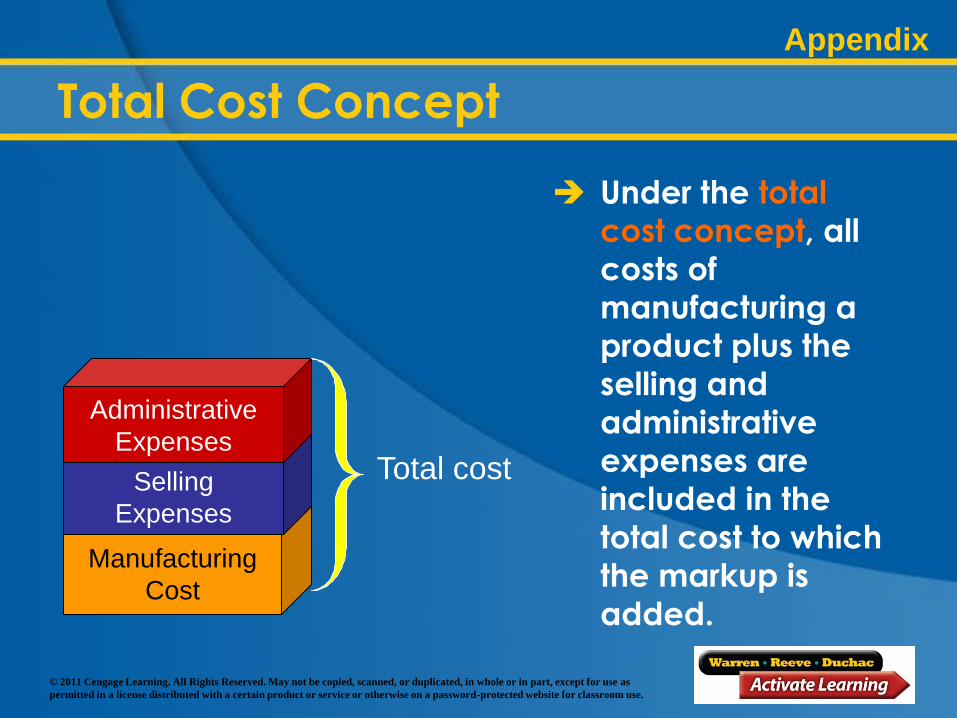
Under the total
cost concept, all
costs of
manufacturing a
product plus the
selling and
administrative
expenses are
included in the
total cost to which
the markup is
added.
Manufacturing
Cost
Selling
Expenses
Administrative
Expenses Total cost
Total Cost Concept
Appendix

© 2011 Cengage Learning. All Rights Reserved. May not be copied, scanned, or duplicated, in whole or in part, except for use as
permitted in a license distributed with a certain product or service or otherwise on a password-protected website for classroom use.
Total Cost Concept
Appendix
The markup percentage is
determined by applying
the following formula:
Markup
percentage = Desired profit
Total cost
Manufacturing
Cost
Selling
Expenses
Administrative
Expenses
Desired Profit

© 2011 Cengage Learning. All Rights Reserved. May not be copied, scanned, or duplicated, in whole or in part, except for use as
permitted in a license distributed with a certain product or service or otherwise on a password-protected website for classroom use.
Total Cost Concept
Appendix
To illustrate the seven steps used when the total
cost concept is applied, examine the data in the
next slide. Digital Solutions Inc. expects to
produce and sell 100,000 calculators during the
current year. The company desires a 20% rate of
return on its total assets of $800,000.

© 2011 Cengage Learning. All Rights Reserved. May not be copied, scanned, or duplicated, in whole or in part, except for use as
permitted in a license distributed with a certain product or service or otherwise on a password-protected website for classroom use.
Total Cost Concept
Appendix
Manufacturing costs:
Direct materials ($3.00 x 100,000) $ 300,000
Direct labor ($10.00 x 100,000) 1,000,000
Factory overhead:
Variable costs ($1.50 x 100,000) $150,000
Fixed costs 50,000 200,000
Total Manufacturing costs $1,500,000
Selling and administrative expenses:
Variable expenses ($1.50 x 100,000) $150,000
Fixed costs 20,000
Total selling and administrative expenses 170,000
Total cost $1,670,000

© 2011 Cengage Learning. All Rights Reserved. May not be copied, scanned, or duplicated, in whole or in part, except for use as
permitted in a license distributed with a certain product or service or otherwise on a password-protected website for classroom use.
Total Cost Concept
Appendix
Only the desired profit is
covered in the markup.
= 9.6% =
Total cost per calculator $16.70
Markup ($16.70 x 9.6%) 1.60
Selling price $18.30
$160,000
$1,670,000
Desired profit
Total cost

© 2011 Cengage Learning. All Rights Reserved. May not be copied, scanned, or duplicated, in whole or in part, except for use as
permitted in a license distributed with a certain product or service or otherwise on a password-protected website for classroom use.
Total Cost Concept
Appendix
The ability of the selling price of $18.30 to generate
the desired profit of $160,000 is illustrated by the
income statement shown below.

© 2011 Cengage Learning. All Rights Reserved. May not be copied, scanned, or duplicated, in whole or in part, except for use as
permitted in a license distributed with a certain product or service or otherwise on a password-protected website for classroom use.
Variable Cost Concept
Under the variable cost concept, only
variable costs are included in the cost
amount per unit to which the markup is
added.
Appendix

© 2011 Cengage Learning. All Rights Reserved. May not be copied, scanned, or duplicated, in whole or in part, except for use as
permitted in a license distributed with a certain product or service or otherwise on a password-protected website for classroom use.
Product Cost
Markup
Variable
Manufacturing
Cost
+
Variable
Administrative
and Selling
Expenses
Total Fixed
Costs +
Desired
Profit
Variable Cost Concept
Appendix

© 2011 Cengage Learning. All Rights Reserved. May not be copied, scanned, or duplicated, in whole or in part, except for use as
permitted in a license distributed with a certain product or service or otherwise on a password-protected website for classroom use.
Variable Cost Concept
Appendix
Markup
Percentage
Desired Profit + Total Fixed Costs and
Expenses =
Total Variable Cost
Markup
Percentage
$160,000 + $50,000 + $20,000 =
$1,600,000
Direct materials ($3 x 100,000) $ 300,000
Direct labor ($10 x 100,000) 1,000,000
Variable factory overhead
($1.50 x 100,000) 150,000
Variable selling and
administrative expenses
($1.50 x 100,000) 150,000
Total variable costs $1,600,000

© 2011 Cengage Learning. All Rights Reserved. May not be copied, scanned, or duplicated, in whole or in part, except for use as
permitted in a license distributed with a certain product or service or otherwise on a password-protected website for classroom use.
Variable Cost Concept
Appendix
Markup
Percentage
$160,000 + $50,000 + $20,000 =
$1,600,000
Markup
Percentage =
$230,000
$1,600,000 = 14.4%
Markup
Percentage
Desired Profit + Total Fixed Costs and
Expenses =
Total Variable Cost

© 2011 Cengage Learning. All Rights Reserved. May not be copied, scanned, or duplicated, in whole or in part, except for use as
permitted in a license distributed with a certain product or service or otherwise on a password-protected website for classroom use.
Digital Solutions Inc. would price each calculator at
$18.30 per unit, as shown below:
Variable Cost Concept
Variable cost per calculator $16.00
Markup ($16.00 x 14.4%) 2.30
Selling price $18.30
Appendix

Prepared by: C. Douglas Cloud
Professor Emeritus of Accounting
Pepperdine University
© 2011 Cengage Learning. All Rights Reserved. May not be copied, scanned, or duplicated, in whole or in part, except for use as
permitted in a license distributed with a certain product or service or otherwise on a password-protected website for classroom use.
The End
Differential Analysis and Product Pricing