Embed Size (px)
Citation preview
No longer just for the likes of them? University accessDanny Dorling, Department of Geography, University of SheffieldTalk to University WP team, Octagon, 11am, 20 April 2010.
I suggest that the way we currently allocate university places will, in a few decades time, to come appear as perverse and haphazard as entry to elementary education prior to the 1880s now appears and as secondary education places were allocated prior to the 1960s. Perverse here means harmful to almost all, from the poorest to richest.
Start with HEFCE’s revelations of spring 2010:
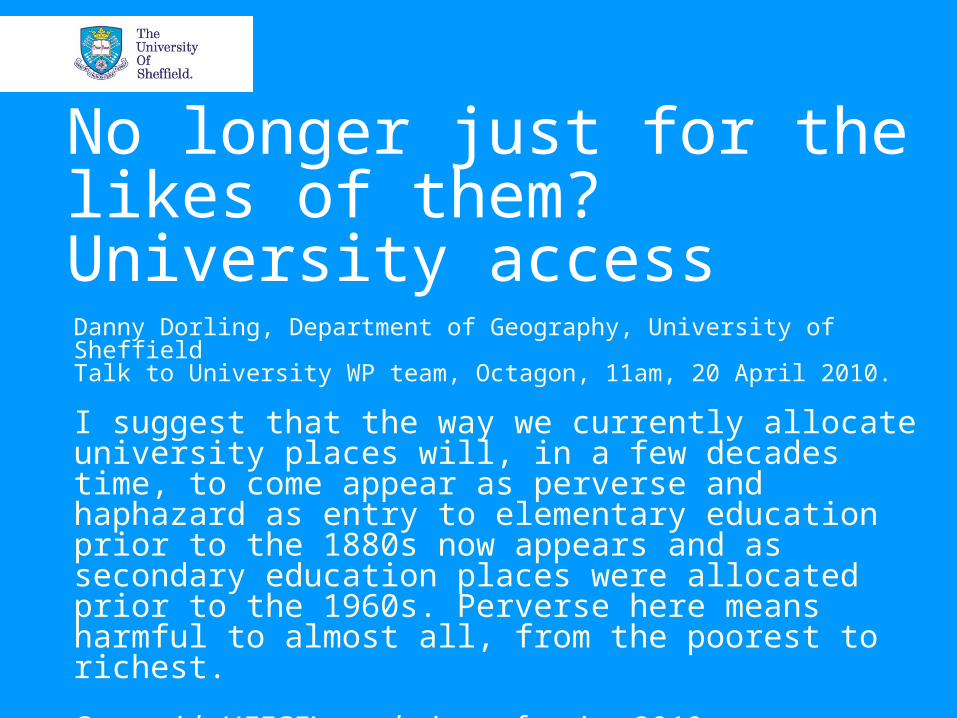
Recently a narrowing in inequality occurredSlight viewed in some
ways, remarkable in others, but not even those in ‘pole-position’ are happy..
I’ll consider those at the ‘top’ with a typical ‘Times’ Newspaper story of spring 2010 (in five slides time) – but first what of that 15% to 19% going increase for young people (aged 18 and 19) in the worse off fifth of areas. An extra one in twenty five going in just five year. A 26% access increase…. (19-15)/15.
The source here is HEFCE’s 2010 Trends report
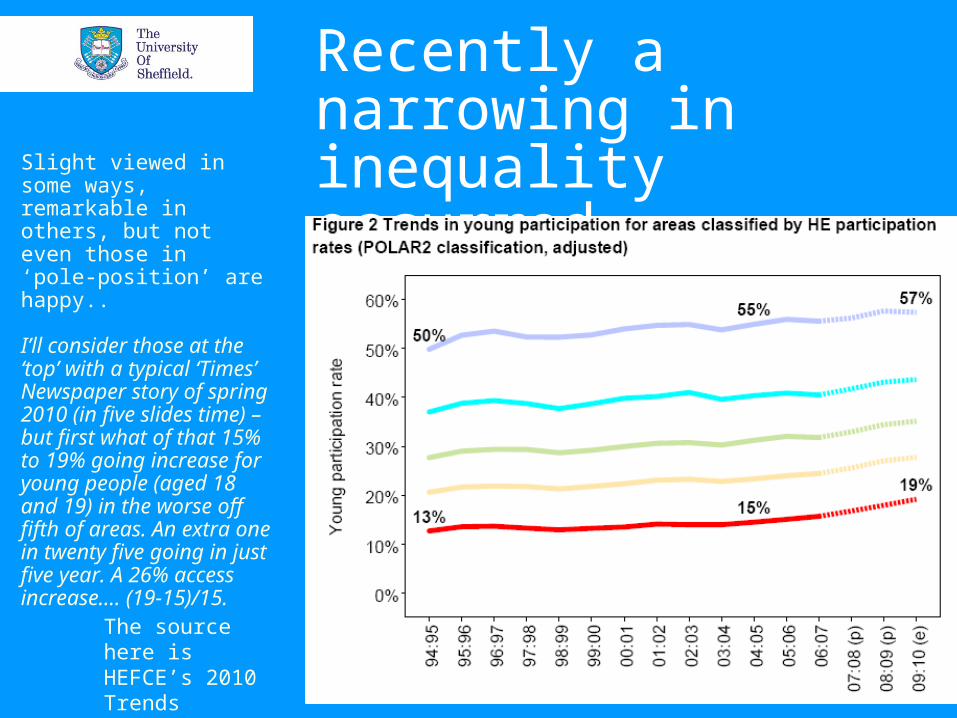
Considering that 15% to 19% rise: It was predicted given earlier GCSEs
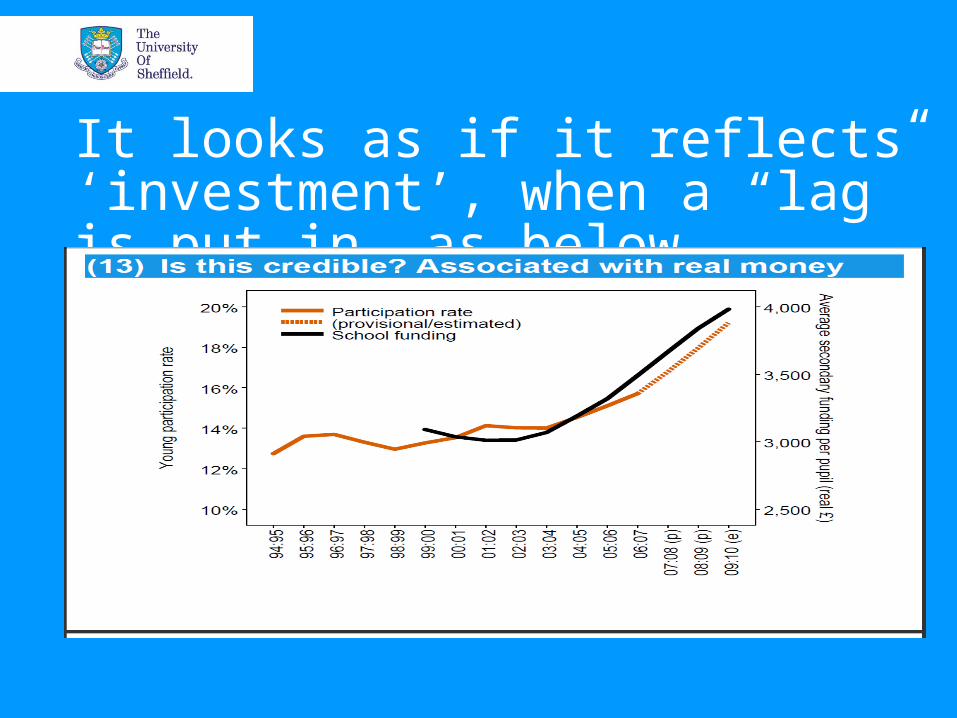
It looks as if it reflects ‘investment’, when a “lag” is put in, as below
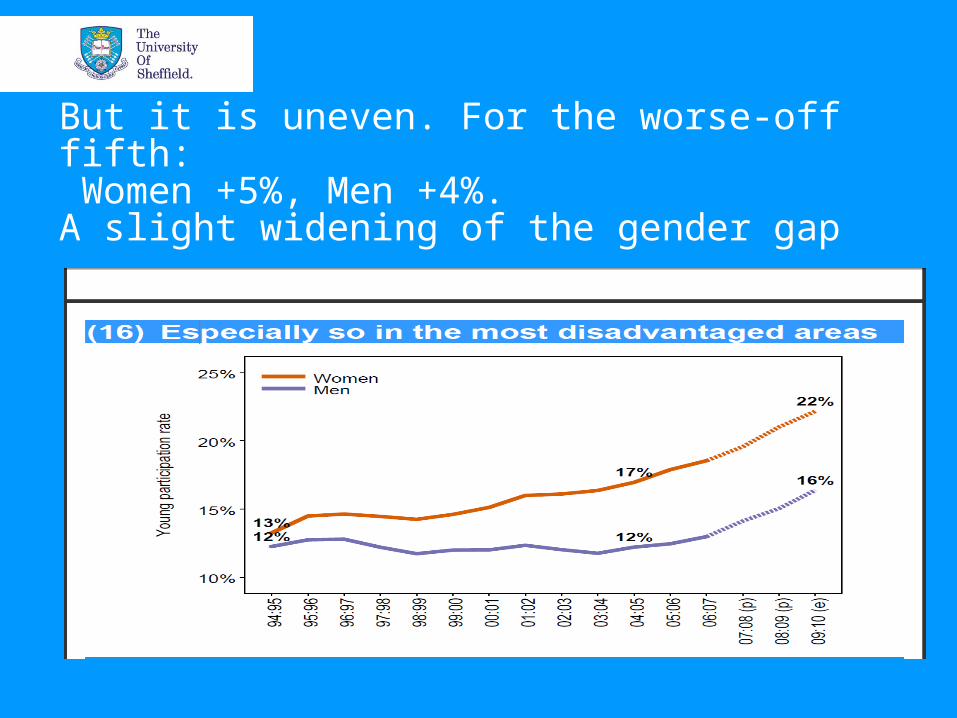
But it is uneven. For the worse-off fifth: Women +5%, Men +4%. A slight widening of the gender gap
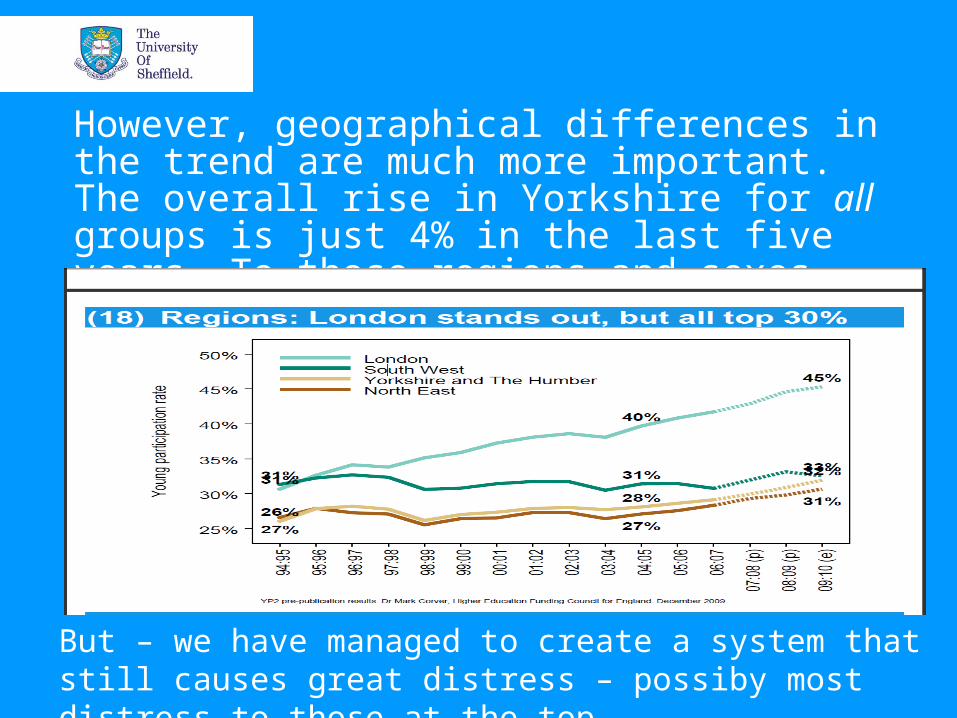
However, geographical differences in the trend are much more important. The overall rise in Yorkshire for all groups is just 4% in the last five years. To those regions and sexes that have, more is given.
But – we have managed to create a system that still causes great distress – possiby most distress to those at the top…
19/04/23 © The University of Sheffield
“Bright pupils are rejected in scramble for university”The Times Newspaper on April 10th reported on Florence MacKenzie who they
described as “upset and angry”. Their reported continued: ‘Universities would have fought over Florence MacKenzie, 18, in previous years. On course to achieve A and A* grades in her A levels, she has straight A*s in her nine GCSEs, plays hockey for her school, and is Grade 8 at piano and violin. She and her parents were baffled when she was rejected by three of her five chosen universities. Florence, from Banbury, is happy with her place studying English at University College London, but was turned down by Edinburgh, St Andrews and Durham. All are popular universities, hugely oversubscribed for her chosen subject, allowing them to be extremely picky. Edinburgh allocated 70 per cent of places on a points system that favoured teenagers from poor schools, those whose parents did not go to university, or those from Scotland or northern England. Florence goes to an independent girls’ school in Warwick so did not qualify. It set a hurdle of 11 GCSEs at A* to qualify for the remaining 30 per cent of places, but many schools (including Florence’s) do not set this many. She said: “I was very keen on Edinburgh and upset when rejected by them — angry as well after I found out the reasons why. I don’t think it’s a fair way of doing it, they should interview like other universities.” As many as 25 candidates are pursuing each place on popular courses at leading universities.’
http://www.timesonline.co.uk/tol/life_and_style/education/article7093817.ece

19/04/23 © The University of Sheffield
So, what is happening? Consider a verycrude map of inequality in access
S. Yorks.
Banbury
Source: http://www.sasi.group.shef.ac.uk/hguk/chapter1.htm

Crude models predicting access
Figure 1.7: People under 21 attending university by social class (%)
0 20 40 60 80
I: Professional
II: Intermediate
IIINM: Skilled non-manual
IIIM: Skilled manual
IV: Partly skilled
V: Unskilled
All social classes
1998/99
1991/92
You can predict how many you people will go to university from each area by knowing their social class background.
However there are geographical effects above this. Living in an area where it has become usual to go to university, for from which youngsters want to escape more increases their chances of attending beyond the effects of social class and vice versa (Latin also puts children with usual backgrounds off places that reveal in using it…)
http://www.sasi.group.shef.ac.uk/hguk/chapter1.htm
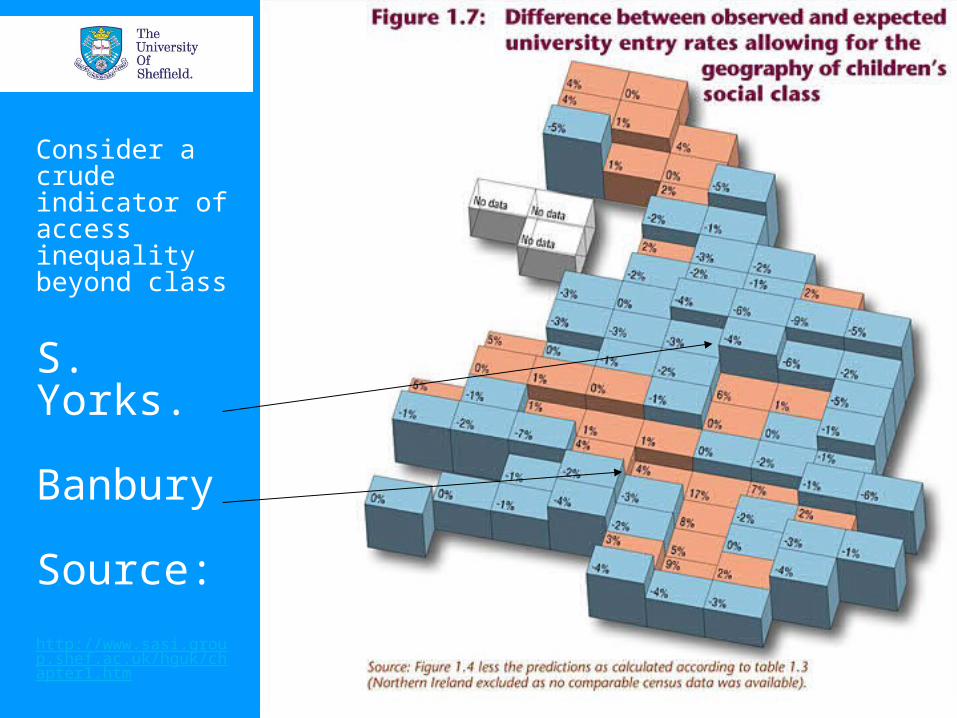
Consider a crude indicator of access inequality beyond class
S. Yorks.
Banbury
Source: http://www.sasi.group.shef.ac.uk/hguk/chapter1.htm
4% - -4% = 8% gap “beyond class” For every 12 children 1 extra in S. Yorks. .does not go to uni.
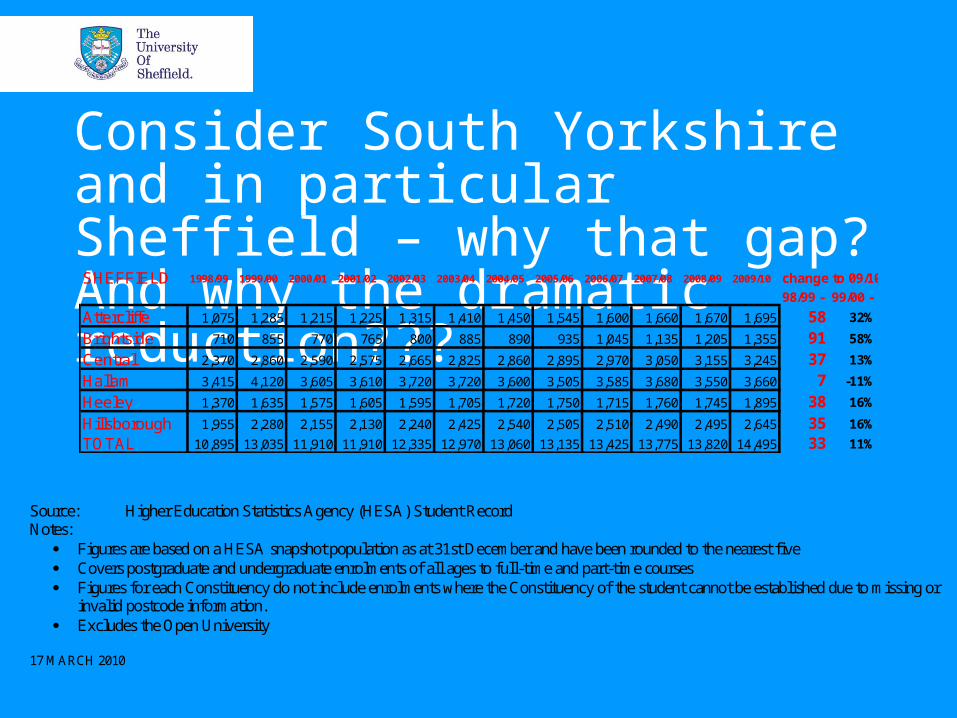
Consider South Yorkshire and in particular Sheffield – why that gap? And why the dramatic reduction???SHEFFIELD 1998/99 1999/00 2000/01 2001/02 2002/03 2003/04 2004/05 2005/06 2006/07 2007/08 2008/09 2009/10 change to 09/10
98/99 - 99/00 -
Attercliffe 1,075 1,285 1,215 1,225 1,315 1,410 1,450 1,545 1,600 1,660 1,670 1,695 58 32%
Brightside 710 855 770 765 800 885 890 935 1,045 1,135 1,205 1,355 91 58%
Central 2,370 2,860 2,590 2,575 2,665 2,825 2,860 2,895 2,970 3,050 3,155 3,245 37 13%
Hallam 3,415 4,120 3,605 3,610 3,720 3,720 3,600 3,505 3,585 3,680 3,550 3,660 7 -11%
Heeley 1,370 1,635 1,575 1,605 1,595 1,705 1,720 1,750 1,715 1,760 1,745 1,895 38 16%
Hillsborough 1,955 2,280 2,155 2,130 2,240 2,425 2,540 2,505 2,510 2,490 2,495 2,645 35 16%
TOTAL 10,895 13,035 11,910 11,910 12,335 12,970 13,060 13,135 13,425 13,775 13,820 14,495 33 11%
Source: Higher Education Statistics Agency (HESA) Student Record Notes:
Figures are based on a HESA snapshot population as at 31st December and have been rounded to the nearest five Covers postgraduate and undergraduate enrolments of all ages to full-time and part-time courses Figures for each Constituency do not include enrolments where the Constituency of the student cannot be established due to missing or
invalid postcode information. Excludes the Open University
17 MARCH 2010

Government has very scant data• Higher Education: Sheffield (PQ 29 March 2010) – Extract:
• Mr. Betts: To ask the Minister of State, Department for Business, Innovation and Skills how many and what proportion of young people in (a) each Sheffield constituency and (b) the City of Sheffield have entered higher education in each year since 1998. [323761]
• Mr. Lammy [holding answer 25 March 2010]: The numbers of young (under 21) undergraduate entrants, from the Sheffield constituencies of Attercliffe, Brightside, Central, Hallam, Heeley and Hillsborough and Sheffield local authority, are provided in the following table. Figures are provided for the academic years 1998/99 to 2008/09.
• Percentage change in young undergraduate entrants: 1998/99 to 2008/09Change (percentage)Sheffield Attercliffe+74Sheffield Brightside+91Sheffield Central+78Sheffield Hallam+12Sheffield Heeley+44Sheffield Hillsborough+53Sheffield local authority+46
• The Department does not collect data on the number of residents in a particular area who are not in higher education, which would be necessary to calculate a proportion. It is, therefore, not possible to calculate the proportion of young people in each Sheffield constituency and Sheffield local authority who have entered higher education in each year since 1998.
• http://www.publications.parliament.uk/pa/cm200910/cmhansrd/cm100329/text/100329w0054.htm#10033012005640
The next five slides consider trends in Sheffield by area – and division
19/04/23 © The University of Sheffield
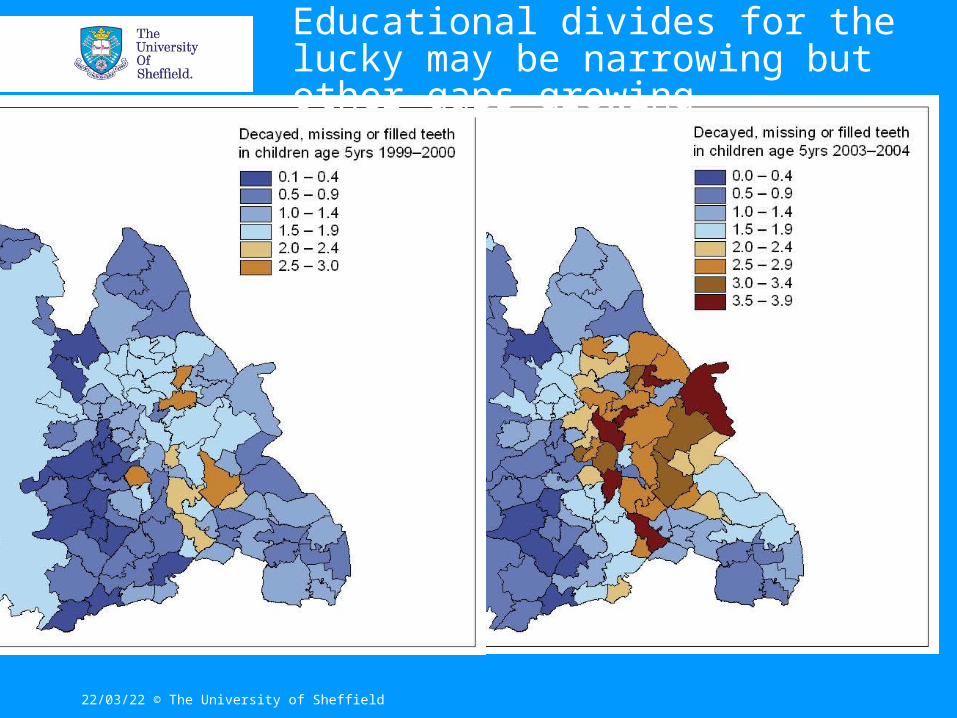
Educational divides for the lucky may be narrowing but other gaps growing
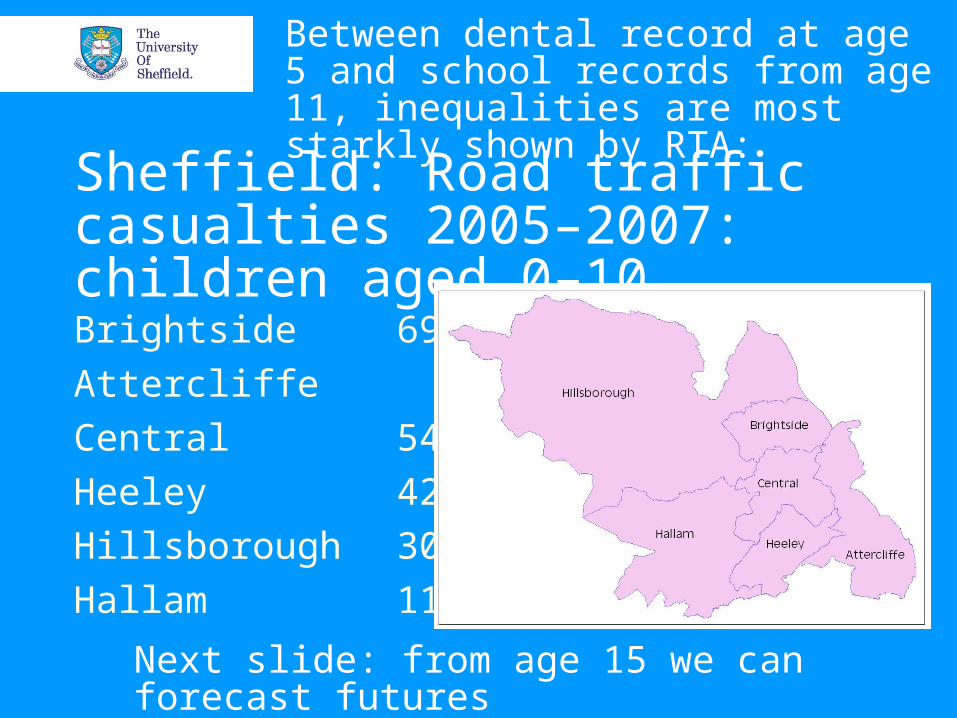
Sheffield: Road traffic casualties 2005–2007: children aged 0–10 Brightside 69 Attercliffe 67 Central 54 Heeley 42 Hillsborough 30Hallam 11
Next slide: from age 15 we can forecast futures
Between dental record at age 5 and school records from age 11, inequalities are most starkly shown by RTA:
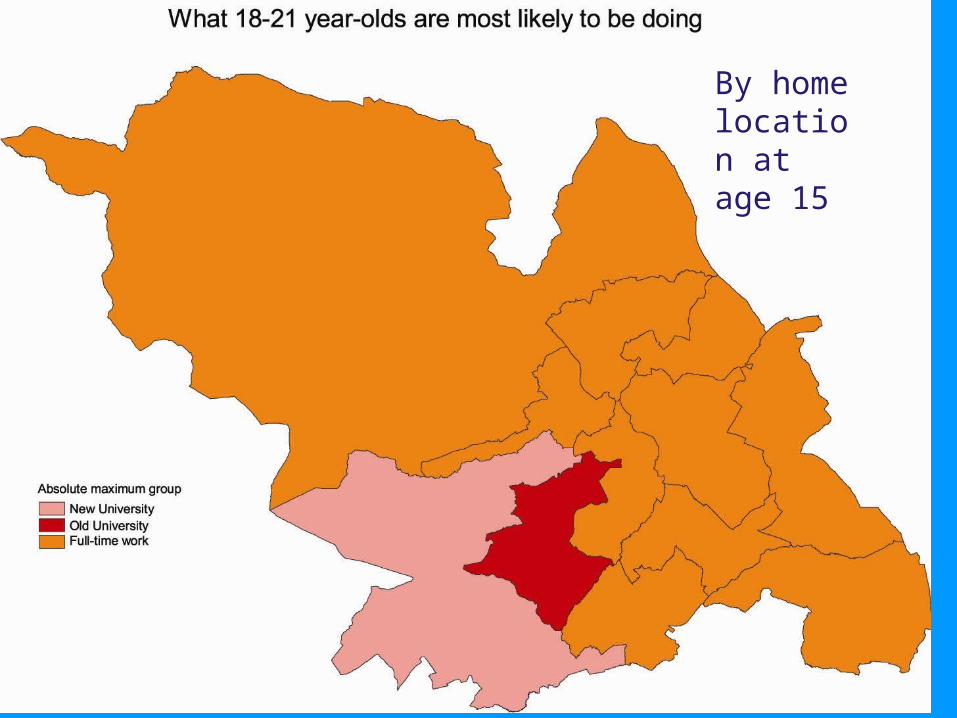
By home location at age 15
A way forward – given the funding review - please think more local• One tangible geographical step forward
from abstract wishes is to consider your local area – what happened to the chances of the great great grandchildren of those who paid their penny subscription to build a university in Sheffield?
• Or, in Oxford, to those hundreds of thousands of offspring of the ‘bedders’
HEFCE benchmarks ignore geography (as they stand), thus:In 2009 Sheffield appeared in 2nd place
amongst Russell Group (+ York = RGY) Universities in how it was taking 8.2% of students from low participation neighbourhoods (target was 7.1%). But the university sits on the edge of one of the largest ‘seas’ of such neighbourhoods. Its rank out of all universities was 66th.

Geography matters: Look at the proportions attending private schools at age 15
2% in S. Yorks.
Banbury: 9%+
Source: http://www.sasi.group.shef.ac.uk/hguk/chapter1.htm
From state schools or collegesSheffield has risen from 4th to 3rd
placed amongst RGY universities (85th amongst all England’s in taking 85.7% from state schools given a benchmark of 81.5% (note 93% of a children go). But this is hardly surprising given its geography – in a “state school sea”.
For every child in Britain that attends a private school (7%) Sheffield takes – pro rata – two children (14.3% of entry).
Parents from working classes Of the RGY universities Sheffield is 7th by
social class origin of parents, taking 20.7% of “NSEC 4-7”, benchmark 22.9%, full English ranking 93rd. Proportion slipping from 21.3% in 2008, but rank not slipping as the source class group shrinks. All unsurprising. Northern upper-middle class parents use state schools far more.
Conclusions• Try to think outside of
RGY and outside 2010
• Do think of the people of Sheffield; not an abstract
• It may be harder then to be too complacent?
• Who needs to ‘Dream bigger dreams’? – ‘us’ or ‘them’.
• Whose dreams are bigger in the first place?
Be aware of how little many UK graduates know, but how superior they have been taught to feel. This is not their fault but due context. An example: “Simon” B 30 Jan 2010, 12:19AM
“And yeah yeah, I know the increase perfectly matches the increase in GCSE scores but that just shows it's all smoke and mirrors because GCSE and GCEs have been getting steadily easier over the past 30 years. I can't believe that Dorling seriously believes the tripe he's
peddling. As an aside I don't quite understand where Dorling gets his figures from. More of the wealthier students go to university. The gap between rich and poor has actually widened over the past 15 years so how does he come to the conclusion that "most additional university places have gone to students from poorer neighbourhoods" Therer has been a slightly bigger increase in the proportion of poorer students going than wealthier students but given that the absolute number is smaller, in numbers terms many more of the additional places must have gone to wealthier students. Dorling is obviously no mathematician. ..”
The article said the absolute number change was greater – possibly for the first time ever recorded – but maybe I should have repeated it three times?!http://www.guardian.co.uk/education/mortarboard/2010/jan/28/labours-great-successes-university-access-danny-dorling [Article concerned 2005-10 change]
Further reading if interested:The return to elitism in education, Soundings, Issue 44, March 2010:“A society's attitudes to innate intelligence are closely correlated with its levels of
inequality, writes Danny Dorling. In Britain, the backlash against comprehensive education has created a market-based system in which schools and universities compete for money and students”. http://www.eurozine.com/authors/dorling.html
With Ben Hennig, (2010). Angles, Saxons, Inequality, and Educational Mobility in England and Germany, Social Europe Journal, Online Debate Article.
http://www.social-europe.eu/category/good-society-debate/
Tall tales and ripping yarns (2010) Adults Learning Magazine, an article on why
inequality persists, and what can education do to challenge it http://www.niace.org.uk/publications/adults-learning

![Entry: Cartogram [1883 WORDS] - by Danny Dorling (University of … · 2016. 1. 8. · Vol. 6: Dorling/Cartogram/entry be taken more seriously than traditional cartographic treatments](https://img.dokumen.tips/doc/110x75/609a38c74e6b8a0338263eef/entry-cartogram-1883-words-by-danny-dorling-university-of-2016-1-8-vol.jpg)