Embed Size (px)
Citation preview

A N D C O N T R O L L E D E N T I T I E S
ANNUAL REPORT 30TH JUNE 2015
For
per
sona
l use
onl
y

Corporate Directory
MALAGASY MINERALS LIMITED ACN 121 700 105 1
Directors
Guy LeClezio – Non-Executive Chairman Peter Woods – Non-Executive Director Graeme Boden – Non-Executive Director Peter Langworthy – Non-Executive Director Country Manager Madagascar
Jean Luc Marquetoux Company Secretaries
Graeme Boden Natasha Forde Registered and Corporate Office
15 Lovegrove Close MOUNT CLAREMONT WA 6010 Telephone: +61 8 9286-1219 Facsimile: +61 8 9284-3801 Postal Address
15 Lovegrove Close MOUNT CLAREMONT WA 6010 Madagascar Operations Office
Batiment L Cite ex-BRGM, Rue Farafaty Ampandrianomby – Antananarivo 101 MADAGASCAR Telephone:+261 20 22 416 63 / +261 20 22 591 34 Facsimile: +261 20 22 591 32
Stock Exchange Listing
Australian Securities Exchange ASX Code: MGY
Share Registry
Security Transfer Registrars Pty Ltd 770 Canning Highway APPLECROSS WA 6153 Telephone: +61 8 9315 2333 Facsimile: +61 8 9315 2233 Auditor
William Buck Audit (WA) Pty Ltd Level 3, 15 Labouchere Road SOUTH PERTH WA 6151 Solicitors to the Company
Steinepreis Paganin Level 4, The Read Building 16 Milligan Street PERTH WA 6000 Solicitors (Madagascar)
Lexel Juridique & Fiscal Zone Tana Water Front Ambodivona ANTANANARIVO 101 MADAGASCAR Annual General Meeting
The Annual General Meeting of Malagasy Minerals Limited will be held in the President’s Room, The Celtic Club, 1st Floor, 48 Ord Street, West Perth Australia at 10-30 am on Thursday 26th November 2015. Web Site
Visit our website at: www.malagasyminerals.com
Registered under the Corporations Act 2001 in the State of Western Australia on 22nd September 2006
Contents
Page No.
Operating and Financial Review 2
Directors’ Report 16
Auditor’s Independence Declaration 24
Consolidated Statement of Profit or Loss and Other Comprehensive Income 25
Consolidated Statement of Financial Position 26
Consolidated Statement of Changes in Equity 27
Consolidated Statement of Cash Flows 28
Notes to the Financial Statements 29
Directors' Declaration 54
Independent Audit Report 55
ASX Additional Information 57
Group Tenement Schedule 59
For
per
sona
l use
onl
y

Operating and Financial Review
MALAGASY MINERALS LIMITED ABN 84 121 700 105 2
OPERATIONS REVIEW
HIGHLIGHTS
Malagasy Minerals Ltd (“Malagasy”) has established a large exploration project in Southern Madagascar that is highly prospective for both high-grade, high quality graphite deposits and mafic-ultramafic intrusive related magmatic nickel-copper-platinum group metals (“PGM”) deposits.
Key outcomes from corporate activity and exploration programmes during the year were:
The ongoing funding solution for the company’s activities via the generation of $225,899 cash from the sale of shares held in Energizer Resources Inc (EGZ), the receipt of a second payment for the sale of the Molo graphite deposit and the sale or lease of two labradorite tenements. It is now 4.5 years since Malagasy has raised capital for its exploration activities.
Completion of a maiden diamond drilling program at the Razafy Prospect has continued to demonstrate the potential for the Maniry Graphite Project to host significant deposits of high grade, high quality graphite mineralisation.
Nickel-copper exploration has now been focused in 3 key areas that will allow a significant rationalisation of the company’s tenement holdings.
EXPLORATION PROJECTS
Malagasy has consolidated a large exploration project in Southern Madagascar over an area of approximately 1,858 km2 (Figure 1). The tenements have demonstrated to be prospective for high-grade, high-quality graphite deposits, and have also been targeted for mafic-ultramafic intrusive related nickel-copper deposits.
Figure (1) – Project Location Plan
For
per
sona
l use
onl
y

Operating and Financial Review (Continued)
MALAGASY MINERALS LIMITED ABN 84 121 700 105 3
GRAPHITE EXPLORATION (100% MALAGASY MINERALS LIMITED)
The discovery and delineation of the Molo Graphite Deposit by Energizer Resources demonstrated the potential of Malagasy’s wider project holdings to host significant deposits of high-grade, high-quality graphite mineralisation. The decision to divest the company’s interest in the Molo Graphite JV has provided the opportunity and funding to focus on the company’s 100% owned assets.
As such Malagasy has pursued the strategy to define the potential of the company’s 100% held ground to host additional high-grade graphite deposits that would have the potential to either enhance, or be enhanced by, the development of the Molo Graphite JV Deposit.
Malagasy aims at the Maniry Project are:
Define a major new, high-quality graphite province in Southern Madagascar;
Develop a pathway to become a major producer of premium quality “jumbo flake” graphite;
Quickly delineate the size and quality of the large-scale Maniry Graphite Project; and
Build a strategic relationship with key players within the established graphite industry.
Malagasy is targeting a high-grade resource base of >5,000,000 tonnes at a graphite grade of +15%C, with a particular focus on identifying near surface deposits that can be assessed quickly and at modest cost. Graphite exploration over the past 12 months has focused on the Maniry area (Figure 2).
Figure (2) – Project Ownership and Prospect Location Plan
For
per
sona
l use
onl
y

Operating and Financial Review (Continued)
MALAGASY MINERALS LIMITED ABN 84 121 700 105 4
DEVELOPMENT OF THE MOLO GRAPHITE PROJECT
Malagasy retains an interest in the Energizer Resources Inc’s Molo Graphite Project in the form of a cash payment on commencement to mine ($CAN 1,000,000) and an ongoing 1.5% Net Smelter Return over the life of the project.
The commencement of mining at the Molo Graphite project (1) and payment of the Net Smelter Return would provide a substantial and long-term cash flow source for Malagasy Minerals.
On the 6th February 2015 Energizer announced the positive results of its Feasibility Study with a target to commence production by 2017. Key metrics (as reported by EGZ) of the Molo Graphite Project include:
Table (1) – MOLO GRAPHITE PROJECT – FEASIBILITY STUDY SUMMARY ($CAN)
Proved & Probable Reserve 22,537,000 tonnes @ 7%C (graphitic carbon)
Annual Production 53,017 tonnes carbon
Life of Mine 26 years
Capex $188.2 (all inclusive)
Post-tax NPV (10% discounts rate) $390 million
Post-tax IRR 31.2%
Table (2) – Metallurgical Data – Flake Size Distribution and Product Grade
Product Size Description % Distribution Product Grade (%C)
>50 mesh Jumbo 23.6 96.9
-50 to +80 mesh Coarse – Large 22.7 97.1
-80 to +100 mesh Medium 6.9 97.2
-100 mesh Medium - Fine 48.8 97.6
Note:
(1) Future payments: the nature of these payments means that they are not guaranteed and are linked to the future commencement
of mining at the Molo Graphite Project.
MANIRY GRAPHITE PROJECT
The Maniry Project is located in the southern part of the company’s Ampanihy Project (Figure 2) and has been identified as being highly prospective for not only high-grade, high-quality graphite deposits but also for large-scale intrusive related nickel-copper-PGM deposits and molybdenum-selenium-REE deposits.
Exploration at Maniry has identified a series of large, high-grade outcrops of graphite mineralisation within a broader graphite trend covering an area of approximately 8km x 4km. This initial work was followed by more detailed systematic rock chip sampling across the interpreted strike of the graphite lenses to determine the continuity of grade across the width of these graphite lenses.
The diamond drilling program completed during the year at Maniry was the culmination of systematic exploration that achieved the following outcomes:
Definition of at least 34 large-scale zones (Figure 3) of prominently outcropping graphite mineralisation over an area of 6.5km x 2.5km. Additional targets have been identified and will be advanced at an appropriate time;
Individual lenses have strike extensions of up to 1.8km and can attain widths of up to 350m;
Rock chip sampling program has returned individual results up to 50.78%C; and
Field assessment of the graphite flake size has highlighted it is generally of coarse nature. Previously completed petrological analysis of selected samples has confirmed the high quality nature of the graphite. The graphite flake size is generally >0.7mm with some material as coarse as several millimetres. The graphite is largely free from inclusions of other minerals.
For
per
sona
l use
onl
y

Operating and Financial Review (Continued)
MALAGASY MINERALS LIMITED ABN 84 121 700 105 5
Figure (3) – Maniry Graphite Field: Target Locations and Surface Sampling Results
Razafy Target:
Two traverses of drilling (9 holes – see Table 3) were completed approximately 500 metres apart to provide an initial test of the central portion of the ~1.6km long Razafy Target. The drilling focused on the two central lenses of mineralisation (Figure 4) - the remaining four parallel lenses remain untested.
The key outcomes of the drilling include:
Confirmation of consistent, thick outcropping, high-grade graphite horizons hosted by felsic gneissic rocks (Figure 5a and 5b);
Field assessment confirms the course grained nature of the graphite mineralisation;
The carbon grade within the horizons are generally consistent from hole to hole and from section to section;
Surface sampling has provided an accurate guide as to the expected grades in the sub-surface and;
Diamond drilling is a cost effective way (approximately A$50/metre) of drill testing the targets.
For
per
sona
l use
onl
y

Operating and Financial Review (Continued)
MALAGASY MINERALS LIMITED ABN 84 121 700 105 6
Table (3) – Razafy Graphite Target Drilling Results
Hole ID Results
MNDD001 26 metres @ 7.3%C from 2 metres (Includes 10 metres @ 10.2%C)
14 metres @ 5.1%C from 52 metres
MNDD002 32 metres @ 7.0%C from 18 metres (Includes 8 metres @ 9.7%C) 16 metres @ 5.1%C from 72 metres
MNDD003 26 metres @ 6.8%C from 0 metres (Includes 8 metres @ 8.8%C)
16 metres @ 6.1%C from 94 metres
MNDD004 34 metres @ 8.5%C from 14 metres (Includes 12 metres @ 11.6%C)
MNDD010 34 metres @ 6.4%C from 0 metres (Includes 10 metres @ 8.1%C)
MNDD011 44 metres @ 6.4%C from 10 metres (Includes 10 metres @ 9.2%C)
MNDD012 24 metres @ 7.0%C from 0 metres (Includes 10 metres @ 8.4%C)
MNDD013 50 metres @ 6.9%C from 2 metres (Includes 26 metres @ 9.1%C)
MNDD017 38 metres @ 8.3%C from 34 metres (Includes 14 metres @ 11.3%C)
Figure (4) – Razafy Target: Drill sections and Surface Sampling Results
For
per
sona
l use
onl
y

Operating and Financial Review (Continued)
MALAGASY MINERALS LIMITED ABN 84 121 700 105 7
Figure (5a) – Razafy Target: Northern Drill Section
Figure (5b) – Razafy Target: Southern Drill Section
For
per
sona
l use
onl
y

Operating and Financial Review (Continued)
MALAGASY MINERALS LIMITED ABN 84 121 700 105 8
Haja Target:
The Haja Target is located approximately 2.0 kilometres to the immediate south of Razafy. The graphite deposit has a mapped width of up to 350 metres and a strike of 600 metres and is located on a prominent hill (Figure 6). Three diamond holes were completed on a single traverse to provide an initial test of the target.
The key outcomes of the drilling include:
The intersection of consistently thick high-grade graphite mineralisation (Figure 7);
The mineralisation in this position outcrops over a width of approximately 220 metres; and
Potential exists to extend this mineralisation over a large area based on mapping and rock chip sampling results.
Table (4) – Haja Target Drilling Results
Hole ID Results
MNDD008 50 metres @ 6.0%C from 0 metres (Includes 8 metres @ 7.8%C)
MNDD009 70 metres @ 5.3%C from 2 metres (Includes 6 metres @ 9.2%C)
MNDD016 18 metres @ 6.0%C from 0 metres
Figure (7) – Haja Target: Drill Section
Figure (6) – Haja Target: Drill sections and
Surface Sampling Results
For
per
sona
l use
onl
y
Operating and Financial Review (Continued)
MALAGASY MINERALS LIMITED ABN 84 121 700 105 9
Ivan Target:
The Ivan Target is located approximately 1.5 kilometres to the immediate south of Razafy. The graphite deposit has a mapped width of up to 200 metres and a strike of 600 metres and is located on a prominent hill (Figure 8). Three diamond holes were completed on a single traverse to provide and an initial test of the target.
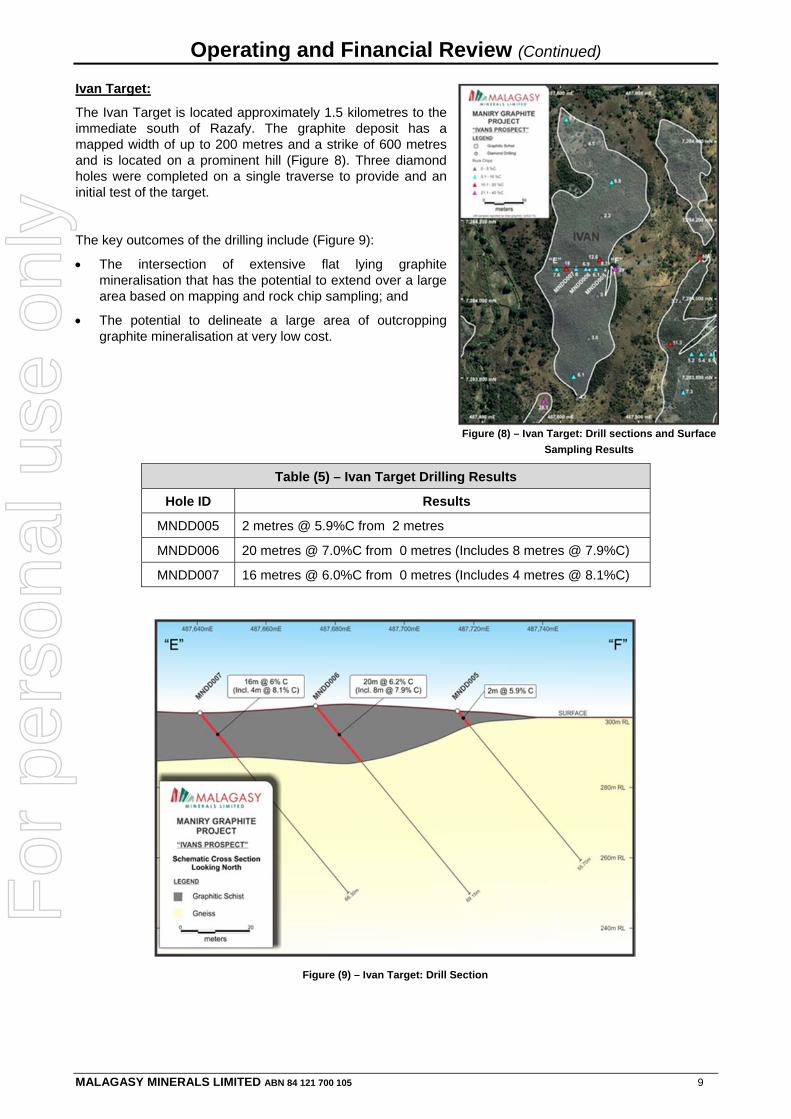
The key outcomes of the drilling include (Figure 9):
The intersection of extensive flat lying graphite mineralisation that has the potential to extend over a large area based on mapping and rock chip sampling; and
The potential to delineate a large area of outcropping graphite mineralisation at very low cost.
Figure (8) – Ivan Target: Drill sections and Surface
Sampling Results
Table (5) – Ivan Target Drilling Results
Hole ID Results
MNDD005 2 metres @ 5.9%C from 2 metres
MNDD006 20 metres @ 7.0%C from 0 metres (Includes 8 metres @ 7.9%C)
MNDD007 16 metres @ 6.0%C from 0 metres (Includes 4 metres @ 8.1%C)
Figure (9) – Ivan Target: Drill Section
For
per
sona
l use
onl
y

Operating and Financial Review (Continued)
MALAGASY MINERALS LIMITED ABN 84 121 700 105 10
Fitia Target:
The Fitia Target is located approximately 3.5 kilometres to the immediate south of Razafy. The graphite deposit has been defined by mapping and rock chip sampling over a strike of approximately 1.2 kilometres and up to a width of 150 metres (Figure 10). Two diamond holes were completed on the eastern margin of the outcropping graphite mineralisation as an initial test.
The key outcomes of the drilling include (Figure 11):
The intersection of consistent and increasingly thick mineralisation to the west; and
Initial indications of large outcropping exposures of graphite with significant opportunity to expand into a large-scale deposit of graphite mineralisation.
Figure (10) – Fitia Target: Drill sections and Surface
Sampling Results
Table (6) – Fitia Target Drilling Results
Hole ID Results
MNDD014 16 metres @ 6.1%C from 0 metres
MNDD015 18 metres @ 6.0%C from 0 metres
Figure (11) – Fitia Target: Drill Section
For
per
sona
l use
onl
y

Operating and Financial Review (Continued)
MALAGASY MINERALS LIMITED ABN 84 121 700 105 11
Conclusions:
The highly successful drilling program has delivered results that confirm the potential for Malagasy Minerals 100% owned Maniry Graphite Project to host large-scale, high-grade and easily accessible graphite deposits within a very localized area. The four key targets of this drilling programme provide an insight into the wider possibility of the project area with a further 30 graphite targets already identified.
The widths and near-surface outcropping nature of the graphite mineralisation provides the potential to delineate large positions quickly and in a high-quality manner by utilizing high-value in-house diamond drilling resources. The Razafy Target in particular could be assessed for an initial JORC compliant resource within a short period of time (post the current annual wet season).
The wide, near surface nature of the mineralisation would, in concept, be highly amenable to shallow open pit mining of any future identified JORC compliant mining reserve.
Beyond the potential confirmed by this initial assessment work, the Maniry Project is ready to move on to a scoping study stage. As is typical with graphite deposits the key parameter will be the metallurgical characteristics and the quality of the graphite mineralisation. Attaining this necessary and sufficient metallurgical information will inform the requirements for resource definition drilling and subsequent mining and processing studies. Malagasy will be examining the best means to fund and advance this next stage of work.
APPENDIX (I) – DRILLING DETAILS
Hole_ID Prospect Depth (m) Easting Northing RL (m) Azimuth Dip
MNDD001 Razafy 84.80 486806 7285996 306 233 -60
MNDD002 Razafy 109.90 486822 7286009 289 233 -60
MNDD003 Razafy 117.60 486850 7286066 306 233 -60
MNDD004 Razafy 95.70 486870 7286082 310 233 -60
MNDD005 Ivan 55.70 487715 7284073 302 93 -50
MNDD006 Ivan 69.15 487674 7284074 303 93 -50
MNDD007 Ivan 66.30 487641 7284081 301 93 -50
MNDD008 Haja 122.00 486700 7284480 297 270 -60
MNDD009 Haja 118.80 486753 7284479 291 270 -60
MNDD010 Razafy 82.60 487076 7285654 287 240 -60
MNDD011 Razafy 113.00 487092 7285663 290 240 -60
MNDD012 Razafy 58.80 487155 7285693 298 240 -60
MNDD013 Razafy 142.00 487174 7285698 293 240 -60
MNDD014 Fitia 90.30 486890 7282413 283 90 -80
MNDD015 Fitia 68.00 486936 7282411 273 90 -80
MNDD016 Haja 82.95 486655 7284480 302 270 -60
MNDD017 Razafy 111.00 486905 7286078 304 233 -60
For
per
sona
l use
onl
y

Operating and Financial Review (Continued)
MALAGASY MINERALS LIMITED ABN 84 121 700 105 12
IANAPERA GRAPHITE PROJECT
The Ianapera Graphite Project is located within 10 kilometres of the Molo Graphite Deposit (Figure 2) and consists of a series of high-grade outcrops of graphite mineralisation within a broader graphite trend. These high-grade near surface exposures of graphite mineralisation have the potential to collectively meet the stated resource target. Importantly, these high-grade graphite exposures can be demonstrated to lie over the top of a large conductive body as defined in the airborne electromagnetic data (VTEM) (Figure 12). Graphite is highly conductive and this may indicate the presence of a large graphitic mineralized system.
Previous exploration consisting of geophysical interpretation, detailed mapping and outcrop sampling has identified three target areas that have currently delineated dimensions up to 800 metres long by 30 metres wide. Rock chip results over 15%C have been consistently collected across these positions.
Key attributes of the project are:
Strategic position to potentially provide higher grade to feed to the Molo Graphite Project (5-15km haulage);
Consistently high-grade sampling results up to 37.8%C; and
Geophysical evidence indicates a larger concealed system beneath the known mapped extent of the mineralisation.
Figure (12) – Ianapera Project High-Grade Graphite Mapped Outcrops
NICKEL-COPPER-PLATINUM GROUP METAL EXPLORATION (100% MALAGASY MINERALS LIMITED)
Malagasy Minerals owns 100% of the rights to explore for base and precious metal deposits across the Ampanihy Project. The Company is exploring for World-Class mafic-ultramafic intrusive related magmatic nickel-copper-platinum group metal deposits with similarities to the Voisey’s Bay Deposit, Canada.
AMPANIHY PROJECT
The main Ampanihy Project covers approximately 110km of a Proterozoic aged major tectono-structural corridor that is highly prospective for mafic-ultramafic intrusive related magmatic nickel-copper-platinum group metals (“PGM”) deposits and high-grade, high quality graphite deposits. The project is sub-divided into 3 key projects; Ianapera (North), Fotadrevo (Central) and Maniry (South).
Exploration has established the following:
Confirmation that the Ampanihy Project is host to a major suite of mafic-ultramafic intrusive rocks that are considered highly prospective to host magmatic nickel-copper-platinum group metal deposits;
For
per
sona
l use
onl
y

Operating and Financial Review (Continued)
MALAGASY MINERALS LIMITED ABN 84 121 700 105 13
Identification of a suite of interpreted sills and/or dykes consisting of gabbro (troctolite), pyroxenite and peridotite rock that have been mapped within Malagasy’s tenement holdings (Figure 2);
Confirmation of the presence of magmatic sulphides (low-tenor Fe-Ni-Cu) associated with intrusive mafic-ultramafic rocks at a number of locations. The presence of these sulphides indicates that the critical process of sulphur saturation has occurred and that potential exists for the formation of magmatic nickel-copper-PGM deposits; and
Evaluation during the year has identified 3 areas that will become the focus of exploration.
VOHIBORY PROJECT
The Vohibory Project is located 20km to the north west of the Ampanihy Project (Figure 2) and has been identified as being highly prospective for mafic-ultramafic hosted nickel-copper-PGM Deposits
An evaluation exploration program including reconnaissance field work has identified the presence of a large mafic-ultramafic intrusion with anomalous nickel and copper geochemistry. A series of previously modelled VTEM conductors have been re-assessed. Previous attempts to drill these target conductors has proved to be incomplete and the conductors remain to be tested.
FINANCIAL REVIEW
BUSINESS STRATEGY
Malagasy Minerals is a mineral exploration company with granted tenements all located in south-west Madagascar.
The company strategy is to try to fund at least the standing costs associated with its Madagascar exploration effort through revenue generated in Madagascar. There are four components to this strategy:
- Commercial rental of parts of the Antanarivo complex not required by the group (Figure 13). - Royalty receipts from the quarrying of labradorite from the group’s tenements. - Third party contracts from the group’s services subsidiary. - Contributions to tenement rentals from labradorite quarries and joint venture partnering, sub-lease or
sale.
FINANCIAL POSITION
The consolidated loss for the year was $602,532 (2014: Profit $229,752). The current year loss includes a milestone receipt of $A821,969 in relation to the Molo graphite project.
The change in the cash position for the year was an outflow of $344,893. Inflows which helped reduce the size of the deficit, were the cash component of the Molo milestone payment ($717,659), sale of shares in Energizer Resources Inc ($225,899) and sale of a labradorite tenement ($219,968).
During the year, Malagasy operations required parent company funding of $0.3 million, representing a shortfall in self-funding strategy (2014 requirement: $0.2 million).
The cash balance of the Group at 30 June 2015 was $0.7 million.
CORPORATE TRANSACTIONS
Energizer Resources Inc (EGZ):
The Company received cash of CAN 0.7 million and 1,000,000 shares in Energizer Resources Inc (“EGZ”) as a milestone payment upon completion of a bankable feasibility study.
The Company sold 1,000,000 EGZ shares which were tradable. A further 2,500,000 million shares became tradable during June 2015 and 1,000,000 more will be released from escrow during May 2016. The Company held 3,500,000 EGZ shares at 30 June 2015.
The Company withdrew from the Green Giant exploration joint venture with EGZ as part of a tenement rationalisation review.
For
per
sona
l use
onl
y

Operating and Financial Review (Continued)
MALAGASY MINERALS LIMITED ABN 84 121 700 105 14
MANAGEMENT
The Company’s only management in Perth is the four non-executive directors, with exploration management provided by Mr Langworthy in conjunction with staff from his associated company Omni GeoX Pty Ltd, and finance and administration services provided by Boden Corporate Services Pty Ltd whose employees include Natasha Forde who acts as group accountant and joint company secretary.
The Malagasy activities continue to be managed by the Country Manager (Gerant) and CFO, Jean Luc Marquetoux, with exploration activities managed from Perth, by Omni GeoX, in conjunction with local geological staff.
FUTURE PROSPECTS
The group’s cash balance at 30 June 2015 plus proceeds from the sale of EGZ shares will be sufficient to see the group through the 2015-16 year, albeit with a small exploration programme.
The planned programme is set out in the operations report above and will focus on the Ampanihy graphite prospect.
POLITICAL SITUATION
The political situation in Madagascar progressed through democratic elections for the President and the parliament, resulting in the induction of a president, prime minster and government ministers. The international community subsequently began a process of re-engagement with Madagascar, with the prospect of trade and aid relationships being resumed. International funding for large development projects has not yet commenced and the political situation remains confused.
Notwithstanding these somewhat encouraging developments the Bureau du Cadastre Minier de Madagascar (BCMM), responsible for the regulation and administration of the country’s mining tenements, has not begun to deal with the backlog of transactions which has built up over five years. Malagasy has tenement applications, tenement renewals, the registration of additional minerals on the permits and the registration of sub-leases to EGZ with the BCMM for processing.
For
per
sona
l use
onl
y

Operating and Financial Review (Continued)
MALAGASY MINERALS LIMITED ABN 84 121 700 105 15
Figure (13) – Plan of St. Denis Terrain Showing Location & Extent of Building Infrastructure
For
per
sona
l use
onl
y

Directors’ Report
MALAGASY MINERALS LIMITED ABN 84 121 700 105 16
The directors present their report on the Economic Entity, comprising Malagasy Minerals Limited (referred to in these financial statements as “the Economic Entity” or “Malagasy”) and its wholly owned subsidiaries, together with the financial report for the year ended 30 June, 2015 and the audit report thereon. 1. DIRECTORS The Directors of the company at any time during or since the end of the year are set out below. Directors have been in office since the start of the financial year to the date of this report unless otherwise stated.
Mr Guy Francois Marie LE CLEZIO, BA – Non-Executive Chairman (Age: 59)
Mr Le Clezio holds a Bachelor of Arts from the University of Western Australia. He has had 20 years’ experience in the mining and exploration industry and was an Executive Director of Eyres Reed Ltd and Canadian Imperial Bank of Commerce who were leading Western Australian stockbrokers specialising in the mining industry. He was a founding director of World Titanium Resources Ltd and a former director of ASX listed Windy Knob Resources Ltd.
Mr LeClezio’s special responsibilities are in the areas of corporate matters, including transactions, capital markets and liaison in Madagascar.
During the past three years Mr Le Clezio has not held any other listed company directorships.
Dr Peter James WOODS, BSc(Hons), PhD(Geol), MAIG – Non-Executive Director (Age: 68)
Dr. Woods holds a Bachelor of Science (Honours) and a Doctorate of Philosophy (Geology) from the University of Western Australia. He has had over 20 years’ experience in the mining and exploration industry specialising in base metals, gold and industrial minerals, and as a consulting environmental scientist. He has worked in Madagascar since 1994 and in that time discovered the 710 million tonne Ranobe mineral sand deposit currently held by World Titanium Resources Ltd. He was a founding director of World Titanium Resources Ltd and a Member of the Australian Institute of Geoscientists.
Dr Woods is the lead independent director.
During the past three years Dr Woods has not held any other listed company directorships.
Mr Graeme Raymond BODEN, B Ec(Hons), FAICD – Non-Executive Director & Company Secretary (Age: 66)
He is an experienced business executive with more than 35 years in senior corporate or financial roles, particularly in the planning and evaluation function of the resources industry and in the finance and administration function of a range of industries, including resources. He has 30 years’ experience as a Director or Secretary of ASX listed companies. He is the principal of Boden Corporate Services, whose clients include listed companies World Titanium Resources Ltd, Spectrum Rare Earths Limited and Phylogica Limited, as well as Malagasy.
Mr Boden’s special responsibilities are as Chief Financial Officer.
During the past three years Mr Boden has not held any other listed company directorships.
Mr Peter LANGWORTHY, BSc(Hons), MAusIMM – Non-Executive Director (Age: 51)
Mr Langworthy is a geologist with a career spanning 26 years in mineral exploration and project development in Australia and Indonesia. He has specific expertise in building successful teams that have been responsible for significant mineral discoveries and in integrating technically sound exploration and resource development strategies into corporate planning. His industry experience includes 12 years in senior management roles with WMC Resources, four years with PacMin Mining as Exploration Manager, five years with Jubilee Mines where he built the team responsible for numerous discoveries at the Cosmos Nickel Mine and the Sinclair nickel project, and three years with Talisman Mining as Technical Director. At Jubilee he was part of the corporate team responsible for the growth of the company until it was taken over by Xstrata for $23/share. Mr Langworthy is a non-executive chairman of Syndicated Metals Limited (March 2012 to present).
Mr Langworthy’s special responsibilities are for direction of the exploration programme.
During the past three years Mr Langworthy has held the following other listed company directorship:
Chairman - Syndicated Metals Limited.
For
per
sona
l use
onl
y

Directors’ Report (Continued)
MALAGASY MINERALS LIMITED ABN 84 121 700 105 17
2. COMPANY SECRETARIES Graeme Boden and Natasha Forde were appointed as joint Company Secretaries on 30 September 2012.
Ms Forde has 8 years’ experience, as an employee of Boden Corporate Services Pty Ltd, providing company secretarial and accounting services to a range of ASX listed and unlisted companies. 3. MEETINGS OF DIRECTORS During the financial year, the directors’ attendance at meetings of directors and committees of directors were as follows: Directors’
Meetings Committee Meetings
Audit Remuneration Nomination Director A B A B A B A B G Le Clezio 7 7 1 - - - - - P Langworthy 7 7 1 - - - - - P Woods 7 5 1 1 - - - - G Boden 7 7 1 1 - - - - A = Number eligible to attend B = Number attended
The Full Board sits as the Audit, Remuneration and Nomination Committees when those responsibilities are required to be fulfilled. 4. PRINCIPAL ACTIVITIES The principal activities of the economic entity during the financial year were mineral exploration and project evaluation. No significant change in the nature of these activities occurred during the financial year. 5. OPERATING RESULTS The consolidated loss of the economic entity after providing for income tax amounted to $602,532 (2014: Profit $229,752). 6. DIVIDENDS PAID OR RECOMMENDED No dividends were paid or recommended to be paid during the financial year (2014: Nil). 7. REVIEW OF OPERATIONS A review of the economic entity's operations during the year and the results of those operations are contained in the Operating and Financial Review section of this Annual Report from page 2. 8. FINANCIAL POSITION The net assets of the economic entity have decreased by $543,092 to $6,832,028 during the financial year.
Exploration activities and administrative costs have only been offset in part by proceeds from “available for sale assets”.
The directors believe the group is in a financial position to progress its objectives and strategies. 9. SIGNIFICANT CHANGES IN STATE OF AFFAIRS Other than as set out elsewhere in the report, there were no significant changes in the state of affairs. 10. SUBSEQUENT EVENTS There were no material events arising subsequent to 30 June 2015 to the date of this report which may significantly affect the operations of the economic entity, the results of those operations and the state of affairs of the economic entity in the future, other than:
• The deregistration of the Mauritian subsidiary, Ampanihy Exploration Limited
For
per
sona
l use
onl
y

Directors’ Report (Continued)
MALAGASY MINERALS LIMITED ABN 84 121 700 105 18
11. FUTURE DEVELOPMENTS Likely future developments in the operations of the economic entity are referred to in the Operating and Financial Review section of this Annual Report. 12. ENVIRONMENTAL ISSUES Mining and exploration operations in Madagascar are subject to environmental regulation under the Laws of Madagascar. The economic entity’s current activities generally involve low level disturbance only associated with geochemical and geophysical surveys and exploration drilling programmes. There have been no breaches of the Group’s obligations under environmental laws. 13. DIRECTORS INTERESTS As at the date of this report, the interests of the Directors in shares and options of the Company were:
Director No. of SharesNo. of Unlisted
OptionsG LeClezio 14,347,591 2,000,000 P Woods 3,507,078 2,000,000 G Boden - 750,000 P Langworthy 3,008,218 900,000
14. CORPORATE GOVERNANCE The Company’s corporate governance statement can be found at the following URL: http://www.malagasyminerals.com/images/files/141110_MGY_Corporate_Governance_Statement.pdf 15. REMUNERATION REPORT (AUDITED) This report details the nature and amount of remuneration for each Key Management Personnel of Malagasy Minerals Limited.
The remuneration policy was approved by the Board. Executives receive a base salary, superannuation, fringe benefits, performance incentives and retirement benefits as relevant or appropriate to their position. The remuneration committee reviews executive packages annually by reference to company performance, executive performance, comparable information from industry sectors and other listed companies and independent advice. The performance of executives is reviewed annually, by the remuneration committee, with revised remuneration packages generally taking effect from the 1st of July of that year.
Executives may be granted unlisted share options from time to time, as determined by the Board.
The Board expects that the remuneration structure implemented will result in the company being able to attract and retain executives to manage the economic entity. It will also provide executives with the necessary incentives to work towards sustainable growth in shareholder value.
The payment of bonuses, options and other incentive payments are reviewed by the remuneration committee annually as part of the review of executive remuneration and a recommendation is put to the Board for approval. All bonuses, options and incentives must be linked to predetermined performance criteria. The Board can exercise its discretion in relation to approving incentives, bonuses and options and can recommend changes to the committee's recommendations. Any changes must be justified by reference to measurable performance criteria.
Details of Remuneration for Year Ended 30 June 2015:
During the year there was one key management person who served as a full time executive for the Company. The Country Manager and CFO in Madagascar held that position for the full year.
The Directors have fulfilled the management roles in the Company on a non-executive basis, with no changes in the fees which they would have been paid as directors, other than as set out below.
Mr Leclezio, Dr Woods and Mr Langworthy agreed to take their fees as equity, subject to shareholder approval, for the entire financial year.
For
per
sona
l use
onl
y

Directors’ Report (Continued)
MALAGASY MINERALS LIMITED ABN 84 121 700 105 19
Mr Boden has not been paid a fee for his services as a director since mid-2012, when Boden Corporate Services Pty Ltd, of which he is a director, began receiving fees for services provided by its employees on an hourly basis at rates charged to all of its clients.
Mr Langworthy is a director and shareholder of Omni GeoX Pty Ltd, which is paid for the exploration services provided by its employees at hourly rates charged to all its clients. From 1 January 2014, Mr Langworthy agreed to take his directors fees as equity on the same basis as the other non-executive directors.
(a) Remuneration for Key Management Personnel of the economic entity during the year was as follows:
2015 Key Management Personnel:
Director Fees
$
Other Services Fees
$
Super Contributions
$
Share Based Expense
$ Total
$
Performance related
% Directors: P Woods 43,800 - - - 43,800 -G LeClezio 43,800 - - - 43,800 -G Boden(1) - 72,999 - - 72,999 -P Langworthy(2) 43,800 171,476 - - 215,276 - 131,400 244,475 - - 375,875 -Executives: J L Marquetoux 157,624 - - - 157,624 - - 289,024 244,475 - - 533,499 - 2014 Key Management Personnel:
Director Fees
$
Other Services Fees
$
Super Contributions
$
Share Based Expense
$ Total
$
Performance related
% Directors: P Woods 40,000 - 3,700 7,040 50,740 -G LeClezio 40,000 - 3,700 7,040 50,740 -G Boden - 93,710 - 2,640 96,350 -P Langworthy(2) 20,000 104,565 1,850 - 126,415 -M Cozijn(3) 7,339 - 678 7,040 15,057 - 107,339 198,275 9,928 23,760 339,302 -Executives: J L Marquetoux 169,714 - - 2,210 171,924 - - 277,053 198,275 9,928 25,970 511,226 -Notes: (1) Payments made to G Boden through Boden Corporate Services Pty Ltd (BCS) include time spent on
company activities, including accounting and administration by G Boden and other employees of BCS, including N Forde as Company Secretary.
(2) Payments made to Mr Langworthy, through Omni GeoX Pty Ltd (Omni) include time spent on managing and executing the exploration programme by P Langworthy and other employees of Omni.
(3) M Cozijn resigned as a director on 8 August 2013.
The aggregate amount of remuneration payable to all non-executive directors was set by shareholders at $200,000 per annum.
There were no bonuses paid to any Key Management Personnel during the year.
(b) Equity issued as part of remuneration:
Options:
During 2014, 250,000 options were issued to key management personnel giving rise to $2,210 share based compensation benefits being recorded. The options are exercisable at $0.15 on or before 30th November 2016 and all options vested on the date of issue, 2 August 2013.
During 2013, 6,750,000 unlisted options exercisable at $0.15 on or before 30th November 2016 were issued to Key Management Personnel giving rise to $154,440 share based payment compensation benefits being recorded in that year, and $23,760 being recorded in the 2014 year. Half of the options vested on date of issue, 21 November 2012 and the remaining half vested on 30th November 2013.
For
per
sona
l use
onl
y

Directors’ Report (Continued)
MALAGASY MINERALS LIMITED ABN 84 121 700 105 20
The following table sets out options on issue as at the date of this report, previously granted as compensation and their terms & conditions.
Key Management Person
Vested No.
Granted No.
Grant Date
Value per Option at
Grant DateExercise
Price Allotment
Date Expiry Date
Directors: M Cozijn(1) 2,000,000 2,000,000 16/11/12 $0.02 $0.15 21/11/12 30/11/16 G LeClezio 2,000,000 2,000,000 16/11/12 $0.02 $0.15 21/11/12 30/11/16 P Woods 2,000,000 2,000,000 16/11/12 $0.02 $0.15 21/11/12 30/11/16 G Boden 750,000 750,000 16/11/12 $0.02 $0.15 21/11/12 30/11/16 6,750,000 6,750,000
Executives: JL Marquetoux 250,000 250,000 22/05/13 $0.01 $0.15 02/08/13 30/11/16
Notes: (1) M Cozijn resigned as a director on 8 August 2013. Shares:
As set out in previous annual reports, from 1 April 2013, some directors agreed to take compensation in shares rather than cash, provided that shareholders give approval for the shares to be issued.
At the annual general meeting held on 25 November 2014, shareholders approved the issue of 4,498,654 shares to directors in place of director fees as set out in the following table.
The deemed issue price is equal to the simple average of the closing price of Shares traded on ASX on the first and last trading days of the period.
Director Period
Fees Accrued
$
Issue Price
$
Shares Issued as Compensation
No.
G LeClezio
1 October 2013 to 31 December 2013 10,925 $0.0250 437,0001 January 2014 to 31 March 2014 10,925 $0.0235 464,894
1 April 2014 to 30 June 2014 10,925 $0.0265 412,2641 July 2014 to 30 September 2014 10,925 $0.0330 331,060
P Woods
1 October 2013 to 31 December 2013 10,925 $0.0250 437,0001 January 2014 to 31 March 2014 10,925 $0.0235 464,894
1 April 2014 to 30 June 2014 10,925 $0.0265 412,2641 July 2014 to 30 September 2014 10,925 $0.0330 331,060
P Langworthy 1 January 2014 to 31 March 2014 10,925 $0.0235 464,894
1 April 2014 to 30 June 2014 10,925 $0.0265 412,2641 July 2014 to 30 September 2014 10,925 $0.0330 331,060
$120,175 4,498,654
At 30 June 2015 there is a balance of $98,625 in accrued director’s fees. The number of shares which would potentially be issued to clear this debt, after shareholder approval is 4,234,432 shares, as set out in the following table.
Director Period
Fees Accrued
$
Issue Price
$
Shares Potentially to be Issued as Compensation
No.
G LeClezio 1 October 2014 to 31 December 2014 10,975 $0.020 548,750
1 January 2015 to 31 March 2015 10,950 $0.022 497,7271 April 2015 to 30 June 2015 10,950 $0.030 365,000
P Woods 1 October 2014 to 31 December 2014 10,975 $0.020 548,750
1 January 2015 to 31 March 2015 10,950 $0.022 497,7271 April 2015 to 30 June 2015 10,950 $0.030 365,000
P Langworthy 1 October 2014 to 31 December 2014 10,975 $0.020 548,750
1 January 2015 to 31 March 2015 10,950 $0.022 497,7271 April 2015 to 30 June 2015 10,950 $0.030 365,000
98,625 4,234,431
For
per
sona
l use
onl
y
Directors’ Report (Continued)
MALAGASY MINERALS LIMITED ABN 84 121 700 105 21
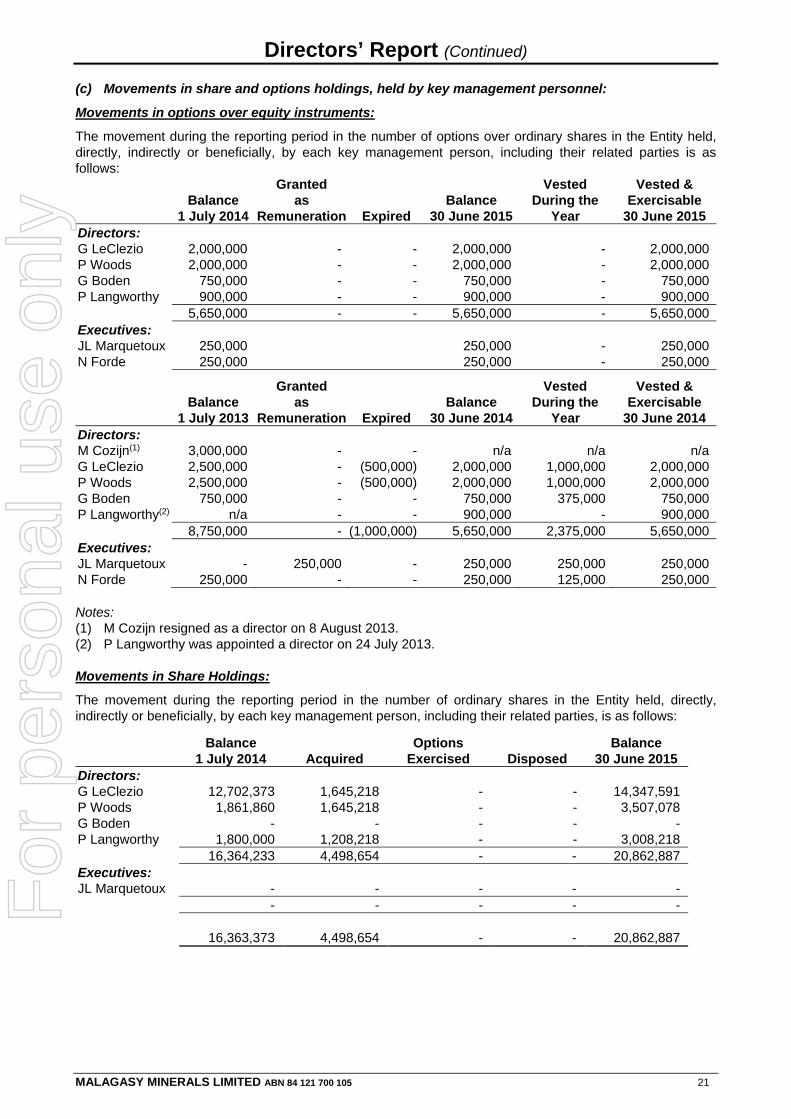
(c) Movements in share and options holdings, held by key management personnel:
Movements in options over equity instruments:
The movement during the reporting period in the number of options over ordinary shares in the Entity held, directly, indirectly or beneficially, by each key management person, including their related parties is as follows:
Balance
1 July 2014
Granted as
Remuneration Expired Balance
30 June 2015
Vested During the
Year
Vested & Exercisable
30 June 2015 Directors: G LeClezio 2,000,000 - - 2,000,000 - 2,000,000P Woods 2,000,000 - - 2,000,000 - 2,000,000G Boden 750,000 - - 750,000 - 750,000P Langworthy 900,000 - - 900,000 - 900,000 5,650,000 - - 5,650,000 - 5,650,000Executives: JL Marquetoux 250,000 250,000 - 250,000N Forde 250,000 250,000 - 250,000
Balance
1 July 2013
Granted as
Remuneration Expired Balance
30 June 2014
Vested During the
Year
Vested & Exercisable
30 June 2014 Directors: M Cozijn(1) 3,000,000 - - n/a n/a n/aG LeClezio 2,500,000 - (500,000) 2,000,000 1,000,000 2,000,000P Woods 2,500,000 - (500,000) 2,000,000 1,000,000 2,000,000G Boden 750,000 - - 750,000 375,000 750,000P Langworthy(2) n/a - - 900,000 - 900,000 8,750,000 - (1,000,000) 5,650,000 2,375,000 5,650,000Executives: JL Marquetoux - 250,000 - 250,000 250,000 250,000N Forde 250,000 - - 250,000 125,000 250,000
Notes: (1) M Cozijn resigned as a director on 8 August 2013. (2) P Langworthy was appointed a director on 24 July 2013.
Movements in Share Holdings:
The movement during the reporting period in the number of ordinary shares in the Entity held, directly, indirectly or beneficially, by each key management person, including their related parties, is as follows:
Balance
1 July 2014 Acquired Options
Exercised Disposed Balance
30 June 2015 Directors: G LeClezio 12,702,373 1,645,218 - - 14,347,591 P Woods 1,861,860 1,645,218 - - 3,507,078 G Boden - - - - - P Langworthy 1,800,000 1,208,218 - - 3,008,218 16,364,233 4,498,654 - - 20,862,887 Executives: JL Marquetoux - - - - - - - - - - 16,363,373 4,498,654 - - 20,862,887
For
per
sona
l use
onl
y

Directors’ Report (Continued)
MALAGASY MINERALS LIMITED ABN 84 121 700 105 22
Balance 1 July 2013 Acquired
Options Exercised Disposed
Balance 30 June 2014
Directors: M Cozijn(1) 7,012,501 - - - n/a G LeClezio 11,940,513 761,860 (3) - - 12,702,373 P Woods 1,100,000 761,860 (3) - - 1,861,000 G Boden - - - - - P Langworthy(2) n/a - - - 1,800,000 20,053,014 1,523,720 - - 16,363,373 Executives: JL Marquetoux - - - - - - - - - - 20,053,014 1,523,720 - - 16,363,373 Notes: (1) M Cozijn resigned as a director on 8 August 2013. (2) P Langworthy was appointed a director on 24 July 2013. (3) The shares acquired by Dr Woods, Mr P Langworthy and Mr LeClezio were allotted as compensation for accrued
directors fees after approval by shareholders at the annual general meeting held 27 November 2014.
Related Party Transactions with Key Management Personnel:
Apart from details disclosed in this note, no director has entered into a material contract with the Group since the end of the previous financial year and there were no material contracts involving directors’ interests existing at year end.
Transactions between related parties are on usual commercial terms and conditions no more favourable than those available to other parties unless otherwise stated.
The aggregate amounts recognised during the year relating to key management personnel and their related parties are as follows: ECONOMIC ENTITY
Key Management Person Transaction 2015
$ 2014
$ Mr P Langworthy(1)(2) Exploration programme management 171,456 104,565Mr G Boden(3) Corporate services 73,037 93,710 244,493 198,275
(1) Mr P Langworthy became a key management person on his appointment as a director on 23 July 2014. (2) Omni GeoX Pty Ltd, of which Mr P Langworthy is the Managing Director, provides services in relation to
the management and execution of the exploration programme, for which fees were billed on hourly rates the same as for other clients, as were due and payable under normal terms. The agreement may be terminated by one months’ notice.
(3) Boden Corporate Services Pty Ltd, of which Mr G Boden is a director, provides services in company secretarial, accounting and administration roles for which service fees were billed based on normal market rates, and were due and payable under normal terms. Boden Corporate commenced providing these services from 1 October 2013. The agreement may be terminated by three months’ notice.
Amounts payable to key management personnel at the reporting date arising from these contact services were as set out below:
ECONOMIC ENTITY2015
$ 2014
$ Current payables: Trade and other payables 12,975 19,854
12,975 19,854Company Performance
The following table shows the gross revenue, profits, dividends and share price at the end of financial year for the past five financial years ending 30 June:
Economic Entity 2011 2012 2013 2014 2015 Revenue 850,032 4,160,826 664,831 1,831,271 1,431,541 Net Profit/(Loss) (1,839,989) 2,718,046 (3,262,572) 229,752 (602,534) Share Price at Year End 3.9c 8.5c 1.9c 2.8c 1.8c Dividends Paid - - - - -
For
per
sona
l use
onl
y

Directors’ Report (Continued)
MALAGASY MINERALS LIMITED ABN 84 121 700 105 23
The Board does not consider earnings during the current and previous four financial years when determining, and in relation to, the nature and amount of remuneration of key management personnel. END OF AUDITED REMUNERATION REPORT 16. NON-AUDIT SERVICES No fees were paid or payable to William Buck Audit (WA) Pty Ltd for non-audit services during the year ended 30 June 2015 (2014: Nil). 17. INDEMNIFYING OFFICERS AND AUDITORS The Company has established an insurance policy insuring Directors and officers of the Company against any liability arising from a claim brought by a third party against the Company or its Directors and officers, and against liabilities for costs and expenses incurred by them in defending any legal proceedings arising out of their conduct while acting in their capacity as a Director or officer of the Company, other than conduct involving a wilful breach of duty in relation to the Company.
In accordance with a confidentiality clause under the insurance policy, the amount of the premium paid to insurers will not be disclosed. This is permitted under S300(9) of the Corporation Act 2001.
No indemnity has been obtained for the auditor of the group. 18. SHARE OPTIONS At the date of this report, the unissued ordinary shares of Malagasy Minerals Limited under option are as follows:
Grant Date Date of Expiry Exercise PriceNo.
Under Option 16 November 2012 30 November 2015 $0.15 7,000,000
22 May 2013 30 November 2015 $0.15 500,000 30 September 2012 30 September 2015 $0.30 375,000 31 December 2012 31 December 2015 $0.40 375,000
31 March 2013 31 March 2016 $0.50 375,000 8,625,000
No options were exercised during the year ended 30 June 2015. 19. PROCEEDINGS ON BEHALF OF THE COMPANY No person has applied for leave of court to bring proceedings on behalf of the Company or intervene in any proceedings to which the Company is a party, for the purpose of taking responsibility on behalf of the Company for all or any part of those proceedings. 20. AUDITOR’S INDEPENDENCE DECLARATION The lead auditor’s independence declaration for the year ended 30 June 2015 has been received and can be found on page 24 of the annual report. Signed in accordance with a resolution of the Board of Directors.
G R Boden Director Perth, Western Australia 30th September 2015
For
per
sona
l use
onl
y

For
per
sona
l use
onl
y

Consolidated Statement of Profit or Loss and Comprehensive Income
For the year ended 30 June 2015
MALAGASY MINERALS LIMITED ABN 84 121 700 105 25
ECONOMIC ENTITY Note
2015 $
2014 $
Revenue 2 1,431,541 1,831,271Fair value gain/ (loss) on financial assets 3 (177,757) 20,287Employee benefits expense (563,517) (586,635)Depreciation expense 4 (61,706) (81,954)Administration costs (462,101) (537,088)Exploration expenditure 4 (447,244) (383,590)Foreign exchange movements 22,361 2,711Provision for impairment of receivable (338,650) -Share-based payments - (29,060) Profit / (Loss) before income tax expense (597,073) 235,942 Income tax benefit / (expense) 5 (5,459) (6,190) Net (loss) / profit attributable to members of the parent entity (602,532) 229,752 Other Comprehensive Income: Items that may be re-classified to profit or loss: Adjustment from translation of foreign controlled entities (60,735) (61,880) Income tax relating to components of other comprehensive income - - Total Comprehensive (Loss) / Income for the year attributable to members of the parent entity.
(663,267) 167,872
Overall Operations: Basic and dilutive earnings/(loss) per share - cents per share
18 (0.37) 0.14
The accompanying notes form part of these financial statements
For
per
sona
l use
onl
y
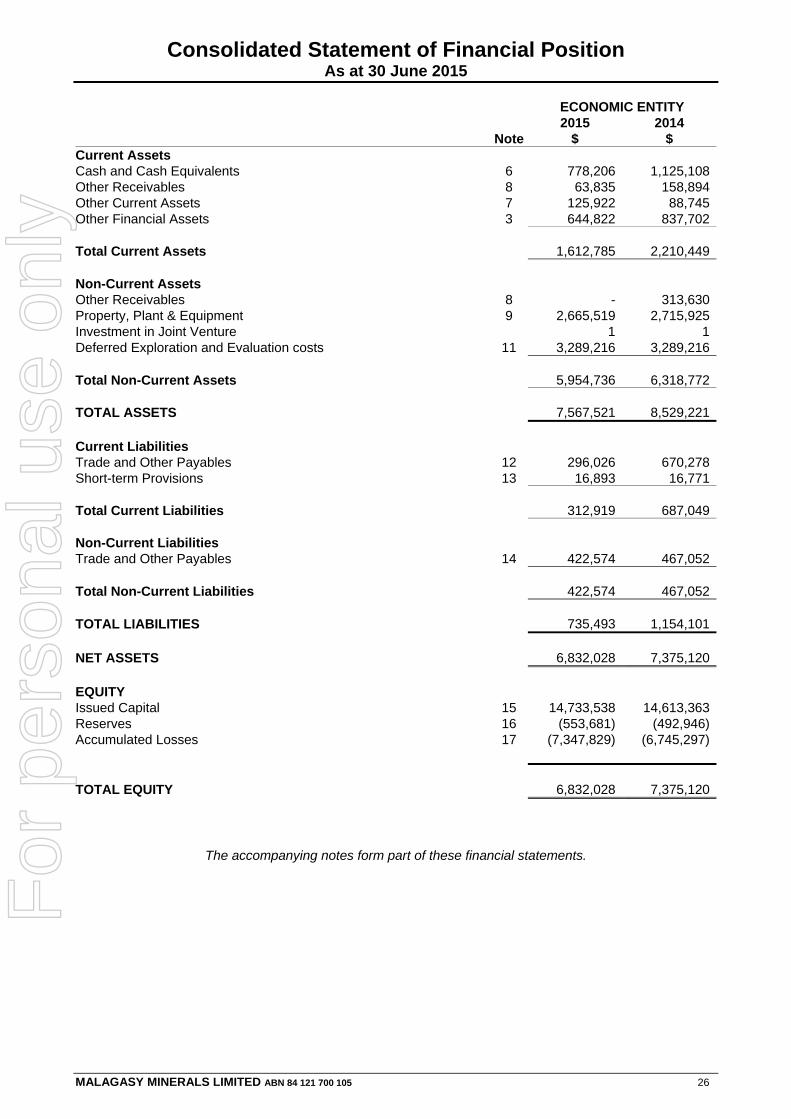
Consolidated Statement of Financial Position As at 30 June 2015
MALAGASY MINERALS LIMITED ABN 84 121 700 105 26
ECONOMIC ENTITY
Note2015
$ 2014
$Current Assets Cash and Cash Equivalents 6 778,206 1,125,108Other Receivables 8 63,835 158,894Other Current Assets 7 125,922 88,745Other Financial Assets 3 644,822 837,702 Total Current Assets 1,612,785 2,210,449 Non-Current Assets Other Receivables 8 - 313,630Property, Plant & Equipment 9 2,665,519 2,715,925Investment in Joint Venture 1 1Deferred Exploration and Evaluation costs 11 3,289,216 3,289,216 Total Non-Current Assets 5,954,736 6,318,772 TOTAL ASSETS 7,567,521 8,529,221 Current Liabilities Trade and Other Payables 12 296,026 670,278Short-term Provisions 13 16,893 16,771 Total Current Liabilities 312,919 687,049 Non-Current Liabilities Trade and Other Payables 14 422,574 467,052 Total Non-Current Liabilities
422,574 467,052
TOTAL LIABILITIES
735,493 1,154,101
NET ASSETS 6,832,028 7,375,120 EQUITY Issued Capital 15 14,733,538 14,613,363Reserves 16 (553,681) (492,946)Accumulated Losses 17 (7,347,829) (6,745,297) TOTAL EQUITY 6,832,028 7,375,120
The accompanying notes form part of these financial statements.
For
per
sona
l use
onl
y

Consolidated Statement of Changes in Equity For the year ended 30 June 2015
MALAGASY MINERALS LIMITED ABN 84 121 700 105 27
ECONOMIC ENTITY
Issued Capital
$
Accumulated Losses
$
Foreign Currency
Translation Reserve
$
Option Reserve
$ Total
$ Balance at 30 June 2013 14,555,337 (7,235,952) (631,419) 432,196 7,120,162 Shares issued during the year 58,026 - - - 58,026Transfer from Option Reserve - 260,903 - (260,903) -Movement in Share Option Reserve - - - 29,060 29,060Profit/ (Loss) attributable to members of parent entity - 229,752 - - 229,752Other Comprehensive Income - - (61,880) - (61,880) Balance at 30 June 2014 14,613,363 (6,745,297) (693,299) 200,353 7,375,120 Shares issued during the year 120,175 - - 120,175Profit/ (Loss) attributable to members of parent entity - (602,532) - (602,532)Other Comprehensive Income - - (60,735) - (60,735) Balance at 30 June 2015 14,733,538 (7,347,829) (754,034) 200,353 6,832,028
The accompanying notes form part of these financial statements
For
per
sona
l use
onl
y

Consolidated Statement of Cash Flows For the year ended 30 June 2015
MALAGASY MINERALS LIMITED ABN 84 121 700 105 28
ECONOMIC ENTITY
Note2015
$ 2014
$Cash flows from Operating Activities Payments to suppliers and employees (904,121) (779,794)Payments for exploration expenditure (842,905) (216,737)Interest received 14,627 15,479Receipts from customers 279,758 396,834 Net cash used in operating activities 20 (1,452,641) (584,218) Cash flows from Investing Activities Payments for property, plant and equipment (11,300) (10,927)Proceeds on sale of fixed assets - 3,000Proceeds on sale of financial assets 225,899 1,038,663Proceeds on sale of exploration permits 219,968 -Proceeds on sale of Joint Venture Interest 717,659 379,740 Net cash provided by investing activities 1,152,226 1,410,476 Cash flows from Financing Activities Share Purchase Agreement Instalment Payments (44,478) (57,867) Net cash flows used in financing activities
(44,478) (57,867)
Net (decrease)/ increase in cash held (344,893) 768,391 Cash and cash equivalent at the beginning of the financial year 6 1,125,108 409,811 Effect of exchange rates on cash holdings in foreign currencies (2,009) (53,094) Cash and cash equivalent at the end of the financial year 6 778,206 1,125,108
The accompanying notes form part of these financial statements.
For
per
sona
l use
onl
y

Notes to the Financial Statements For the year ended 30 June 2015
MALAGASY MINERALS LIMITED ABN 84 121 700 105 29
NOTE 1 – STATEMENT OF SIGNIFICANT ACCOUNTING POLICIES
The consolidated financial report is a general purpose financial report that has been prepared in accordance with Australian Accounting Standards, Australian Accounting Interpretations and other authoritative pronouncements of the Australian Accounting Standards Board and the Corporations Act 2001.
The financial statements were authorised for issue on 30th September 2015 by the Directors of the Company.
Compliance with Australian Accounting Standards ensures that the financial statements and notes also comply with International Financial Reporting Standards. Material accounting policies adopted in the preparation of the financial statements are presented below and have been consistently applied unless otherwise stated.
The consolidated financial statements of Malagasy Minerals Limited as at the year ended 30 June 2015 comprises the company and its subsidiaries (together referred to as the ‘Group’ or ‘Economic Entity’). Malagasy Minerals Limited is a listed public company, incorporated and domiciled in Australia. The Group is a for profit entity for financial reporting purposes under Australian Accounting Standards.
The separate financial statements of the parent entity, Malagasy Minerals Limited, have not been presented within this financial report as permitted by the Corporations Act 2001.
Basis of Preparation:
Going Concern Basis
The financial report has been prepared on the going concern basis which assumes continuity of normal business activities and the realisation of assets and the settlement of liabilities in the ordinary course of business.
For the year ended 30 June 2015 the Company has made a loss of $602,532 (2014: profit of $229,752) and at year end the Company had working capital of $1,299,866, (2014: $1,523,400) including a cash and cash equivalents balance of $778,206 (2014: $1,125,108). Cash used in operating activities in 2015 was $1,452,641 (2014: $584,216).
These conditions indicate a material uncertainty that may cast significant doubt about the Consolidated Entity’s ability to continue as a going concern.
The Directors believe it is appropriate to prepare the financial statements on a going concern basis after consideration of the following matters:
- The consolidated entity continues to receive income from the following revenue streams; royalties, rental income and interest received.
- The consolidated entity has 2,500,000 saleable shares held in Energizer Resources Inc, a Toronto Securities Exchange listed entity and a further 1,000,000 shares which will be released from Escrow in May 2016.
- The directors have agreed to offset payment of their fees for additional shares for the total amount of $98,625 outstanding at 30 June 2015 and for director’s fees for the subsequent 12 months which is being accrued as a loan subordinate to all other debts of the company. The directors will not request the loan be repaid in cash up to 12 months from the date of signing this report.
- There is capacity for the consolidated entity to reduce its operating cost structure and related cash flows to ensure the consolidated entity can continue to operate as a going concern 12 months from the date of signing this report.
The ability of the Consolidated Entity to execute additional exploration activities requires the Consolidated Entity to secure additional funds within the next 12 months.
Should the Consolidated Entity be unable achieve the matters as set out above, there is uncertainty whether the Consolidated Entity would continue as a going concern and therefore, whether it would realise its assets and extinguish its liabilities in the normal course of business and at the amounts stated in the financial report. The financial report does not include adjustments relating to the recoverability or classification of the recorded assets amounts or to the amounts or classification of liabilities that might be necessary should the Consolidated Entity not be able to continue as a going concern.
For
per
sona
l use
onl
y
Notes to the Financial Statements (Continued) For the year ended 30 June 2015
MALAGASY MINERALS LIMITED ABN 84 121 700 105 30
NOTE 1 – STATEMENT OF SIGNIFICANT ACCOUNTING POLICIES (Continued)
Reporting Basis and Conventions
Except for the cash flow information the financial report has been prepared on an accruals basis and is based on historical costs modified by the revaluation of selected non-current assets, and financial assets and financial liabilities for which the fair value basis of accounting has been applied.
Accounting Policies:
(a) Principles of Consolidation
The consolidated financial statements incorporate the financial statements of the Consolidated Entity and Entities (including special purpose entities) controlled by the Consolidated Entity (its subsidiaries). The parent controls an entity when it is exposed to, or has rights to, variable returns from its involvement with the entity and has the ability to affect those returns through its power over the entity. A list of the subsidiaries is provided in note 26.
The financial statements of the subsidiaries are prepared for the same reporting period as the parent entity, using consistent accounting policies.
In preparing the consolidated financial statements, all intercompany balances and transactions, income and expenses and profit and losses resulting from intra-group transactions have been eliminated in full.
Subsidiaries are fully consolidated from the date on which control is transferred to the group and cease to be consolidated from the date on which control is transferred out of the group.
Unrealised gains or transactions between the group and its associates are eliminated to the extent of the group’s interests in the associates. Unrealised losses are also eliminated unless the transaction provides evidence of an impairment of the asset transferred. Accounting policies of associates have been changed where necessary to ensure consistency with the policies adopted by the group.
When the group ceases to have control, joint control or significant influence, any retained interest in the entity is remeasured to its fair value with the change in carrying amount recognised in profit or loss. The fair value is the initial carrying amount for the purposes of subsequently accounting for the retained interest as an associate, joint controlled entity or financial asset. In addition, any amounts previously recognised in other comprehensive income in respect of that entity are accounted for as if the group had directly disposed of the related assets or liabilities. This may mean that amounts previously recognised in other comprehensive income are reclassified to profit or loss.
Non-controlling interests in the equity and results of the entities that are controlled are shown as a separate item in the consolidated financial report, to the extent that they are considered material.
(b) Income Tax
The charge for current income tax expenses is based on the profit for the year adjusted for any non-assessable or disallowed items. It is calculated using tax rates that have been enacted or are substantively enacted by the reporting date.
Deferred tax is accounted for using the balance sheet liability method in respect of temporary differences arising between the tax bases of assets and liabilities and their carrying amounts in the financial statements. No deferred income tax will be recognised from the initial recognition of an asset or liability, excluding a business combination, where there is no effect on accounting or taxable profit or loss. Deferred tax is calculated at the tax rates that are expected to apply to the period when the asset is realised or liability is settled. Deferred tax is credited in the statement of profit and loss and other comprehensive income except where it relates to items that may be credited directly to equity, in which case the deferred tax is adjusted directly against equity.
Deferred income tax assets are recognised to the extent that it is probable that future tax profits will be available against which deductible temporary differences can be utilised.
The amount of benefits brought to account or which may be realised in the future is based on the assumption that no adverse change will occur in income taxation legislation and the anticipation that the economic entity will derive sufficient future assessable income to enable the benefit to be realised and comply with the conditions of deductibility imposed by the law.
For
per
sona
l use
onl
y

Notes to the Financial Statements (Continued) For the year ended 30 June 2015
MALAGASY MINERALS LIMITED ABN 84 121 700 105 31
NOTE 1 – STATEMENT OF SIGNIFICANT ACCOUNTING POLICIES (Continued)
(c) Property, Plant and Equipment
Each class of property, plant and equipment is carried at cost less, where applicable, any accumulated depreciation and impairment losses.
Property
Land and Buildings are measured on the cost basis less accumulated depreciation in accordance with a 99 year lease. The carrying amount is reviewed annually by the Directors and independent valuations will be commissioned as and when required.
Plant and equipment
Plant and equipment are measured on the cost basis less depreciation and impairment losses.
Subsequent costs are included in the asset’s carrying amount or recognised as a separate asset, as appropriate, only when it is probable that future economic benefits associated with the item will flow to the group and the cost of the item can be measured reliably. All other repairs and maintenance are charged to the income statement during the financial period in which they are incurred.
Depreciation
The depreciable amount of all fixed assets including capitalised lease assets, but excluding computers, is depreciated on a reducing balance commencing from the time the asset is held ready for use.
The depreciation rates used for each class of depreciable assets are:
Class of Fixed Asset Depreciation Rate Land and Buildings 1% Plant and Equipment 7.5% - 50% Motor vehicles 20% Field equipment 40%
The assets’ residual values and useful lives are reviewed, and adjusted if appropriate, at the end of the reporting period. An asset’s carrying amount is written down immediately to its recoverable amount if the asset’s carrying amount is greater than its estimated recoverable amount.
Gains and losses on disposals are determined by comparing proceeds with the carrying amount. These gains and losses are included in the statement of profit or loss and other comprehensive income.
(d) Exploration, Evaluation and Development Expenditure
Exploration, evaluation and development expenditure incurred is either written off as incurred or accumulated in respect of each identifiable area of interest. Tenement acquisition costs are initially capitalised. Costs are only carried forward to the extent that they are expected to be recouped through the successful development of the area, sale of the respective areas of interest or where activities in the area have not yet reached a stage, which permits reasonable assessment of the existence of economically recoverable reserves.
Accumulated costs in relation to an abandoned area are written off in full against profit in the year in which the decision to abandon the area is made.
When production commences, the accumulated costs for the relevant area of interest are amortised over the life of the area according to the rate of depletion of the economically recoverable reserves.
A regular review is undertaken of each area of interest to determine the appropriateness of continuing to carry forward costs in relation to that area of interest.
Immediate restoration, rehabilitation and environmental costs necessitated by exploration and evaluation activities are expensed as incurred and treated as exploration and evaluation expenditure. Exploration activities resulting in future obligations in respect of restoration costs result in a provision to be made by capitalising the estimated costs, on a discounted cash basis, of restoration and depreciating over the useful life of the asset. The unwinding of the effect of the discounting on the provision is recorded as a finance cost on the statement of profit or loss and other comprehensive income.
For
per
sona
l use
onl
y

Notes to the Financial Statements (Continued) For the year ended 30 June 2015
MALAGASY MINERALS LIMITED ABN 84 121 700 105 32
NOTE 1 – STATEMENT OF SIGNIFICANT ACCOUNTING POLICIES (Continued)
(e) Financial Instruments
Recognition and measurement
Financial instruments are initially measured at fair value on trade date, which includes transaction costs, when the related contractual rights or obligations exist. Subsequent to initial recognition these instruments are measured as set out below.
Loans and receivables
Loans and receivables are non-derivative financial assets with fixed or determinable payments that are not quoted in an active market and are stated at amortised cost using the effective interest rate method.
Financial assets at fair value through profit or loss
Financial assets are classified at “fair value through profit or loss” when they are held for trading for the purpose of short-term profit taking. Such assets are subsequently measured at fair value with changes in carrying amount being included in the statement of profit or loss and other comprehensive income.
Financial liabilities
Non-derivative financial liabilities are recognised at amortised cost, comprising original debt less principal payments and amortisation.
Fair value
Fair value is determined based on current bid process for all quoted investments. Valuation techniques are applied to determine the fair value for all unlisted securities, including recent arm’s length transactions, reference to similar instruments and option pricing models.
Impairment
At each reporting date, the group assess whether there is objective evidence that a financial instrument has been impaired. In the case of available-for sale financial instruments, a prolonged decline in the value of the instrument is considered to determine whether impairment has arisen. Impairment losses are recognised in the income statement.
(f) Impairment of Debtors
Impairment of trade receivables is continually reviewed and those that are considered to be uncollectible are written off by reducing the carrying amount directly. An allowance account is used when there is objective evidence that the Group will not be able to collect all amounts due according to the original contractual terms. Factors considered by the Group in making this determination include known significant financial difficulties of the debtor, review of financial information and significant delinquency in making contractual payments to the Group. The impairment allowance is set equal to the difference between the carrying amount of the receivable and the present value of estimated future cash flows, discounted at the original effective interest rate. Where receivables are short‐term discounting is not applied in determining the allowance.
The amount of the impairment loss is recognised in the statement of comprehensive income within other expenses. When a trade receivable for which an impairment allowance had been recognised becomes uncollectible in a subsequent period, it is written off against the allowance account. Subsequent recoveries of amounts previously written off are credited against other expenses in the statement of comprehensive income.
(g) Impairment of Assets
At each reporting date, the group reviews the carrying values of its tangible and intangible assets to determine whether there is any indication that those assets have been impaired. If such an indication exists, the recoverable amount of the assets, being the higher of the asset’s fair value less costs to sell and value in use, is compared to the asset’s carrying value. Any excess of the asset’s carrying value over its recoverable amount is expensed to the statement of profit or loss and other comprehensive income.
Where it is not possible to estimate the recoverable amount of an individual asset, the group estimates the recoverable amount of the cash-generating unit to which the asset belongs.
For
per
sona
l use
onl
y

Notes to the Financial Statements (Continued) For the year ended 30 June 2015
MALAGASY MINERALS LIMITED ABN 84 121 700 105 33
NOTE 1 – STATEMENT OF SIGNIFICANT ACCOUNTING POLICIES (Continued)
(h) Interests in Joint Ventures
The Groups interests in the joint venture entity is recorded using the equity method of accounting in the consolidated financial statements. Details of the Groups interest is provided in Note 10.
(i) Foreign Currency Transactions and Balances
Functional and presentation currency
The functional currency of each of the group’s entities is measured using the currency of the primary economic environment in which that entity operates. The consolidated financial statements are presented in Australian dollars which is the parent entity’s functional and presentation currency.
Transaction and balances
Foreign currency transactions are translated into functional currency using the exchange rates prevailing at the date of the transaction. Foreign currency monetary items are translated at the year-end exchange rate. Non-monetary items measured at historical cost continue to be carried at the exchange rate at the date of the transaction.
Exchange differences arising on the translation of monetary items are recognised in the statement of profit or loss and other comprehensive income.
Exchange differences arising on the translation of non-monetary items are recognised directly in equity to the extent that the gain or loss is directly recognised in equity; otherwise the exchange difference is recognised in the statement of profit or loss and other comprehensive income.
Group companies
The financial results and position of foreign operations, whose functional currency is different from the Group’s presentation currency, are translated as follows:
- Assets and liabilities are translated at exchange rates prevailing at the end of the reporting period; - Income and expenses are translated at average exchange rates for the period, when the average rate
approximates the rate at the date of the transaction; and - Retained earnings are translated at the exchange rates prevailing at the date of the transaction.
Exchange differences arising on translation of foreign operations with functional currencies other than Australian dollars are recognised in other comprehensive income and included in foreign currency translation reserve in the statement of financial position. These differences are recognised in the statement of profit or loss and other comprehensive income in the period in which the operation is disposed of.
(j) Employee Benefits
Short-term employee benefits:
Provision is made for the Group’s obligation for short-term employee benefits. Short-term employee benefits are benefits (other than termination benefits) that are expected to be settled wholly before 12 months after the end of the annual reporting period in which the employees render the related service, including wages, salaries and sick leave. Short-term employee benefits are measured at the (undiscounted) amounts expected to be paid when the obligation is settled.
The Group’s obligations for short-term employee benefits such as wages, salaries and sick leave are recognised as a part of current trade and other payables in the statement of financial position. The Group’s obligations for employees’ annual leave and long service leave entitlements are recognised as provisions in the statement of financial position.
Other long-term employee benefits:
Provision is made for employees’ long service leave and annual leave entitlements not expected to be settled wholly within 12 months after the end of the annual reporting period in which the employees render the related service. Other long-term employee benefits are measured at the present value of the expected future payments to be made to employees. Expected future payments incorporate anticipated future wage and salary levels, durations of service and employee departures and are discounted at rates determined by reference to market yields at the end of the reporting period on corporate bonds that have maturity dates that approximate the terms of the obligations.
For
per
sona
l use
onl
y

Notes to the Financial Statements (Continued) For the year ended 30 June 2015
MALAGASY MINERALS LIMITED ABN 84 121 700 105 34
NOTE 1 – STATEMENT OF SIGNIFICANT ACCOUNTING POLICIES (Continued)
Any remeasurements for changes in assumptions of obligations for other long-term employee benefits are recognised in profit or loss in the periods in which the changes occur.
The Group’s obligations for long-term employee benefits are presented as non-current provisions in its statement of financial position, except where the Group does not have an unconditional right to defer settlement for at least 12 months after the end of the reporting period, in which case the obligations are presented as current provisions.
Defined contribution superannuation benefits:
All employees of the Group, located in Australia receive defined contribution superannuation entitlements, for which the Group pays the fixed superannuation guarantee contribution (currently 9.50% of the employee’s average ordinary salary) to the employee’s superannuation fund of choice. All contributions in respect of employees’ defined contribution entitlements are recognised as an expense when they become payable. The Group’s obligation with respect to employees’ defined contribution entitlements is limited to its obligation for any unpaid superannuation guarantee contributions at the end of the reporting period. All obligations for unpaid superannuation guarantee contributions are measured at the (undiscounted) amounts expected to be paid when the obligation is settled and are presented as current liabilities in the Group’s statement of financial position.
Equity-settled compensation:
Share-based payments to employees are measured at the fair value of the instruments issued and amortised over the vesting periods. Share-based payments to non-employees are measured at the fair value of goods or services received or the fair value of the equity instruments issued, if it is determined the fair value of the goods or services cannot be reliably measured, and are recorded at the date the goods or services are received. The corresponding amount is recorded to the option reserve. The fair value of options is determined using the Black-Scholes pricing model. The number of shares and options expected to vest is reviewed and adjusted at the end of each reporting period such that the amount recognised for services received as consideration for the equity instruments granted is based on the number of equity instruments that eventually vest.
(k) Provisions
Provisions are recognised when the group has a legal or constructive obligation, as a result of past events, for which it is probable that an outflow of economic benefits will result and that outflow can be reliably measured.
(l) Cash and Cash Equivalents
Cash and cash equivalents includes cash on hand, deposits held at call with banks, other short-term highly liquid investments with original maturities of three months or less.
(m) Revenue and Other Income
Revenue from the sale of goods is recognised upon the delivery of goods to customers. Interest revenue is recognised on a proportional basis taking into account the interest rates applicable to the financial assets. Revenue from the rendering of a service is recognised upon the delivery of the service to the customers. Revenue from Royalties are recognised upon delivery of goods to customers or to the minimum monthly contractual amount.
Rental income is recognised on a straight line basis over the period of the lease term so as to reflect a constant periodic return on the property.
Revenue is measured at fair value of the consideration received or receivable to the extent that it is probable that the economic benefit will flow to the entity and the revenue can be measured reliably.
All revenue is stated net of the amount of goods and services tax (GST).
(n) Goods and Services Tax (GST)
Revenues, expenses and assets are recognised net of the amount of GST, except where the amount of GST incurred is not recoverable from the Australian Tax Office. In these circumstances the GST is recognised as part of the cost of acquisition of the asset or as part of an item of the expense. Receivables and payables in the statement of financial position are shown inclusive of GST.
For
per
sona
l use
onl
y

Notes to the Financial Statements (Continued) For the year ended 30 June 2015
MALAGASY MINERALS LIMITED ABN 84 121 700 105 35
NOTE 1 – STATEMENT OF SIGNIFICANT ACCOUNTING POLICIES (Continued)
Cash flows are presented in the cash flow statement on a gross basis, except for the GST component of investing and financing activities, which are disclosed as operating cash flows.
(o) Contributed Equity
Issued and paid up capital is recognised at the fair value of the consideration received by the company. Any transaction costs arising on the issue of ordinary shares are recognised directly in equity as a reduction of the share proceeds received.
(p) Comparative Figures
When required by Accounting Standards, comparative figures have been adjusted to conform to changes in presentation for the current financial year.
(q) Critical Accounting Estimates and Judgments
The directors evaluate estimates and judgments incorporated into the financial report based on historical knowledge and best available current information. Estimates assume a reasonable expectation of future events and are based on current trends and economic data, obtained both externally and within the group.
Key Estimates:
Impairment
The group assesses impairment at each reporting date by evaluating conditions specific to the group that may lead to impairment of assets. Where an impairment trigger exists, the recoverable amount of the asset is determined. Impairment of investments in subsidiaries arises where the carrying value of the asset exceeds the net asset position of the subsidiaries and impairment is recognised to the value of the deficit. Impairment of Intangible assets is recognised upon managements’ best estimate that the carrying value exceeds the fair value of the asset considering future cash flows and profits arising from the asset.
No impairment has been recognised in respect of costs carried forward as exploration assets. The ultimate recoupment of value is dependent on the successful development and commercial exploitation or sale of the respective areas.
Key Judgements:
Exploration and Evaluation Expenditure
Tenement acquisition costs are initially capitalised and then amortised with other exploration and evaluation expenditure written off as incurred. Costs are only carried forward to the extent that they are expected to be recouped through the successful development of the area, sale of the respective areas of interest or where activities in the area have not yet reached a stage, which permits reasonable assessment of the existence of economically recoverable reserves. A regular review is undertaken of each area of interest to determine the appropriateness of continuing to carry forward costs in relation to that area of interest. The Directors believe that the capitalised exploration expenditure should not be written off at reporting date as the tenements areas have been reviewed for impairment indicators and Directors believe no indicators of impairment exist.
Non-Current Receivables
Non-Current Receivables includes the tax (TVA) recoverable from the Madagascan tax authority. The Directors believe the full amount to be non-recoverable at 30 June 2015 and therefore a provision for impairment has been made.
Accrued Expenses
Accrued expenses are amounts in respect of the Share Sale Agreement with WTR Holdings Pty Ltd (formerly Madagascar Resources NL). The liability is only repayable from 70% of the labradorite royalty cash receipts by MADA-Aust SARL and is split between current and non-current portions. The directors believe the royalty generating operations will continue at a rate which will pay the liability in accordance with the agreement and have not identified any factors indicating impairment. The current portion of the liability is based on the estimate of the next financial year’s cash receipts with the remaining balance not expected to be settled in the next financial year treated as non-current.
For
per
sona
l use
onl
y

Notes to the Financial Statements (Continued) For the year ended 30 June 2015
MALAGASY MINERALS LIMITED ABN 84 121 700 105 36
NOTE 1 – STATEMENT OF SIGNIFICANT ACCOUNTING POLICIES (Continued)
(r) Other receivables
Other receivables include amounts due from customers for services performed in the ordinary course of business. Receivables expected to be collected within 12 months of the end of the reporting period are classified as current assets. All other receivables are classified as non-current assets. Other receivables are initially recognised at fair value and subsequently measured at amortised cost using the effective interest method, less any provision for impairment. Refer to Note 1(f) for further discussion on the determination of impairment losses.
(s) Other payables
Other payables are carried at amortised cost and represent liabilities for goods and services provided to the Group prior to the end of the financial year that are unpaid and arise when the Group becomes obliged to make future payments in respect of the purchase of these goods and services. Trade and other payables are presented as current liabilities unless payment is not due within 12 months.
(t) Adoption of New and Revised Accounting Standards
The Group has adopted all of the new and revised pronouncements which became mandatory for annual reporting periods beginning on or after 1 July 2014.
AASB 1031 Materiality
The revised standard is an interim standard that cross references to other standards and the framework that contains guidance on materiality. Reference to AASB 1031 are progressively being removed from other standards and once completed this standard will also be withdrawn.
AASB 2012-3 Amendments to Australian Accounting Standards – Offsetting Financial Assets and Financial Liabilities
This standard adds application guidance to AASB 132 to address inconsistencies identified in applying some of the offsetting criteria of AASB 132, including clarifying the meaning of “currently has a legally enforceable right of set-off” and that some gross settlement systems may be considered equivalent to net settlement.
AASB 2013-3 Amendments to AASB 136 – Recoverable Amount Disclosures for Non-Financial Assets
These narrow-scope amendments address disclosure of information about the recoverable amount of impaired assets if that recoverable amount is based on fair value less costs of disposal. These amendments arose as part of the development of IFRS 13.
AASB 2013-9 (Part B) Amendments to Australian Accounting Standards – Conceptual Framework, Materiality and Financial Instruments - Part B Materiality
Part B amends certain Australian Accounting Standards to remove references to AASB 1031 as part of the AASB’s decision to withdraw the Australian specific guidance.
AASB 2014-1 (Part A) Amendments to Australian Accounting Standards
Part A of this Standard makes various amendments to Australian Accounting Standards arising from the issuance by the International Accounting Standards Board (IASB) of International Financial Reporting Standards (IFRSs) Annual Improvements to IFRSs 2010–2012 Cycle and Annual Improvements to IFRSs 2011–2013 Cycle, including:
- AASB 1 – clarification in the basis of conclusion. - AASB 2 – amendments to certain definitions contained within the standard. - AASB 3 – clarification that contingent consideration that is classified as an asset or a liability shall be
measured at fair value at each reporting date and clarification that AASB 3 excludes from its scope the accounting for the formation of a joint arrangement in the financial statements of the joint arrangement itself.
- AASB 8 – amendments to disclosures. - AASB 13 – clarification regarding the measurement of short-term receivables and payables and
clarification that the scope of the portfolio exception in paragraph 52 of AASB 13 includes all contracts accounted for within the scope of AASB 139 or AASB 9, regardless of whether they meet the definition of financial assets or financial liabilities as defined in AASB132.
For
per
sona
l use
onl
y

Notes to the Financial Statements (Continued) For the year ended 30 June 2015
MALAGASY MINERALS LIMITED ABN 84 121 700 105 37
NOTE 1 – STATEMENT OF SIGNIFICANT ACCOUNTING POLICIES (Continued)
- AASB 116 and AASB 138 – clarification that when an item of property, plant and equipment or intangible asset is revalued the gross carrying amount is adjusted in a manner that is consistent with the revaluation of the carrying amount.
- AASB 124 – clarification that an entity providing key management personnel services to the reporting entity or to the parent of the reporting entity is a related party of the reporting entity.
AASB 2014-1 (Part C) Amendments to Australian Accounting Standards
This standard makes amendments to particular Australian accounting standards to delete references to AASB 1031.
(u) New Accounting Standards for Application in the Future
A number of new standards, amendments to standards and interpretations issued by the AASB which are not yet mandatorily applicable to the Group have not been applied in preparing these consolidated financial statements. Those which may be relevant to the Group are set out below. The Group does not plan to adopt these standards early. The adoption of these new standards is not expected to have a material impact.
AASB 2014‐4 Clarification of Acceptable Methods of Depreciation and Amortisation applicable from 1 July 2016
AASB 116 and AASB 138 both establish the principle for the basis of depreciation and amortisation as being the expected pattern of consumption of the future economic benefits of an asset. The IASB has clarified that the use of revenue‐based methods to calculate the depreciation of an asset is not appropriate because revenue generated by an activity that includes the use of an asset generally reflects factors other than the consumption of the economic benefits embodied in the asset. The amendment also clarified that revenue is generally presumed to be an inappropriate basis for measuring the consumption of the economic benefits embodied in an intangible asset. This presumption, however, can be rebutted in certain limited circumstances.
AASB 2015‐1 Annual Improvements 2012‐2014 cycle applicable from 1 July 2016
The subjects of the principal amendments to the Standards are set out below:
- AASB 5 Non‐current Assets Held for Sale and Discontinued Operations: o Changes in methods of disposal – where an entity reclassifies an asset (or disposal group)
directly from being held for distribution to being held for sale (or visa versa), an entity shall not follow the guidance in paragraphs 27–29 to account for this change.
- AASB 134 Interim Financial Reporting: o Disclosure of information ‘elsewhere in the interim financial report’ ‐amends AASB 134 to clarify
the meaning of disclosure of information ‘elsewhere in the interim financial report’ and to require the inclusion of a cross‐reference.
AASB 2015‐2 Amendments to Australian Accounting Standards – Disclosure Initiative applicable from 1 July 2016
The Standard makes amendments to AASB 101 Presentation of Financial Statements arising from the IASB’s Disclosure Initiative project. The amendments are designed to further encourage companies to apply professional judgment in determining what information to disclose in the financial statements. For example, the amendments make clear that materiality applies to the whole of financial statements and that the inclusion of immaterial information can inhibit the usefulness of financial disclosures. The amendments also clarify that companies should use professional judgment in determining where and in what order information is presented in the financial disclosures.
AASB 2015‐3 Amendments to Australian Accounting Standards arising from the Withdrawal of AASB 1031 Materiality applicable from 1 July 2016
The Standard completes the AASB’s project to remove Australian guidance on materiality from Australian Accounting Standards.
For
per
sona
l use
onl
y
Notes to the Financial Statements (Continued) For the year ended 30 June 2015
MALAGASY MINERALS LIMITED ABN 84 121 700 105 38
NOTE 1 – STATEMENT OF SIGNIFICANT ACCOUNTING POLICIES (Continued)
AASB 9 Financial Instruments and associated Amending Standards (applicable for annual reporting period commencing 1 January 2018)
The Standard will be applicable retrospectively (subject to the comment on hedge accounting below) and includes revised requirements for the classification and measurement of financial instruments, revised recognition and derecognition requirements for financial instruments and simplified requirements for hedge accounting.
Key changes made to this standard that may affect the Group on initial application include certain simplifications to the classification of financial assets, simplifications to the accounting of embedded derivatives, and the irrevocable election to recognise gains and losses on investments in equity instruments that are not held for trading in other comprehensive income.
The directors anticipate that the adoption of AASB 9 will not have a material impact on the Group’s financial instruments.
AASB 15: Revenue from Contracts with Customers (applicable to annual reporting periods commencing on or after 1 January 2018).
When effective, this Standard will replace the current accounting requirements applicable to revenue with a single, principles‐based model. Except for a limited number of exceptions, including leases, the new revenue model in AASB 15 will apply to all contracts with customers as well as non‐monetary exchanges between entities in the same line of business to facilitate sales to customers and potential customers.
The core principle of the Standard is that an entity will recognise revenue to depict the transfer of promised goods or services to customers in an amount that reflects the consideration to which the entity expects to be entitled in exchange for the goods or services. To achieve this objective, AASB 15 provides the following five‐step process:
- identify the contract(s) with a customer; - identify the performance obligations in the contract(s); - determine the transaction price; - allocate the transaction price to the performance obligations in the contract(s); and - recognise revenue when (or as) the performance obligations are satisfied.
This Standard will require retrospective restatement, as well as enhanced disclosures regarding revenue.
The directors anticipate that the adoption of AASB 15 will not have a material impact on the Group’s revenue recognition and disclosures.
Other standards not yet applicable
There are no other standards that are not yet effective and that would be expected to have a material impact on the entity in the current or future reporting periods and on foreseeable future transactions.
ECONOMIC ENTITYNOTE 2 – REVENUE
2015 $
2014 $
Operating Activities: - royalties 120,988 90,632- rental 140,045 155,651- drilling services - 125,030- other 17,559 38,575- tenement sales (1) 219,968 -
Non-operating activities: - net Interest received 14,113 15,480- EGZ consideration (2) 821,969 1,145,320- sale of other financial assets 96,899 260,583Total Revenue 1,431,541 1,831,271 (1) On 27 November 2014, Mada-Aust SARL, a wholly owned subsidiary, agreed to sell Labradorite permit
number 19933. (2) See note 10 regarding details on the consideration received from Energizer Resources Inc. (EGZ).
For
per
sona
l use
onl
y

Notes to the Financial Statements (Continued) For the year ended 30 June 2015
MALAGASY MINERALS LIMITED ABN 84 121 700 105 39
ECONOMIC ENTITY
NOTE 3 – OTHER FINANCIAL ASSETS 2015
$ 2014
$ Listed Shares in Energizer Resources (1) 402,937 452,702Warrants in Energizer Resources (2) 241,885 385,000 644,822 837,702
2015 2014 Number $ Number $ (1) Listed shares in Energizer Resources: At 1 July 3,500,000 452,702 7,500,000 839,800Fair value increase/ (decrease) - (34,641) - 20,287Shares received as consideration 1,000,000 113,876 2,500,000 370,695Shares sold (1,000,000) (129,000) (6,500,000) (778,080)At 30 June 3,500,000 402,937 3,500,000 452,702 Financial assets, revalued at fair value through the profit and loss represent 3,500,000 (30 June 2014: 3,500,000) fully paid ordinary shares in Canadian company Energizer Resources Inc. During the year the company has sold 1,000,000 Energizer shares to raise $225,899 for working capital purposes (2014: sold 6,500,000 to raise $1,038,663). ECONOMIC ENTITY
(2) Warrants in Energizer Resources – at fair value: 2015
$ 2014
$At 1 July 385,000 - Warrants issued as consideration - 385,000 Fair value increase/ (decrease) (143,115) - At 30 June 241,885 385,000 During 2014, the Company was issued 3,500,000 Warrants in Energizer Resources Inc as part consideration for the sale of a joint venture interest (see note 10). The Warrants are convertible at USD $0.14 per warrant and expire 25 March 2019. ECONOMIC ENTITY NOTE 4 – (LOSS)/ PROFIT FOR THE YEAR 2015
$ 2014
$Expenses Depreciation of non-current assets - Plant & Equipment 26,695 40,653- Field equipment 15,404 16,702- Motor vehicles 2,801 6,022- Land and Buildings 16,806 18,577Total depreciation 61,706 81,954
Exploration expenditure 447,244 383,590
For
per
sona
l use
onl
y

Notes to the Financial Statements (Continued) For the year ended 30 June 2015
MALAGASY MINERALS LIMITED ABN 84 121 700 105 40
ECONOMIC ENTITY NOTE 5 - INCOME TAX 2015
$ 2014
$(a) Income Tax Expense The prima facie tax expense / (benefit) on Profit / (Loss) from ordinary activities is reconciled as follows: The Components of tax expense comprise: - Current Tax 4,079 4,028- Deferred Tax – temporary differences 1,380 2,162- Prior year adjustment - - 5,459 6,190 The Prima facie tax on (Loss) / Profit before income tax at 30% (2014: 30%) (179,122) 70,783 Add/(subtract) the tax effect of: - Prior year adjustments - -- Tax attributable to foreign subsidiary 5,459 6,190- Other assessable income not included as accounting income 21,244 8,427- Non-deductible expenses 154,828 98,437- Accounting income not included as assessable income (275,660) (428,011)- Other deductible expenses (31,306) (34,583)- Deferred tax assets / (liabilities) not brought to account 130,894 284,947Income tax expense / (benefit) attributable to entity 5,459 6,190 (b) Recognised Deferred Tax Balances Deferred Tax Asset - -Deferred Tax Liability - - - -(c) Unrecognised Deferred Tax Balances The following deferred tax assets have not been brought to account: Unrecognised deferred tax assets comprise: - Deferred tax assets attributable to tax losses 641,810 546,508- Transaction costs on equity issue - 26,706 641,810 573,214 ECONOMIC ENTITY (d) Deferred Tax Liability
Opening Balance
$
Charged to Income
$
Charged to Equity
$
Closing Balance
$ Deferred Tax Assets: Deferred tax assets attributable to tax losses 641,810 (641,810) - -Balance as at 30 June 2015 641,810 (641,810) - - Deferred Tax Liabilities: Deferred tax on fair value increase/ (decrease) of listed shares in EGZ (24,490) 24,490 - -Balance as at 30 June 2015 (24,490) 24,490 - - The tax losses do not expire under current tax legislation. Deferred tax assets have not been recognised inrespect of these items because it is not probable that future taxable profit will be available against which theCompany can utilise these benefits.
For
per
sona
l use
onl
y
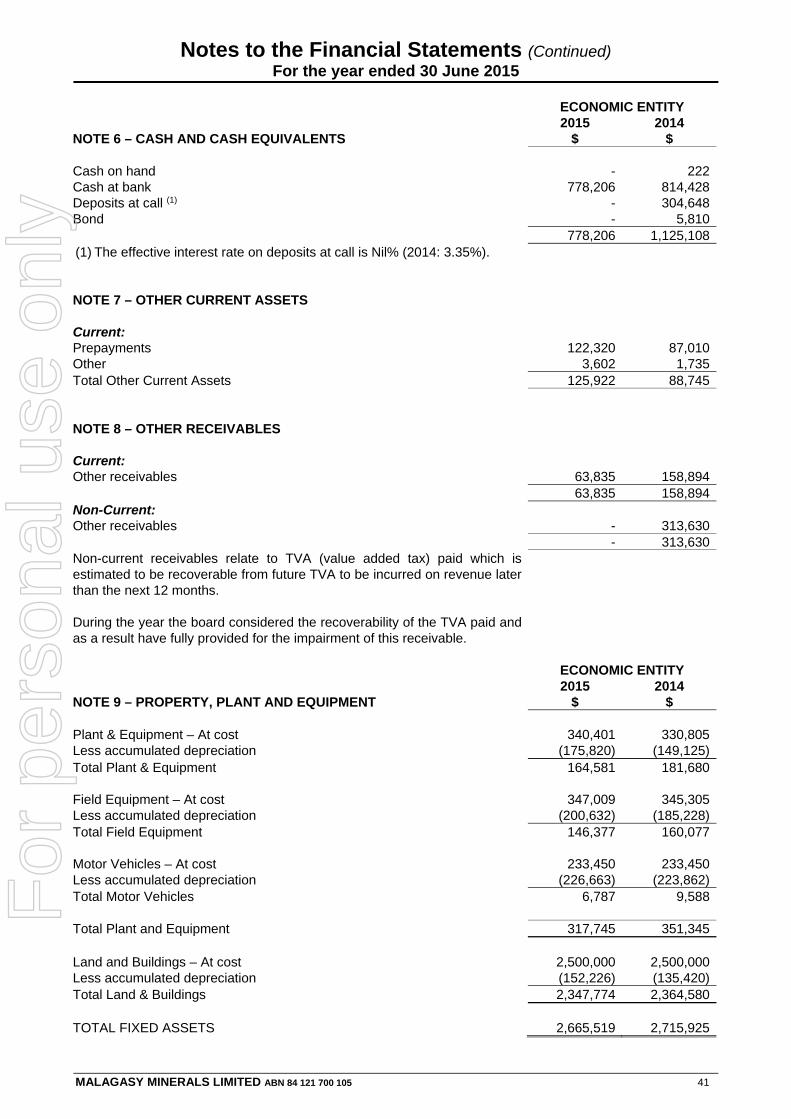
Notes to the Financial Statements (Continued) For the year ended 30 June 2015
MALAGASY MINERALS LIMITED ABN 84 121 700 105 41
ECONOMIC ENTITY
NOTE 6 – CASH AND CASH EQUIVALENTS2015
$ 2014
$ Cash on hand - 222Cash at bank 778,206 814,428Deposits at call (1) - 304,648Bond - 5,810 778,206 1,125,108(1) The effective interest rate on deposits at call is Nil% (2014: 3.35%).
NOTE 7 – OTHER CURRENT ASSETS Current: Prepayments 122,320 87,010Other 3,602 1,735Total Other Current Assets 125,922 88,745 NOTE 8 – OTHER RECEIVABLES Current: Other receivables 63,835 158,894 63,835 158,894Non-Current: Other receivables - 313,630 - 313,630Non-current receivables relate to TVA (value added tax) paid which is estimated to be recoverable from future TVA to be incurred on revenue later than the next 12 months. During the year the board considered the recoverability of the TVA paid and as a result have fully provided for the impairment of this receivable.
ECONOMIC ENTITY
NOTE 9 – PROPERTY, PLANT AND EQUIPMENT 2015
$ 2014
$ Plant & Equipment – At cost 340,401 330,805Less accumulated depreciation (175,820) (149,125)Total Plant & Equipment 164,581 181,680 Field Equipment – At cost 347,009 345,305Less accumulated depreciation (200,632) (185,228)Total Field Equipment 146,377 160,077 Motor Vehicles – At cost 233,450 233,450Less accumulated depreciation (226,663) (223,862)Total Motor Vehicles 6,787 9,588 Total Plant and Equipment 317,745 351,345 Land and Buildings – At cost 2,500,000 2,500,000Less accumulated depreciation (152,226) (135,420)Total Land & Buildings 2,347,774 2,364,580 TOTAL FIXED ASSETS 2,665,519 2,715,925
For
per
sona
l use
onl
y

Notes to the Financial Statements (Continued) For the year ended 30 June 2015
MALAGASY MINERALS LIMITED ABN 84 121 700 105 42
NOTE 9 – PROPERTY, PLANT AND EQUIPMENT (Continued) (a) Movements in carrying amounts Movement in the carrying amounts for each class of property, plant and equipment between the beginning and the end of the current financial year:
Economic Entity
Land & Buildings
$
Plant & Equipment
$
Field Equipment
$
Motor Vehicles
$ Total
$ Balance at 30 June 2013 2,383,157 215,297 172,890 15,610 2,786,954 Additions and reclassifications - 7,036 3,889 - 10,925Disposals - - - - -Depreciation expense (18,577) (40,653) (16,702) (6,022) (81,954)Currency Translation Differences - - - - -Carrying amount at 30 June 2014 2,364,580 181,680 160,077 9,588 2,715,925 Additions and reclassifications - 9,596 1,704 - 11,300Disposals - - - - -Depreciation expense (16,806) (26,695) (15,404) (2,801) (61,706)Currency Translation Differences - - - - -Carrying amount at 30 June 2015 2,347,774 164,581 146,377 6,787 2,665,519 NOTE 10 – INTERESTS IN JOINT VENTURES A Joint Venture Agreement with Canadian company Energizer Resources Inc. (EGZ) was executed on 15 December 2011, resulting in a total of US$2.25M being paid to Malagasy plus 7.5M EGZ shares. The Joint Venture Company (75% EGZ; 25% MGY) was formed with the right to explore for industrial minerals including vanadium and graphite within approximately 40% of MGY’s tenement holdings. Malagasy was free carried for its 25% interest until completion of a bankable feasibility study (BFS) by EGZ.
On 27th March 2014, the Company announced that it had sold its 25% shareholding in the Joint Venture Company to EGZ. The sale was completed by 30 June 2014 and the consideration included in the financial statements was:
Cash AUD $389,625 2,500,000 shares escrowed for 12 months at an issue price of CAD $0.15 per share. 3,500,000 warrants convertible at USD $0.14 per warrant on or before 25th March 2019.
These warrants have been valued at $A 0.10 at acquisition, using Black Scholes option pricing model and the following assumptions:
Market Price at Issue Date $A0.148 Market Volatility 100% Exercise Price $A0.149 Risk Free Interest Rate 3.48% pa
During January 2015, EGZ made a Toronto Stock Exchange announcement to the effect that a BFS had been completed. Consequently, Malagasy has received:
A cash payment of CAN 700,000; and 1,000,000 EGZ shares escrowed until 20 May 2016.
Additional receipts would arise in the event that EGZ commences commercial production
Payment to Malagasy CAD $1,000,000 cash with production commencement; and Payment to Malagasy of a 1.5% Net Smelter Return (“NSR”) on all production.
These additional receipts have not been included as contingent assets as the fair value at the date of this report is nil.
For
per
sona
l use
onl
y

Notes to the Financial Statements (Continued) For the year ended 30 June 2015
MALAGASY MINERALS LIMITED ABN 84 121 700 105 43
NOTE 10 – INTERESTS IN JOINT VENTURES (Continued) Contemporaneously with the sale, a new joint venture was established over EGZ’s Green Giant Tenements in Madagascar. Malagasy has established a Mauritian subsidiary, Ampanihy Exploration, in which it holds 75% equity and EGZ holds 25% equity and Ampanihy will have a wholly owned subsidiary in Madagascar to be named Ampex SARL, which will hold the exploration rights for non-industrial minerals on Green Giant tenements. EGZ will continue to own the tenements and the industrial mineral rights. Malagasy will fund all exploration expenditure for non-industrial minerals on the joint venture until a “decision is made to mine”.
Prior to the commencement of the tenement year for calendar 2015, Malagasy withdrew from the joint venture and the winding up of the Mauritian subsidiary was completed in July 2015.
ECONOMIC ENTITY
NOTE 11 – DEFERRED EXPLORATION & EVALUATION COSTS2015
$ 2014
$ At 1 July 3,289,216 3,289,216Additions and Reclassifications - -Impairment - -At 30 June 3,289,216 3,289,216
The ultimate recoupment of costs carried forward for exploration assets is dependent on the successful development and commercial exploitation or sale of the respective areas. ECONOMIC ENTITY NOTE 12 – CURRENT TRADE & OTHER PAYABLES
2015 $
2014 $
Unsecured liabilities: Trade Payables 79,110 493,947Accrued Payables – Operating 58,291 28,931Accrued Payables – Directors Fees 98,625 87,400Accrued Payables – WTR Holdings(1) 60,000 60,000Total Current Trade & Other Payables 296,026 670,278
(1) Accrued payables include amounts in respect of the Share Purchase
Agreement with WTR Holdings Pty Ltd (formerly Madagascar Resources NL) estimated to be payable within the next 12 months. The liability is only repayable from 70% of the labradorite royalty cash receipts actually received by MADA-Aust SARL from the one remaining specified lessee.
NOTE 13 – SHORT–TERM PROVISIONS
Provision for annual leave: Opening 1 July 16,771 19,147Additional provisions 26,656 29,004Amounts used (24,906) (29,242)Foreign exchange adjustments (1,628) (2,138)Closing 30 June 16,893 16,771 No. No. Number of employees at year end 40 42 NOTE 14 – NON-CURRENT TRADE & OTHER PAYABLES $ $ Unsecured liabilities: Accrued Payables (1) 422,574 467,052Total Non-Current Trade & Other Payables 422,574 467,052
For
per
sona
l use
onl
y

Notes to the Financial Statements (Continued) For the year ended 30 June 2015
MALAGASY MINERALS LIMITED ABN 84 121 700 105 44
NOTE 14 – NON-CURRENT TRADE & OTHER PAYABLES (Continued) (1) Accrued payables are amounts in respect of the Share Purchase Agreement with WTR Holdings Pty
Ltd (formerly Madagascar Resources NL). This portion of the liability is only repayable from 70% of the labradorite royalty cash receipts actually received by MADA-Aust SARL and is not expected to be settled in the next financial year. The agreement provides that repayment is due only from amounts received in cash from royalty payers. Two of the three companies ceased operations during 2011 and have returned the tenements to the Company. The term of the remaining royalty agreement ends 2 November 2020.
ECONOMIC ENTITY
NOTE 15 – ISSUED CAPITAL
2015 $
2014 $
165,346,241 fully paid ordinary shares (2014: 160,847,767) 14,733,538 14,613,363 14,733,538 14,613,363 ECONOMIC ENTITY ECONOMIC ENTITY 2015 2014 Ordinary shares: No. $ No. $ At 1 July 160,847,767 14,613,363 158,812,504 14,555,337Shares issued during the year: - 5 December 2013 (1) - - 2,035,263 58,026- 2 December 2014 (2) 4,498,654 120,175 - -At 30 June 165,346,421 14,733,538 160,847,767 14,613,363 There are no preference shares on issue. Notes: (1) On 5 December 2013, 2,035,263 fully paid ordinary shares were allotted as compensation for $58,026
of accrued directors fees. (See Remuneration Report). (2) On 2 December 2014, 4,498,654 fully paid ordinary shares were allotted as compensation for
$120,175 of accrued directors fees. (See Remuneration Report).
Ordinary shares participate in dividends and the proceeds on winding up of the parent entity in proportion to the number of shares held. At shareholders’ meetings each ordinary share is entitled to one vote when a poll is called, otherwise each shareholder has one vote on a show of hands. The Company does not have authorised capital or par value in respect of its shares. Stock Exchange Listing: Total Issued Capital is 165,346,421 (2014:160,847,767) shares, all of which are listed on the Australian Securities Exchange (ASX) at the date of this report. Options: - 375,000 unlisted Options with an exercise price of $0.30 and with expiry date of 30 September 2015 are
on issue. - 375,000 unlisted Options with an exercise price of $0.40 and with expiry date of 31 December 2015 are
on issue. - 375,000 unlisted Options with an exercise price of $0.50 and with expiry date of 31 March 2016 are on
issue. - 7,500,000 unlisted Options with an exercise price of $0.15 and with expiry date of 30 November 2016
are on issue.
For
per
sona
l use
onl
y

Notes to the Financial Statements (Continued) For the year ended 30 June 2015
MALAGASY MINERALS LIMITED ABN 84 121 700 105 45
ECONOMIC ENTITY
NOTE 16 – RESERVES 2015
$ 2014
$ Share based payment reserve: Opening balance 1 July 200,353 432,196Share based payments for the period - 29,060Transfer to accumulated losses - (260,903)Closing balance 30 June 200,353 200,353 This reserve is used to record the value of equity benefits provided to employees and directors as part of their remuneration. Refer to Note 19 and the Remuneration Report for further details. Foreign currency translation reserve: Opening balance 1 July (693,299) (631,419)Translation movement for the period (60,735) (61,880)Closing balance 30 June (754,034) (693,299) This reserve records exchange differences arising on translation of foreign controlled subsidiaries.
NOTE 17 – ACCUMULATED LOSSES Opening balance 1 July (6,745,297) (7,235,952)Profit / (Loss) for the period (602,532) 229,752Transfer from reserve - 260,903Closing balance 30 June (7,347,829) (6,745,297) ECONOMIC ENTITY NOTE 18 – EARNINGS PER SHARE
2015 $
2014 $
(Loss) / Profit used in the calculation of basic and dilutive EPS (602,532) 229,752 Cents Cents Basic and Diluted profit / (loss) per share - cents per share (0.37) 0.14 Number Number Weighted average number of ordinary shares outstanding during the year used in calculation of basic and dilutive EPS 163,436,034 159,966,749 As at 30 June 2015 there are 8,625,000 unlisted options on issue. The effect of these options is anti-dilutive on the earning per share calculation as the exercise price of the options is above the current market value.
For
per
sona
l use
onl
y

Notes to the Financial Statements (Continued) For the year ended 30 June 2015
MALAGASY MINERALS LIMITED ABN 84 121 700 105 46
NOTE 19 – SHARE BASED PAYMENTS The following Share-based payment arrangements existed at 30 June 2015.
2015 2014 Grant Date
No. of Options
Exercise Price
Expiry Date
Grant Date
No. of Options
Exercise Price
Expiry Date
30/09/2012 375,000 $0.30 30/09/2015 30/09/2012 375,000 $0.30 30/09/2015 21/11/2012 7,000,000 $0.15 30/11/2016 21/11/2012 7,000,000 $0.15 30/11/2016 31/12/2012 375,000 $0.40 31/12/2015 31/12/2012 375,000 $0.40 31/12/2015 31/03/2013 375,000 $0.50 31/03/2016 31/03/2013 375,000 $0.50 31/03/2016 22/05/2013 500,000 $0.15 30/11/2016 22/05/2013 500,000 $0.15 30/11/2016
8,625,000 8,625,000
None of the options hold voting or dividend rights. 2015 2014 No of
Options Exercise
Price No of
Options Exercise
Price
Outstanding at 1 July 8,625,000 $0.15 - $0.50 16,128,600 $0.15 - $0.50 Expired (8,003,600) $0.20 Granted during the period:
- 22/05/2013 - - 500,000 $0.15 Outstanding at 30 June 8,625,000 - 8,625,000 - Exercisable at 30 June 8,625,000 - 8,625,000 -
Terms and conditions: - 1,000,000 unlisted Options with an exercise price of $0.20 and an expiry date of 3 July 2013, expired
unexercised on the expiry date. - 1,000,000 unlisted Options with an exercise price of $0.20 and an expiry date of 3 July 2013, expired
unexercised on the expiry date. - 4,003,600 unlisted Options with an exercise price of $0.20 and an expiry date of 7 July 2013, expired
unexercised on the expiry date. - 2,000,000 unlisted Options with an exercise price of $0.20 and with expiry date of 1 December 2013,
expired unexercised on the expiry date. - 375,000 unlisted Options which vested on issue, with an exercise price of $0.30 and an expiry date of 30
September 2015 are on issue. - 375,000 unlisted Options which vested on issue, with an exercise price of $0.40 and an expiry date of 31
December 2015 are on issue. - 375,000 unlisted Options which vested on issue, with an exercise price of $0.50 and an expiry date of 31
March 2016 are on issue. - 7,000,000 unlisted Options with an exercise price of $0.15 and with an expiry date of 30 November 2016
are on issue. 50% of the options vested immediately on issue and 50% vested on 30 November 2013. - 500,000 unlisted Options which vested on issue, with an exercise price of $0.15 and with an expiry date
of 30 November 2016 are on issue.
Fair value: The fair value of services rendered in return for share options granted is based on the fair value of share options granted, measured using the Black-Sholes option pricing formula. No share options were granted during the year ended 30 June 2015 (2014: 500,000).
Fair Value of Options & Assumptions: Employees Directors Consultants Grant date 22/05/13 22/11/12 30/09/12 31/12/12 31/3/13Number granted 500,000 7,000,000 375,000 375,000 375,000Fair Value at grant date (per option) $0.011 $0.026 $0.019 $0.080 $0.097Share Price at grant date $0.030 $0.051 $0.062 $0.041 $0.050Exercise price $0.150 $0.150 $0.300 $0.400 $0.500Expected share price volatility 100% 100% 100% 100% 100%Expected life of option (days) 1,288 1,475 1,095 1,095 1,096Expected dividends - - - - -Risk free interest rate 2.59% 2.52% 2.41% 2.67% 2.87%
For
per
sona
l use
onl
y

Notes to the Financial Statements (Continued) For the year ended 30 June 2015
MALAGASY MINERALS LIMITED ABN 84 121 700 105 47
ECONOMIC ENTITY
NOTE 20 – CASH FLOW INFORMATION 2015
$ 2014
$
Reconciliation of cash flow from operations, with loss after income tax: Profit /(Loss) after income tax (602,532) 229,752Non-cash flows in result:
Depreciation 61,706 81,954Fair value Gain/ (Loss) on Financial Assets 177,757 (20,287)Share / Warrant consideration for sale of Joint Venture interest (113,877) (755,695)Cash consideration for sale of Joint Venture interest (717,659) (379,740)Foreign Currency Translation (58,726) (8,786)Share Based Payment - 29,060
Cash flows in result not classified as cash flows from operations: Profit on sale of fixed assets - (3,000)Profit on sale of financial assets (96,899) (260,583)Profit on sale of permits (219,968) -
Changes in assets and liabilities:
Increase/(Decrease) in income taxes payable 1,380 3,725(Increase)/Decrease in other current assets 372,670 122,867Increase /(Decrease) in payables and accruals (256,493) 376,515
Cashflow used by Operations (1,452,641) (584,218)
NOTE 21 – CONTINGENT ASSETS AND LIABILITIES There were no contingent assets or liabilities at 30 June 2015 (2014: Nil). NOTE 22 – COMMITMENTS Exploration Commitments: The economic entity has no statutory obligations to perform minimum exploration work on its tenements; however the Company needs to maintain an active work program to retain its interests. For the 2015 calendar year tenement rents of approximately $392,000 per annum were payable to maintain ownership over the tenement areas. 30% of the tenement rents were recouped from other parties. NOTE 23 – EVENTS SUBSEQUENT TO REPORTING DATE
There were no material events arising subsequent to 30 June 2015 to the date of this report which may significantly affect the operations of the economic entity, the results of those operations and the state of affairs of the economic entity in the future, other than: The deregistration of the Mauritian subsidiary, Ampanihy Exploration Limited
NOTE 24 – FINANCIAL INSTRUMENTS (a) Capital risk management: Management controls the capital of the Group in order to ensure that the Group can fund its operations and continue as a going concern.
There are no externally imposed capital requirements.
Management effectively manages the Group’s capital by assessing the Group’s financial risks and adjusting its capital structure in response to changes in these risks and in the market. These responses include the management of debt levels, distributions to shareholders and share issues.
For
per
sona
l use
onl
y

Notes to the Financial Statements (Continued) For the year ended 30 June 2015
MALAGASY MINERALS LIMITED ABN 84 121 700 105 48
NOTE 24 – FINANCIAL INSTRUMENTS (Continued) There have been no changes in the strategy adopted by management to control the capital of the Group since the prior year.
(b) Market risk: The Group’s financial instruments consist mainly of deposits with banks, accounts receivable and payable. The Group does not speculate in the trading of derivative instruments.
There has been no change to the Group’s exposure to market risks or the manner in which it manages and measures the risk from the previous period.
(c) Foreign currency risk: The Group is exposed to fluctuations in foreign currencies arising from the sale and purchase of goods and services in currencies other than the Group’s functional and presentation currency.
As a result of subsidiary companies being registered in Madagascar, the Group's statement of financial position can be affected by movements in the AUD$/Ariary exchange rates. The Group do not seek to hedge this exposure.
The following table shows the foreign currency risk on the financial assets and liabilities of the Groups operations denominated in currencies other than the functional currency of the operations.
ECONOMIC ENTITY Net Financial Assets/(liabilities) in AUD 2015 MGA AUD USD EURO Total AUD Cash 22,643 755,311 88 164 778,206Receivables 63,835 - - - 63,835Payables (108,824) (187,204) - - (296,028)Statement of Financial Position exposure (22,346) 568,107 88 164 546,013 ECONOMIC ENTITY Net Financial Assets/(liabilities) in AUD 2014 MGA AUD USD EURO Total AUD Cash 417,281 706,913 497 417 1,125,108Receivables 148,065 10,829 - - 158,894Payables (485,072) (185,206) - - (670,278)Statement of Financial Position exposure 80,274 532,536 497 417 613,724 Foreign currency risk sensitivity: Analysis at 30 June 2015, the effect on profit and equity as a result of changes in the value of the Australian Dollar to the Madagascan Ariary, with all other variables remaining constant is as follows:
ECONOMIC ENTITY2015
$ 2014
$ Change in profit: - Improvement in AUD to MGA by 5% (113) (23,083)- Decline in AUD to MGA by 5% 113 23,083
Change in equity: - Improvement in AUD to MGA by 5% 113 23,083- Decline in AUD to MGA by 5% (113) (23,083) (d) Interest rate risk: At the reporting date the interest rate profile of the Group’s interest bearing financial instruments was:
Variable rate instruments: - Financial assets 778,206 1,125,108
Cash flow sensitivity analysis for variable rate instruments: A change of 100 basis points in interest rates at the reporting date would have increased (decreased) equity and profit or loss by the amounts shown below. This analysis assumes that all other variables remain constant. The analysis is performed on the same basis for 2014.
For
per
sona
l use
onl
y

Notes to the Financial Statements (Continued) For the year ended 30 June 2015
MALAGASY MINERALS LIMITED ABN 84 121 700 105 49
NOTE 24 – FINANCIAL INSTRUMENTS (Continued) 2015 2014 ECONOMIC ENTITY 100 bp
increase100 bp
decrease100 bp
increase 100 bp
decrease Variable rate instruments 7,782 (7,782) 11,251 (11,251)
(e) Liquidity risk: Liquidity risk arises from the possibility that the Group might encounter difficulty in settling its debts or otherwise meeting its obligations related to financial liabilities.
The Group manages liquidity risk by monitoring forecast cash flows and ensuring that adequate facilities are maintained.
The following are the contractual maturities of the Group’s financial liabilities:
Carrying Amount
$
Contractual Cash Flows
$
6 Months or Less
$ Trade and other payables: - at 30 June 2015 296,026 (296,026) (296,028) - at 30 June 2014 670,278 (670,278) (670,287) (f) Credit risk: Credit risk is managed to ensure that customers are of sound credit worthiness and monitoring is used to recover aged debts and assess receivables for impairment. Credit terms are generally 30 days from the invoice date. The Group has no significant concentration of credit risk with any single party with the exception of the TVA receivable from the Madagascan government relating to taxes paid on the Business Sale Agreement and Long Term Lease Agreement. These taxes are recoverable long term in accordance with existing Madagascan taxation law. The Group has assessed the non-current TVA receivable as non-recoverable, and has recorded a provision for impairment of the full amount.
Risk is also minimized by investing surplus funds in financial institutions with a high credit rating.
(g) Financial Instruments Measured at Fair Value: The financial instruments recognised at fair value in the statement of financial position have been analysed and classified using a fair value hierarchy reflecting the significance of the inputs used in making the measurements.
The fair value hierarchy consists of the following levels: - quoted prices in active markets for identical assets or liabilities (Level 1); - inputs other than quoted prices included within Level 1 that are observable for the asset or liability, either
directly (as prices) or indirectly (derived from prices) (Level 2); and - inputs for the asset or liability that are not based on observable market data (unobservable inputs) (Level
3).
2015 Level 1 Level 2 Level 3 Total Financial assets: Available-for-sale financial assets: - listed investments 402,937 - - 402,937 - unlisted warrants - 241,885 - 241,885 402,937 241,885 - 644,822 2014 Financial assets: Available-for-sale financial assets: - listed investments 452,702 - - 452,702 - unlisted warrants - 385,000 - 385,000 452,702 385,000 - 837,702 Included within Level 1 of the hierarchy are the Energizer Resources Inc shares listed on the Toronto Stock Exchange. The fair values of these financial assets have been based on the closing quoted bid prices at the end of the reporting period, excluding transaction costs.
For
per
sona
l use
onl
y

Notes to the Financial Statements (Continued) For the year ended 30 June 2015
MALAGASY MINERALS LIMITED ABN 84 121 700 105 50
NOTE 24 – FINANCIAL INSTRUMENTS (Continued) In determining the fair value of unlisted investments included in Level 2 of the hierarchy, which include unlisted warrants held in Energizer Resources Inc, the Black Scholes option pricing model has been used to calculate a fair value based on the income approach valuation and inputs as set out in Note 10.
No transfers between the levels of the fair value hierarchy occurred during the current or previous reporting period.
(h) Financial Liability and Financial Asset Maturity Analysis:
Within 1 year 1 to 5 years Total ECONOMIC ENTITY 2015 2014 2015 2014 2015 2014
$ $ $ $ $ $ Financial Liabilities due for payment:
Payables 154,294 539,649 - - 154,294 539,649Amounts payable to related parties 98,625 87,400 - - 98,625 87,400Amounts payable for Share Purchase Agreement 60,000 60,000 422,574 467,052 482,574 527,052Total expected outflows 312,919 687,049 422,574 467,052 735,493 1,154,101Financial Assets – Cash Flows Realisable: Cash 778,206 1,125,108 - - 778,206 1,125,108Assets 644,822 837,702 - - 644,822 837,702Receivables 63,835 158,894 - - 63,835 158,894Total Inflow on Financial Instruments 1,486,863 2,121,704 - - 1,486,863 2,121,704 NOTE 25 – STATEMENT OF OPERATIONS BY SEGMENT Identification of reportable segments: The Group has identified its operating segments based on the internal reports that are reviewed and used by the Board of Directors (as the chief operating decision makers) in assessing performance and determining the allocation of resources.
The group is managed primarily on the basis of geographical location as the Group’s operations inherently have different risk profiles and performance assessment criteria. Operating segments are therefore determined on the same basis. Reportable segments are therefore disclosed as geographical segments being Australia, Madagascar and Mauritius.
Basis for accounting for purpose of reporting by operating segments: Accounting policies adopted:
Unless otherwise stated, all amounts reported to the Board of Directors, being the chief operating decision makers with respect to operating segments, are determined in accordance with accounting policies that are consistent to those adopted in the annual financial statements of the Group outlined in Note 1.
Intersegmental transactions: Intersegment loans are recognised at the consideration received net of transaction costs. Intersegment loans are not adjusted to fair value based on market interest rates.
For
per
sona
l use
onl
y

Notes to the Financial Statements (Continued) For the year ended 30 June 2015
MALAGASY MINERALS LIMITED ABN 84 121 700 105 51
NOTE 25 – STATEMENT OF OPERATIONS BY SEGMENT (Continued) Significant Customers: In 2015 royalty revenue recorded from Labradorite Operations totalled $120,988 (2014: $90,632).
2015 Australia Madagascar Mauritius Eliminations Economic
Entity Revenue Other Income 500,622 930,919 - - 1,431,541 Total Segment Revenue 500,622 930,919 - - 1,431,541
Result Segment Result 118,306 (504,414) (4,781) (211,643) (602,532) Profit/(Loss) before Income tax 118,306 (498,957) (4,781) (211,643) (597,075)
Assets Segment Assets 8,483,482 2,732,371 - (3,648,332) 7,567,521 Segment Liabilities (609,778) (125,715) - - (735,493)
Other Acquisition of non-current assets - 11,300 - - 11,300 Depreciation - 61,706 - - 61,706
2014 Australia Madagascar Mauritius Eliminations Economic
Entity Revenue Other Income 658,315 407,375 - - 1,065,690 Total Segment Revenue 658,315 407,375 - - 1,065,690
Result Segment Result 691,420 (955,370) (3,455) 497,157 229,752 Profit/(Loss) before income tax 691,420 (949,180) (3,455) 497,157 235,942
Assets Segment Assets 8,289,482 3,392,177 - (3,150,438) 8,529,220 Segment Liabilities (652,258) (501,843) - - (1,154,101)
Other Acquisition of non-current assets - 10,925 - - 10,925 Depreciation 10,748 71,206 - - 81,954
For
per
sona
l use
onl
y

Notes to the Financial Statements (Continued) For the year ended 30 June 2015
MALAGASY MINERALS LIMITED ABN 84 121 700 105 52
NOTE 26 – RELATED PARTY DISCLOSURES Key Management Personnel: Mr G Le Clezio – Non-Executive Chairman Mr P Langworthy – Non-Executive Director Dr P Woods – Non-Executive Director Mr G Boden – Non-Executive Director Mr J.L Marquetoux – CFO & Gerant (Madagascar) Key Management Personnel Remuneration: Key management personnel remuneration has been included in the Remuneration Report section of the Directors Report. ECONOMIC ENTITY The total remuneration paid to Key Management Personnel of the Group during the year are as follows:
2015 $
2014 $
Short term employee benefits 533,499 475,328Post – employment benefits - 9,928Share Based Payments - 25,970 533,499 511,226 Controlled Entities: The consolidated financial statements include the financial statements of Malagasy Minerals Limited and the subsidiaries set out in the following table.
Subsidiaries of Malagasy Minerals Limited: Country Principal activity
% Ownership 2015 2014
Mada Aust SARL Madagascar Exploration 100% 100% Mazoto Minerals SARL (1) Madagascar Exploration 100% 100% Energex SARL Madagascar Dormant 100% 100% Mining Services SARL Madagascar Exploration Services 100% 100% St Denis Holdings SARL Madagascar Commercial Property 100% 100% Ampanihy Exploration Limited Mauritius JV Investment 75% 75% (1) A 10% interest is held in trust for Malagasy Minerals Limited. The subsidiaries noted above are all controlled entities and are dependent on the parent entity for financial support.
During the year $1,957,689 (2014: Nil) of loans were capitalised as investment bringing the total investment in subsidiaries to $6,875,588 (2014: $4,917,899).
Additional loans were made totalling $346,530 (2014: $433,742).
At the year end, total net loans from the parent company to these subsidiaries amount to $207,760 (2014: $1,815,138). Loans to subsidiaries total $4,753,250 (2014: $6,360,628) with a provision for impairment of $4,545,490 (2014: $4,545,490).
For
per
sona
l use
onl
y

Notes to the Financial Statements (Continued) For the year ended 30 June 2015
MALAGASY MINERALS LIMITED ABN 84 121 700 105 53
NOTE 27 – PARENT ENTITY DISCLOSURES The following information has been extracted from the books and records of the parent and has been prepared in accordance with Australian Accounting Standards.
PARENT ENTITY
2015 $
2014 $
Assets: Current Assets 1,400,133 1,555,444Non-Current Assets 7,083,349 6,732,038Total Assets 8,483,482 8,287,482 Liabilities: Current Liabilities 187,204 185,206Non-Current Liabilities 422,574 467,052Total Liabilities 609,778 652,258 Shareholders’ Equity: Issued Capital 14,733,538 14,613,363Reserves 200,353 200,353Accumulated Losses (7,060,187) (7,178,492)Total Shareholders’ Equity 7,873,704 7,635,224 Statement of Comprehensive Income: Net Profit attributable to members of the parent entity 118,306 691,420 Total Comprehensive Income for the period attributable to members of the parent entity 118,306 691,420 There have been no guarantees entered into by the Parent Entity in relation to the debts of its subsidiaries. The Parent entity has not entered into any contractual commitments for the acquisition of property plant and equipment at the date of this report. PARENT ENTITY
NOTE 28 – AUDITORS REMUNERATION 2015
$ 2014
$ Amount payable to William Buck Audit (WA) Pty Ltd - Auditing or reviewing the financial report 24,050 28,110
Amounts payable to other audit firms for the audit and review of the financial reports of subsidiary companies was $5,379 (2014: $6,383)
For
per
sona
l use
onl
y

Directors’ Declaration
MALAGASY MINERALS LIMITED ABN 84 121 700 105 54
The Directors of the Company declare that: 1. the financial statements and notes, as set out on pages 25 to 53 are in accordance with the
Corporations Act 2001 and:
(a) comply with Australian Accounting Standards and the Corporations Regulations 2001; and (b) give a true and fair view of the financial position as at 30 June 2015 and of the performance for
the year ended on that date of the economic entity; 2. the Chairman (CEO equivalent) Chief Financial Officer have each declared that:
(a) the financial records of the company for the financial year have been properly maintained in accordance with section 286 of the Corporations Act 2001;
(b) the financial statements and notes for the financial year comply with the Accounting Standards;
and (c) the financial report also complies with International Financial Reporting Standards as disclosed
in Note 1; and (d) the financial statements and notes for the financial year give a true and fair view;
3. the remuneration disclosures that are contained in the Remuneration Report in the Directors Report
comply with the Corporations Act 2001 and the Corporations Regulations 2001. 4. in the directors’ opinion there are reasonable grounds to believe that the company will be able to pay
its debts as and when they become due and payable. This declaration is made in accordance with a resolution of the Board of Directors and is signed for and on behalf of the Directors by:
G R Boden Director Perth, Western Australia 30th September 2015
For
per
sona
l use
onl
y
For
per
sona
l use
onl
y

For
per
sona
l use
onl
y

ASX Additional Information
MALAGASY MINERALS LIMITED ABN 84 121 700 105 57
1. Listed Shares
The shareholder information set out below was applicable as at 14 September 2015.
a) Distribution of Share Holdings
Size of Holding No. of Shareholders No. of Shares 1 - 1,000 27 5,451 1,001 - 5,000 32 107,654 5,001 - 10,000 84 724,381 10,001 - 100,000 342 15,354,319 100,001 and over 185 149,154,616 Total Shareholders 670 165,346,421
There are 318 Shareholders with less than a marketable parcel at a price of $0.014, totalling 4,651,017 shares.
b) Voting Rights
The voting rights attached to the ordinary shares are governed by the Constitution. On a show of hands every person present who is a Member or representative of a Member shall have one vote and on a poll, every Member present in person or by proxy or by attorney or duly authorised representative shall have one vote for each share held. None of the options have any voting rights. c) Twenty Largest Share Holders
Shareholder No. of Shares % Running Water Limited 10,595,513 6.41Nefco Nominees Pty Ltd 8,000,000 4.84Harmanis Holdings Pty Ltd 7,000,000 4.23Timmid Pty Ltd 4,800,000 2.90Midas Consulting Limited 4,700,000 2.84JP Morgan Nominees Australia Limited 4,447,140 2.69Harvey Z & Chen L Q Wang 3,753,480 2.27Rene Legoll 3,750,000 2.27Magaurite Pty Ltd 3,750,000 2.27Quantum Holdings Pty Ltd 3,507,078 2.12Leet Investments Pty Ltd 3,330,000 2.01Jules Le Clezio 3,229,001 1.95Omni GeoX Pty Ltd 3,008,218 1.82Robert Hastings Smythe 2,900,000 1.75Leet Investments Pty Ltd 2,500,000 1.51T A Watterson & C E Cross 2,265,000 1.37Magaurite Pty Ltd 2,250,000 1.36Neptune Design Limited 2,200,000 1.33HSBC Custody Nominees Australia Limited 2,194,447 1.33Guy Francois Le Clezio 2,011,860 1.22Top Twenty Shareholders 80,191,737 48.49Total Issued Capital 165,346,421 100.00
F
or p
erso
nal u
se o
nly

ASX Additional Information (Continued)
MALAGASY MINERALS LIMITED ABN 84 121 700 105 58
d) Substantial Shareholders
The names of the substantial shareholders listed in the Company’s share register as at 14 September 2015 were:
Shareholder No. of Shares % Guy LeClezio 14,347,591 8.68 Total 14,347,591 8.68 e) On Market Buy-Back There is currently no on-market buy-back in place
2. Unquoted Securities - Shares
There are no unquoted ordinary shares at the date of this report. 3. Unquoted Securities – Options
The following Unlisted Options are on issue:
No. of Options Exercise Price Vesting Date Expiry Date 3,500,000 $0.15 21/11/2012 30/11/2016 3,500,000 $0.15 30/11/2013 30/11/2016
375,000 $0.30 30/09/2012 30/09/2015 375,000 $0.40 31/12/2012 31/12/2015 375,000 $0.50 31/03/2013 31/03/2016 500,000 $0.15 02/08/2013 30/11/2016
8,625,000
For
per
sona
l use
onl
y

Tenement Schedule
MALAGASY MINERALS LIMITED ABN 84 121 700 105 59
Title
Number
Permit
Type Grant Date Expiry Date Term Project Name
Total Carres
(New -
0.391km2)
Interest % Notes
4752
3432 PR 18-Jun-01 17-Jun-11 10 Ampanihy - Central (Big 'S') 1488 403 :100%
1,085:100% - IM 1,2
5391 PE 20-Nov-02 19-Nov-42 40 Ampanihy - Ianapera 16 100%
5392 PE 20-Nov-02 19-Nov-42 40 Ampanihy - Ianapera 16 100%
5393 PE 20-Nov-02 19-Nov-42 40 Ampanihy - Ianapera 16 100% 5
5394 PE 20-Nov-02 19-Nov-42 40 Ampanihy - Maniry 48 40 : 100%
8 :100% -IM 1, 4
13063 PR 04-Feb-05 03-Feb-15 10 Vohibory 336 100% 2
13064 PR 04-Feb-05 03-Feb-15 10 Fotadrevo 48 100% - IM 1, 2
13508 PR 04-Feb-05 03-Feb-15 10 Vohibory 16 100% 2
13811 PR 14-Mar-05 13-Mar-15 10 Ampanihy - Maniry 48 100% - IM 1, 2
13829 PR 14-Mar-05 13-Mar-15 10 Vohibory 32 100%
14618 PR 26-Jan-05 25-Jan-15 10 Ampanihy - Ianapera 32 100% - IM 1, 2
14619 PR 26-Jan-05 25-Jan-15 10 Ampanihy - Maniry 16 100% - IM 1, 2
14620 PR 26-Jan-05 25-Jan-15 10 Fotadrevo 48 100% - IM 1, 2
14622 PR 26-Jan-05 25-Jan-15 10 Fotadrevo 64 100% - IM 1, 2
14623 PR 26-Jan-05 25-Jan-15 10 Ampanihy - Ianapera 112 39 : 100%
73 : 100%-IM 1, 2
16746 PR 09-Sep-05 08-Sep-15 10 Ampanihy - Ianapera 16 100% 2
16747 PR 09-Sep-05 08-Sep-15 10 Ampanihy - Maniry 48 100% - IM 1, 2
16753 PR 09-Sep-05 08-Sep-15 10 Ampanihy - Maniry 48 4 : 100%
44 :100% - IM
1, 2
19003 PR 23-Feb-06 22-Feb-16 10 Ampanihy - Maniry 16 100% - IM 1
19851 PR 04-Feb-05 03-Feb-15 10 Fotadrevo 32 100% - IM 1, 2
19932 PE 10-Mar-06 09-Mar-46 40 Ampanihy - Maniry 112 102 : 100%
10 : 100% - IM 1
19934 PR 26-Jan-05 25-Jan-15 10 Fotadrevo 16 100% - IM 1, 2
19935 PR 26-Jan-05 25-Jan-15 10 Fotadrevo 16 100% - IM 1, 2
NOTES 1) 100% - IM indicates tenements held by MDA and Industrial Minerals rights sub-leased to Energizer Resources Inc. 2) Renewal awaiting confirmation from BCMM. All annual fees have been paid up to 31 December 2015. 3) Leased to SQNY – Royalty and partial tenement fees payable to MDA.
4) Leased to Jupiter Mines and Minerals – Royalty and annual tenement fees payable to MDA.
5) Leased to Hery Lala Alain Raharinavio – Royalty on small blocks.
For
per
sona
l use
onl
y

Tenement Schedule (Continued)
MALAGASY MINERALS LIMITED ABN 84 121 700 105 60
Title
Number
Permit
Type Grant Date Expiry Date Term Project Name
Total Carres
(New -
0.391km2)
Interest % Notes
21059 PR 14-Sep-07 13-Sep-12 5 Ampanihy - Maniry 16 100% - IM 1,2
21060 PR 30-Oct-06 29-Oct-11 5 Ampanihy - Maniry 16 3 : 100%
13 :100% - IM 1,2
21061 PR 30-Oct-06 29-Oct-11 5 Ampanihy - Maniry 16 100% - IM 1,2
21062 PR 03-Oct-07 02-Oct-12 5 Ampanihy-Maniry 32 4 : 100%
28 :100% -IM 1,2
21063 PR 30-Oct-06 29-Oct-11 5 Ampanihy - Maniry 32 100% - IM 1,2
21064 PR 30-Oct-06 29-Oct-11 5 Ampanihy - Maniry 16 1 : 100%
15 :100% - IM 1,2
24864 PR 08-May-07 07-May-12 5 Fotadrevo 48 100% - IM 1,2
25093 PE 18-Jan-07 17-Jan-47 40 Ampanihy - Ianapera 16 100% 3
25094 PE 18-Jan-07 17-Jan-47 40 Ampanihy - Ianapera 16 100% 3
25095 PE 18-Jan-07 17-Jan-47 40 Ampanihy - Maniry 48 100% 3
25605 PR 18-Jun-01 17-Jun-11 10 Ampanihy - Maniry 80 100% - IM 1,2
25606 PR 18-Jun-01 17-Jun-11 10 Ampanihy - Maniry 16 9 : 100%
7 : 100% - IM 1,2
28340 PR 08-Jan-08 07-Jan-13 5 Fotadrevo 48 25 : 100%
23 :100% - IM 1,2
28346 PR 08-Jan-08 07-Jan-13 5 Ampanihy-Maniry 16 4 : 100%
12 : 100% - IM 1,2
28347 PR 08-Jan-08 07-Jan-13 5 Fotadrevo 112 4 : 100%
108 : 100% -IM 1,2
28348 PR 08-Jan-08 07-Jan-13 5 Fotadrevo 16 100% - IM 1,2
28349 PR 08-Jan-08 07-Jan-13 5 Fotadrevo 16 100% - IM 1,2
28352 PR 08-Jan-08 07-Jan-13 5 Fotadrevo 96 100% - IM 1,2
28353 PR 08-Jan-08 07-Jan-13 5 Fotadrevo 96 47 : 100%
49 :100% - IM 1,2
29020 PR 12-Sep-08 25-Oct-12 5 Fotadrevo 32 20 : 100%
12 : 100% - IM 1,2
31734 PR 11-Feb-09 10-Feb-14 5 Ampanihy-Maniry 16 100% - IM 1,2
31735 PR 11-Feb-09 10-Feb-14 5 Ampanihy-Maniry 16 100% - IM 1,2
NOTES 1) 100% - IM indicates tenements held by MDA and Industrial Minerals rights sub-leased to Energizer Resources Inc.
2) Renewal awaiting confirmation from BCMM. All annual fees have been paid up to 31 December 2015.
3) Leased to SQNY – Royalty and partial tenement fees payable to MDA.
4) Leased to Jupiter Mines and Minerals – Royalty and annual tenement fees payable to MDA. 5) Leased to Hery Lala Alain Raharinavio – Royalty on small blocks.
For
per
sona
l use
onl
y