Embed Size (px)
Citation preview
ARTICLE IN PRESS
Available at www.sciencedirect.com
WAT E R R E S E A R C H 4 2 ( 2 0 0 8 ) 2 4 5 7 – 2 4 6 4
0043-1354/$ - see frodoi:10.1016/j.watres
�Corresponding auE-mail address:
journal homepage: www.elsevier.com/locate/watres
Nitrogen transformation in a denitrification layer irrigatedwith dairy factory effluent
L.A. Schippera,�, A. McGillb
aDepartment of Earth and Ocean Sciences, University of Waikato, Private Bag 3105, Hamilton, New ZealandbLandcare Research NZ Ltd., Private Bag 3127, Hamilton, New Zealand
a r t i c l e i n f o
Article history:
Received 15 December 2007
Received in revised form
24 January 2008
Accepted 28 January 2008
Available online 14 February 2008
Keywords:
Denitrification
Land-based effluent treatment
Nitrogen
Wastewater
Effluent
nt matter & 2008 Elsevie.2008.01.033
thor. Tel.: +64 7 858 3700; [email protected] (
a b s t r a c t
Adoption of land-based effluent treatment systems can be constrained by the costs and
availability of land. Sufficient land area is needed to ensure nitrate leaching from applied
effluent is minimised. One approach to decrease required land area is to enhance N
removal by denitrification. Layers of organic matter (100 mm thick) were installed below
topsoil of a site irrigated with dairy factory effluent. These ‘‘denitrification’’ layers were
tested to determine whether they could decrease nitrate leaching by increasing
denitrification. Four plots (10� 10 m2 each) were constructed with a denitrification layer
installed at 300 mm below the surface, and N losses were measured in leachate using
suction cups every 3 weeks for 19 months. N in leachate was compared with 4 control plots.
Denitrifying enzyme activity, nitrate concentrations, and carbon availability were
measured in samples collected from the denitrification layers. These measurements
demonstrated that denitrification occurred in the layer; however, denitrification rates were
not sufficiently high to significantly decrease nitrate leaching. Total N leaching was
296 kg N ha�1 from control plots and 238 kg N ha�1 from plots with denitrification layers; a
total of 798 kg N ha�1 was applied in effluent. More than 50% of the leached N to 40 cm was
as organic N, presumably due to bypass flow. Other studies have demonstrated that thicker
denitrification layers (more than 300 mm) can reduce nitrate leaching from small-scale
septic tank drainage fields but this study suggests that it is probably not practical to use
denitrification layers at larger scales.
& 2008 Elsevier Ltd. All rights reserved.
1. Introduction
Application of effluent to land can reduce direct discharge of
nutrients (particularly N and P) into water ways. However,
excess loadings of effluent can still result in high concentra-
tions of nitrate leaching to groundwater and then onto
surface waters (Cameron et al., 1997). Consequently, effluent
application rates are often constrained by N concentrations in
effluent. Where N concentrations are high, additional land
area is required and the cost of additional land is often the
greatest impediment for industries or municipalities choos-
r Ltd. All rights reserved.
ax: +64 7 858 4964.L.A. Schipper).
ing land application over mechanical treatment and dis-
charge to surface water. Therefore, there is a need to improve
N removal rates in the soil/plant systems if land-based
effluent treatment systems are to be encouraged.
Mechanisms for reducing nitrate leaching from land treat-
ment systems include plant harvest and removal (Cameron
et al., 1997), N immobilisation into the organic matter pool
(Degens et al., 2000), and denitrification (Barton et al., 1999a;
Lowrance et al., 1998; Singleton et al., 2001). Of these,
denitrification is the only mechanism whereby applied N is
converted to N gas completing the N cycle. Denitrification is
ARTICLE IN PRESS
WAT E R R E S E A R C H 4 2 ( 2 0 0 8 ) 2 4 5 7 – 2 4 6 42458
an anaerobic process so that in well-drained soils (i.e. those
often used in land treatment systems) it is generally
constrained by excess oxygen (Tiedje, 1988). In practice, this
means that denitrification rates in well-drained soils are
limited by the amount and distribution of particulate organic
matter (Parkin, 1987), which has the dual role of providing
both a carbon source for denitrifiers and an anaerobic
environment. Few studies have measured denitrification
rates in land-based effluent treatment systems but rates can
vary widely from less than 5 kg ha�1 yr�1 (Barton et al., 1999a)
to between 49 and 239 kg ha�1 yr�1 (Lowrance et al., 1998)
depending on N loading rate and soil type.
Little work has been undertaken on identifying approaches
to enhance denitrification at the site of application, although
denitrification walls have been shown successful at removing
nitrate from shallow groundwater leaving a land effluent
treatment system (Schipper et al., 2005). Singleton et al. (2001)
demonstrated that controlled drainage could increase deni-
trification in poorly drained soil irrigated with effluent.
Robertson et al. (2000) investigated the feasibility of adding
a layer of organic matter under the topsoil to increase N
removal as nitrate leached from septic tank drainage fields.
They reported reduction in nitrate leaching from around
30 mg N L�1 to less than 5 mg N L�1 at one site and from more
than 100 mg N L�1 to generally less than 10 mg N L�1 at a
second site during a 6-year study. The organic layer was
placed below the topsoil to allow mineralisation and nitrifica-
tion of applied organic N and ammonium to nitrate prior to
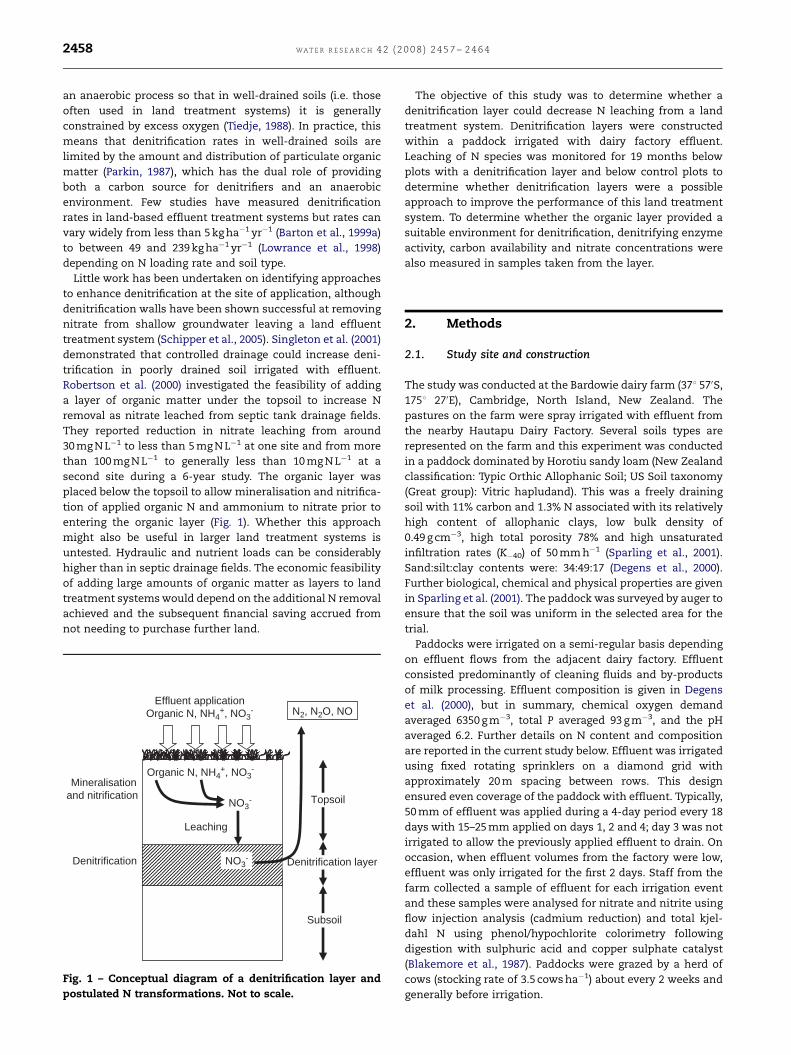
entering the organic layer (Fig. 1). Whether this approach
might also be useful in larger land treatment systems is
untested. Hydraulic and nutrient loads can be considerably
higher than in septic drainage fields. The economic feasibility
of adding large amounts of organic matter as layers to land
treatment systems would depend on the additional N removal
achieved and the subsequent financial saving accrued from
not needing to purchase further land.
Effluent applicationOrganic N, NH4
+, NO3-
Organic N, NH4+, NO3
-
NO3-
NO3-
Leaching
Mineralisationand nitrification
Denitrification
N2, N2O, NO
Topsoil
Denitrification layer
Subsoil
Fig. 1 – Conceptual diagram of a denitrification layer and
postulated N transformations. Not to scale.
The objective of this study was to determine whether a
denitrification layer could decrease N leaching from a land
treatment system. Denitrification layers were constructed
within a paddock irrigated with dairy factory effluent.
Leaching of N species was monitored for 19 months below
plots with a denitrification layer and below control plots to
determine whether denitrification layers were a possible
approach to improve the performance of this land treatment
system. To determine whether the organic layer provided a
suitable environment for denitrification, denitrifying enzyme
activity, carbon availability and nitrate concentrations were
also measured in samples taken from the layer.
2. Methods
2.1. Study site and construction
The study was conducted at the Bardowie dairy farm (371 570S,
1751 270E), Cambridge, North Island, New Zealand. The
pastures on the farm were spray irrigated with effluent from
the nearby Hautapu Dairy Factory. Several soils types are
represented on the farm and this experiment was conducted
in a paddock dominated by Horotiu sandy loam (New Zealand
classification: Typic Orthic Allophanic Soil; US Soil taxonomy
(Great group): Vitric hapludand). This was a freely draining
soil with 11% carbon and 1.3% N associated with its relatively
high content of allophanic clays, low bulk density of
0.49 g cm�3, high total porosity 78% and high unsaturated
infiltration rates (K�40) of 50 mm h�1 (Sparling et al., 2001).
Sand:silt:clay contents were: 34:49:17 (Degens et al., 2000).
Further biological, chemical and physical properties are given
in Sparling et al. (2001). The paddock was surveyed by auger to
ensure that the soil was uniform in the selected area for the
trial.
Paddocks were irrigated on a semi-regular basis depending
on effluent flows from the adjacent dairy factory. Effluent
consisted predominantly of cleaning fluids and by-products
of milk processing. Effluent composition is given in Degens
et al. (2000), but in summary, chemical oxygen demand
averaged 6350 g m�3, total P averaged 93 g m�3, and the pH
averaged 6.2. Further details on N content and composition
are reported in the current study below. Effluent was irrigated
using fixed rotating sprinklers on a diamond grid with
approximately 20 m spacing between rows. This design
ensured even coverage of the paddock with effluent. Typically,
50 mm of effluent was applied during a 4-day period every 18
days with 15–25 mm applied on days 1, 2 and 4; day 3 was not
irrigated to allow the previously applied effluent to drain. On
occasion, when effluent volumes from the factory were low,
effluent was only irrigated for the first 2 days. Staff from the
farm collected a sample of effluent for each irrigation event
and these samples were analysed for nitrate and nitrite using
flow injection analysis (cadmium reduction) and total kjel-
dahl N using phenol/hypochlorite colorimetry following
digestion with sulphuric acid and copper sulphate catalyst
(Blakemore et al., 1987). Paddocks were grazed by a herd of
cows (stocking rate of 3.5 cows ha�1) about every 2 weeks and
generally before irrigation.
ARTICLE IN PRESS
WA T E R R E S E A R C H 4 2 ( 2 0 0 8 ) 2 4 5 7 – 2 4 6 4 2459
Before construction of the denitrification layers, two blocks
(each 55 m long�10 m wide) were established in the paddock
in the centre of three rows of irrigators. Each block was
subdivided into four plots (each 10�10 m2, with a 5 m buffer
between plots). Two plots in each block had denitrification
layers installed (described below) and two remained undis-
turbed (control). Treatments were randomly assigned within
blocks. In February 2004, the denitrification layers were
constructed by removing the top 30 cm of soil from a
10�10 m2 plot using a large bucket excavator. Then 10 m3 of
garden chip (generally sold as a garden mulch, approximate
dry weight of 3 T) was spread across each excavated plot,
about 10 cm thick. The garden chip was a mixture of freshly
chipped branches and stem material with some leaf material
generally less than 10 mm in length and 3 mm in thickness.
Topsoil was replaced over the top of the organic material and
reseeded with ryegrass (Lolium presenne L.) and white clover
(Trifolium repens L.).
The soil on the control plots was not disturbed because the
objective of the study was to compare the effectiveness of an
installed denitrification layer for reducing nitrate leaching
against current practice. This meant that the experimental
design would not separate effects of topsoil disturbance and
addition of organic matter on the amount of N leaching. If the
layer was successful at reducing N losses then further work
would be conducted to determine exact mechanisms for N
removal and also measure potential adverse effects, such as
nitrous oxide emissions.
2.2. Leachate collection
Suction cups for collecting leachate were constructed using a
porous ceramic cup (Soilmoisture Ceramics, Australia, 40 mm
diameter) glued onto a PVC pipe (40 cm in length). Two plastic
tubes passed through the cap, one tube ran to bottom of the
ceramic cup for sampling of liquid. The second tube extended
just inside the cap and was used to apply a vacuum.
Suction cups were installed in November 2004 into each
plot (4 cups per plot). First a pit (30�30 cm2) was dug to below
the organic matter layer with four short narrow side trenches
(40 cm long�10 cm wide and 20 cm deep) radiating away from
the pit in each corner. The trenches allowed a Dutch auger to
drill into the opposite side of the pit below the organic layer at
approximately 201. Auger holes were about 40 cm in length
and the same diameter as the suction cups. A small amount
of water was added to some subsurface soil, mixed to a slurry,
and used to coat the ceramic cup before insertion into the
hole. The cup was about 40 cm below the surface. One cup
was installed into each wall and suction tubes were run into a
central PVC container (approximately 25 cm diameter and
40 cm high) through holes in sidewalls. Tubes passing through
the holes of the central container were sealed using expand-
ing foam. The container was closed with a screw cap, which
was flush with the soil surface and protected the container
from treading damage.
For the first 5 months after installation, suction (�30 kPa)
was periodically applied to all cups using a syringe and water
samples were discarded to avoid disturbance effects. Sample
collection was timed to occur immediately after the effluent
irrigation. A suction (�30 kPa) was applied to each suction cup
after the first 2 days of irrigation and before the final day of
irrigation (day 4). The day after the last irrigation, leachate
was collected from the suction cups using a syringe and
stored frozen until analysis. Nitrate and ammonium were
analysed using standard auto-analyser techniques (Blakemore
et al., 1987) and organic N determined following persulfate
digestion (Sparling et al., 1996) by auto-analyser.
2.3. Measurement of spray cover
To test whether plots received the same amounts of effluent
during the course of the experiment, total hydraulic loads
were measured on each of the plots. On day 3 of each
irrigation event, 4 buckets (30 cm diameter) were placed in a
square (5 m apart) centred on the middle of each plot.
Following a single day of irrigation, volume of effluent
collected in each of the buckets was measured. Volumes of
effluent were summed for each plot during the trial and a
t-test used to determine whether there were significant
differences in hydraulic load between plots with and without
denitrification layers.
2.4. Denitrification layer analyses
On three occasions (January, July 2005 and June 2006) samples
of organic matter were taken from the denitrification layer
and measurements made of denitrifying enzyme activity,
carbon availability, moisture content, and nitrate and ammo-
nium concentrations. Samples were taken from the layer
using a spade, transferred into plastic bags, and transported
to the laboratory for analysis within an hour.
Nitrate and ammonium were immediately extracted with
100 mL of KCl (2 M). The KCl extract was filtered (Advantec 5C)
and the filtrate was analysed for nitrate and ammonium by
standard auto-analyser techniques (Blakemore et al., 1987).
Denitrifying enzyme activity (DEA) was measured as de-
scribed by Schipper et al. (2005). Briefly, soil (10 g fresh weight)
was incubated shaking in airtight bottles (100 mL) at 28 1C.
Soils were amended with a 20 mL solution containing glucose
(0.2 g L�1), potassium nitrate (0.1 g N L�1), and chlorampheni-
col (0.12 g L�1). The headspace was replaced with N gas, and
10 mL acetylene added to inhibit reduction of N2O to N2. After
15 and 75 min, headspace samples were removed and
analysed for N2O using a gas chromatograph (Philips
PU4410, Cambridge, UK) equipped with an electron capture
detector. Available C was determined from the accumulation
of CO2 in the headspace of bottles (610 mL) that were statically
incubated at 25 1C for 7 days (Schipper et al., 2005). Carbon
availability was measured under aerobic (air headspace) and
anaerobic (N gas headspace) conditions. CO2 was analysed
using an infra-red gas analyser (Series 225, Analytical
Development Ltd. Corporation, Hoddesdon, England). Bio-
chemical results are presented on an oven dry-weight basis.
2.5. Data analysis
A simple daily water balance was used to estimate the
volume of leaching from the field site. A leaching event was
considered to occur when the sum of daily rainfall and
irrigation minus losses through evapotranspiration was
ARTICLE IN PRESS
WAT E R R E S E A R C H 4 2 ( 2 0 0 8 ) 2 4 5 7 – 2 4 6 42460
greater than the capacity of the soil storage. Rainfall and
Class A pan-evaporation were measured daily on-site. Poten-
tial evapotranspiration was estimated to be 0.8 of Class A
pan-evaporation (Doorenbos and Pruitt, 1984). Available soil
water reservoir was determined from the depth to the suction
cup (0.40 m) and measured available soil water data by
horizon. The resulting reservoir of available soil water was
93 mm. Actual daily evapotranspiration was determined
using a crop factor of 1.0 for pasture and an empirical
relationship that estimates AET based on the percentage of
available water in the soil reservoir (Allen et al., 1998).
Mass of N species leaching for each plot was calculated as
the product of concentration of the N species in the leachate
collected from the suction cups and the calculated leaching
volume determined from the water balance. The leaching
volume used was the sum of the daily leaching volumes
spanned by the suction cup sampling dates; this was
approximately 9 days before and 9 days after the sampling
of suction cup. These leaching losses were summed for each
plot to determine cumulative N losses over the period of the
study. For one control plot, samples from suction cups were
only intermittently available and it was not possible to
calculate cumulative losses. Consequently, for data analysis
the number of control plots was 3 whereas there were four
plots with a denitrification layer. T-tests were used to
determine whether there were significant differences be-
tween plots with and without denitrification layers.
3. Results
Total rainfall at the site was 2710 mm during the 19-month
study (Fig. 2). Irrigation events were generally 18 days apart
except in May when there were larger gaps between irrigation
events as less milk was processed through the factory. As
expected, evaporation rates were highest in mid-summer
(December–February) and lowest in winter (July–September)
(Fig. 2). Consequently, calculated drainage was generally
lower in summer (November–March), particularly in 2005,
when rainfall was low in January through March (Fig. 2).
The N loading in effluent during the study period was
870 kg ha�1. There were no significant differences in effluent
hydraulic loads between control plots (average hydraulic load
of 750 mm) and plots with a denitrification layer (average
hydraulic load of 767 mm). Total N loads in effluent were
798 kg N ha�1 applied evenly throughout the 2-year study
period (Fig. 3), which is considerably higher than most dairy
farms would receive through fertiliser additions and N
fixation by clover. In comparison, in the Waikato region, dairy
farms applied about 113 kg N ha�1 y�1 and N fixation would
have added a further 120 kg ha�y�1 (Parfitt et al 2006). The
average N concentration in the effluent was 75 g N m�3,
predominantly as total kjeldahl N (average 94%) with the
remainder being nitrate and nitrite.
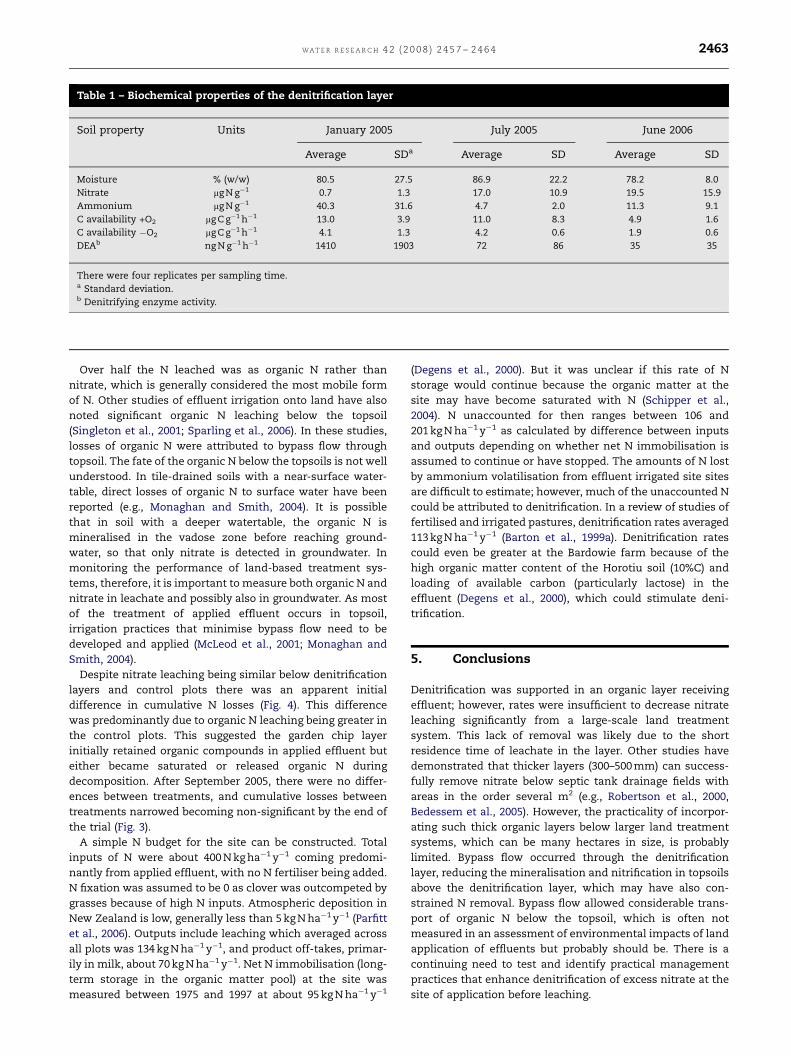
For both control plots and plots with a denitrification layer,
N leaching was greatest in winter months (May–August) for
both years (Fig. 4). In the first year, losses were predominantly
as organic N, whereas in the second year, nitrate accounted
for a greater proportion of N losses (Fig. 4a and b). Ammonium
losses were a small component of the total N leached (Fig. 4c).
The only significant differences in total N leaching between
control plots and denitrification layer plots occurred in the
first few months of monitoring. This difference was primary
due to less organic N leaching through the denitrification
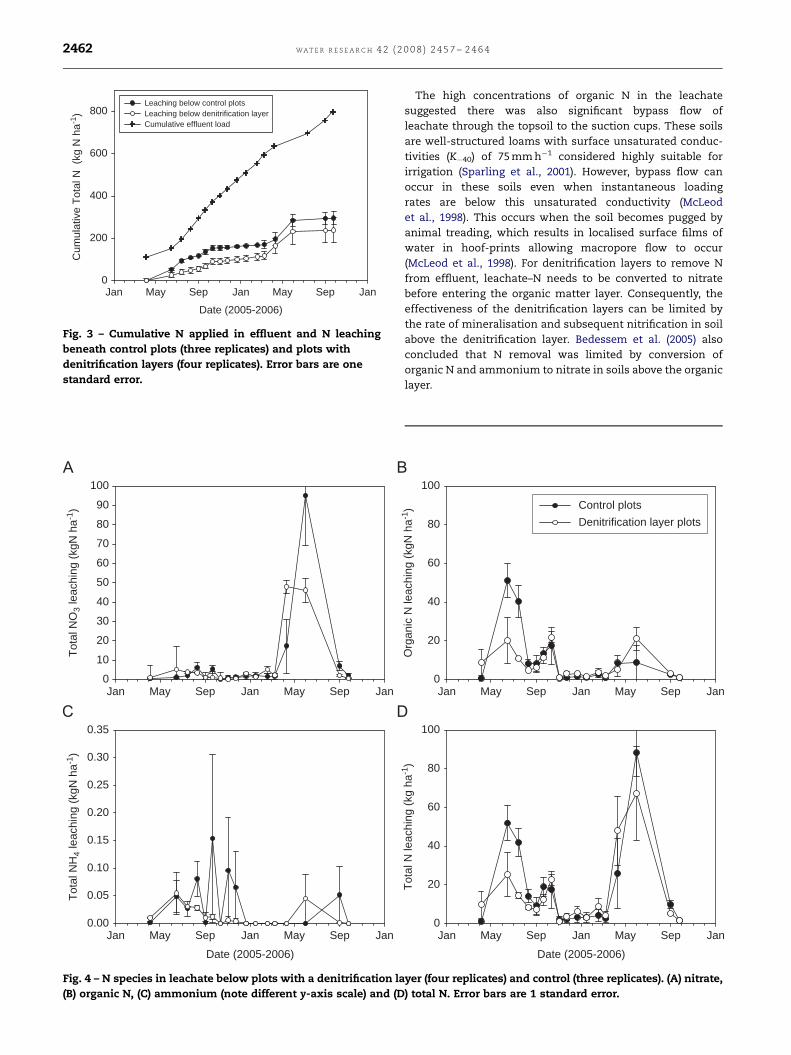
layer plots (Fig. 4). Cumulative N leaching for the study period
was initially less in the denitrification layer plots than control
plots (Fig. 3). However, by the end of the study, cumulative
leaching in the controls was 296 kg ha�1 yr�1 (standard
error ¼ 28, n ¼ 3) and not significantly different from plots
with denitrification layers with a cumulative leaching of
238 kg ha�1 yr�1 (standard error ¼ 58, n ¼ 4) (Fig. 3). This
leaching loss was about 30–38% of total N applied in effluent.
Denitrifying enzyme activity and available carbon (aerobic
and anaerobic) in the denitrification layer declined with time
(Table 1). Nitrate and ammonium was always present in the
organic material.
4. Discussion
Biochemical measurements (DEA, available carbon and ni-
trate concentrations) suggested that conditions were con-
ducive for denitrification in the garden chip layer (Table 1).
Denitrification is generally limited by available carbon, nitrate
concentration and sufficient anaerobic sites. Nitrate was
present in extracted samples collected from the garden chip
layer and was generally greater than 5 mg kg�1, which is the
concentration below which denitrification can become nitrate
limited (Barton et al., 1999b). Carbon availability was similar
to that measured in denitrification walls where nitrate
removal was shown to be due to denitrification for more
than 7 years (Schipper and Vojvodic-Vukovic, 2001; Schipper
et al., 2005), suggesting carbon was not limiting. However,
unlike the denitrification wall, the denitrification layer was
not permanently water saturated and denitrification could be
constrained by excess oxygen in pores. In aerobic environ-
ments, such as well-drained soils, denitrification occurs in
anaerobic microsites, such as pieces of organic matter
(Parkin, 1987) or in aggregates (Sexstone et al., 1985). Garden
chip material was nearly saturated when sampled with a
moisture content of about 80% (w/w), which would reduce
penetration of oxygen and allow formation of anaerobic
microsites within chips where denitrification could be active.
Supporting evidence for this was the initially high DEA, which
is a surrogate measure of the size of the active microbial
population capable of denitrification reflecting antecedent
conditions. Like carbon availability, DEA values were similar
to those measured in the denitrification walls (Schipper et al.,
2005). DEA declined during the 1.5-year sampling period (from
over 1400 to less than 40 ng N g�1 h�1), probably due to
declines in available carbon as labile fractions of garden chip
degraded. Declines in DEA were also measured with time in
denitrification walls as carbon availability decreased (Schip-
per and Vojvodic-Vukovic 2001). DEA may also have been less
in the last two samplings due to seasonal effects. The last two
samplings were taken during winter when soil temperatures
at 30 cm were about 8 1C and much less than during summer
when temperatures are around 19 1C.
While there was strong evidence that denitrification
occurred in the garden chip matrix, the rate was not sufficient
ARTICLE IN PRESS
Dai
ly ra
infa
ll (m
m)
0
20
40
60
80
100
Irrig
atio
n (m
m)
05
1015202530
Dai
ly e
vapo
ratio
n (m
m)
02468
1012
Date (2005-2006)Ja
nFeb Mar Apr
May Ju
n JulAug Sep Oct
Nov Dec Jan
Feb Mar AprMay Ju
n JulAug Sep Oct
Nov
Cal
cula
ted
mon
thly
dra
inag
e (m
m)
0
50
100
150
200
250
300
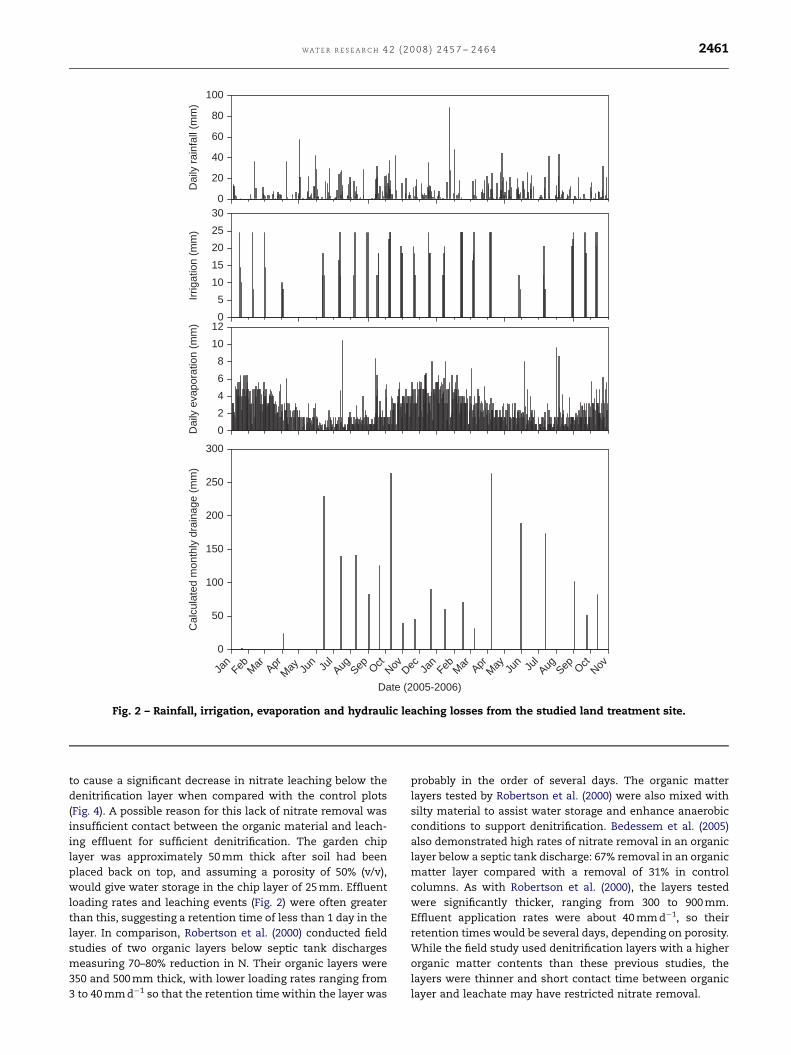
Fig. 2 – Rainfall, irrigation, evaporation and hydraulic leaching losses from the studied land treatment site.
WA T E R R E S E A R C H 4 2 ( 2 0 0 8 ) 2 4 5 7 – 2 4 6 4 2461
to cause a significant decrease in nitrate leaching below the
denitrification layer when compared with the control plots
(Fig. 4). A possible reason for this lack of nitrate removal was
insufficient contact between the organic material and leach-
ing effluent for sufficient denitrification. The garden chip
layer was approximately 50 mm thick after soil had been
placed back on top, and assuming a porosity of 50% (v/v),
would give water storage in the chip layer of 25 mm. Effluent
loading rates and leaching events (Fig. 2) were often greater
than this, suggesting a retention time of less than 1 day in the
layer. In comparison, Robertson et al. (2000) conducted field
studies of two organic layers below septic tank discharges
measuring 70–80% reduction in N. Their organic layers were
350 and 500 mm thick, with lower loading rates ranging from
3 to 40 mm d�1 so that the retention time within the layer was
probably in the order of several days. The organic matter
layers tested by Robertson et al. (2000) were also mixed with
silty material to assist water storage and enhance anaerobic
conditions to support denitrification. Bedessem et al. (2005)
also demonstrated high rates of nitrate removal in an organic
layer below a septic tank discharge: 67% removal in an organic
matter layer compared with a removal of 31% in control
columns. As with Robertson et al. (2000), the layers tested
were significantly thicker, ranging from 300 to 900 mm.
Effluent application rates were about 40 mm d�1, so their
retention times would be several days, depending on porosity.
While the field study used denitrification layers with a higher
organic matter contents than these previous studies, the
layers were thinner and short contact time between organic
layer and leachate may have restricted nitrate removal.
ARTICLE IN PRESS
Date (2005-2006)
0.00
0.05
0.10
0.15
0.20
0.25
0.30
0.35
Jan0
10
20
30
40
50
60
70
80
90
100
May Sep Jan May Sep Jan
Jan May Sep Jan May Sep Jan
Tota
l NH
4 le
achi
ng (k
gN h
a-1)
Tota
l NO
3 le
achi
ng (k
gN h
a-1)
Fig. 4 – N species in leachate below plots with a denitrification la
(B) organic N, (C) ammonium (note different y-axis scale) and (D
Date (2005-2006)
Jan
Cum
ulat
ive
Tota
l N (
kg N
ha-1
)
0
200
400
600
800Leaching below control plotsLeaching below denitrification layerCumulative effluent load
May Sep Jan May Sep Jan
Fig. 3 – Cumulative N applied in effluent and N leaching
beneath control plots (three replicates) and plots with
denitrification layers (four replicates). Error bars are one
standard error.
WAT E R R E S E A R C H 4 2 ( 2 0 0 8 ) 2 4 5 7 – 2 4 6 42462
The high concentrations of organic N in the leachate
suggested there was also significant bypass flow of
leachate through the topsoil to the suction cups. These soils
are well-structured loams with surface unsaturated conduc-
tivities (K�40) of 75 mm h�1 considered highly suitable for
irrigation (Sparling et al., 2001). However, bypass flow can
occur in these soils even when instantaneous loading
rates are below this unsaturated conductivity (McLeod
et al., 1998). This occurs when the soil becomes pugged by
animal treading, which results in localised surface films of
water in hoof-prints allowing macropore flow to occur
(McLeod et al., 1998). For denitrification layers to remove N
from effluent, leachate–N needs to be converted to nitrate
before entering the organic matter layer. Consequently, the
effectiveness of the denitrification layers can be limited by
the rate of mineralisation and subsequent nitrification in soil
above the denitrification layer. Bedessem et al. (2005) also
concluded that N removal was limited by conversion of
organic N and ammonium to nitrate in soils above the organic
layer.
0
20
40
60
80
100
Date (2005-2006)
0
20
40
60
80
100
Control plots Denitrification layer plots
Sep
Sep
Jan May Jan May Sep Jan
Jan May Jan May Sep Jan
Tota
l N le
achi
ng (k
g ha
-1)
Org
anic
N le
achi
ng (k
gN h
a-1)
yer (four replicates) and control (three replicates). (A) nitrate,
) total N. Error bars are 1 standard error.
ARTICLE IN PRESS
Table 1 – Biochemical properties of the denitrification layer
Soil property Units January 2005 July 2005 June 2006
Average SDa Average SD Average SD
Moisture % (w/w) 80.5 27.5 86.9 22.2 78.2 8.0
Nitrate mg N g�1 0.7 1.3 17.0 10.9 19.5 15.9
Ammonium mg N g�1 40.3 31.6 4.7 2.0 11.3 9.1
C availability +O2 mg C g�1 h�1 13.0 3.9 11.0 8.3 4.9 1.6
C availability �O2 mg C g�1 h�1 4.1 1.3 4.2 0.6 1.9 0.6
DEAb ng N g�1 h�1 1410 1903 72 86 35 35
There were four replicates per sampling time.a Standard deviation.b Denitrifying enzyme activity.
WA T E R R E S E A R C H 4 2 ( 2 0 0 8 ) 2 4 5 7 – 2 4 6 4 2463
Over half the N leached was as organic N rather than
nitrate, which is generally considered the most mobile form
of N. Other studies of effluent irrigation onto land have also
noted significant organic N leaching below the topsoil
(Singleton et al., 2001; Sparling et al., 2006). In these studies,
losses of organic N were attributed to bypass flow through
topsoil. The fate of the organic N below the topsoils is not well
understood. In tile-drained soils with a near-surface water-
table, direct losses of organic N to surface water have been
reported (e.g., Monaghan and Smith, 2004). It is possible
that in soil with a deeper watertable, the organic N is
mineralised in the vadose zone before reaching ground-
water, so that only nitrate is detected in groundwater. In
monitoring the performance of land-based treatment sys-
tems, therefore, it is important to measure both organic N and
nitrate in leachate and possibly also in groundwater. As most
of the treatment of applied effluent occurs in topsoil,
irrigation practices that minimise bypass flow need to be
developed and applied (McLeod et al., 2001; Monaghan and
Smith, 2004).
Despite nitrate leaching being similar below denitrification
layers and control plots there was an apparent initial
difference in cumulative N losses (Fig. 4). This difference
was predominantly due to organic N leaching being greater in
the control plots. This suggested the garden chip layer
initially retained organic compounds in applied effluent but
either became saturated or released organic N during
decomposition. After September 2005, there were no differ-
ences between treatments, and cumulative losses between
treatments narrowed becoming non-significant by the end of
the trial (Fig. 3).
A simple N budget for the site can be constructed. Total
inputs of N were about 400 N kg ha�1 y�1 coming predomi-
nantly from applied effluent, with no N fertiliser being added.
N fixation was assumed to be 0 as clover was outcompeted by
grasses because of high N inputs. Atmospheric deposition in
New Zealand is low, generally less than 5 kg N ha�1 y�1 (Parfitt
et al., 2006). Outputs include leaching which averaged across
all plots was 134 kg N ha�1 y�1, and product off-takes, primar-
ily in milk, about 70 kg N ha�1 y�1. Net N immobilisation (long-
term storage in the organic matter pool) at the site was
measured between 1975 and 1997 at about 95 kg N ha�1 y�1
(Degens et al., 2000). But it was unclear if this rate of N
storage would continue because the organic matter at the
site may have become saturated with N (Schipper et al.,
2004). N unaccounted for then ranges between 106 and
201 kg N ha�1 y�1 as calculated by difference between inputs
and outputs depending on whether net N immobilisation is
assumed to continue or have stopped. The amounts of N lost
by ammonium volatilisation from effluent irrigated site sites
are difficult to estimate; however, much of the unaccounted N
could be attributed to denitrification. In a review of studies of
fertilised and irrigated pastures, denitrification rates averaged
113 kg N ha�1 y�1 (Barton et al., 1999a). Denitrification rates
could even be greater at the Bardowie farm because of the
high organic matter content of the Horotiu soil (10%C) and
loading of available carbon (particularly lactose) in the
effluent (Degens et al., 2000), which could stimulate deni-
trification.
5. Conclusions
Denitrification was supported in an organic layer receiving
effluent; however, rates were insufficient to decrease nitrate
leaching significantly from a large-scale land treatment
system. This lack of removal was likely due to the short
residence time of leachate in the layer. Other studies have
demonstrated that thicker layers (300–500 mm) can success-
fully remove nitrate below septic tank drainage fields with
areas in the order several m2 (e.g., Robertson et al., 2000,
Bedessem et al., 2005). However, the practicality of incorpor-
ating such thick organic layers below larger land treatment
systems, which can be many hectares in size, is probably
limited. Bypass flow occurred through the denitrification
layer, reducing the mineralisation and nitrification in topsoils
above the denitrification layer, which may have also con-
strained N removal. Bypass flow allowed considerable trans-
port of organic N below the topsoil, which is often not
measured in an assessment of environmental impacts of land
application of effluents but probably should be. There is a
continuing need to test and identify practical management
practices that enhance denitrification of excess nitrate at the
site of application before leaching.
ARTICLE IN PRESS
WAT E R R E S E A R C H 4 2 ( 2 0 0 8 ) 2 4 5 7 – 2 4 6 42464
Acknowledgements
Thanks to staff from Hautapu Dairy factory for access to the
site, assistance with irrigation and grazing scheduling, and
provision of weather and effluent data. Greg Barkle is thanked
for assistance with calculating water balances. Maja Vojvodic-
Vukovic is thanked for biochemical analysis. Malcolm McLeod
is thanked for help with site selection. John Russell, Greg
Barkle, Bryan Stevenson, Graham Sparling and Anne Austin
are thanked for helpful comments on the manuscript. Two
anonymous reviewers are thanked for their comments, in
particular the suggestion to incorporate a simple nitrogen
budget for the site. This work was funded by FRST Contract
C09X0304 and the University of Waikato.
R E F E R E N C E S
Allen, R., Pereira, L., Raes, D., Smith, M., 1998. Crop evapotran-spiration—guidelines for computing crop water requirements.FAO Irrigation and Drainage Paper 56, FAO, Rome.
Barton, L., McLay, C.D.A., Schipper, L.A., Smith, C.T., 1999a.Denitrification rates in a wastewater-irrigated forest soil.J. Environ. Qual. 28, 2008–2015.
Barton, L., McLay, C.D.A., Schipper, L.A., Smith, C.T., 1999b.Annual denitrification rates in agricultural and forested soils:a review. Aust. J. Soil Res. 37, 1073–1093.
Bedessem, M.E., Edgar, T.V., Roll, R., 2005. Nitrogen removal inlaboratory model leachfields with organic rich layers.J. Environ. Qual. 34, 936–942.
Blakemore, L.C., Searle, L., Daly, B.K., 1987. Methods for ChemicalAnalysis of Soils. Scientific Report 80. NZ Soil Bureau, LowerHutt, New Zealand.
Cameron, K.C., Di, H.J., McLaren, R.G., 1997. Is soil an appropriatedumping ground for our wastes? Aust. J. Soil Res. 35, 995–1035.
Degens, B.P., Schipper, L.A., Claydon, J.J., Russell, J.M., Yeates,G.W., 2000. Irrigation of an allophanic soil with dairy factoryeffluent for 22 years: responses of nutrient storage and soilbiota. Aust. J. Soil Res. 38, 25–35.
Doorenbos J., Pruitt, W.O., 1984. Guidelines for predicting cropwater requirements. FAO Irrigation and Drainage Paper 24,FAO, Rome.
Lowrance, R., Johnson, J.C., Newton, G.L., Williams, R.G., 1998.Denitrification from soils of a year-round forage productionsystem fertilized with liquid dairy manure. J. Environ. Qual. 27,1504–1511.
McLeod, M., Schipper, L.A., Taylor, M.D., 1998. Preferential flowin a well drained and a poorly drained soil under different
overhead irrigation regimes. Soil Use Manage. 14,96–100.
McLeod, M., Aislabie, J., Smith, J., Fraser, R., Roberts, A., Taylor, M.,2001. Viral and chemical tracer movement through contrast-ing soils. J. Environ. Qual. 30, 2134–2140.
Monaghan, R.M., Smith, L.C., 2004. Minimising surface waterpollution resulting from farm-dairy effluent application tomole-pipe drained soils. II. The contribution of preferentialflow of effluent to whole-farm pollutant losses in subsurfacedrainage from a West Otago dairy farm. N. Z. J. Agric. Res. 47,417–428.
Parfitt, R.L., Schipper, L.A., Baisden, W.T., Elliot, A.H., 2006.Nitrogen inputs and outputs for New Zealand in 2001 atnational and regional scales. Biogeochemistry 80, 71–88.
Parkin, T.B., 1987. Soil microsites as a source of denitrificationvariability. Soil Sci. Soc. Am. J. 51, 1194–1199.
Robertson, W.D., Blowes, D.W., Ptacek, C.J., Cherry, J.A., 2000.Long-term of performance of in situ reactive barriers fornitrate remediation. Ground Water 38, 689–695.
Schipper, L.A., Vojvodic-Vukovic, M., 2001. Five years of nitrateremoval, denitrification and carbon dynamics in a denitrifi-cation wall. Water Res. 35, 3473–3477.
Schipper, L.A., Percival, H.J., Sparling, G.P., 2004. An approach forestimating maximum nitrogen storage in soils. Soil UseManage. 20, 281–286.
Schipper, L.A., Barkle, G.F., Vojvodic-Vukovic, M., 2005. Maximumrates of nitrate removal in a denitrification wall. J. Environ.Qual. 34, 1270–1276.
Sexstone, A.J., Revsbech, N.P., Parkin, T.B., Tiedje, J.M., 1985. Directmeasurement of oxygen profiles and denitrification rates insoil aggregates. Soil Sci. Soc. Am. J. 49, 649–651.
Singleton, P.L., McLay, C.D.A., Barkle, G.F., 2001. Nitrogen leachingfrom soil lysimeters irrigated with dairy shed effluent andhaving managed drainage. Aust. J. Soil Res. 39, 385–396.
Sparling, G.P., Zhu, C.Y., Fillery, I.R.P., 1996. Microbial immobiliza-tion of N-15 from legume residues in soils of differing textures:measurement by persulphate oxidation and ammonia diffu-sion methods. Soil Biol. Biochem. 28, 1707–1715.
Sparling, G.P., Schipper, L.A., Russell, J.M., 2001. Changes in soilproperties after application of dairy factory effluent to NewZealand volcanic ash and pumice soils. Aust. J. Soil Res. 39,505–518.
Sparling, G.P., Barton, L., Duncan, L., McGill, A., Speir, T.W.,Schipper, L.A., Arnold, G., Van Schaik, A., 2006. Nutrientleaching and changes in soil characteristics of four contrastingsoils irrigated with secondary-treated wastewater for 4 years.Aust. J. Soil Res. 44, 107–116.
Tiedje, J.M., 1988. Ecology of denitrification and dissimilatorynitrate reduction to ammonium. In: Zehnder, A.J.B. (Ed.),Biology of Anaerobic Microorganisms. John & Sons, New York,USA, pp. 179–244.