Embed Size (px)
Citation preview
Nitrogen fixation by Elaeagnus angustifolia in the reclamation
of degraded croplands of Central Asia
ASIA KHAMZINA,1,2 JOHN P.A. LAMERS1 and PAUL L.G. VLEK1
1 Center for Development Research (ZEF), Walter Flex Street 3, 53113 Bonn, Germany
2 Corresponding author ([email protected])
Received July 22, 2008; accepted February 15, 2009
Summary Extensive degradation of irrigated croplands,
due to increasing soil salinity and depletion of soil
nutrient stocks, is a major problem in Central Asia
(CA), one of the largest irrigated areas in the world. To
assess the potential for improving the productive capacity
of degraded lands by afforestation, we examined N2
fixation of Elaeagnus angustifolia L. in mixed plantations
with non-fixing Populus euphratica Oliv. and Ulmus
pumila L. Fixation of N2 was quantified by the 15N
natural abundance technique based on both foliar
and whole-plant sampling during five consecutive
growing seasons. Despite elevated root-zone soil
salinity (6–10 dS m�1) and deficiency in plant-available
P (4–15 mg kg�1), N2 fixation (%Ndfa) increased from
an initial value of 20% to almost 100% over 5 years.
Within each growing season, %Ndfa steadily increased
and peaked in the fall. Annual N2 fixation, determined
using foliar d15N, initially averaged 0.02 Mg ha�1,
peaked at 0.5 Mg ha�1 during the next 2 years and
thereafter stabilized at 0.3 Mg ha�1. Estimates based on
whole-plant d15N were <10% lower than those based on
foliar d15N. The increase in plant-available soil N was
significantly higher in E. angustifolia plots than in
P. euphratica and U. pumila plots. Increases in the
concentrations of organic C (19%), total N (21%) and
plant-available P (74%) in the soil were significant
irrespective of tree species. This improvement in soil
fertility is further evidence that afforestation with mixed-
species plantations can be a sustainable land use option
for the degraded irrigated croplands in CA.
Keywords: afforestation, 15N natural abundance technique,P. euphratica, salinity, soil fertility, U. pumila, Uzbekistan.
Introduction
Afforestation has proven to be effective in re-vegetating sal-
ine landscapes, reducing elevated groundwater tables and
thus mitigating dryland salinization in irrigated land use
systems (Marcar and Crawford 2004). Planting N2-fixing
tree species on nutrient-exhausted fallow lands or inter-
planting them with crop species is a common silvicultural
practice that utilizes the ability of N2-fixers to replenish
nutrient stocks and increase the productivity of agrofor-
estry and silvopastoral systems, particularly in tropical
regions (Dawson 1986, Dommergues 1987, Danso et al.
1992, Paschke 1997, Galiana et al. 2004). To date, however,
few studies have examined biological N2 fixation and its
contribution to soil fertility in Central Asia (CA). This
region, one of the largest irrigated areas in the world, could
benefit greatly from improved forest fallows given that
extensive areas have been withdrawn from agricultural
use because of soil salinization and land degradation
(World Bank for Reconstruction and Development 2002,
Saigal 2003).
Afforestation, as an alternative land use system for
degraded agricultural areas, can be further enhanced by
planting both N2-fixing and non-fixing fast-growing multi-
purpose tree species that provide fuelwood, high-protein live-
stock fodder, edible fruits and, in the long term, timber
(Galiana et al. 2004, Khamzina et al. 2006, Lamers and
Khamzina 2008,Lamers et al. 2008). The actinorhizal species
Elaeagnus angustifolia L., native to CA, is salt-tolerant and
useful for fruit, fuelwood, gum, leaf fodder, nectar andhoney
production, medicinal purposes and amenity planting
(Hayes 1976, Ayaz et al. 1999, Katz and Shafroth 2003,
Khamzina et al. 2006). BecauseE. angustifolia is able to grow
in a wide range of climatic and soil conditions and particu-
larly on disturbed sites, it has been widely propagated as a
wildlife, windbreak, highway and reclamation species (Uresk
and Yamamoto 1994, Heinze and Liebmann 1998, Forestry
Compendium 2000). In riparian ecosystems, E. angustifolia
often colonizes aggressively, displacing native vegetation
and hence is regarded as a noxious exotic weed, e.g., in the
United States (Katz and Shafroth 2003). However, mixing
valuable tree crops such as Juglans nigra L. with N2-fixing
Elaeagnus umbellata Thunb. can improve growth perfor-
manceofJ. nigraas a result of increased soilNmineralization
rates (Friedrich and Dawson 1984, Ponder 1988, Paschke
1997). Further research is needed to determine if this bio-
fertilizer quality of Elaeagnus holds true on degraded
� The Author 2009. Published by Oxford University Press. All rights reserved.For Permissions, please email: [email protected]
Tree Physiology Page 1 of 10
doi:10.1093/treephys/tpp017
Tree Physiology Advance Access published March 20, 2009 by guest on O
ctober 1, 2014http://treephys.oxfordjournals.org/
Dow
nloaded from
agricultural lands in CAwhere N2 fixation may be restricted
because of salinity, P-deficiency or insufficient soil water con-
tent – conditions known to inhibit the Frankia symbiosis
(Danso et al. 1992, Galiana et al. 2004).
The dearth of information on N2 fixation of actinorhizal
tree species compared with crop and pasture legume fixa-
tion has been attributed to the practical difficulties of
repeated whole-plant sampling because of the large size
and year-to-year variations in N2 fixation of trees (Dawson
1986, Boddey et al. 2000, Galiana et al. 2004, Gehring et al.
2005). Given these constraints, most published results have
been based on seedlings during their first 1–2 years of
growth (Galiana et al. 2004). Longer-term studies are
needed to determine temporal changes in the reliance of
trees on biologically fixed N for nutrition.
Among the various approaches available, the 15N natural
abundance method has proven to be the most suitable for
quantifying N2 fixation in tree plantations and agroforestry
systems, subject to certain requirements being met, includ-
ing the selection of appropriate reference plants and adjust-
ment for isotopic fractionation within the N2-fixer
(Domenach et al. 1989, Boddey et al. 2000, Peoples et al.
2002, Galiana et al. 2004, Unkovich et al. 2008). We used
the 15N natural abundance method to (1) evaluate seasonal
and year-to-year changes in N2 fixation by E. angustifolia
planted on a degraded agricultural site; (2) quantify the
contribution of N2 fixation to the plant–soil system; and
(3) assess changes in soil fertility following afforestation.
Materials and methods
Study region
The study was conducted on 2 ha of degraded agricultural
land in an experimental tree plantation located in the
Khorezm Region of Uzbekistan (41�650 N and 60�620 E,altitude 102 m a.s.l.). This region is a part of the Amu
Darya River lowlands within the transition zone of the
Karakum and Kyzylkum deserts and belongs to the CA
semi-desert zone that is characterized by an extremely con-
tinental climate. Mean annual rainfall of 100 mm falls
mostly outside the growing season and is greatly exceeded
by the potential evapotranspiration of 900–1000 mm.
Following decades of intense cultivation using unsustain-
able irrigation practices (Saigal 2003) about 15–20% of
the irrigated land in Khorezm is currently considered to
have low or no suitability for cropping. This study is part
of an international research program to assess the viability
of alternative uses of this land, particularly conversion to
multipurpose tree plantations (Martius et al. 2004).
Afforestation site
In 2003, a long-term experiment was initiated based on a
two factorial split-plot design comprising three tree species
(split factor) and three irrigation techniques (main factor)
as previously described (Khamzina et al. 2008). The tree
species were the actinorhizal Russian olive (E. angustifolia;
Elaeagnaceae) and two non-fixers, Euphrates poplar
(Populus euphratica Oliv.; Salicaceae) and Siberian elm
(Ulmus pumila L.; Ulmaceae). Elaeagnus angustifolia and
P. euphratica naturally co-exist in the poplar-dominated
riparian forest of the Amu Darya River. Both species have
also been planted within the nearby irrigated agricultural
area. Ulmus pumila was introduced to CA during the last
century and has been widely grown as a windbreak in the
irrigated area ever since.
The tree species were arranged in 36 pure, completely
randomized plots (12 plots per species), spaced 3.5 m from
each other. Each experimental plot, 105 m2 in size,
was planted in April 2003 with 70 one-year-old saplings
at a spacing of 1 m · 1.75 m, resulting in a density of
5714 trees ha�1. Given the dense planting, the plots devel-
oped closed canopies during the first growing season. The
trees received 80–160 mm year�1 of water applied either
by the furrow or drip irrigation method during the first
two growing seasons in 2003 and 2004. Because the
irrigation treatments did not have a significant effect on15N signals or N concentrations, this factor was omitted
from all our analyses.
Irrigation ceased from 2004 onwards and trees were left to
rely on the shallow groundwater table that averaged 1.3m in
2003 and gradually dropped to 1.9 m in 2007. Throughout
this period, the mean root-zone water content decreased
but at all times was close to field capacity, which ranged
from 27% to 38% within the soil profile. Groundwater
salinity ranged between 0.7 and 4.8 dS m�1 during the
2003–2007 observation period (Khamzina et al. 2008). Soils
at the experimental site are old irrigated meadow alluvial
soils with a predominantly silt loamy texture and a slightly
alkaline reaction. During 2003–2007, the degree of soil salin-
ity increased in the experimental plots from moderate-
to-strong as evidenced by the electrical conductivity (EC)
measurements. Soil fertility was initially poor because of
low organic carbon (C) and nitrogen (N), phosphorus (P)
and potassium (K) concentrations (Table 1). The concentra-
tions of major nutrients in the groundwater, measured at the
end of the seasons 2006–2007, were low (Table 2).
Plant sampling and analyses
Initially, to estimate N2 fixation by E. angustifolia, about
200 g of fresh leaves from a representative tree of each spe-
cies was collected from six of the 12 species-specific plots
(i.e., 18 plots sampled in all) at the beginning, middle and
end of the growing seasons (i.e., May, July and October)
in 2003–2005. Thereafter, all 36 plots were sampled
monthly throughout the growing seasons in 2006 and
2007. Fully expanded leaves were collected from various
levels of the canopy and bulked by the tree to integrate
within-tree variations (Domenach et al. 1989). At the end
of 2006 and 2007 seasons, all plant fractions were sampled
2 KHAMZINA, LAMERS AND VLEK
TREE PHYSIOLOGY
by guest on October 1, 2014
http://treephys.oxfordjournals.org/D
ownloaded from
including leaves, stems, twigs, coarse roots, fine roots and
nodules. The samples were dried at 60 �C for 72 h, finely
ground and analyzed for N concentration and 15N natural
abundance with a mass spectrometer (ANCA–SL/20-20,
SerCon, UK), with 2–3 replicates per sample. Samples col-
lected during 2003–2005 were stored and all were analyzed
at the same time in 2005. Samples collected in 2006 and
2007 were analyzed at the end of the year in which they
were collected.
Fixation of N2 by E. angustifolia was quantified by the15N natural abundance technique, according to Shearer
and Kohl (1986):
%Ndfa ¼d15Nref � d15Nfixing
� �d15Nref � B� �
" #� 100; ð1Þ
where %Ndfa is the proportion of N derived from atmo-
spheric N2, d15Nref is the 15N natural abundance of the
reference (non-fixing) species P. euphratica or U. pumila,
d15Nfixing is the d15N of the N2-fixing E. angustifolia and
B is the 15N value of the same N2-fixing species grown
with N2 as the sole nitrogen source.
For each growing season, %Ndfa was calculated using a
weighted mean of d15N based on whole-plant samples at
the end of 2006 and 2007 and whole-plant B values previ-
ously determined for actinorhizal species (Domenach
et al. 1989, Tjepkema et al. 2000), ranging from �1.41 to
�2.0. These authors did not specify d15N for leaves and
their reported whole-plant d15N values were higher than
the foliar d15N values of our field-grown trees. Therefore,
to determine the %Ndfa based solely on foliar d15N we fol-
lowed the approach of Peoples et al. (2002) and used the
minimal field-observed foliar d15N (�2.53) as the B value.
The annual rate of N2 fixation (Mg ha�1 year�1) was cal-
culated based on the N content accumulated annually in
plant tissues and the estimated %Ndfa. For the years
2003–2005, the N concentrations and 15N abundance in
the fractions other than leaves were assumed to be similar
to those measured in samples of these tissues collected in
2006 and 2007.
Biomass production
At the end of the growing season, in October 2003 and
2004, eight trees in each experimental plot were felled at
ground level and separated into stem, branches and foliage.
In 2005, four trees per plot were harvested and in subse-
quent years one tree per plot was used to determine dry
matter (DM) production. Coarse roots (Ø > 3 mm) were
excavated by hand to quantify belowground DM. In the
laboratory, roots were washed, separated from necromass
and grouped into several fractions according to root diam-
eter. Fine roots (Ø < 3 mm) and nodules were sampled at
each plot from four points around a tree (between trees in a
row and between rows) with a root auger, down to a depth
of 0.9 m. High soil water contents precluded sampling of
deeper horizons. For determination of DM, all plant parts
were dried at 103 �C to constant mass.
Soil and groundwater sampling and analyses
Before planting, soil texture and bulk density were
determined in six soil profiles throughout the field. Soil
was differentiated into seven size classes according to
Kachinsky (1965) and results converted to the Food and
Agriculture Organization (FAO) texture classification. At
the end of each growing season, soil (in 0.2-m layers down
to 1 m depth) and groundwater were sampled from all
Table 1. Electrical conductivity (EC, dS m�1), volumetric water content (h, %) and pH in the upper 1 m soil layer as well as organic C,
total N (g kg�1), nitrate, available P and exchangeable K (mg kg�1) concentrations in the upper 0.2-m soil layer in 2003–2007. The
P values were derived from an ANOVA of all data, with the level of significance set at P < 0.05. Values are the means of the soil
concentrations under the three species. Within a row, means followed by different letters differ significantly according to the Post Hoc
Tukey test. Abbreviation: ns, not significant.
Parameter 2003 2004 2005 2006 2007 P value
EC 6.2 c 7.8 b 6.7 c 9.6 a 9.8 a < 0.0001
h 37 a 34 b 33 c 31 d 31 d < 0.0001
pH (in water) 8 a 8 a 8 a 8 a 8 a ns
Organic C 7.8 b 8.1 ab – – 9.3 a < 0.05
Total N 0.52 b 0.56 ab – 0.57 ab 0.63 a < 0.01
N–NO3 – – – 15.4 25.5 0.01
P2O5 3.8 b 5.6 b – 11.6 a 14.8 a < 0.0001
K2O 157 a 149 a – 151 a 181 a ns
Table 2. Concentrations (mg l�1) of nitrogen (N), phosphorus
(P) and potassium (K) in groundwater at the end of growing
season in October 2006 and 2007 (mean ± standard error).
Elements 2006 2007
N 19 ± 5 1.4 ± 0.1
P 0.4 ± 0.1 0.3 ± 0.1
K 10 ± 1 12 ± 1
NITROGEN FIXATION BY TREES IN CENTRAL ASIA 3
TREE PHYSIOLOGY ONLINE at http://www.treephys.oxfordjournals.org
by guest on October 1, 2014
http://treephys.oxfordjournals.org/D
ownloaded from
experimental plots for nutrient analyses. Organic C was
analyzed according to the method of Tyurin (1975) based
on acidification of C with chromic anhydride in sulfuric
acid and titration. Total nitrogen (N) concentration was
analyzed by the Kjeldahl method. Nitrates were analyzed
colorimetrically by reaction with disulfophenolic acid in
alkali, according to Granval and Lajoux (Durinina and
Egorov 1998). Available phosphorus (P) was measured col-
orimetrically in an ammonium carbonate extract.
Exchangeable potassium (K) concentration was determined
by flame photometry.
Samples for the analyses of soil EC and water content
were collected with an auger every 15–30 days in all plots,
0.3 m distant from a tree stem, down to 1 m depth in 0.2-m
layers. Electrical conductivity of the soil water suspen-
sion (EC1:1) was measured with an EC meter. The EC1:1
values were converted to ECe based on the relationship
ECe = 3.6EC1:1 recommended by Shirokova et al.
(2000). Soil water content (h) was measured gravimetri-
cally (103 �C) and converted to volumetric values based
on soil bulk density. Soil water contents at field capacity
and wilting point were determined by the Richards
pressure membrane method (Klute 1986) for the six soil
profiles.
Statistical analyses
All data were checked for normal distribution and normal-
ized by logarithmic transformation when necessary. Data
were subjected to analysis of variance (ANOVA), which
was performed by applying the general linear model proce-
dure with SAS Version 9.1 software (SAS Institute, Cary,
NC), to determine significance of species, month, year
and plant fraction factors, with the accepted level of signif-
icance set at P < 0.05. The Tukey Post Hoc test was used
to compare the individual treatment means.
Results
15N natural abundance
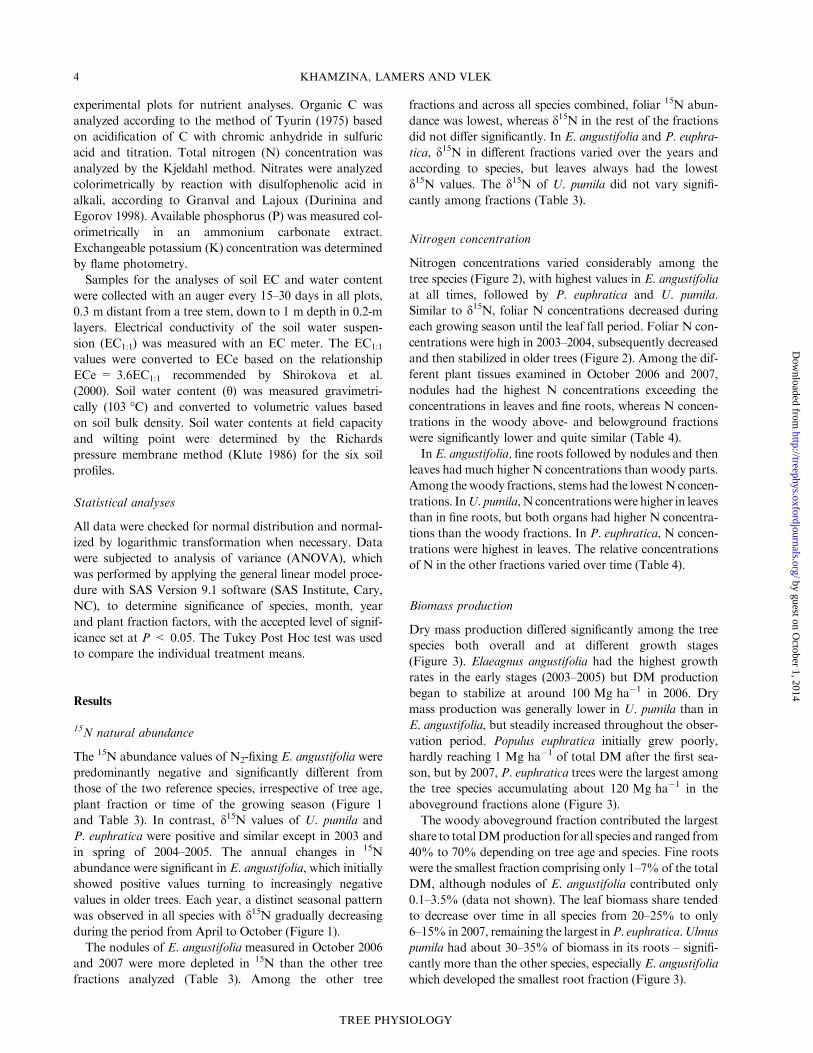
The 15N abundance values of N2-fixing E. angustifolia were
predominantly negative and significantly different from
those of the two reference species, irrespective of tree age,
plant fraction or time of the growing season (Figure 1
and Table 3). In contrast, d15N values of U. pumila and
P. euphratica were positive and similar except in 2003 and
in spring of 2004–2005. The annual changes in 15N
abundance were significant in E. angustifolia, which initially
showed positive values turning to increasingly negative
values in older trees. Each year, a distinct seasonal pattern
was observed in all species with d15N gradually decreasing
during the period from April to October (Figure 1).
The nodules of E. angustifolia measured in October 2006
and 2007 were more depleted in 15N than the other tree
fractions analyzed (Table 3). Among the other tree
fractions and across all species combined, foliar 15N abun-
dance was lowest, whereas d15N in the rest of the fractions
did not differ significantly. In E. angustifolia and P. euphra-
tica, d15N in different fractions varied over the years and
according to species, but leaves always had the lowest
d15N values. The d15N of U. pumila did not vary signifi-
cantly among fractions (Table 3).
Nitrogen concentration
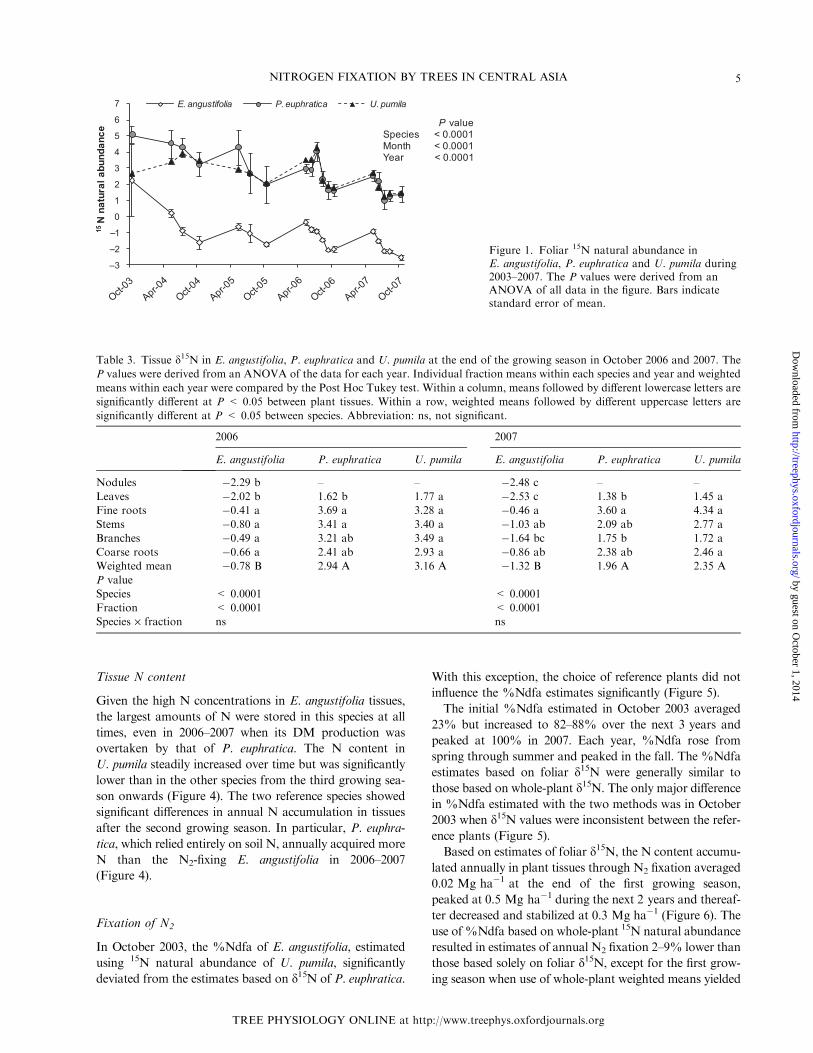
Nitrogen concentrations varied considerably among the
tree species (Figure 2), with highest values in E. angustifolia
at all times, followed by P. euphratica and U. pumila.
Similar to d15N, foliar N concentrations decreased during
each growing season until the leaf fall period. Foliar N con-
centrations were high in 2003–2004, subsequently decreased
and then stabilized in older trees (Figure 2). Among the dif-
ferent plant tissues examined in October 2006 and 2007,
nodules had the highest N concentrations exceeding the
concentrations in leaves and fine roots, whereas N concen-
trations in the woody above- and belowground fractions
were significantly lower and quite similar (Table 4).
In E. angustifolia, fine roots followed by nodules and then
leaves had much higher N concentrations than woody parts.
Among the woody fractions, stems had the lowest N concen-
trations. InU. pumila,N concentrationswere higher in leaves
than in fine roots, but both organs had higher N concentra-
tions than the woody fractions. In P. euphratica, N concen-
trations were highest in leaves. The relative concentrations
of N in the other fractions varied over time (Table 4).
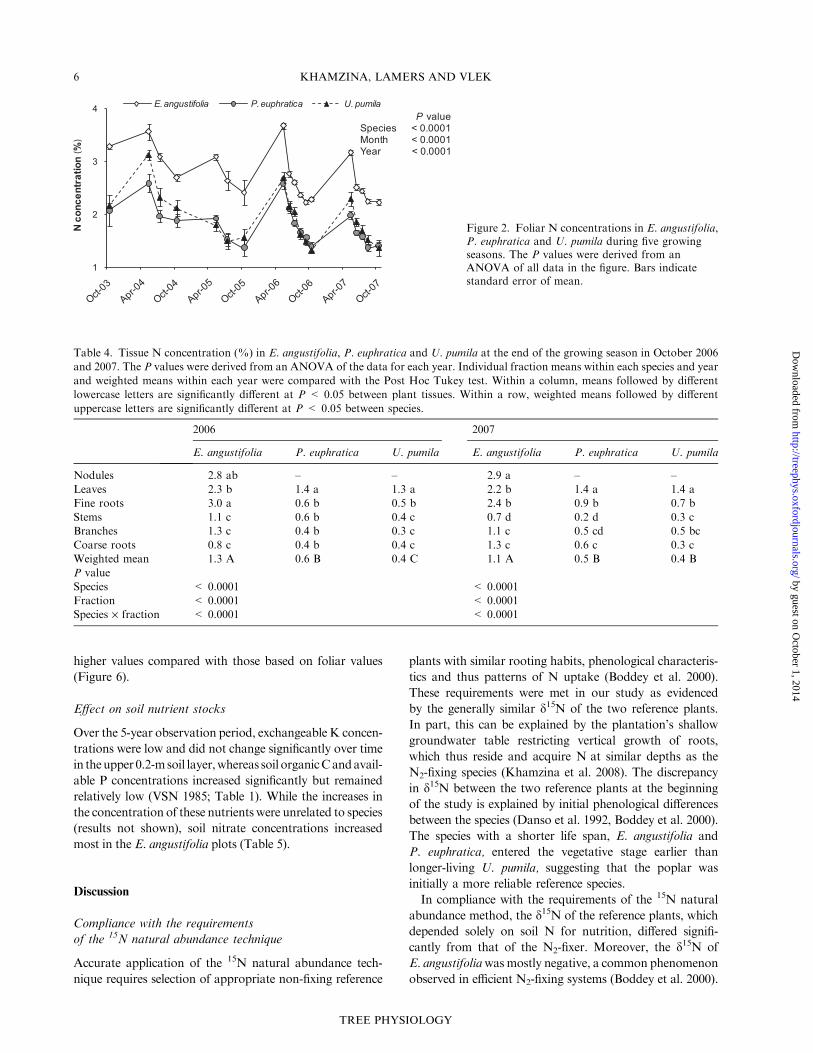
Biomass production
Dry mass production differed significantly among the tree
species both overall and at different growth stages
(Figure 3). Elaeagnus angustifolia had the highest growth
rates in the early stages (2003–2005) but DM production
began to stabilize at around 100 Mg ha�1 in 2006. Dry
mass production was generally lower in U. pumila than in
E. angustifolia, but steadily increased throughout the obser-
vation period. Populus euphratica initially grew poorly,
hardly reaching 1 Mg ha�1 of total DM after the first sea-
son, but by 2007, P. euphratica trees were the largest among
the tree species accumulating about 120 Mg ha�1 in the
aboveground fractions alone (Figure 3).
The woody aboveground fraction contributed the largest
share to totalDMproduction for all species and ranged from
40% to 70% depending on tree age and species. Fine roots
were the smallest fraction comprising only 1–7% of the total
DM, although nodules of E. angustifolia contributed only
0.1–3.5% (data not shown). The leaf biomass share tended
to decrease over time in all species from 20–25% to only
6–15% in 2007, remaining the largest inP. euphratica.Ulmus
pumila had about 30–35% of biomass in its roots – signifi-
cantly more than the other species, especially E. angustifolia
which developed the smallest root fraction (Figure 3).
4 KHAMZINA, LAMERS AND VLEK
TREE PHYSIOLOGY
by guest on October 1, 2014
http://treephys.oxfordjournals.org/D
ownloaded from
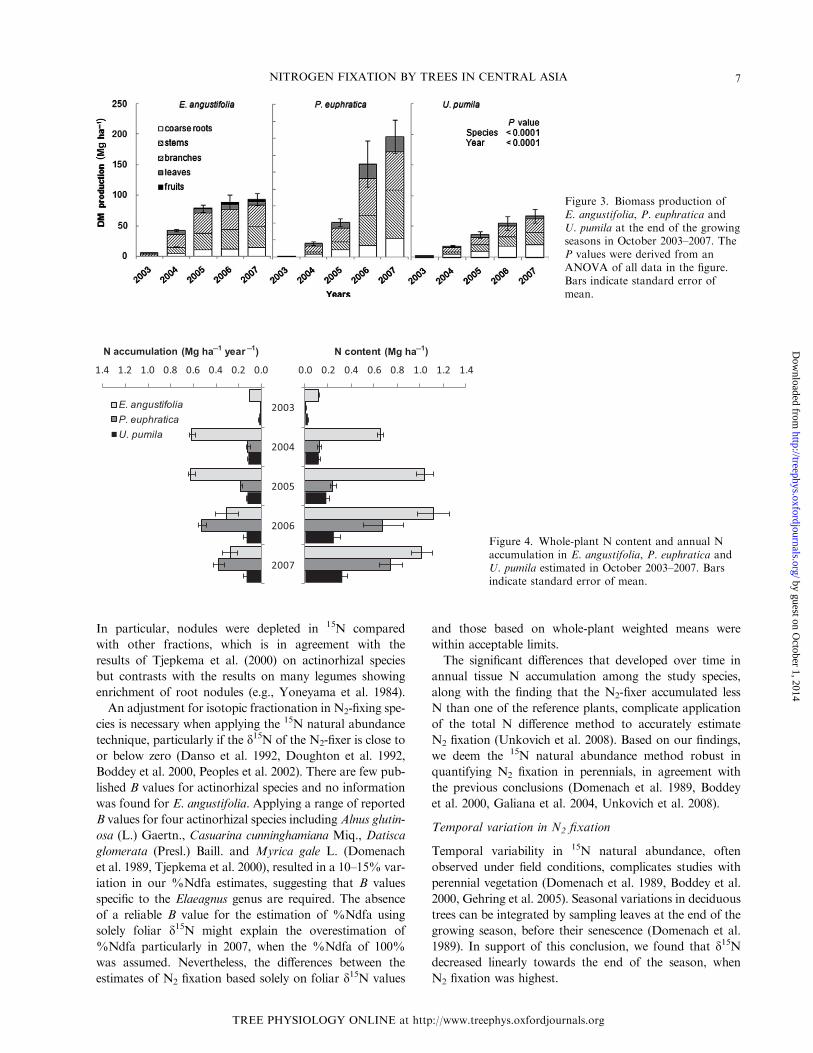
Tissue N content
Given the high N concentrations in E. angustifolia tissues,
the largest amounts of N were stored in this species at all
times, even in 2006–2007 when its DM production was
overtaken by that of P. euphratica. The N content in
U. pumila steadily increased over time but was significantly
lower than in the other species from the third growing sea-
son onwards (Figure 4). The two reference species showed
significant differences in annual N accumulation in tissues
after the second growing season. In particular, P. euphra-
tica, which relied entirely on soil N, annually acquired more
N than the N2-fixing E. angustifolia in 2006–2007
(Figure 4).
Fixation of N2
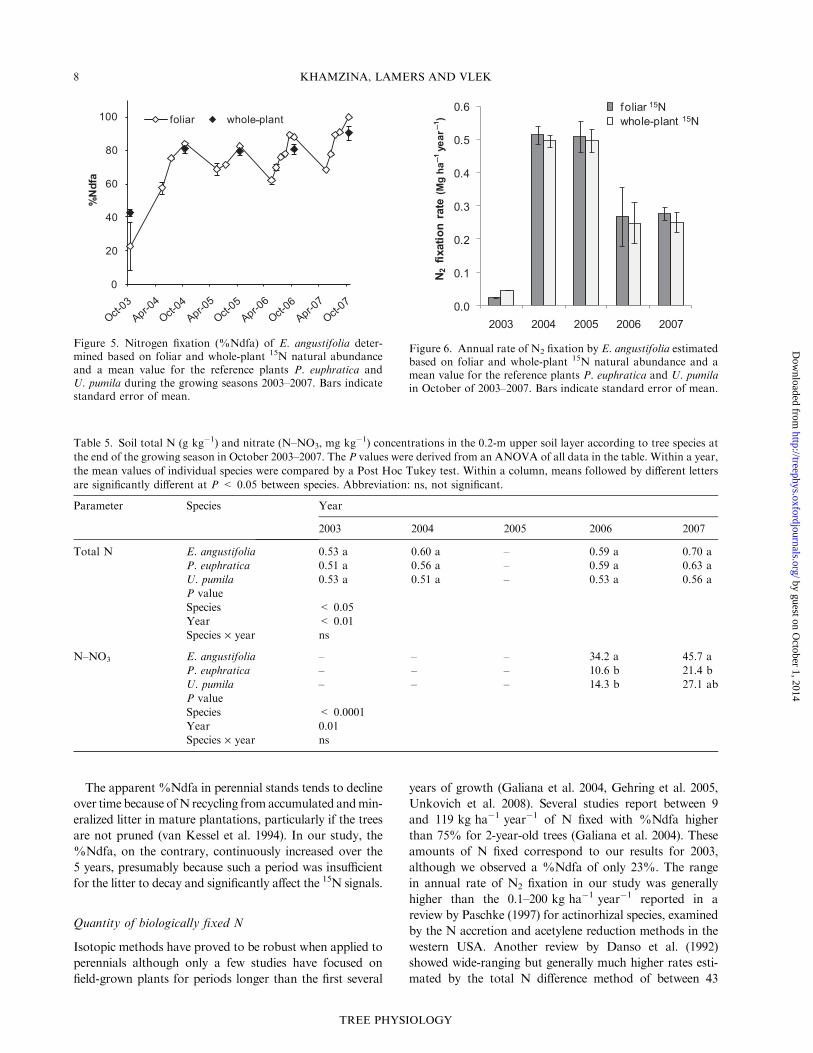
In October 2003, the %Ndfa of E. angustifolia, estimated
using 15N natural abundance of U. pumila, significantly
deviated from the estimates based on d15N of P. euphratica.
With this exception, the choice of reference plants did not
influence the %Ndfa estimates significantly (Figure 5).
The initial %Ndfa estimated in October 2003 averaged
23% but increased to 82–88% over the next 3 years and
peaked at 100% in 2007. Each year, %Ndfa rose from
spring through summer and peaked in the fall. The %Ndfa
estimates based on foliar d15N were generally similar to
those based on whole-plant d15N. The only major difference
in %Ndfa estimated with the two methods was in October
2003 when d15N values were inconsistent between the refer-
ence plants (Figure 5).
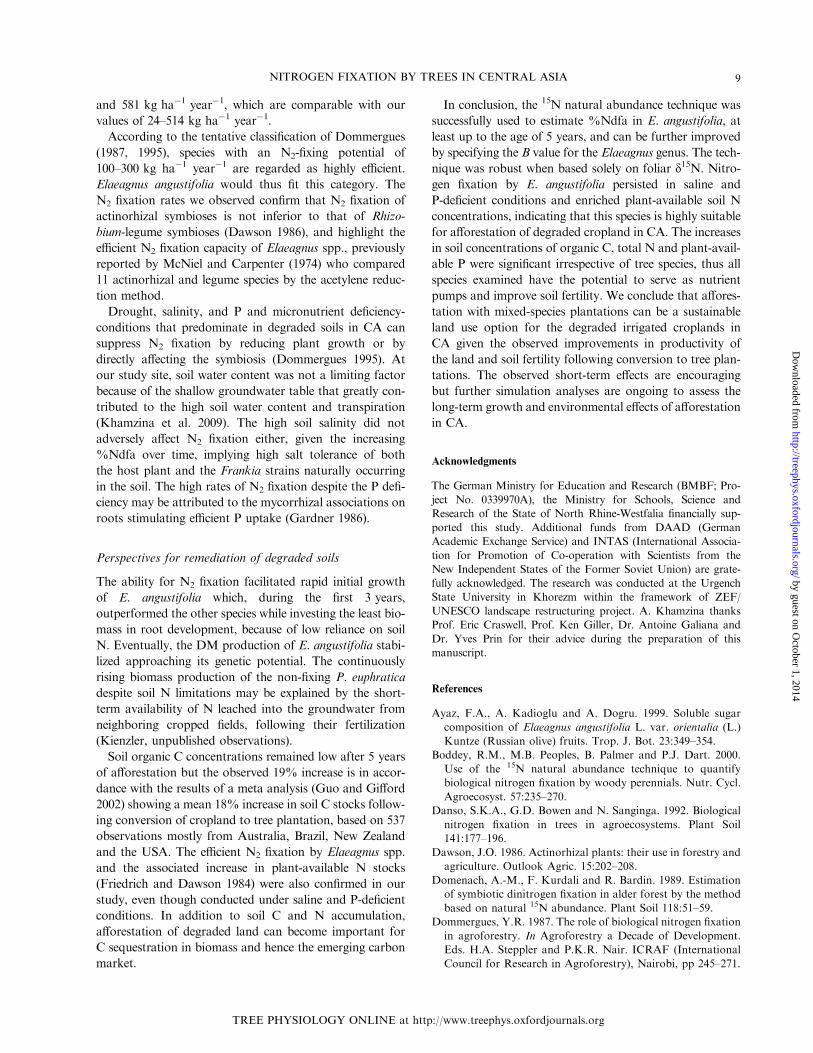
Based on estimates of foliar d15N, the N content accumu-
lated annually in plant tissues through N2 fixation averaged
0.02 Mg ha�1 at the end of the first growing season,
peaked at 0.5 Mg ha�1 during the next 2 years and thereaf-
ter decreased and stabilized at 0.3 Mg ha�1 (Figure 6). The
use of %Ndfa based on whole-plant 15N natural abundance
resulted in estimates of annual N2 fixation 2–9% lower than
those based solely on foliar d15N, except for the first grow-
ing season when use of whole-plant weighted means yielded
—
—
—
Figure 1. Foliar 15N natural abundance inE. angustifolia, P. euphratica and U. pumila during2003–2007. The P values were derived from anANOVA of all data in the figure. Bars indicatestandard error of mean.
Table 3. Tissue d15N in E. angustifolia, P. euphratica and U. pumila at the end of the growing season in October 2006 and 2007. The
P values were derived from an ANOVA of the data for each year. Individual fraction means within each species and year and weighted
means within each year were compared by the Post Hoc Tukey test. Within a column, means followed by different lowercase letters are
significantly different at P < 0.05 between plant tissues. Within a row, weighted means followed by different uppercase letters are
significantly different at P < 0.05 between species. Abbreviation: ns, not significant.
2006 2007
E. angustifolia P. euphratica U. pumila E. angustifolia P. euphratica U. pumila
Nodules �2.29 b – – �2.48 c – –
Leaves �2.02 b 1.62 b 1.77 a �2.53 c 1.38 b 1.45 a
Fine roots �0.41 a 3.69 a 3.28 a �0.46 a 3.60 a 4.34 a
Stems �0.80 a 3.41 a 3.40 a �1.03 ab 2.09 ab 2.77 a
Branches �0.49 a 3.21 ab 3.49 a �1.64 bc 1.75 b 1.72 a
Coarse roots �0.66 a 2.41 ab 2.93 a �0.86 ab 2.38 ab 2.46 a
Weighted mean �0.78 B 2.94 A 3.16 A �1.32 B 1.96 A 2.35 A
P value
Species < 0.0001 < 0.0001
Fraction < 0.0001 < 0.0001
Species · fraction ns ns
NITROGEN FIXATION BY TREES IN CENTRAL ASIA 5
TREE PHYSIOLOGY ONLINE at http://www.treephys.oxfordjournals.org
by guest on October 1, 2014
http://treephys.oxfordjournals.org/D
ownloaded from
higher values compared with those based on foliar values
(Figure 6).
Effect on soil nutrient stocks
Over the 5-year observation period, exchangeableK concen-
trations were low and did not change significantly over time
in theupper0.2-msoil layer,whereas soil organicCandavail-
able P concentrations increased significantly but remained
relatively low (VSN 1985; Table 1). While the increases in
the concentration of these nutrients were unrelated to species
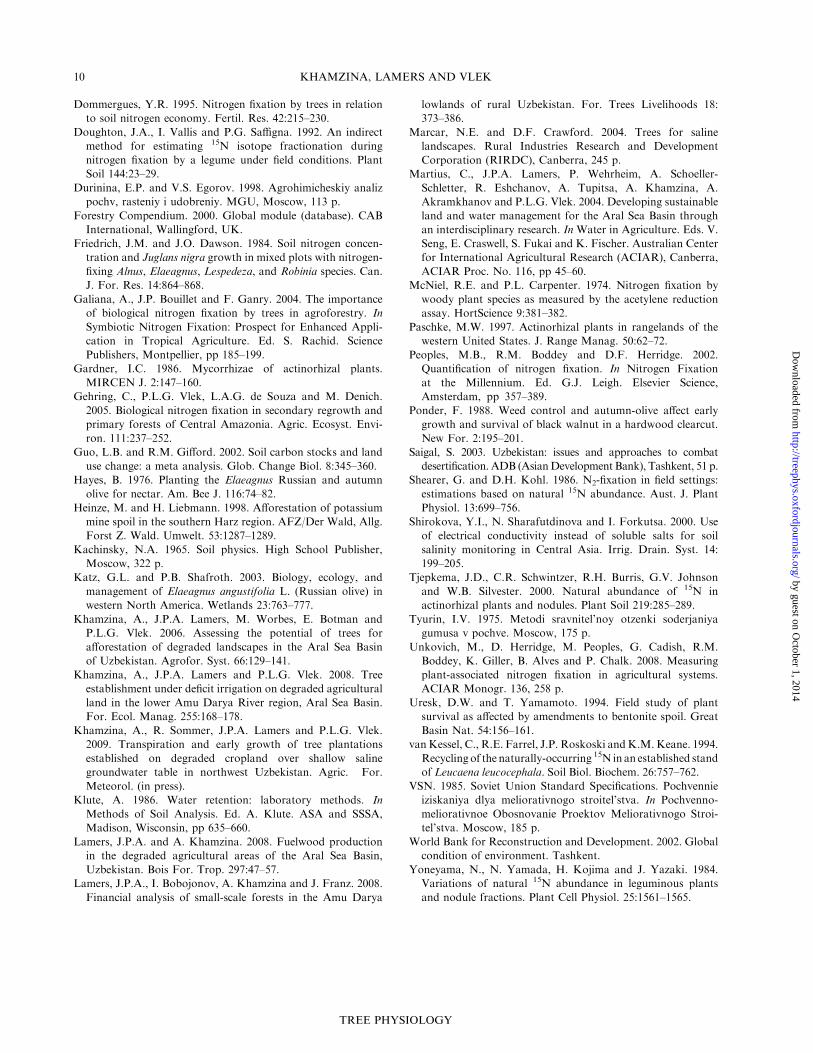
(results not shown), soil nitrate concentrations increased
most in the E. angustifolia plots (Table 5).
Discussion
Compliance with the requirements
of the 15N natural abundance technique
Accurate application of the 15N natural abundance tech-
nique requires selection of appropriate non-fixing reference
plants with similar rooting habits, phenological characteris-
tics and thus patterns of N uptake (Boddey et al. 2000).
These requirements were met in our study as evidenced
by the generally similar d15N of the two reference plants.
In part, this can be explained by the plantation’s shallow
groundwater table restricting vertical growth of roots,
which thus reside and acquire N at similar depths as the
N2-fixing species (Khamzina et al. 2008). The discrepancy
in d15N between the two reference plants at the beginning
of the study is explained by initial phenological differences
between the species (Danso et al. 1992, Boddey et al. 2000).
The species with a shorter life span, E. angustifolia and
P. euphratica, entered the vegetative stage earlier than
longer-living U. pumila, suggesting that the poplar was
initially a more reliable reference species.
In compliance with the requirements of the 15N natural
abundance method, the d15N of the reference plants, which
depended solely on soil N for nutrition, differed signifi-
cantly from that of the N2-fixer. Moreover, the d15N of
E. angustifoliawasmostly negative, a common phenomenon
observed in efficient N2-fixing systems (Boddey et al. 2000).
Figure 2. Foliar N concentrations in E. angustifolia,P. euphratica and U. pumila during five growingseasons. The P values were derived from anANOVA of all data in the figure. Bars indicatestandard error of mean.
Table 4. Tissue N concentration (%) in E. angustifolia, P. euphratica and U. pumila at the end of the growing season in October 2006
and 2007. The P values were derived from an ANOVA of the data for each year. Individual fraction means within each species and year
and weighted means within each year were compared with the Post Hoc Tukey test. Within a column, means followed by different
lowercase letters are significantly different at P < 0.05 between plant tissues. Within a row, weighted means followed by different
uppercase letters are significantly different at P < 0.05 between species.
2006 2007
E. angustifolia P. euphratica U. pumila E. angustifolia P. euphratica U. pumila
Nodules 2.8 ab – – 2.9 a – –
Leaves 2.3 b 1.4 a 1.3 a 2.2 b 1.4 a 1.4 a
Fine roots 3.0 a 0.6 b 0.5 b 2.4 b 0.9 b 0.7 b
Stems 1.1 c 0.6 b 0.4 c 0.7 d 0.2 d 0.3 c
Branches 1.3 c 0.4 b 0.3 c 1.1 c 0.5 cd 0.5 bc
Coarse roots 0.8 c 0.4 b 0.4 c 1.3 c 0.6 c 0.3 c
Weighted mean 1.3 A 0.6 B 0.4 C 1.1 A 0.5 B 0.4 B
P value
Species < 0.0001 < 0.0001
Fraction < 0.0001 < 0.0001
Species · fraction < 0.0001 < 0.0001
6 KHAMZINA, LAMERS AND VLEK
TREE PHYSIOLOGY
by guest on October 1, 2014
http://treephys.oxfordjournals.org/D
ownloaded from
In particular, nodules were depleted in 15N compared
with other fractions, which is in agreement with the
results of Tjepkema et al. (2000) on actinorhizal species
but contrasts with the results on many legumes showing
enrichment of root nodules (e.g., Yoneyama et al. 1984).
An adjustment for isotopic fractionation in N2-fixing spe-
cies is necessary when applying the 15N natural abundance
technique, particularly if the d15N of the N2-fixer is close to
or below zero (Danso et al. 1992, Doughton et al. 1992,
Boddey et al. 2000, Peoples et al. 2002). There are few pub-
lished B values for actinorhizal species and no information
was found for E. angustifolia. Applying a range of reported
B values for four actinorhizal species including Alnus glutin-
osa (L.) Gaertn., Casuarina cunninghamiana Miq., Datisca
glomerata (Presl.) Baill. and Myrica gale L. (Domenach
et al. 1989, Tjepkema et al. 2000), resulted in a 10–15% var-
iation in our %Ndfa estimates, suggesting that B values
specific to the Elaeagnus genus are required. The absence
of a reliable B value for the estimation of %Ndfa using
solely foliar d15N might explain the overestimation of
%Ndfa particularly in 2007, when the %Ndfa of 100%
was assumed. Nevertheless, the differences between the
estimates of N2 fixation based solely on foliar d15N values
and those based on whole-plant weighted means were
within acceptable limits.
The significant differences that developed over time in
annual tissue N accumulation among the study species,
along with the finding that the N2-fixer accumulated less
N than one of the reference plants, complicate application
of the total N difference method to accurately estimate
N2 fixation (Unkovich et al. 2008). Based on our findings,
we deem the 15N natural abundance method robust in
quantifying N2 fixation in perennials, in agreement with
the previous conclusions (Domenach et al. 1989, Boddey
et al. 2000, Galiana et al. 2004, Unkovich et al. 2008).
Temporal variation in N2 fixation
Temporal variability in 15N natural abundance, often
observed under field conditions, complicates studies with
perennial vegetation (Domenach et al. 1989, Boddey et al.
2000, Gehring et al. 2005). Seasonal variations in deciduous
trees can be integrated by sampling leaves at the end of the
growing season, before their senescence (Domenach et al.
1989). In support of this conclusion, we found that d15Ndecreased linearly towards the end of the season, when
N2 fixation was highest.
Figure 3. Biomass production ofE. angustifolia, P. euphratica andU. pumila at the end of the growingseasons in October 2003–2007. TheP values were derived from anANOVA of all data in the figure.Bars indicate standard error ofmean.
— —(Mg ha ) —(Mg ha )accumulation
Figure 4. Whole-plant N content and annual Naccumulation in E. angustifolia, P. euphratica andU. pumila estimated in October 2003–2007. Barsindicate standard error of mean.
NITROGEN FIXATION BY TREES IN CENTRAL ASIA 7
TREE PHYSIOLOGY ONLINE at http://www.treephys.oxfordjournals.org
by guest on October 1, 2014
http://treephys.oxfordjournals.org/D
ownloaded from
The apparent %Ndfa in perennial stands tends to decline
over time because ofN recycling fromaccumulated andmin-
eralized litter in mature plantations, particularly if the trees
are not pruned (van Kessel et al. 1994). In our study, the
%Ndfa, on the contrary, continuously increased over the
5 years, presumably because such a period was insufficient
for the litter to decay and significantly affect the 15N signals.
Quantity of biologically fixed N
Isotopic methods have proved to be robust when applied to
perennials although only a few studies have focused on
field-grown plants for periods longer than the first several
years of growth (Galiana et al. 2004, Gehring et al. 2005,
Unkovich et al. 2008). Several studies report between 9
and 119 kg ha�1 year�1 of N fixed with %Ndfa higher
than 75% for 2-year-old trees (Galiana et al. 2004). These
amounts of N fixed correspond to our results for 2003,
although we observed a %Ndfa of only 23%. The range
in annual rate of N2 fixation in our study was generally
higher than the 0.1–200 kg ha�1 year�1 reported in a
review by Paschke (1997) for actinorhizal species, examined
by the N accretion and acetylene reduction methods in the
western USA. Another review by Danso et al. (1992)
showed wide-ranging but generally much higher rates esti-
mated by the total N difference method of between 43
Table 5. Soil total N (g kg�1) and nitrate (N–NO3, mg kg�1) concentrations in the 0.2-m upper soil layer according to tree species at
the end of the growing season in October 2003–2007. The P values were derived from an ANOVA of all data in the table. Within a year,
the mean values of individual species were compared by a Post Hoc Tukey test. Within a column, means followed by different letters
are significantly different at P < 0.05 between species. Abbreviation: ns, not significant.
Parameter Species Year
2003 2004 2005 2006 2007
Total N E. angustifolia 0.53 a 0.60 a – 0.59 a 0.70 a
P. euphratica 0.51 a 0.56 a – 0.59 a 0.63 a
U. pumila 0.53 a 0.51 a – 0.53 a 0.56 a
P value
Species < 0.05
Year < 0.01
Species · year ns
N–NO3 E. angustifolia – – – 34.2 a 45.7 a
P. euphratica – – – 10.6 b 21.4 b
U. pumila – – – 14.3 b 27.1 ab
P value
Species < 0.0001
Year 0.01
Species · year ns
Figure 5. Nitrogen fixation (%Ndfa) of E. angustifolia deter-mined based on foliar and whole-plant 15N natural abundanceand a mean value for the reference plants P. euphratica andU. pumila during the growing seasons 2003–2007. Bars indicatestandard error of mean.
——
(Mg
ha)
Figure 6. Annual rate of N2 fixation by E. angustifolia estimatedbased on foliar and whole-plant 15N natural abundance and amean value for the reference plants P. euphratica and U. pumilain October of 2003–2007. Bars indicate standard error of mean.
8 KHAMZINA, LAMERS AND VLEK
TREE PHYSIOLOGY
by guest on October 1, 2014
http://treephys.oxfordjournals.org/D
ownloaded from
and 581 kg ha�1 year�1, which are comparable with our
values of 24–514 kg ha�1 year�1.
According to the tentative classification of Dommergues
(1987, 1995), species with an N2-fixing potential of
100–300 kg ha�1 year�1 are regarded as highly efficient.
Elaeagnus angustifolia would thus fit this category. The
N2 fixation rates we observed confirm that N2 fixation of
actinorhizal symbioses is not inferior to that of Rhizo-
bium-legume symbioses (Dawson 1986), and highlight the
efficient N2 fixation capacity of Elaeagnus spp., previously
reported by McNiel and Carpenter (1974) who compared
11 actinorhizal and legume species by the acetylene reduc-
tion method.
Drought, salinity, and P and micronutrient deficiency-
conditions that predominate in degraded soils in CA can
suppress N2 fixation by reducing plant growth or by
directly affecting the symbiosis (Dommergues 1995). At
our study site, soil water content was not a limiting factor
because of the shallow groundwater table that greatly con-
tributed to the high soil water content and transpiration
(Khamzina et al. 2009). The high soil salinity did not
adversely affect N2 fixation either, given the increasing
%Ndfa over time, implying high salt tolerance of both
the host plant and the Frankia strains naturally occurring
in the soil. The high rates of N2 fixation despite the P defi-
ciency may be attributed to the mycorrhizal associations on
roots stimulating efficient P uptake (Gardner 1986).
Perspectives for remediation of degraded soils
The ability for N2 fixation facilitated rapid initial growth
of E. angustifolia which, during the first 3 years,
outperformed the other species while investing the least bio-
mass in root development, because of low reliance on soil
N. Eventually, the DM production of E. angustifolia stabi-
lized approaching its genetic potential. The continuously
rising biomass production of the non-fixing P. euphratica
despite soil N limitations may be explained by the short-
term availability of N leached into the groundwater from
neighboring cropped fields, following their fertilization
(Kienzler, unpublished observations).
Soil organic C concentrations remained low after 5 years
of afforestation but the observed 19% increase is in accor-
dance with the results of a meta analysis (Guo and Gifford
2002) showing a mean 18% increase in soil C stocks follow-
ing conversion of cropland to tree plantation, based on 537
observations mostly from Australia, Brazil, New Zealand
and the USA. The efficient N2 fixation by Elaeagnus spp.
and the associated increase in plant-available N stocks
(Friedrich and Dawson 1984) were also confirmed in our
study, even though conducted under saline and P-deficient
conditions. In addition to soil C and N accumulation,
afforestation of degraded land can become important for
C sequestration in biomass and hence the emerging carbon
market.
In conclusion, the 15N natural abundance technique was
successfully used to estimate %Ndfa in E. angustifolia, at
least up to the age of 5 years, and can be further improved
by specifying the B value for the Elaeagnus genus. The tech-
nique was robust when based solely on foliar d15N. Nitro-
gen fixation by E. angustifolia persisted in saline and
P-deficient conditions and enriched plant-available soil N
concentrations, indicating that this species is highly suitable
for afforestation of degraded cropland in CA. The increases
in soil concentrations of organic C, total N and plant-avail-
able P were significant irrespective of tree species, thus all
species examined have the potential to serve as nutrient
pumps and improve soil fertility. We conclude that affores-
tation with mixed-species plantations can be a sustainable
land use option for the degraded irrigated croplands in
CA given the observed improvements in productivity of
the land and soil fertility following conversion to tree plan-
tations. The observed short-term effects are encouraging
but further simulation analyses are ongoing to assess the
long-term growth and environmental effects of afforestation
in CA.
Acknowledgments
The German Ministry for Education and Research (BMBF; Pro-
ject No. 0339970A), the Ministry for Schools, Science and
Research of the State of North Rhine-Westfalia financially sup-
ported this study. Additional funds from DAAD (German
Academic Exchange Service) and INTAS (International Associa-
tion for Promotion of Co-operation with Scientists from the
New Independent States of the Former Soviet Union) are grate-
fully acknowledged. The research was conducted at the Urgench
State University in Khorezm within the framework of ZEF/
UNESCO landscape restructuring project. A. Khamzina thanks
Prof. Eric Craswell, Prof. Ken Giller, Dr. Antoine Galiana and
Dr. Yves Prin for their advice during the preparation of this
manuscript.
References
Ayaz, F.A., A. Kadioglu and A. Dogru. 1999. Soluble sugar
composition of Elaeagnus angustifolia L. var. orientalia (L.)
Kuntze (Russian olive) fruits. Trop. J. Bot. 23:349–354.
Boddey, R.M., M.B. Peoples, B. Palmer and P.J. Dart. 2000.
Use of the 15N natural abundance technique to quantify
biological nitrogen fixation by woody perennials. Nutr. Cycl.
Agroecosyst. 57:235–270.
Danso, S.K.A., G.D. Bowen and N. Sanginga. 1992. Biological
nitrogen fixation in trees in agroecosystems. Plant Soil
141:177–196.
Dawson, J.O. 1986. Actinorhizal plants: their use in forestry and
agriculture. Outlook Agric. 15:202–208.
Domenach, A.-M., F. Kurdali and R. Bardin. 1989. Estimation
of symbiotic dinitrogen fixation in alder forest by the method
based on natural 15N abundance. Plant Soil 118:51–59.
Dommergues, Y.R. 1987. The role of biological nitrogen fixation
in agroforestry. In Agroforestry a Decade of Development.
Eds. H.A. Steppler and P.K.R. Nair. ICRAF (International
Council for Research in Agroforestry), Nairobi, pp 245–271.
NITROGEN FIXATION BY TREES IN CENTRAL ASIA 9
TREE PHYSIOLOGY ONLINE at http://www.treephys.oxfordjournals.org
by guest on October 1, 2014
http://treephys.oxfordjournals.org/D
ownloaded from
Dommergues, Y.R. 1995. Nitrogen fixation by trees in relation
to soil nitrogen economy. Fertil. Res. 42:215–230.
Doughton, J.A., I. Vallis and P.G. Saffigna. 1992. An indirect
method for estimating 15N isotope fractionation during
nitrogen fixation by a legume under field conditions. Plant
Soil 144:23–29.
Durinina, E.P. and V.S. Egorov. 1998. Agrohimicheskiy analiz
pochv, rasteniy i udobreniy. MGU, Moscow, 113 p.
Forestry Compendium. 2000. Global module (database). CAB
International, Wallingford, UK.
Friedrich, J.M. and J.O. Dawson. 1984. Soil nitrogen concen-
tration and Juglans nigra growth in mixed plots with nitrogen-
fixing Alnus, Elaeagnus, Lespedeza, and Robinia species. Can.
J. For. Res. 14:864–868.
Galiana, A., J.P. Bouillet and F. Ganry. 2004. The importance
of biological nitrogen fixation by trees in agroforestry. In
Symbiotic Nitrogen Fixation: Prospect for Enhanced Appli-
cation in Tropical Agriculture. Ed. S. Rachid. Science
Publishers, Montpellier, pp 185–199.
Gardner, I.C. 1986. Mycorrhizae of actinorhizal plants.
MIRCEN J. 2:147–160.
Gehring, C., P.L.G. Vlek, L.A.G. de Souza and M. Denich.
2005. Biological nitrogen fixation in secondary regrowth and
primary forests of Central Amazonia. Agric. Ecosyst. Envi-
ron. 111:237–252.
Guo, L.B. and R.M. Gifford. 2002. Soil carbon stocks and land
use change: a meta analysis. Glob. Change Biol. 8:345–360.
Hayes, B. 1976. Planting the Elaeagnus Russian and autumn
olive for nectar. Am. Bee J. 116:74–82.
Heinze, M. and H. Liebmann. 1998. Afforestation of potassium
mine spoil in the southern Harz region. AFZ/Der Wald, Allg.
Forst Z. Wald. Umwelt. 53:1287–1289.
Kachinsky, N.A. 1965. Soil physics. High School Publisher,
Moscow, 322 p.
Katz, G.L. and P.B. Shafroth. 2003. Biology, ecology, and
management of Elaeagnus angustifolia L. (Russian olive) in
western North America. Wetlands 23:763–777.
Khamzina, A., J.P.A. Lamers, M. Worbes, E. Botman and
P.L.G. Vlek. 2006. Assessing the potential of trees for
afforestation of degraded landscapes in the Aral Sea Basin
of Uzbekistan. Agrofor. Syst. 66:129–141.
Khamzina, A., J.P.A. Lamers and P.L.G. Vlek. 2008. Tree
establishment under deficit irrigation on degraded agricultural
land in the lower Amu Darya River region, Aral Sea Basin.
For. Ecol. Manag. 255:168–178.
Khamzina, A., R. Sommer, J.P.A. Lamers and P.L.G. Vlek.
2009. Transpiration and early growth of tree plantations
established on degraded cropland over shallow saline
groundwater table in northwest Uzbekistan. Agric. For.
Meteorol. (in press).
Klute, A. 1986. Water retention: laboratory methods. In
Methods of Soil Analysis. Ed. A. Klute. ASA and SSSA,
Madison, Wisconsin, pp 635–660.
Lamers, J.P.A. and A. Khamzina. 2008. Fuelwood production
in the degraded agricultural areas of the Aral Sea Basin,
Uzbekistan. Bois For. Trop. 297:47–57.
Lamers, J.P.A., I. Bobojonov, A. Khamzina and J. Franz. 2008.
Financial analysis of small-scale forests in the Amu Darya
lowlands of rural Uzbekistan. For. Trees Livelihoods 18:
373–386.
Marcar, N.E. and D.F. Crawford. 2004. Trees for saline
landscapes. Rural Industries Research and Development
Corporation (RIRDC), Canberra, 245 p.
Martius, C., J.P.A. Lamers, P. Wehrheim, A. Schoeller-
Schletter, R. Eshchanov, A. Tupitsa, A. Khamzina, A.
Akramkhanov and P.L.G. Vlek. 2004. Developing sustainable
land and water management for the Aral Sea Basin through
an interdisciplinary research. In Water in Agriculture. Eds. V.
Seng, E. Craswell, S. Fukai and K. Fischer. Australian Center
for International Agricultural Research (ACIAR), Canberra,
ACIAR Proc. No. 116, pp 45–60.
McNiel, R.E. and P.L. Carpenter. 1974. Nitrogen fixation by
woody plant species as measured by the acetylene reduction
assay. HortScience 9:381–382.
Paschke, M.W. 1997. Actinorhizal plants in rangelands of the
western United States. J. Range Manag. 50:62–72.
Peoples, M.B., R.M. Boddey and D.F. Herridge. 2002.
Quantification of nitrogen fixation. In Nitrogen Fixation
at the Millennium. Ed. G.J. Leigh. Elsevier Science,
Amsterdam, pp 357–389.
Ponder, F. 1988. Weed control and autumn-olive affect early
growth and survival of black walnut in a hardwood clearcut.
New For. 2:195–201.
Saigal, S. 2003. Uzbekistan: issues and approaches to combat
desertification. ADB (AsianDevelopment Bank), Tashkent, 51 p.
Shearer, G. and D.H. Kohl. 1986. N2-fixation in field settings:
estimations based on natural 15N abundance. Aust. J. Plant
Physiol. 13:699–756.
Shirokova, Y.I., N. Sharafutdinova and I. Forkutsa. 2000. Use
of electrical conductivity instead of soluble salts for soil
salinity monitoring in Central Asia. Irrig. Drain. Syst. 14:
199–205.
Tjepkema, J.D., C.R. Schwintzer, R.H. Burris, G.V. Johnson
and W.B. Silvester. 2000. Natural abundance of 15N in
actinorhizal plants and nodules. Plant Soil 219:285–289.
Tyurin, I.V. 1975. Metodi sravnitel’noy otzenki soderjaniya
gumusa v pochve. Moscow, 175 p.
Unkovich, M., D. Herridge, M. Peoples, G. Cadish, R.M.
Boddey, K. Giller, B. Alves and P. Chalk. 2008. Measuring
plant-associated nitrogen fixation in agricultural systems.
ACIAR Monogr. 136, 258 p.
Uresk, D.W. and T. Yamamoto. 1994. Field study of plant
survival as affected by amendments to bentonite spoil. Great
Basin Nat. 54:156–161.
vanKessel, C., R.E. Farrel, J.P. Roskoski andK.M.Keane. 1994.
Recycling of the naturally-occurring 15N in an established stand
of Leucaena leucocephala. Soil Biol. Biochem. 26:757–762.
VSN. 1985. Soviet Union Standard Specifications. Pochvennie
iziskaniya dlya meliorativnogo stroitel’stva. In Pochvenno-
meliorativnoe Obosnovanie Proektov Meliorativnogo Stroi-
tel’stva. Moscow, 185 p.
World Bank for Reconstruction and Development. 2002. Global
condition of environment. Tashkent.
Yoneyama, N., N. Yamada, H. Kojima and J. Yazaki. 1984.
Variations of natural 15N abundance in leguminous plants
and nodule fractions. Plant Cell Physiol. 25:1561–1565.
10 KHAMZINA, LAMERS AND VLEK
TREE PHYSIOLOGY
by guest on October 1, 2014
http://treephys.oxfordjournals.org/D
ownloaded from