Embed Size (px)
Citation preview

Nitrogen Fertility Management in Nitrogen Fertility Management in Organic ProductionOrganic Production
Richard Smith, Farm AdvisorRichard Smith, Farm AdvisorMonterey, Santa Cruz and San Benito CountiesMonterey, Santa Cruz and San Benito Counties

Characteristics of the Organic Characteristics of the Organic Production SystemProduction System
• Nearly all N is provided by organic sources• Mineralization needs to occur to produce
nitrate and ammonium for plant growth• There is a need to build up levels of soil
organic matter which is used as source of N for crop growth
• Cover crops, crop residues and fertilizers also contribute N for crop growth

Plants Microbes
CEC
Death Death
Nitrogen CycleNitrogen Cycle Crop residue, Compost, FertilizersSoil Organic MatterSoil Organic Matter
Most soil N is in this formMost soil N is in this form(1000 (1000 –– 3000 lbs N/A)3000 lbs N/A)
Mineralization*Mineralization*
Nitrification
NH4+
NO3-
* Mineralization is a key step in making N available for plant g* Mineralization is a key step in making N available for plant growth rowth It is dependent upon adequate soil temperatures (i.e. > 50 F)It is dependent upon adequate soil temperatures (i.e. > 50 F)
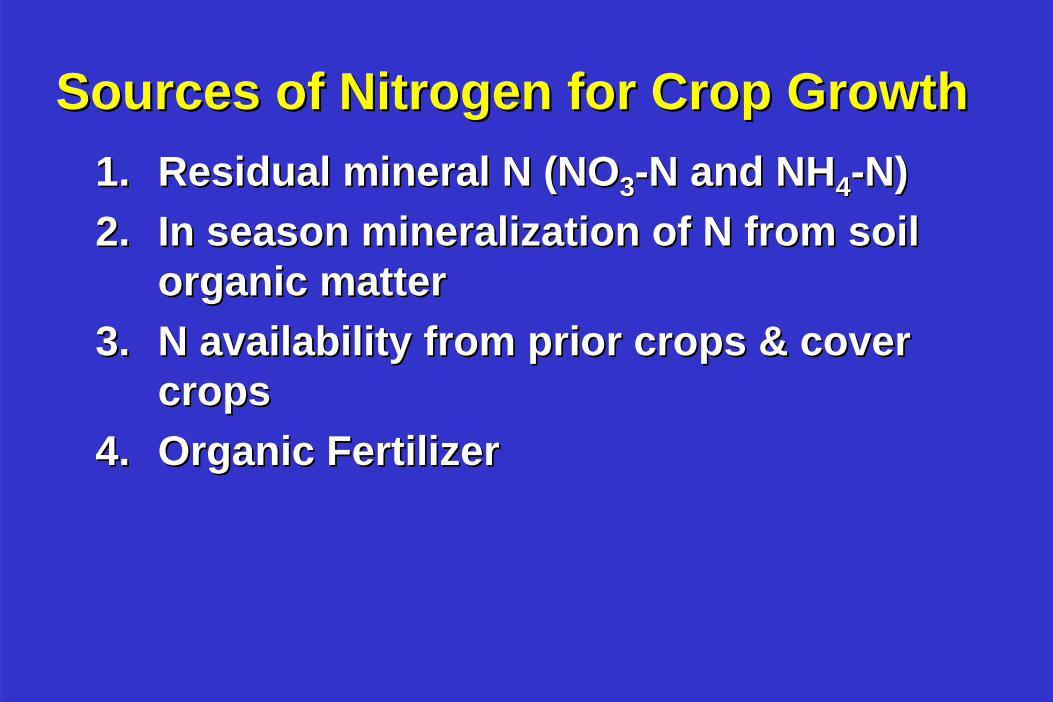
Sources of Nitrogen for Crop GrowthSources of Nitrogen for Crop Growth1.1. Residual mineral N (NOResidual mineral N (NO33 --N and NHN and NH44 --N)N)2.2. In season mineralization of N from soil In season mineralization of N from soil
organic matter organic matter 3.3. N availability from prior crops & cover N availability from prior crops & cover
crops crops 4.4. Organic FertilizerOrganic Fertilizer
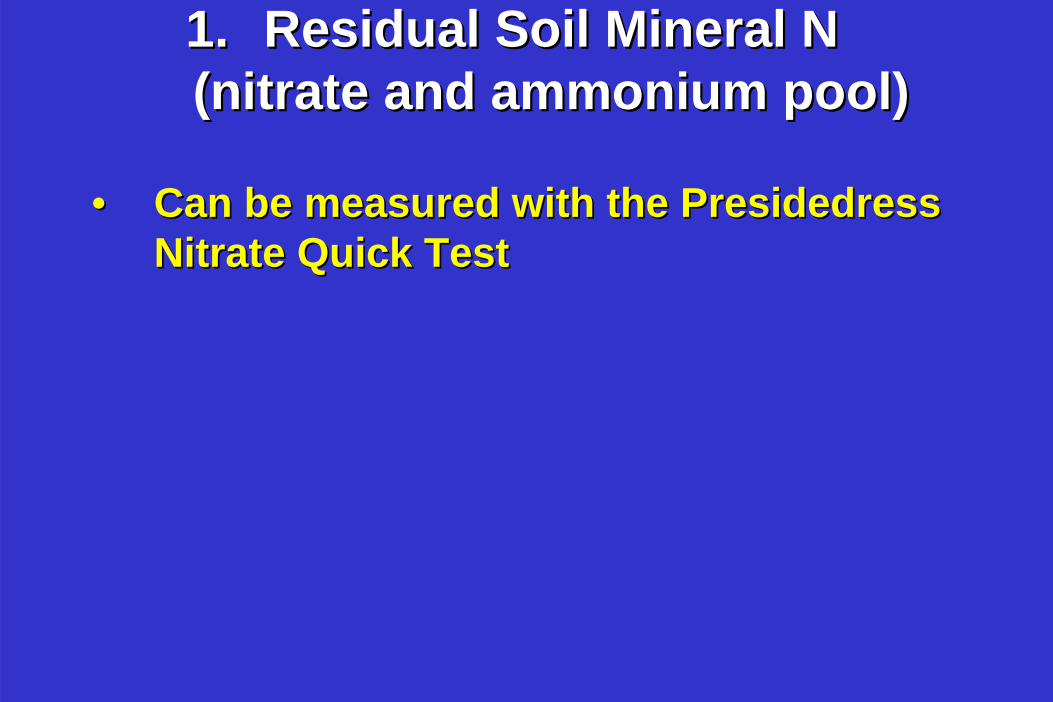
1.1. Residual Soil Mineral N Residual Soil Mineral N (nitrate and ammonium pool)(nitrate and ammonium pool)
•• Can be measured with the Presidedress Can be measured with the Presidedress Nitrate Quick TestNitrate Quick Test

Presidedress Nitrate Quick TestPresidedress Nitrate Quick Test

Residual Soil Mineral N Residual Soil Mineral N •• Nitrate is typically low in organic Nitrate is typically low in organic
production systemsproduction systems• Organic systems differ from
conventional systems in that N management cannot typically be based on measuring a large pool of mineral N in the soil
• This can vary however, depending upon fertilization practices

0
10
20
30
40
50
60
70
80
May May Jun Jun Jul Jul Jul Aug
Conventional
Organic
Comparison of Organic and Conventional OnionsComparison of Organic and Conventional OnionsHollister, 1996Hollister, 1996
Soi
l ppm
NO
3-N

Soil Nitrate in Organic VegetableSoil Nitrate in Organic Vegetable Production 2001 Production 2001 -- 20032003
0
5
10
15
20
25
Summer-
Yr1Fall
-Yr1
Wint
er-Yr1
Spring
-Yr1
Summer-
Yr2Fall
-Yr2
Wint
er-Yr2
Spring
-Yr2
Summer-
Yr3Fall
-Yr3
Wint
er-Yr3
NO
3-N
µg
g-1 d
ry s
oil
0-15 cm
15-30 cm
Jackson, 2005Jackson, 2005

2. In season mineralization of N from 2. In season mineralization of N from soil organic mattersoil organic matter
•• 2 to 5 % of soil organic matter 2 to 5 % of soil organic matter decomposes annually decomposes annually
•• As the organic matter decomposes As the organic matter decomposes NH4NH4++ and nitrate NO3and nitrate NO3-- are releasedare released

In season mineralization of N from In season mineralization of N from soil organic mattersoil organic matter
•• A rough estimate of mineralization from soil A rough estimate of mineralization from soil organic matter can be made based on the organic matter can be made based on the amount of organic N present in the soil and amount of organic N present in the soil and the percent of that N likely to mineralize over the percent of that N likely to mineralize over a given period of time. a given period of time.

In season mineralization of N from In season mineralization of N from soil organic mattersoil organic matter
For a soil with 1% organic matter:For a soil with 1% organic matter:•• 2,800 lb organic N / acre x 0.02 (percent of 2,800 lb organic N / acre x 0.02 (percent of
organic N that mineralizes in 60 days) = organic N that mineralizes in 60 days) =
56 lb plant available N / acre 56 lb plant available N / acre over two monthsover two months

Nitrogen Release Characteristics Nitrogen Release Characteristics of N Soil Organic Matterof N Soil Organic Matter
Relative Rate of N Mineralization
Ava
ilabl
e N
itrat
e (p
pm)
5
10
15
20
Soil organic matter mineralization

3. N availability from cover crops3. N availability from cover crops
•• Cover crops typically take up or fix between 100Cover crops typically take up or fix between 100-- 200 lbs N/ acre 200 lbs N/ acre
•• Cover crops are often tilled into the soil when the Cover crops are often tilled into the soil when the C:N ratio <20 to achieve a net release of N to the C:N ratio <20 to achieve a net release of N to the soil to feed subsequent vegetable cropssoil to feed subsequent vegetable crops
•• Cover crops with a low N content such as mature Cover crops with a low N content such as mature cereals (i.e. C:N ratio > 20) temporarily tie up cereals (i.e. C:N ratio > 20) temporarily tie up nitrogen* nitrogen*
* soil microbes utilize available soil N to * soil microbes utilize available soil N to break down the cover crop residuebreak down the cover crop residue
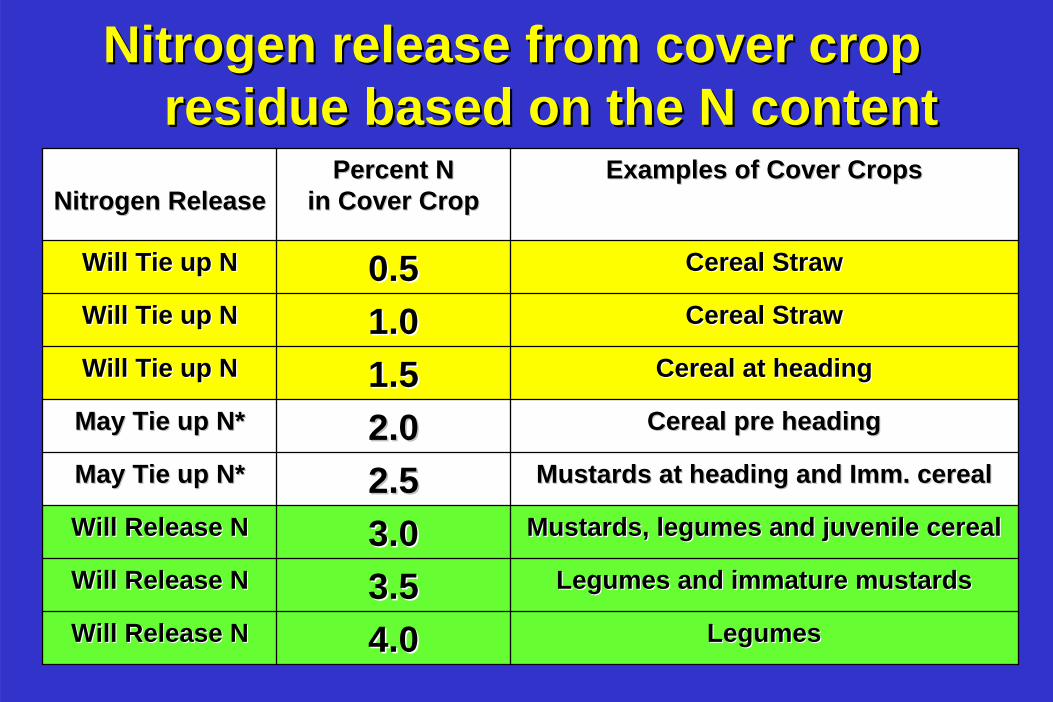
Nitrogen release from cover crop Nitrogen release from cover crop residue based on the N contentresidue based on the N content
Nitrogen ReleaseNitrogen ReleasePercent N Percent N
in Cover Cropin Cover CropExamples of Cover CropsExamples of Cover Crops
Will Tie up NWill Tie up N 0.50.5 Cereal StrawCereal Straw
Will Tie up NWill Tie up N 1.01.0 Cereal StrawCereal Straw
Will Tie up NWill Tie up N 1.51.5 Cereal at headingCereal at heading
May Tie up N*May Tie up N* 2.02.0 Cereal pre headingCereal pre heading
May Tie up N*May Tie up N* 2.52.5 Mustards at heading and Mustards at heading and ImmImm. cereal . cereal
Will Release NWill Release N 3.03.0 Mustards, legumes and juvenile cerealMustards, legumes and juvenile cereal
Will Release NWill Release N 3.53.5 Legumes and immature mustardsLegumes and immature mustards
Will Release NWill Release N 4.04.0 LegumesLegumes

Cover CropCover CropProteinsProteins
MicrobesMicrobes
AvailableAvailableMineralMineral
NitrogenNitrogen
MicrobesMicrobes
Depends uponDepends uponC:N; lignin and C:N; lignin and PolyphenolsPolyphenols
Typically <10Typically <10--30% of cover crop 30% of cover crop N is taken up by the first subsequent N is taken up by the first subsequent
Crop*Crop*
* A good deal of cover crop N remains in the system and can* A good deal of cover crop N remains in the system and cancan be taken up in later years (i.e. 73%)can be taken up in later years (i.e. 73%)

N availability from cover cropsN availability from cover crops
•• The rate of mineralization of available N from The rate of mineralization of available N from a low C:N (<20) cover crop increases over a a low C:N (<20) cover crop increases over a threethree-- to sixto six--week period following week period following incorporationincorporation
•• Soil N levels return to preSoil N levels return to pre--incorporation incorporation levels by week 6levels by week 6--1010

N Release Pattern from Cover CropsN Release Pattern from Cover Crops
0
2
4
6
8
10
12
14
16
18
0 11 25 39 53 67Days After Incorporation of Cover Crop
Tota
l Min
eral
Nitr
ogen
(ppm
)
Legume MixMustardOats
Smith & Brennan, 2003Smith & Brennan, 2003

Nitrogen Release Characteristics Nitrogen Release Characteristics of N From Cover Cropof N From Cover Crop
Relative Rate of N Mineralization
Ava
ilabl
e N
itrat
e (p
pm)
Cover Crop Mineralization
Cover Crop Incorporation
5
10
15
20
Soil organic matter mineralization

4. N Availability from 4. N Availability from Organic FertilizersOrganic Fertilizers
MaterialMaterial NitrogenNitrogen MaterialMaterial NitrogenNitrogenChilean nitrateChilean nitrate 1616 Soybean mealSoybean meal 77Blood mealBlood meal 1212 Processed liquid Processed liquid
fishfish44
Feather mealFeather meal 1212 Alfalfa mealAlfalfa meal 44Seabird and bat Seabird and bat guanoguano
99--1212 Pelleted chicken Pelleted chicken manuremanure
22--44
Fish meal or powderFish meal or powder 1010--1111 Bone MealBone Meal 22Meat and bone mealMeat and bone meal 88 KelpKelp <1<1

Pelleted Poultry ManurePelleted Poultry Manure Net N Mineralization Net N Mineralization
05
1015
202530
3540
1 Week 4 Weeks 8 Weeks
5977
Incubation Incubation -- WeeksWeeksHartz and Johnstone, 2006Hartz and Johnstone, 2006

Fish PowderFish Powder Net N Mineralization Net N Mineralization
0
10
20
30
40
50
60
70
1 Week 4 Weeks 8 Weeks
5977
Incubation Incubation -- WeeksWeeksHartz and Johnstone, 2006Hartz and Johnstone, 2006

Feather MealFeather Meal Net N Mineralization Net N Mineralization
0
10
20
30
40
50
60
70
1 Week 4 Weeks 8 Weeks
5977
Incubation Incubation -- WeeksWeeksHartz and Johnstone, 2006Hartz and Johnstone, 2006

Percent of Initial Organic N Percent of Initial Organic N Mineralized Mineralized –– 4 Weeks Incubation4 Weeks Incubation
0
10
20
30
40
50
60
70
pelletedpoultry
sea birdguano
fish powder feather meal
5977
Hartz and Johnstone, 2006Hartz and Johnstone, 2006

Nitrogen Release Characteristics Nitrogen Release Characteristics of N From Fertilizerof N From Fertilizer
Relative Rate of N Mineralization
Ava
ilabl
e N
itrat
e (p
pm)
FertilizerMineralization
5
10
15
20
Soil organic matter mineralization

Integrating Sources of N for Integrating Sources of N for Organic ProductionOrganic Production

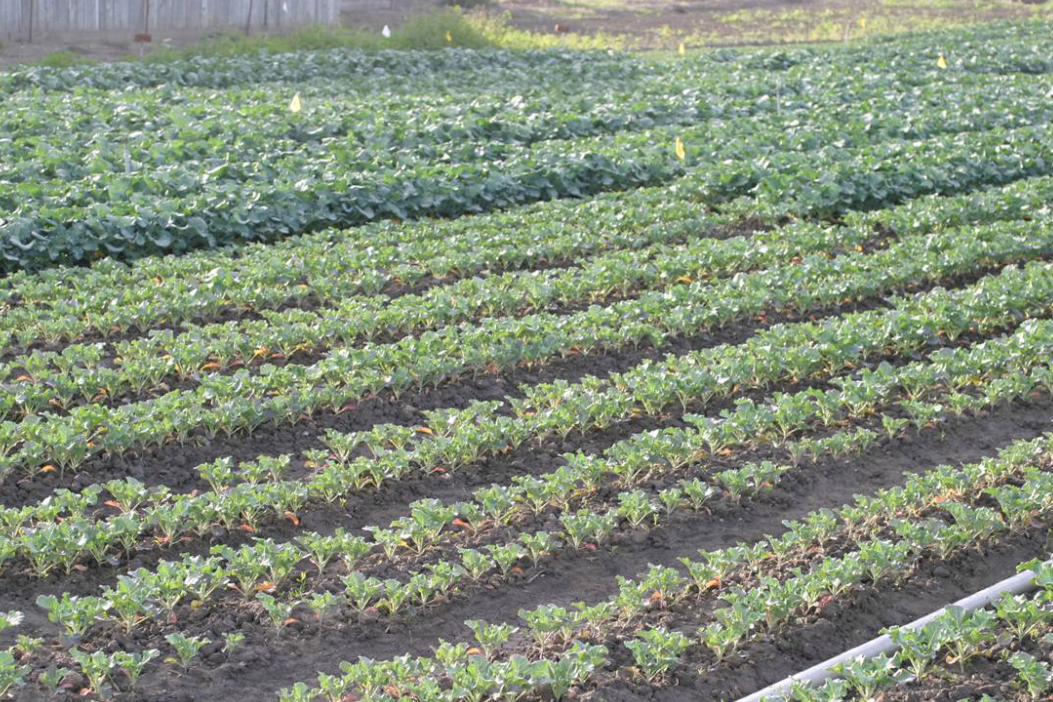
2006 Cover Crop x Fertilizer Trial2006 Cover Crop x Fertilizer Trial
•• The cover crop plots produced 3.2 The cover crop plots produced 3.2 tons of biomass and contained 194.5 lbs N/A tons of biomass and contained 194.5 lbs N/A
•• The cover crop was incorporated February 14The cover crop was incorporated February 1412 inches of rain fell between incorporation 12 inches of rain fell between incorporation of the cover crop and transplanting broccoli of the cover crop and transplanting broccoli on April 20on April 20

Rain Events Between Cover Crop Rain Events Between Cover Crop Incorporation and Transplanting BroccoliIncorporation and Transplanting Broccoli
0.0
0.1
0.2
0.3
0.4
0.5
0.6
0.7
0.8
0.9
1.0
14-Feb 21-Feb 28-Feb 7-Mar 14-Mar 21-Mar 28-Mar 4-Apr 11-Apr 18-Apr
Rai
nfal
l (in
.)
0
2
4
6
8
10
12
14
Cum
ulat
ive
Rai
nfal
l (in
.)
Rainfall EventsCum. Rainfall

Soil Temperatures Between Cover Crop Soil Temperatures Between Cover Crop Incorporation and Transplanting BroccoliIncorporation and Transplanting Broccoli
30
35
40
45
50
55
60
65
14-Feb 21-Feb 28-Feb 7-Mar 14-Mar 21-Mar 28-Mar 4-Apr 11-Apr 18-Apr
Soil
Tem
pera
ture
(deg
rees
F)
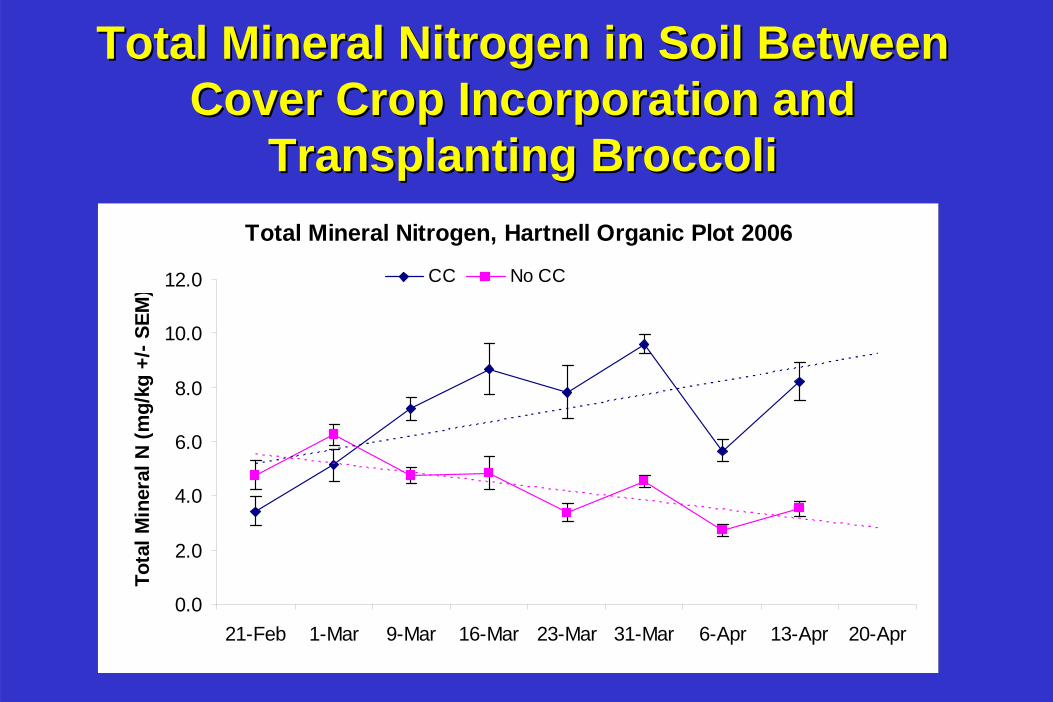
Total Mineral Nitrogen in Soil Between Total Mineral Nitrogen in Soil Between Cover Crop Incorporation and Cover Crop Incorporation and
Transplanting BroccoliTransplanting BroccoliTotal Mineral Nitrogen, Hartnell Organic Plot 2006
0.0
2.0
4.0
6.0
8.0
10.0
12.0
21-Feb 1-Mar 9-Mar 16-Mar 23-Mar 31-Mar 6-Apr 13-Apr 20-Apr
Tota
l Min
eral
N (m
g/kg
+/-
SEM
)
CC No CC

Harvest Harvest –– Number of HeadsNumber of Heads Number/ANumber/A
05000
100001500020000250003000035000400004500050000
0 75 150 225
No Cover CropCover Crop
Pounds N/APounds N/A
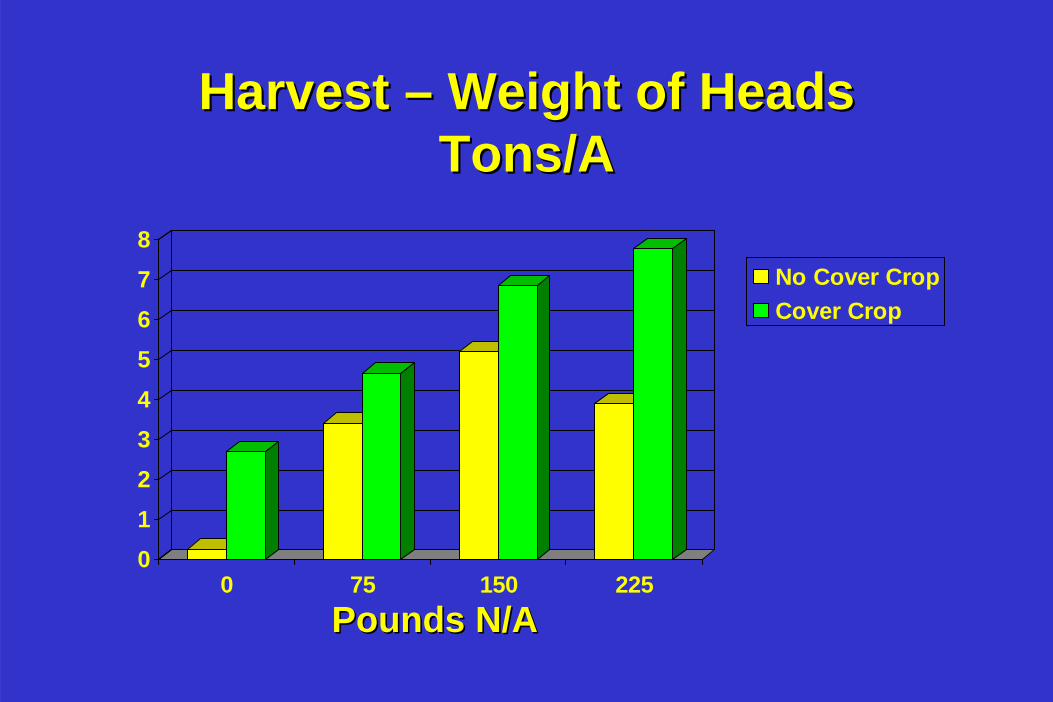
Harvest Harvest –– Weight of HeadsWeight of Heads Tons/ATons/A
012345678
0 75 150 225
No Cover CropCover Crop
Pounds N/APounds N/A

N availability from cover cropsN availability from cover crops
•• It is likely that a substantial portion of the nitrogen It is likely that a substantial portion of the nitrogen contained in the cover crop was lost to leaching contained in the cover crop was lost to leaching prior to planting the broccoli prior to planting the broccoli
•• In spite of these conditions, there was an increase In spite of these conditions, there was an increase of 25 lbs of N/A in the biomass of broccoli in cover of 25 lbs of N/A in the biomass of broccoli in cover cropped plots vs noncropped plots vs non--cover cropped plots at the cover cropped plots at the end of the growing season.end of the growing season.
•• Mark Gaskell has typically seen cover crops to Mark Gaskell has typically seen cover crops to contribute 100 lbs of N/A in studies on peppers and contribute 100 lbs of N/A in studies on peppers and cabbagecabbage

High Yielding Treatments Low High Yielding Treatments Low Synchrony form Cover Crop but Good Synchrony form Cover Crop but Good Synchrony of N Release from FertilizerSynchrony of N Release from Fertilizer
Relative Rate of N Mineralization
Ava
ilabl
e N
itrat
e (p
pm)
Crop Demand
Cover Crop Mineralization
Cover Crop Incorporation
FertilizerMineralization
5
10
15
20
Soil organic matter mineralization

Low Yielding Treatments had Poor Synchrony Low Yielding Treatments had Poor Synchrony between N Availability from Cover Crop and between N Availability from Cover Crop and
Fertilizer Rates that were too LowFertilizer Rates that were too Low
Relative Rate of N Mineralization
Ava
ilabl
e N
itrat
e (p
pm)
Crop Demand
Cover Crop Mineralization
Cover Crop Incorporation
FertilizerMineralization
5
10
15
20
Soil organic matter mineralization

Organic Fertilizer Form and Timing TrialOrganic Fertilizer Form and Timing Trial Watsonville, 2001Watsonville, 2001
TreatmentTreatment PreplantPreplantMay 8May 8
Top Top dressdress
May 31May 31
Top Top dressdressJune 7June 7
Top Top dressdress
June 14June 14
TotalTotal
UntreatedUntreated 00 00 00 00 00Fert Treat No. 1Fert Treat No. 1 4545 4545 4545 4545 180180Fert Treat No. 2Fert Treat No. 2 9090 00 4545 4545 180180Fert Treat No. 3Fert Treat No. 3 135135 00 00 4545 180180
1) Meat Meal 81) Meat Meal 8--55--1; 2) Feather Meal 121; 2) Feather Meal 12--00--003) Blood Meal 133) Blood Meal 13--00--0; 4) Guano/Chicken 70; 4) Guano/Chicken 7--00--00

0
10
20
30
40
50
1 2 3 4 5 6 7
Guano/Chicken
Blood
NitrateNitrate--Nitrogen in the Soil of 135Nitrogen in the Soil of 135--45 45 Fertilizer TreatmentsFertilizer Treatments
Organic Broccoli, Watsonville, 2001Organic Broccoli, Watsonville, 2001
Fertilizer Application

0
50
100
150
200
1 2 3 4 5Untreated Meat Feather Blood Guano/
Meal Meal Meal Chicken
Total Number of Heads, Organic BroccoliTotal Number of Heads, Organic BroccoliWatsonville, 2001Watsonville, 2001

Total Weight of Heads, Organic BroccoliTotal Weight of Heads, Organic BroccoliWatsonville, 2001Watsonville, 2001
0
1020
30
4050
60
1 2 3 4 5Untreated Meat Feather Blood Guano/Meal Meal Meal Chicken

010203040506070
1 2 3 4 5 6--------------Blood MealBlood Meal-------------------- ------------Guano/ChickenGuano/Chicken------------
45 9045 90--45 135 45 9045 135 45 90--45 13545 1354x 2x 4x 4x 2x 4x 2x2x
Comparison of Materials and TimingComparison of Materials and TimingOrganic Broccoli, Watsonville, 2001Organic Broccoli, Watsonville, 2001
Wei
ght (
lbs)

Chicken/Guano Rate and Timing in Chicken/Guano Rate and Timing in Good Synchrony with Crop DemandGood Synchrony with Crop Demand
0 8
Weeks
Nitr
ate
Con
cent
ratio
n
Crop Demand
Fertilizer N Availability
Background NitrateAvailability without Cover Crop

Fertilizers Rate is Adequate, but Timing and Fertilizers Rate is Adequate, but Timing and Mineralization Rate Out of Synch with Crop Mineralization Rate Out of Synch with Crop
Demand (i.e. 4x rate of 45 lbs N/A)Demand (i.e. 4x rate of 45 lbs N/A)
0 8
Weeks
Nitr
ate
Con
cent
ratio
n
Crop Demand
Fertilizer N Availability
Background NitrateAvailability without Cover Crop

Fertilizers Rate is Adequate, but Timing is Out Fertilizers Rate is Adequate, but Timing is Out of Synch with Crop Demandof Synch with Crop Demand
(i.e. 4x rate of 45 lbs N/A)(i.e. 4x rate of 45 lbs N/A)
0 8
Weeks
Nitr
ate
Con
cent
ratio
n
Crop Demand
Fertilizer mineral N
Background Mineral NAvailability without Cover Crop

Integrating All Sources of NitrogenIntegrating All Sources of Nitrogen
•• Achieving effective synchrony between Achieving effective synchrony between crop uptake and N supplied by crop uptake and N supplied by mineralization from soil organic matter, mineralization from soil organic matter, cover crop residues and fertilizers is the cover crop residues and fertilizers is the challenge for managing N fertility of challenge for managing N fertility of vegetables in organic systemsvegetables in organic systems

Effective Synchrony Between Effective Synchrony Between Mineralization from the Various Mineralization from the Various
Sources and Crop DemandSources and Crop Demand
Relative Rate of N Mineralization
Ava
ilabl
e N
itrat
e (p
pm)
Crop Demand
Cover Crop Mineralization
Cover Crop Incorporation
FertilizerMineralization
5
10
15
20
Soil organic matter mineralization

SummarySummary
•• Nitrogen fertilization in organic systems is Nitrogen fertilization in organic systems is trickier than in conventional systems where trickier than in conventional systems where applications of readily available N can be applications of readily available N can be applied in a timely mannerapplied in a timely manner
•• There are typically large pools of organic N in There are typically large pools of organic N in soils, but the availability of this N and the soils, but the availability of this N and the synchrony of release and availability for crop synchrony of release and availability for crop production are difficult to predictproduction are difficult to predict

SummarySummary
•• As a result, organic growers have to develop As a result, organic growers have to develop excellent skills and knowledge to work with excellent skills and knowledge to work with this systemthis system
•• There may be a tendency to over fertilize, There may be a tendency to over fertilize, especially in cold soils to make sure there is especially in cold soils to make sure there is adequate material available for mineralizationadequate material available for mineralization