Embed Size (px)
Citation preview
Published April 2017
NISRA Customer Satisfaction
2016
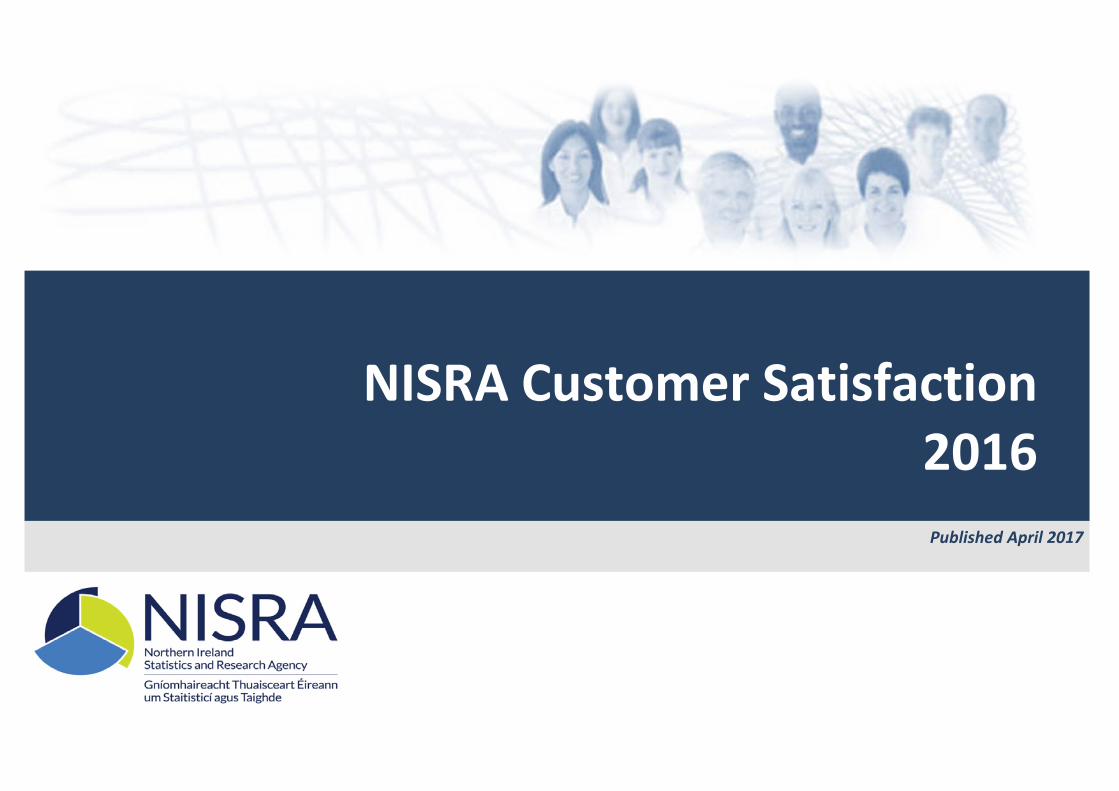
Contents
PageKey Points 1
Introduction 2
ResultsService Provided and Quality of Statistics 3Use of Websites 5Uses of Statistics/Research 7
AppendicesI - All responses including comparison with previous years 9II - Data Quality 15
NIS
RA
Cus
tom
er S
urve
y 20
16
●
● Some 97% of key customers were satisfied with the quality of statistics they received.
●
●
●
Key Points
The main uses to which the key customers put the information obtained from NISRA were for Responding to Information Requests (54%), Monitoring or Formulating Policy (50%) and Research (49%).
98% of respondents were satisfied
with the service provided by
NISRA.
The great majority of key customers (98%) were satisfied with the overall service provided by NISRA in 2016, with similar levels of satisfaction found for various aspects of that service (politeness/courtesy, knowledge and professionalism). The majority of key customers (94%) were satisfied with the timeliness of service.
Less than 1% of customers stated that they had complained about the service provided by NISRA in 2016.
Over half (56%) of key customers accessed statistics and research services online through the NISRA, NINIS or Departmental websites. Of these, more than three quarters found it easy to find the information they required on the NISRA and Departmental websites, while two thirds were able to easily find the information on the NINIS website.
NIS
RA
Cus
tom
er S
urve
y 20
16
1
IntroductionBackgroundThe 2016 NISRA Customer Satisfaction Survey is the thirteenth in a series of annual customer surveys. This report details the level of key customer satisfaction and provides NISRA with feedback on how it is performing and how it can make improvements.
The findings from the Customer Survey are used to monitor one of NISRA's 2016/17 targets, "To achieve no less than 96% of key users rating NISRA's services as satisfactory."
NotesKey Customers1 were identified by NISRA branches and provided to Staff Surveys Branch (SSB). The questionnaire was issued by email through SNAP Webhost to 1,039 individuals who had been identified as key customers during 2016. The fieldwork was carried out over a three week period in February 2017.
ResponseA total of 353 customers submitted a response, amounting to a response rate of 35% of the valid email addresses supplied2. Nearly one quarter of those who responded were staff from within NISRA and slightly over half were from an NICS Department or other agency. Some individuals were identified as being a customer by more than one NISRA branch. Consequently, some customers reviewed more than one branch, and as such a total of 374 cases were recorded.
1 A ‘key customer’ is a customer with whom branch staff have regular contact about important information. 2 20 email addresses were not valid.
Contact DownloadFor further information, please contact:
Staff Surveys BranchColby HouseStranmillis CourtBelfastBT9 5BF
[email protected] 028 902 55166
This report along with, earlier NISRA customer satisfaction surveys can be found at this link: www.nisra.gov.uk/statistics/ni-government-human-resource-statistics/customer-satisfaction
All content in this report is licensed and available under the Open Government Licence v3.0. To view this licence, go to: www.nationalarchives.gov.uk/doc/open-government-licence/version/3
NIS
RA
Cus
tom
er S
urve
y 20
16
2
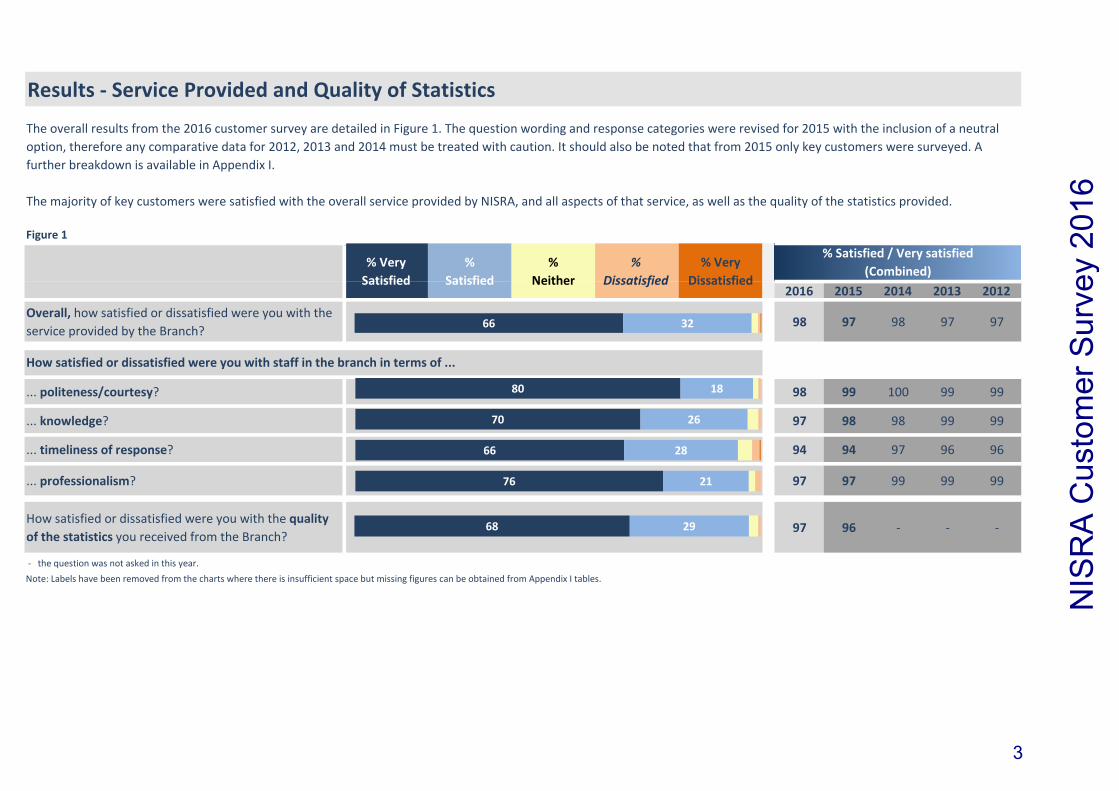
Results - Service Provided and Quality of Statistics
Figure 1
2016 2015 2014 2013 2012
Overall, how satisfied or dissatisfied were you with the service provided by the Branch?
98 97 98 97 97
... politeness/courtesy? 98 99 100 99 99
... knowledge? 97 98 98 99 99
... timeliness of response? 94 94 97 96 96
... professionalism? 97 97 99 99 99
How satisfied or dissatisfied were you with the quality of the statistics you received from the Branch?
97 96 - - -
- the question was not asked in this year.Note: Labels have been removed from the charts where there is insufficient space but missing figures can be obtained from Appendix I tables.
.
The overall results from the 2016 customer survey are detailed in Figure 1. The question wording and response categories were revised for 2015 with the inclusion of a neutral option, therefore any comparative data for 2012, 2013 and 2014 must be treated with caution. It should also be noted that from 2015 only key customers were surveyed. A further breakdown is available in Appendix I.
The majority of key customers were satisfied with the overall service provided by NISRA, and all aspects of that service, as well as the quality of the statistics provided.
% Very Dissatisfied
How satisfied or dissatisfied were you with staff in the branch in terms of ...
% Very Satisfied
% Satisfied
% Neither
% Dissatisfied
% Satisfied / Very satisfied (Combined)
80
70
66
76
18
26
28
21
66 32
68 29
NIS
RA
Cus
tom
er S
urve
y 20
16
3
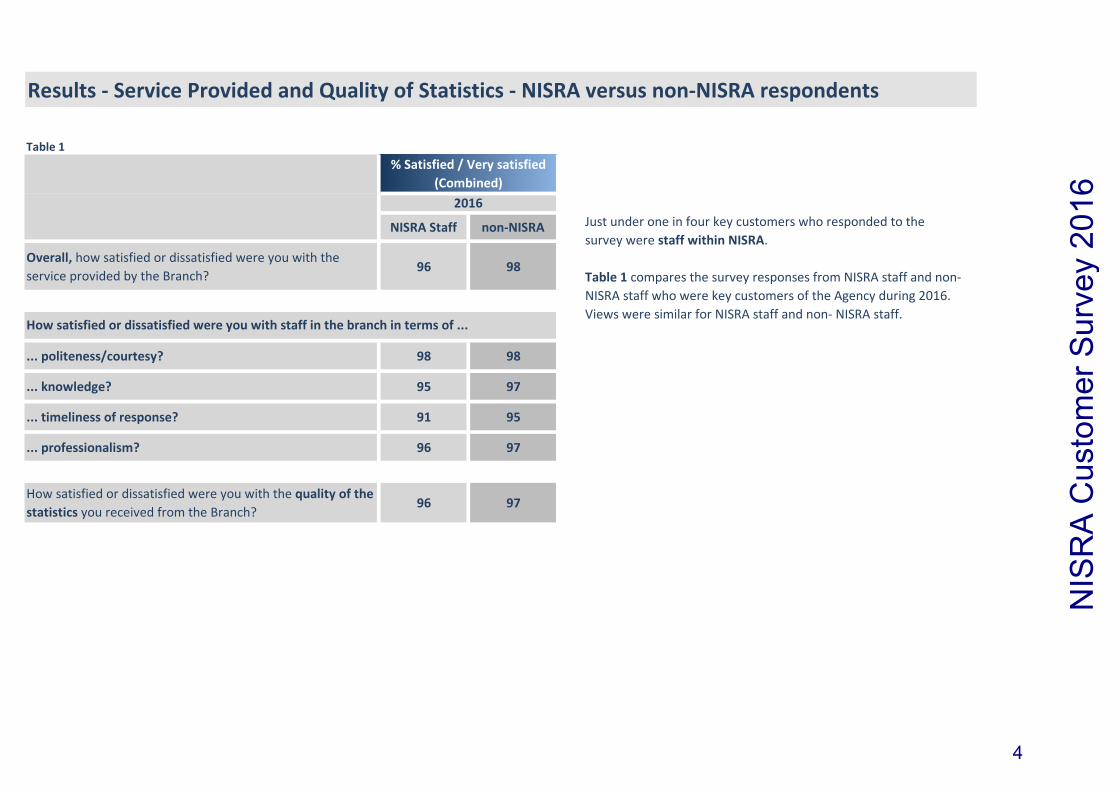
Results - Service Provided and Quality of Statistics - NISRA versus non-NISRA respondents
Table 1
NISRA Staff non-NISRA
Overall, how satisfied or dissatisfied were you with the service provided by the Branch?
96 98
... politeness/courtesy? 98 98
... knowledge? 95 97
... timeliness of response? 91 95
... professionalism? 96 97
How satisfied or dissatisfied were you with the quality of the statistics you received from the Branch?
96 97
.
How satisfied or dissatisfied were you with staff in the branch in terms of ...
Just under one in four key customers who responded to the survey were staff within NISRA.
Table 1 compares the survey responses from NISRA staff and non-NISRA staff who were key customers of the Agency during 2016. Views were similar for NISRA staff and non- NISRA staff.
% Satisfied / Very satisfied(Combined)
2016
NIS
RA
Cus
tom
er S
urve
y 20
16
4
Results - Use of Websites
Figure 2
Figure 3
NISRA website
NINIS website
Departmental website
% Quite difficult % Very difficult
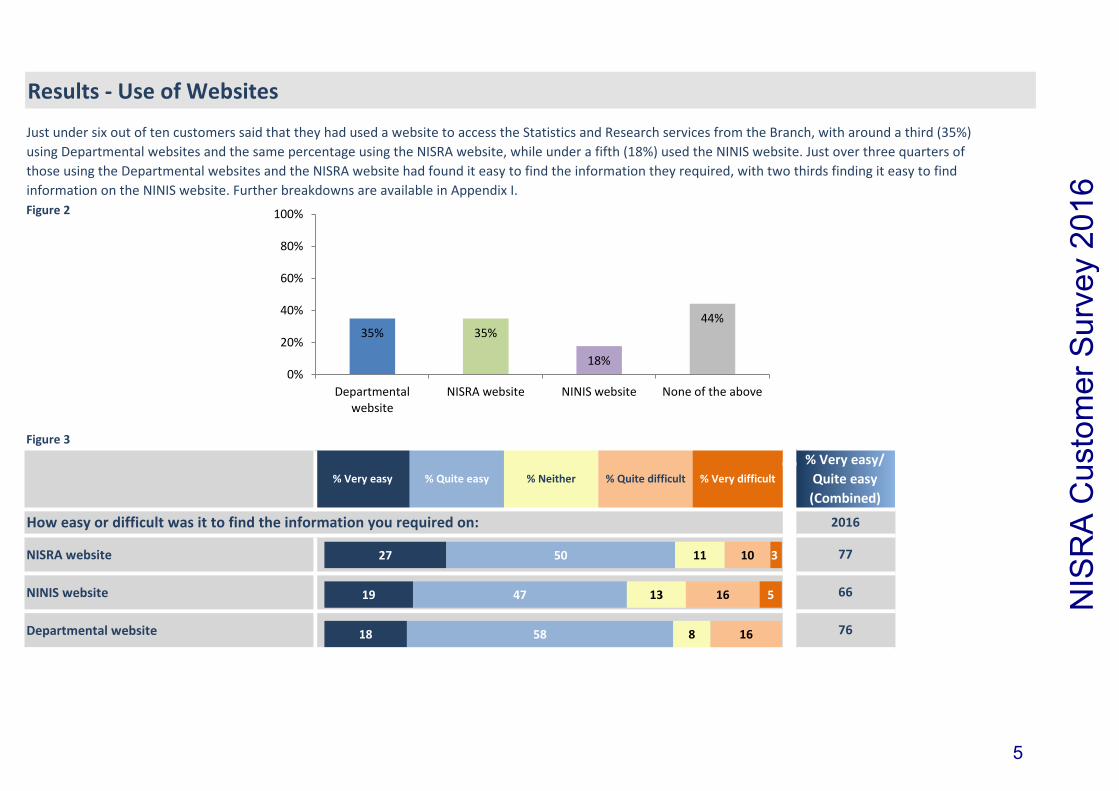
Just under six out of ten customers said that they had used a website to access the Statistics and Research services from the Branch, with around a third (35%) using Departmental websites and the same percentage using the NISRA website, while under a fifth (18%) used the NINIS website. Just over three quarters of those using the Departmental websites and the NISRA website had found it easy to find the information they required, with two thirds finding it easy to find information on the NINIS website. Further breakdowns are available in Appendix I.
How easy or difficult was it to find the information you required on: 2016
77
66
76
% Very easy/ Quite easy(Combined)
% Very easy % Quite easy % Neither
27
19
18
50
47
58
11
13
8
10
16
16
3
5
35% 35%
18%
44%
0%
20%
40%
60%
80%
100%
Departmental website
NISRA website NINIS website None of the above
NIS
RA
Cus
tom
er S
urve
y 20
16
5
Results - Websites - NISRA versus non-NISRA respondents
Figure 4
Table 2
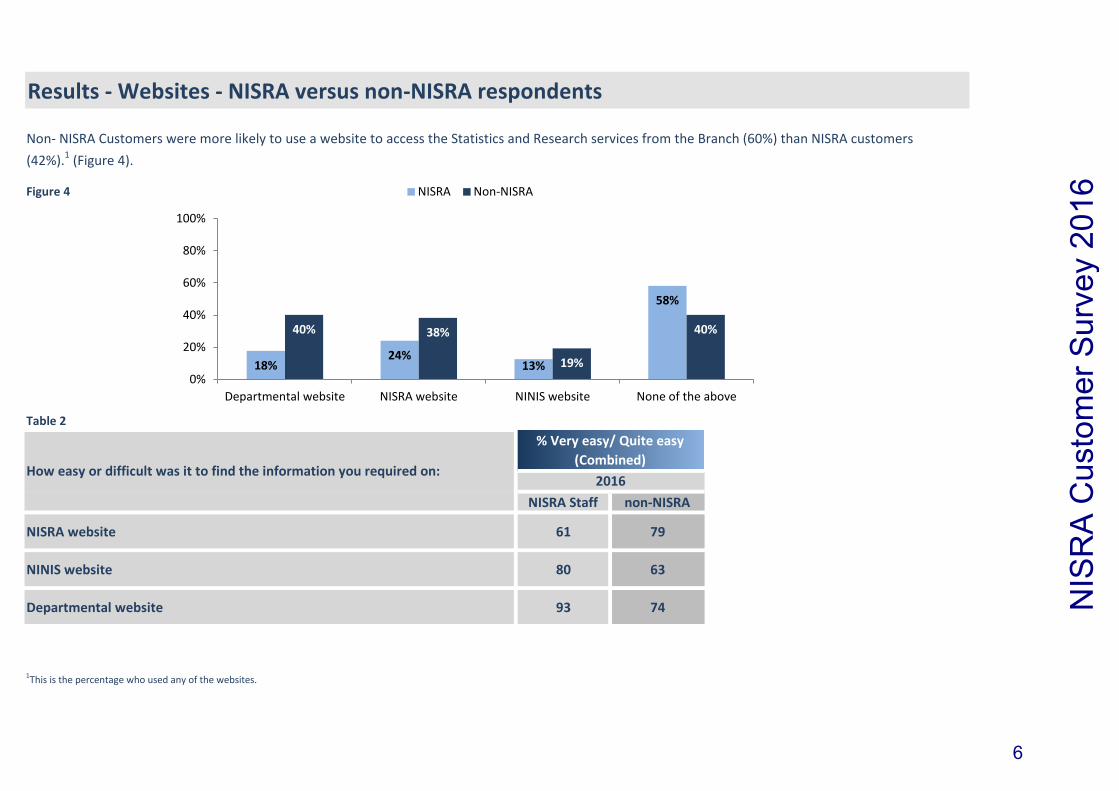
NISRA Staff non-NISRA
NISRA website 61 79
NINIS website 80 63
Departmental website 93 74
1This is the percentage who used any of the websites.
Non- NISRA Customers were more likely to use a website to access the Statistics and Research services from the Branch (60%) than NISRA customers (42%).1 (Figure 4).
% Very easy/ Quite easy(Combined)
2016How easy or difficult was it to find the information you required on:
18% 24%
13%
58%
40% 38%
19%
40%
0%
20%
40%
60%
80%
100%
Departmental website NISRA website NINIS website None of the above
NISRA Non-NISRA
NIS
RA
Cus
tom
er S
urve
y 20
16
6
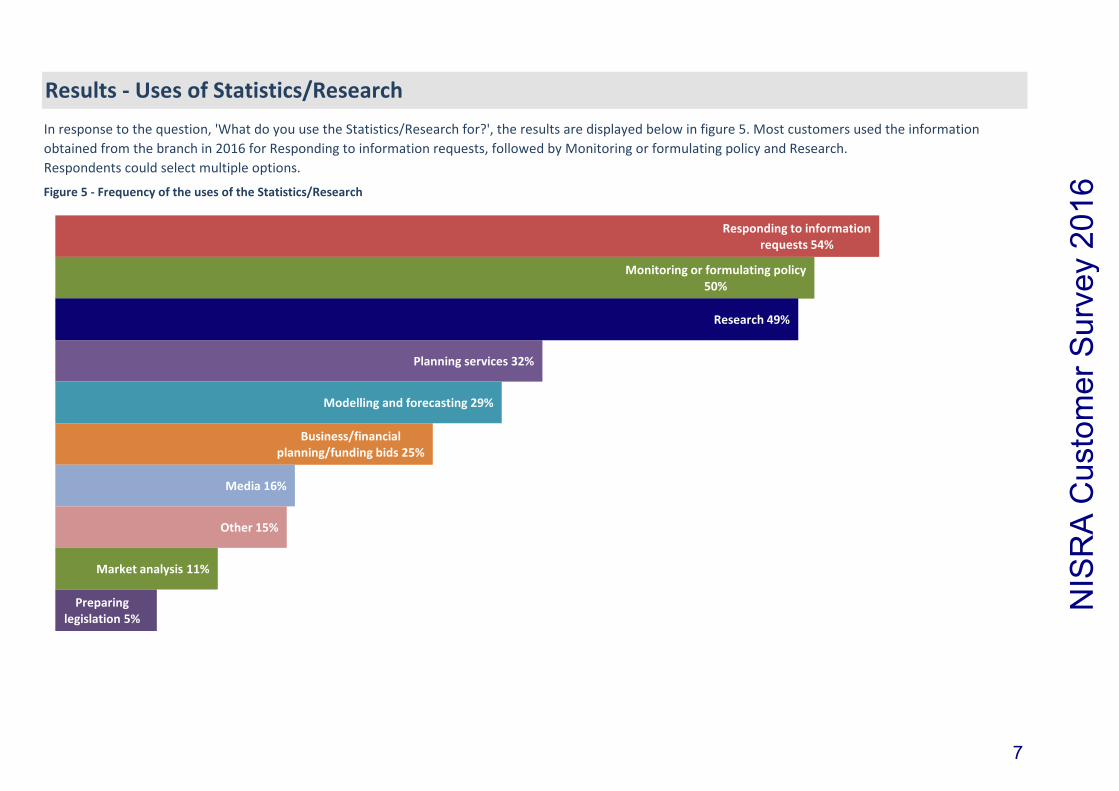
Figure 5 - Frequency of the uses of the Statistics/Research
Results - Uses of Statistics/ResearchIn response to the question, 'What do you use the Statistics/Research for?', the results are displayed below in figure 5. Most customers used the information obtained from the branch in 2016 for Responding to information requests, followed by Monitoring or formulating policy and Research.Respondents could select multiple options.
Responding to information requests 54%
Monitoring or formulating policy 50%
Research 49%
Planning services 32%
Modelling and forecasting 29%
Business/financial planning/funding bids 25%
Media 16%
Other 15%
Market analysis 11%
Preparing legislation 5%
NIS
RA
Cus
tom
er S
urve
y 20
16
7
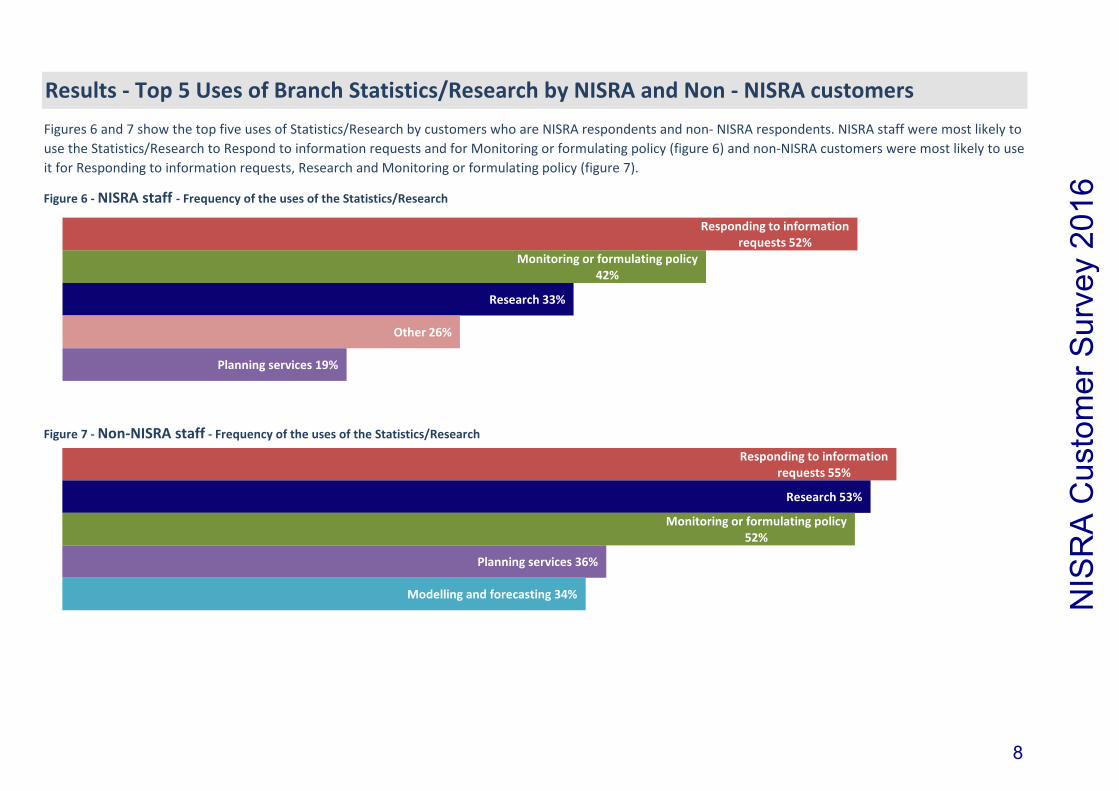
Figure 6 - NISRA staff - Frequency of the uses of the Statistics/Research
Figure 7 - Non-NISRA staff - Frequency of the uses of the Statistics/Research
Results - Top 5 Uses of Branch Statistics/Research by NISRA and Non - NISRA customersFigures 6 and 7 show the top five uses of Statistics/Research by customers who are NISRA respondents and non- NISRA respondents. NISRA staff were most likely to use the Statistics/Research to Respond to information requests and for Monitoring or formulating policy (figure 6) and non-NISRA customers were most likely to use it for Responding to information requests, Research and Monitoring or formulating policy (figure 7).
Responding to information requests 52%
Monitoring or formulating policy 42%
Research 33%
Other 26%
Planning services 19%
Responding to information requests 55%
Research 53%
Monitoring or formulating policy 52%
Planning services 36%
Modelling and forecasting 34% NIS
RA
Cus
tom
er S
urve
y 20
16
8
Appendix I - All responses including comparison with previous years
Table 3
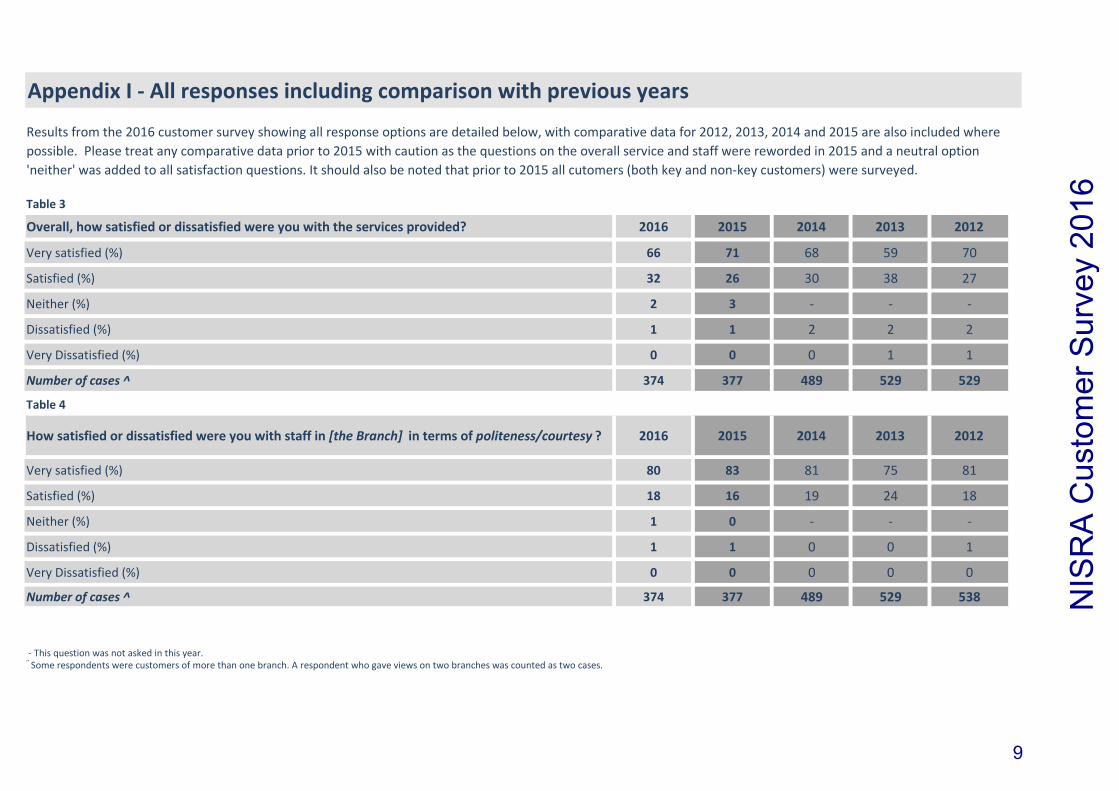
Overall, how satisfied or dissatisfied were you with the services provided? 2016 2015 2014 2013 2012
Very satisfied (%) 66 71 68 59 70
Satisfied (%) 32 26 30 38 27
Neither (%) 2 3 - - -
Dissatisfied (%) 1 1 2 2 2
Very Dissatisfied (%) 0 0 0 1 1
Number of cases ^ 374 377 489 529 529
Table 4
How satisfied or dissatisfied were you with staff in [the Branch] in terms of politeness/courtesy ? 2016 2015 2014 2013 2012
Very satisfied (%) 80 83 81 75 81
Satisfied (%) 18 16 19 24 18
Neither (%) 1 0 - - -
Dissatisfied (%) 1 1 0 0 1
Very Dissatisfied (%) 0 0 0 0 0
Number of cases ^ 374 377 489 529 538
- This question was not asked in this year.^ Some respondents were customers of more than one branch. A respondent who gave views on two branches was counted as two cases.
Results from the 2016 customer survey showing all response options are detailed below, with comparative data for 2012, 2013, 2014 and 2015 are also included where possible. Please treat any comparative data prior to 2015 with caution as the questions on the overall service and staff were reworded in 2015 and a neutral option 'neither' was added to all satisfaction questions. It should also be noted that prior to 2015 all cutomers (both key and non-key customers) were surveyed.
NIS
RA
Cus
tom
er S
urve
y 20
16
9
Appendix I - All responses including comparison with previous yearsTable 5
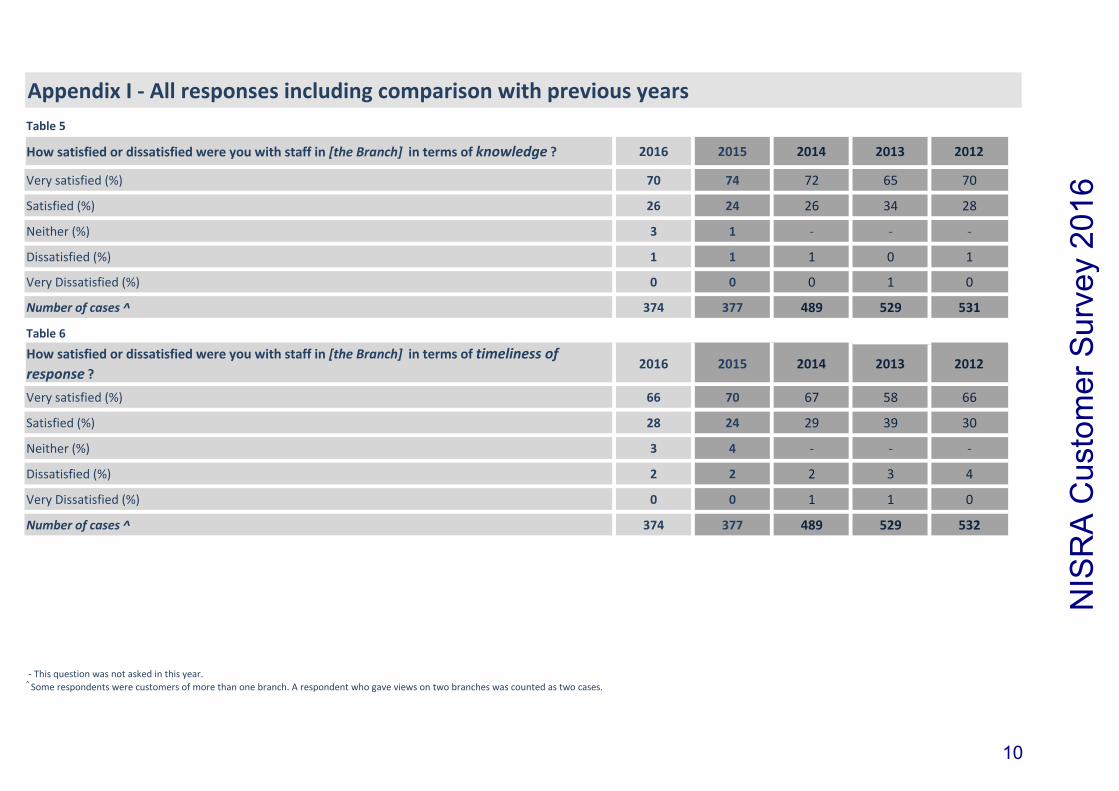
How satisfied or dissatisfied were you with staff in [the Branch] in terms of knowledge ? 2016 2015 2014 2013 2012
Very satisfied (%) 70 74 72 65 70
Satisfied (%) 26 24 26 34 28
Neither (%) 3 1 - - -
Dissatisfied (%) 1 1 1 0 1
Very Dissatisfied (%) 0 0 0 1 0
Number of cases ^ 374 377 489 529 531
Table 6
How satisfied or dissatisfied were you with staff in [the Branch] in terms of timeliness of response ?
2016 2015 2014 2013 2012
Very satisfied (%) 66 70 67 58 66
Satisfied (%) 28 24 29 39 30
Neither (%) 3 4 - - -
Dissatisfied (%) 2 2 2 3 4
Very Dissatisfied (%) 0 0 1 1 0
Number of cases ^ 374 377 489 529 532
- This question was not asked in this year.^ Some respondents were customers of more than one branch. A respondent who gave views on two branches was counted as two cases.
NIS
RA
Cus
tom
er S
urve
y 20
16
10
Appendix I - All responses including comparison with previous yearsTable 7
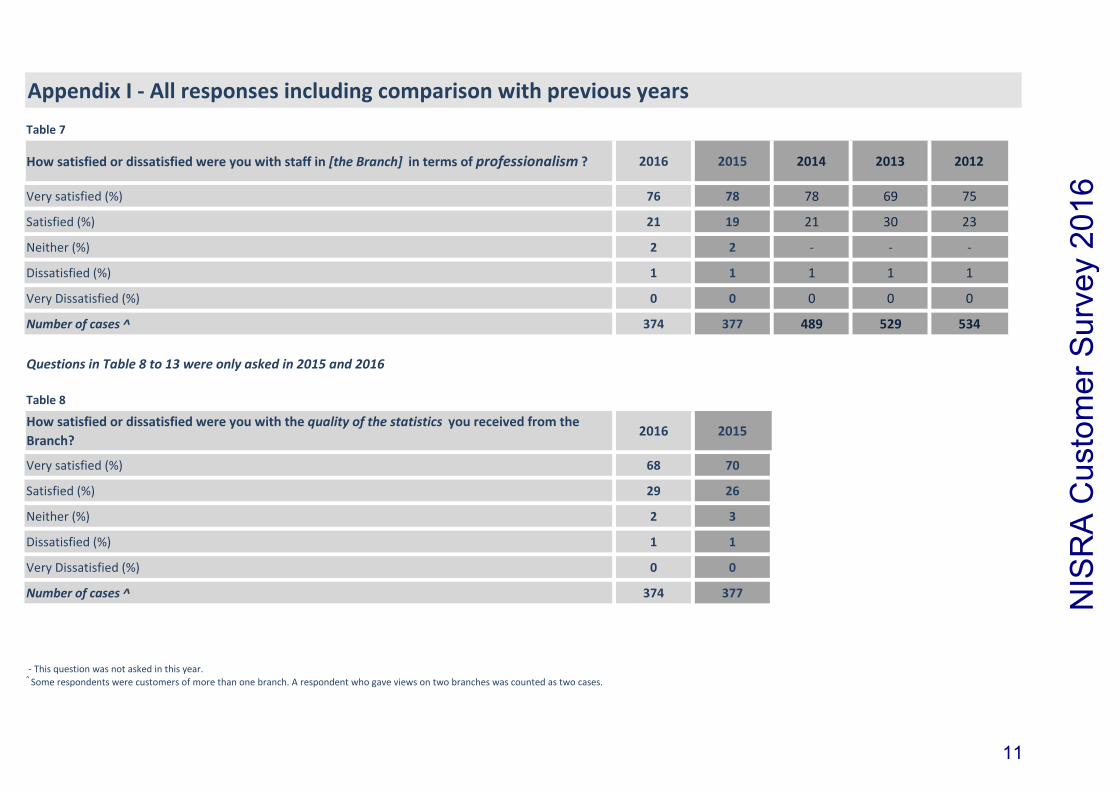
How satisfied or dissatisfied were you with staff in [the Branch] in terms of professionalism ? 2016 2015 2014 2013 2012
Very satisfied (%) 76 78 78 69 75
Satisfied (%) 21 19 21 30 23
Neither (%) 2 2 - - -
Dissatisfied (%) 1 1 1 1 1
Very Dissatisfied (%) 0 0 0 0 0
Number of cases ^ 374 377 489 529 534
Questions in Table 8 to 13 were only asked in 2015 and 2016
Table 8
How satisfied or dissatisfied were you with the quality of the statistics you received from the Branch?
2016 2015
Very satisfied (%) 68 70
Satisfied (%) 29 26
Neither (%) 2 3
Dissatisfied (%) 1 1
Very Dissatisfied (%) 0 0
Number of cases ^ 374 377
- This question was not asked in this year.^ Some respondents were customers of more than one branch. A respondent who gave views on two branches was counted as two cases.
NIS
RA
Cus
tom
er S
urve
y 20
16
11
Appendix I - All responses including comparison with previous years
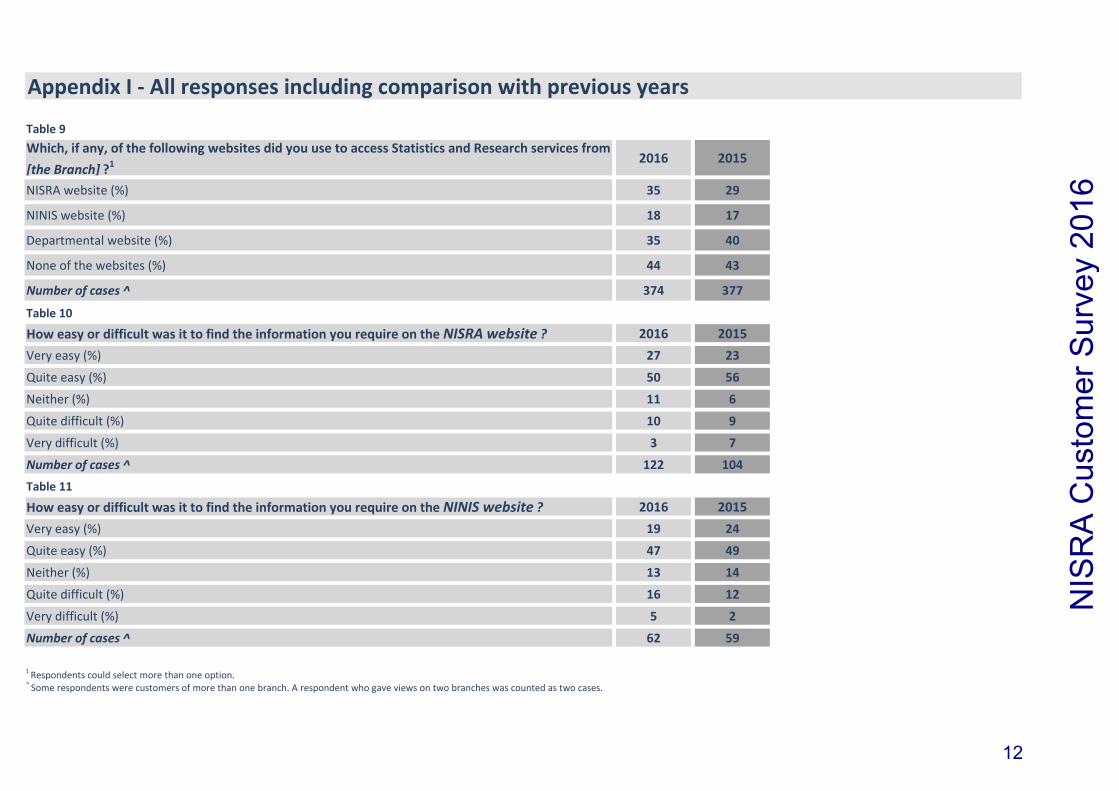
Table 9Which, if any, of the following websites did you use to access Statistics and Research services from [the Branch] ?1 2016 2015
NISRA website (%) 35 29
NINIS website (%) 18 17
Departmental website (%) 35 40
None of the websites (%) 44 43
Number of cases ^ 374 377
Table 10
How easy or difficult was it to find the information you require on the NISRA website ? 2016 2015Very easy (%) 27 23
Quite easy (%) 50 56
Neither (%) 11 6
Quite difficult (%) 10 9
Very difficult (%) 3 7
Number of cases ^ 122 104Table 11
How easy or difficult was it to find the information you require on the NINIS website ? 2016 2015Very easy (%) 19 24
Quite easy (%) 47 49
Neither (%) 13 14
Quite difficult (%) 16 12
Very difficult (%) 5 2
Number of cases ^ 62 59
1 Respondents could select more than one option.^ Some respondents were customers of more than one branch. A respondent who gave views on two branches was counted as two cases.
NIS
RA
Cus
tom
er S
urve
y 20
16
12
Appendix I - All responses including comparison with previous years
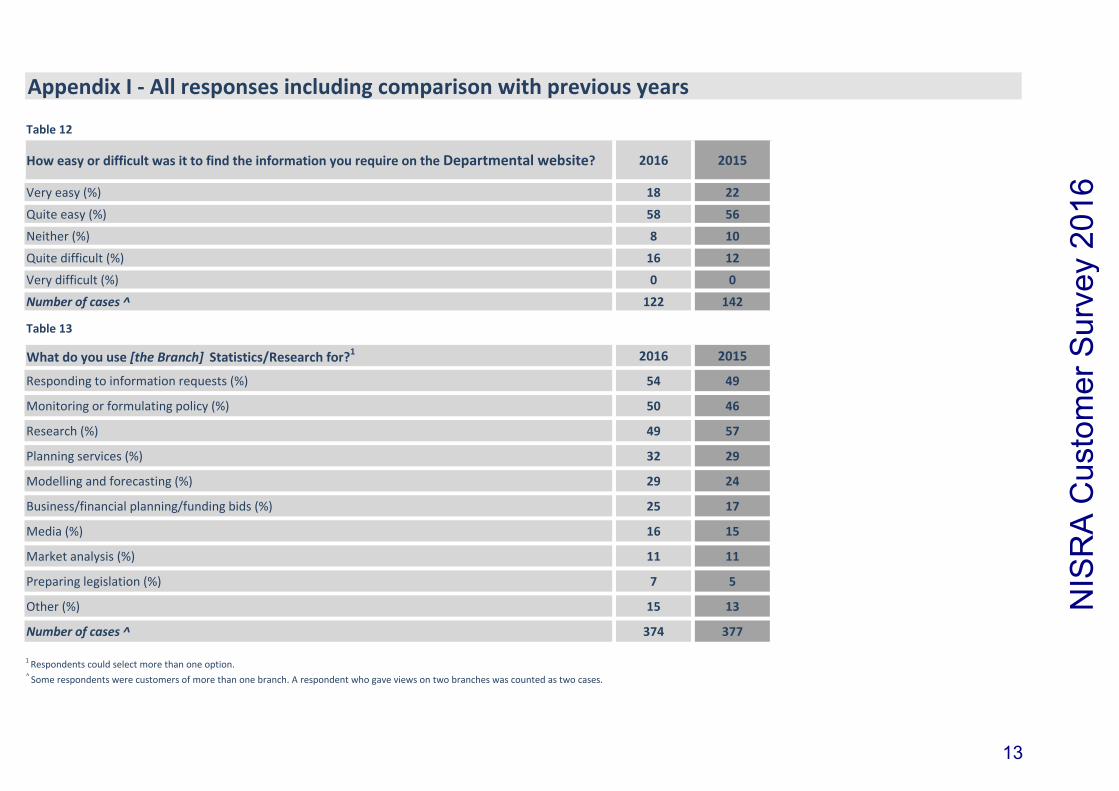
Table 12
How easy or difficult was it to find the information you require on the Departmental website? 2016 2015
Very easy (%) 18 22
Quite easy (%) 58 56
Neither (%) 8 10
Quite difficult (%) 16 12
Very difficult (%) 0 0
Number of cases ^ 122 142
Table 13
What do you use [the Branch] Statistics/Research for?1 2016 2015
Responding to information requests (%) 54 49
Monitoring or formulating policy (%) 50 46
Research (%) 49 57
Planning services (%) 32 29
Modelling and forecasting (%) 29 24
Business/financial planning/funding bids (%) 25 17
Media (%) 16 15
Market analysis (%) 11 11
Preparing legislation (%) 7 5
Other (%) 15 13
Number of cases ^ 374 377
1 Respondents could select more than one option.^ Some respondents were customers of more than one branch. A respondent who gave views on two branches was counted as two cases.
NIS
RA
Cus
tom
er S
urve
y 20
16
13
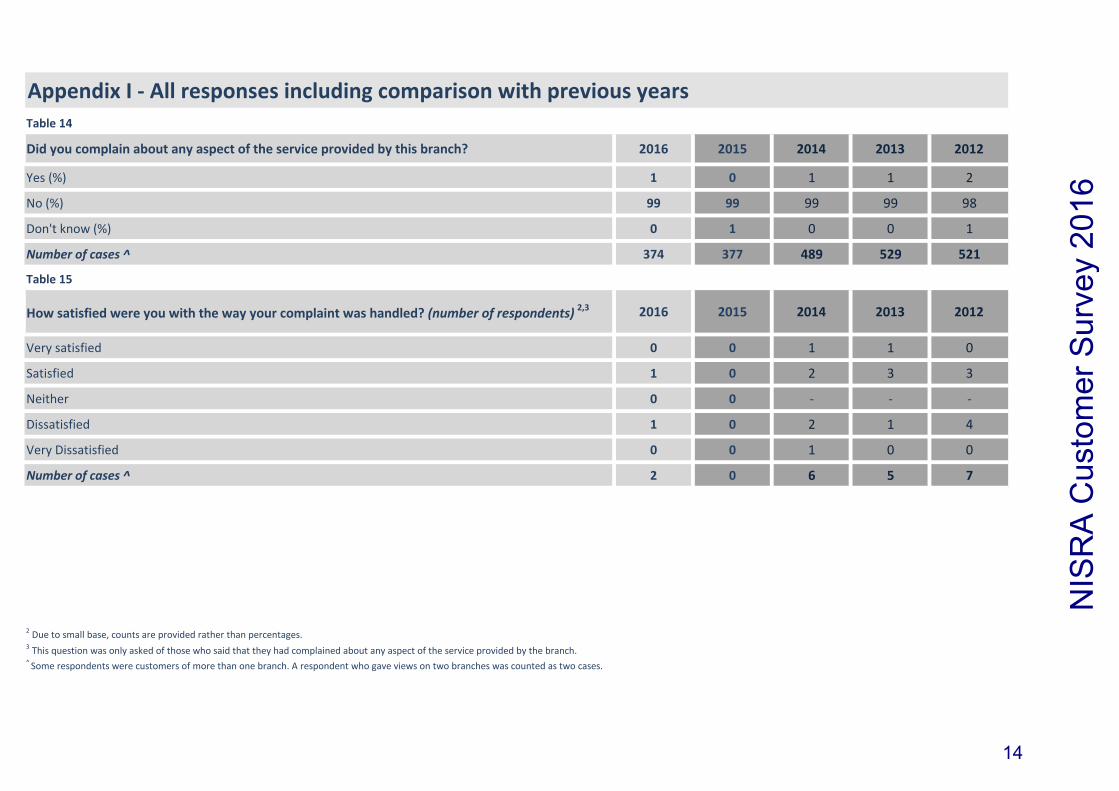
Appendix I - All responses including comparison with previous yearsTable 14
Did you complain about any aspect of the service provided by this branch? 2016 2015 2014 2013 2012
Yes (%) 1 0 1 1 2
No (%) 99 99 99 99 98
Don't know (%) 0 1 0 0 1
Number of cases ^ 374 377 489 529 521
Table 15
How satisfied were you with the way your complaint was handled? (number of respondents) 2,3 2016 2015 2014 2013 2012
Very satisfied 0 0 1 1 0
Satisfied 1 0 2 3 3
Neither 0 0 - - -
Dissatisfied 1 0 2 1 4
Very Dissatisfied 0 0 1 0 0
Number of cases ^ 2 0 6 5 7
2 Due to small base, counts are provided rather than percentages.3 This question was only asked of those who said that they had complained about any aspect of the service provided by the branch.^ Some respondents were customers of more than one branch. A respondent who gave views on two branches was counted as two cases.
NIS
RA
Cus
tom
er S
urve
y 20
16
14
Appendix II - Data Quality
RelevanceThe questionnaire was approved by NISRA Corporate Services and captures the data considered necessary to measure the level of satisfaction with the Agency overall. This is in line with requirements outlined by DoF Departmental Board and with various dimensions of customer service. The findings from the Customer Survey are used to monitor achievment of one of NISRA's 2016/17 targets "To achieve no less than 96% of key users rating NISRA's services as satisfactory. "
A review of the NISRA Customer Satisfaction Survey was carried out in 2015. Its recommendations were implemented with updates made to both the questionnaire and the methodology.
AccuracyThe figures represent the online survey responses received during the period Monday 6th February to Friday 24th February 2017. SNAP 11 Survey Software was used to produce the survey, with SNAP Webhost used to administer the survey online to customers.
Staff Surveys Branch (SSB) and Statistical Support and Business Planning Branch (SSBP) carried out validation checks on the email lists supplied by each NISRA branch, as well as the electronic responses.
Questions were routed and respondents were required to answer only those questions that applied to them. Certain questions were compulsory, which eliminated the possibility of a respondents accidently omitting to answer.
The SNAP survey saved a small text file (cookie) on a respondent's computer, which saved their position in the survey and prevented them completing multiple copies of the questionnaire.
The customer list was dependent on participating NISRA branches supplying a comprehensive list of their key customers. Thirty five branches within NISRA were asked to supply such a list. Invalid email addresses were queried and where possible corrected. In a small number of cases, these addresses could not be corrected, so the survey did not reach the full list of customers.
Some individuals were identified as being a key customer of up to five NISRA branches.
The response rate for the survey was 35%. This is comparable to 2015 (36%) and higher than 2014 (24%). Due to the low response rate, caution should be exercised in interpreting the results.
NIS
RA
Cus
tom
er S
urve
y 20
16
15
Appendix II - Data Quality
Timeliness and PunctualityThis report relates to key customers of NISRA during 2016. The survey was carried out between Monday 6th and Friday 24th February 2017.The report was published on 5th April 2017.
Accessibility and ClarityThe questionnaire was administered electronically to each email address supplied and was available in text format to aid users of most screen-reading software. Survey administrators were also available to assist and advise respondents by both telephone and email should they require additional assistance. The questionnaire was also available in other formats upon request.
These findings include tables, charts and text highlighting key facts and are available in other formats upon request.
Coherence and ComparabilityThe NISRA Customer Satisfaction Survey changed in 2015 in that the satisfaction questions moved from a ‘4-point’ scale to a '5 point scale' with a neutral option 'neither' category included. This brought the questionnaire in line with DoF. There was also a rewording of questions on the overall service and staff. The coverage of the survey also changed from all customers to key customers. A "key customer" is a customer with whom branch staff have regular contact about important information.This means that the results are not directly comparable with previous surveys and any comparisons must be treated with caution. A number of new questions were included relating to websites and uses of statistics/research. The questions on using NISRA in the future and words to describe NISRA were dropped.
ConfidentialityThe results are presented in such a way that no respondent is identifiable.
RoundingPercentages are presented as whole numbers for ease of reading. Due to the rounding process, totals may not be exactly 100%. For example, if you add together the % Strongly agree, % Agree, % Neutral, % Disagree and % Strongly disagree these will not total 100% on each occasion. Percentages less than 0.5% are rounded to 0%. To give maximum accuracy, rounding is performed at the final stage of calculation. N
ISR
A C
usto
mer
Sur
vey
2016
16