Embed Size (px)
Citation preview
Nick IsaacBiological Records CentreCentre for Ecology & Hydrology
Interpreting biodiversity under diverse syndromes of recording behaviour

Nick IsaacBiological Records CentreCentre for Ecology & Hydrology
Extracting trends from biological recording data
Is biological recording fit for purpose?
• What is the purpose?
• What data are available?
• What are the problem issues?
• What tools might provide a solution?
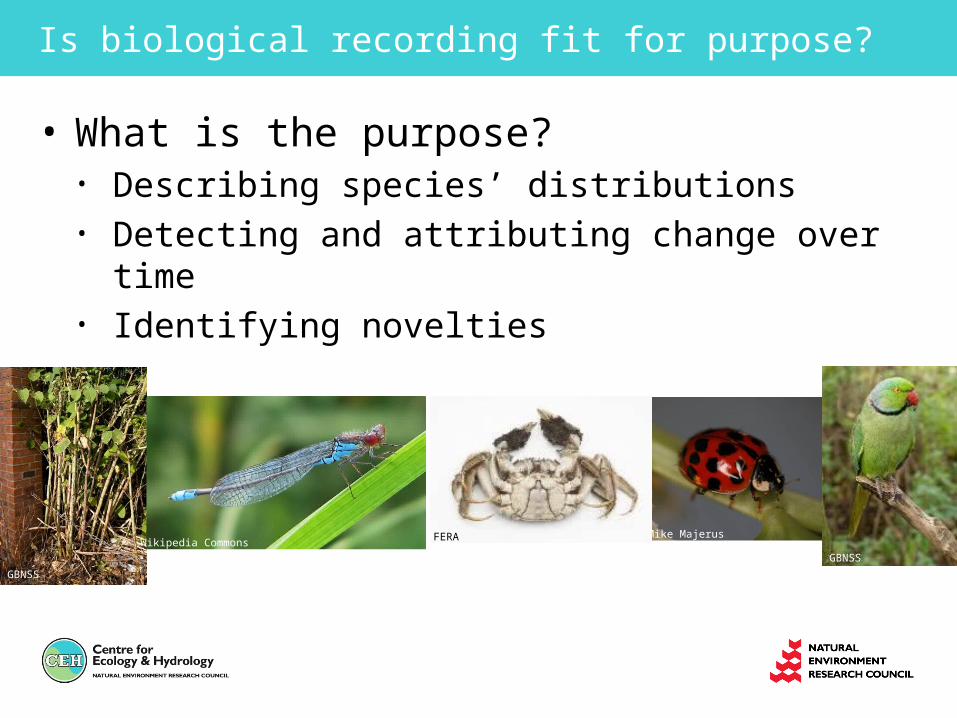
• What is the purpose?• Describing species’ distributions• Detecting and attributing change over time• Identifying novelties
Is biological recording fit for purpose?
Mike MajerusWikipedia Commons
FERA
GBNSS
GBNSS
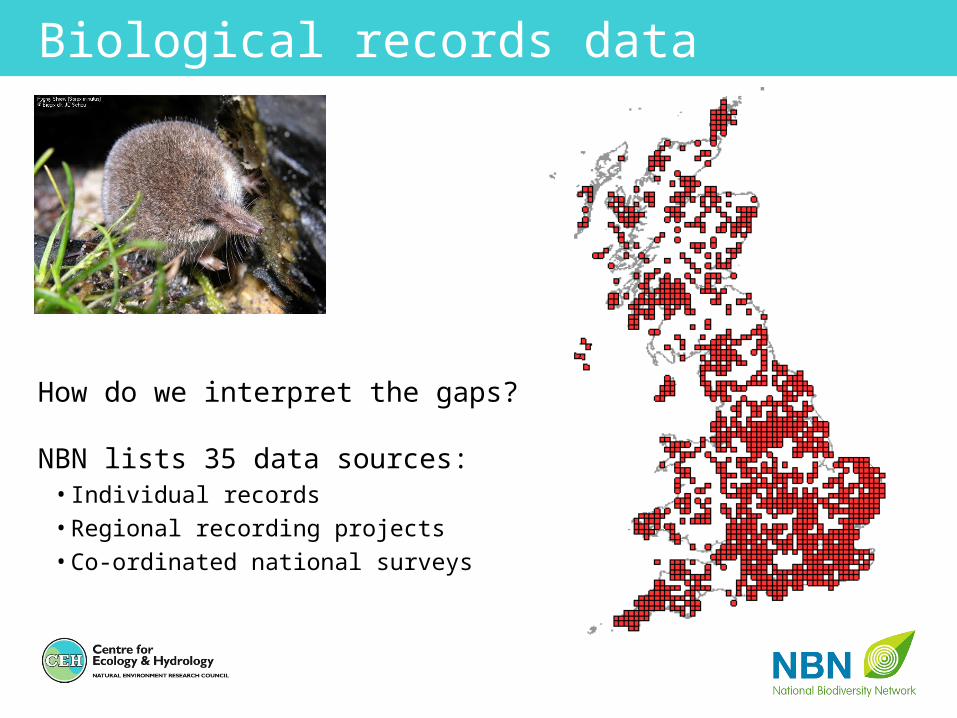
Biological records data
How do we interpret the gaps?
NBN lists 35 data sources:• Individual records• Regional recording projects• Co-ordinated national surveys
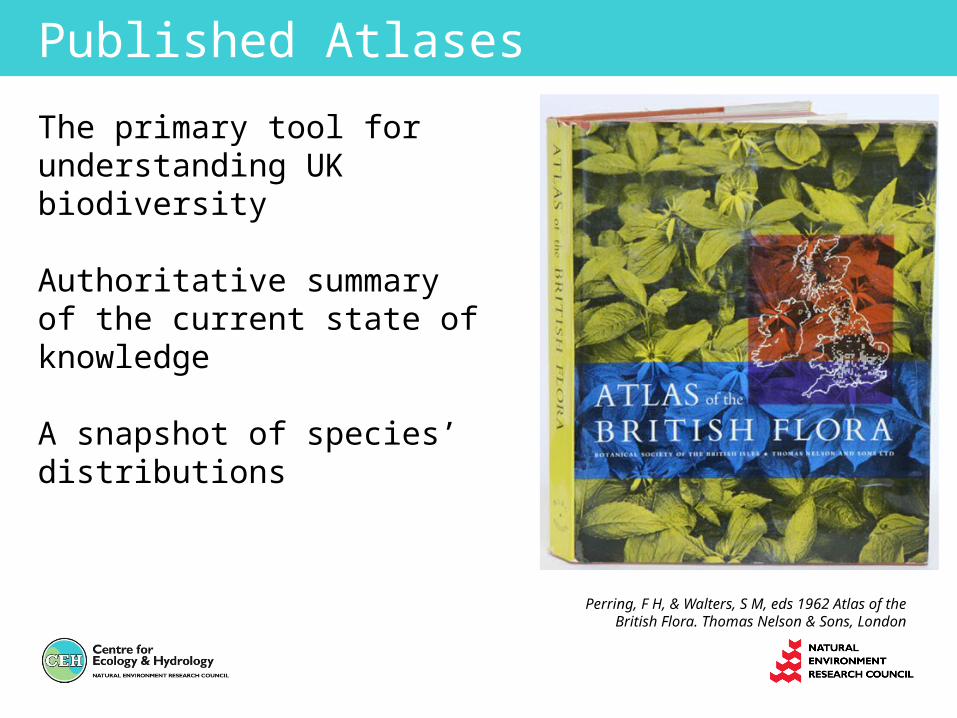
Published Atlases
The primary tool for understanding UK biodiversity
Authoritative summary of the current state of knowledge
A snapshot of species’ distributions
Perring, F H, & Walters, S M, eds 1962 Atlas of the British Flora. Thomas Nelson & Sons, London
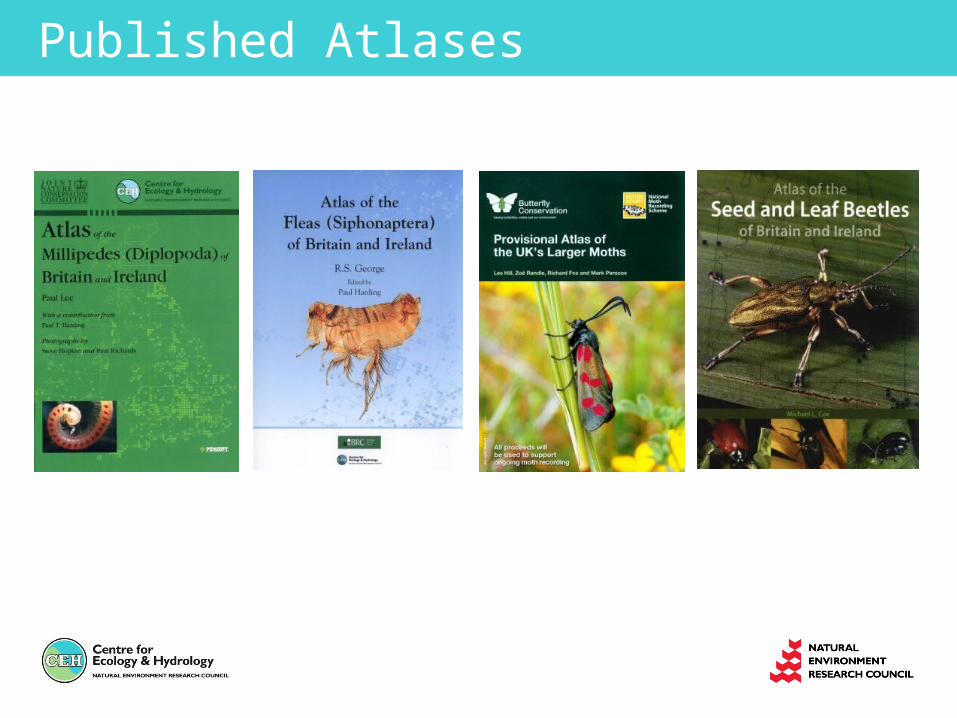
Published Atlases
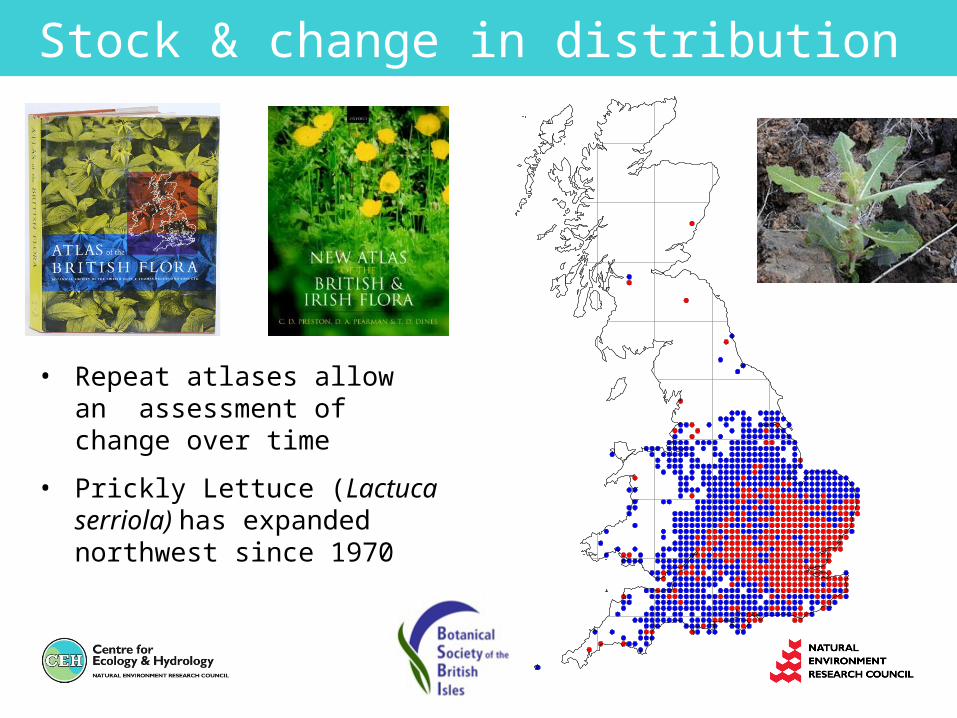
Stock & change in distribution
• Repeat atlases allow an assessment of change over time
• Prickly Lettuce (Lactuca serriola) has expanded northwest since 1970
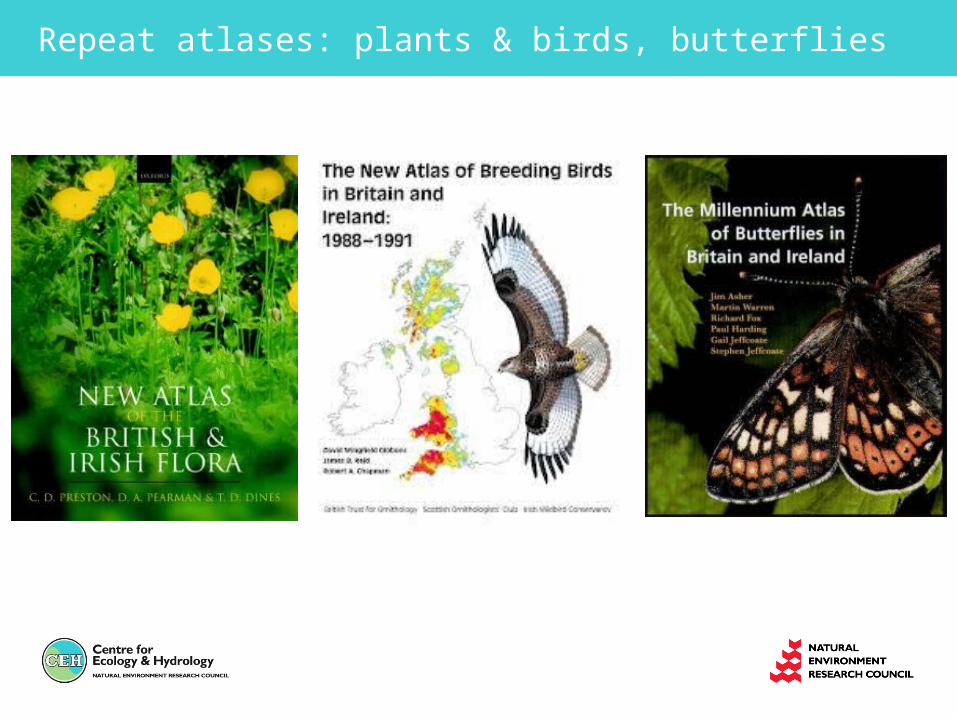
Repeat atlases: plants & birds, butterflies
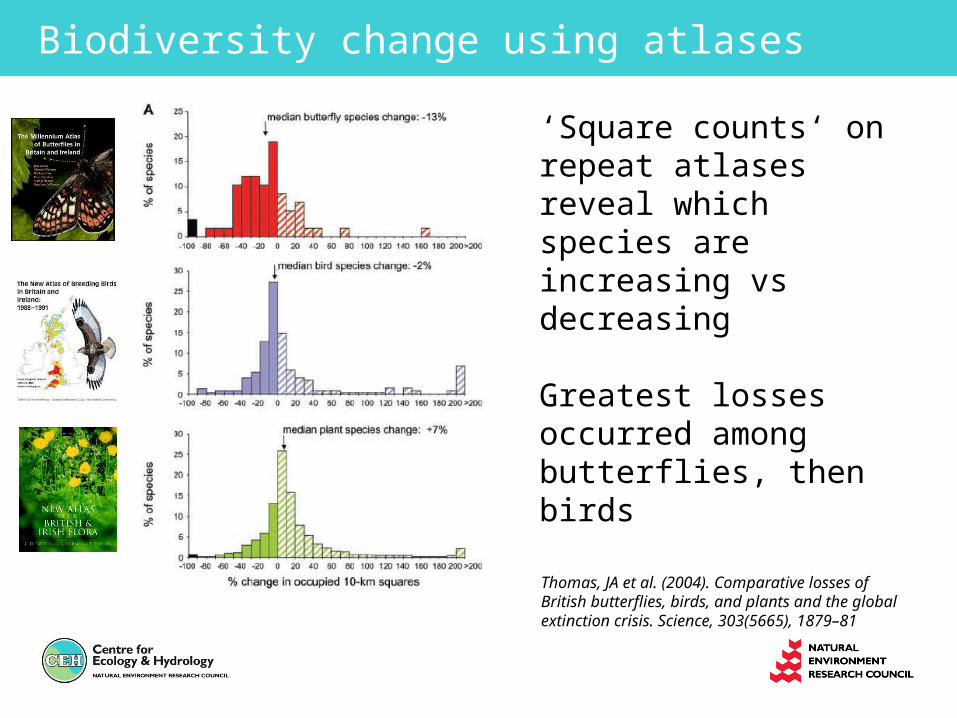
Biodiversity change using atlases
‘Square counts‘ on repeat atlases reveal which species are increasing vs decreasing
Greatest losses occurred among butterflies, then birds
Thomas, JA et al. (2004). Comparative losses of British butterflies, birds, and plants and the global extinction crisis. Science, 303(5665), 1879–81
Where are we now?
• Atlases provide a rather static view of biodiversity
• The unstructured nature of the data makes square counting unreliable
• Increasing demand for quantitative information
• New methods for estimating trends are being developed
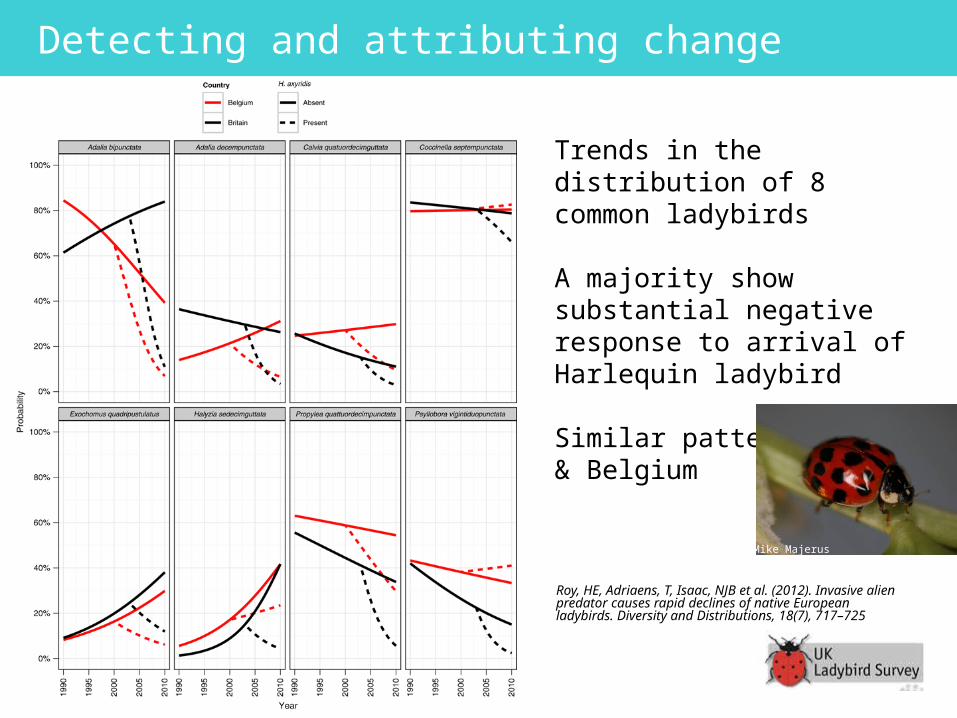
Detecting and attributing change
Trends in the distribution of 8 common ladybirds
A majority show substantial negative response to arrival of Harlequin ladybird
Similar patterns in GB & Belgium
Roy, HE, Adriaens, T, Isaac, NJB et al. (2012). Invasive alien predator causes rapid declines of native European ladybirds. Diversity and Distributions, 18(7), 717–725
Mike Majerus
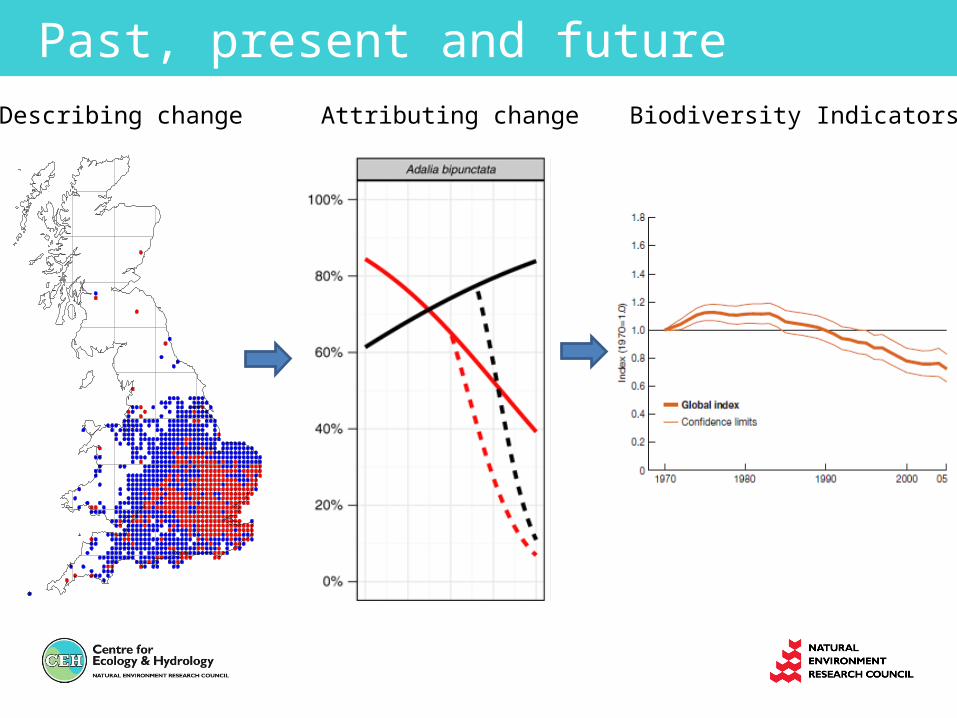
Past, present and futureBiodiversity IndicatorsAttributing changeDescribing change
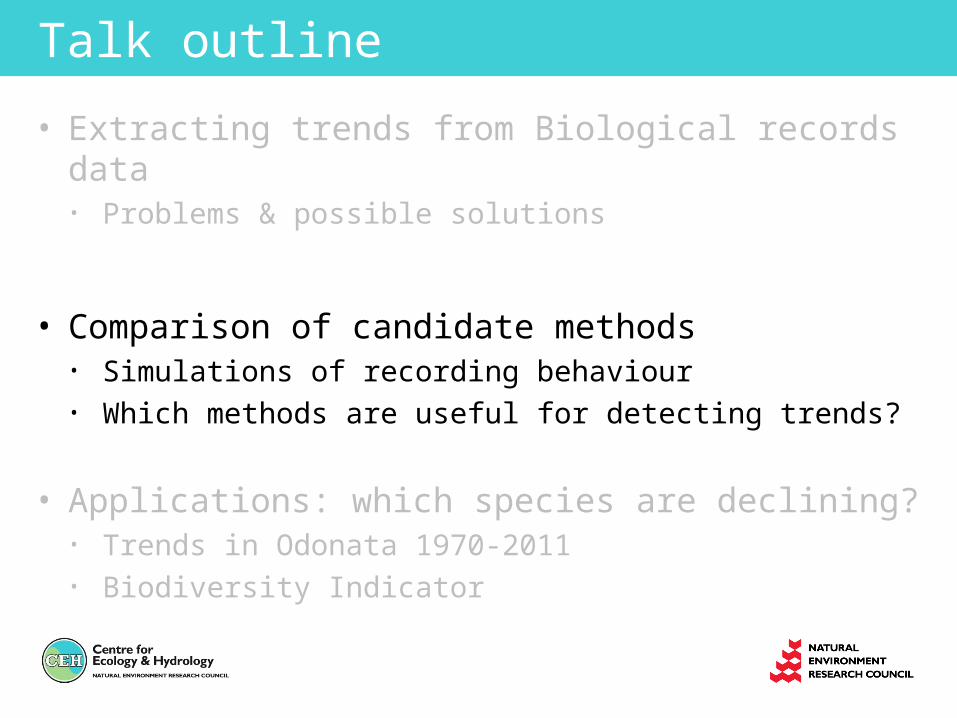
Talk outline
• Extracting trends from Biological records data• Problems & possible solutions
• Comparison of candidate methods• Simulations of recording behaviour• Which methods are useful for detecting trends?
• Applications: which species are declining?• Trends in Odonata 1970-2011• Biodiversity Indicator
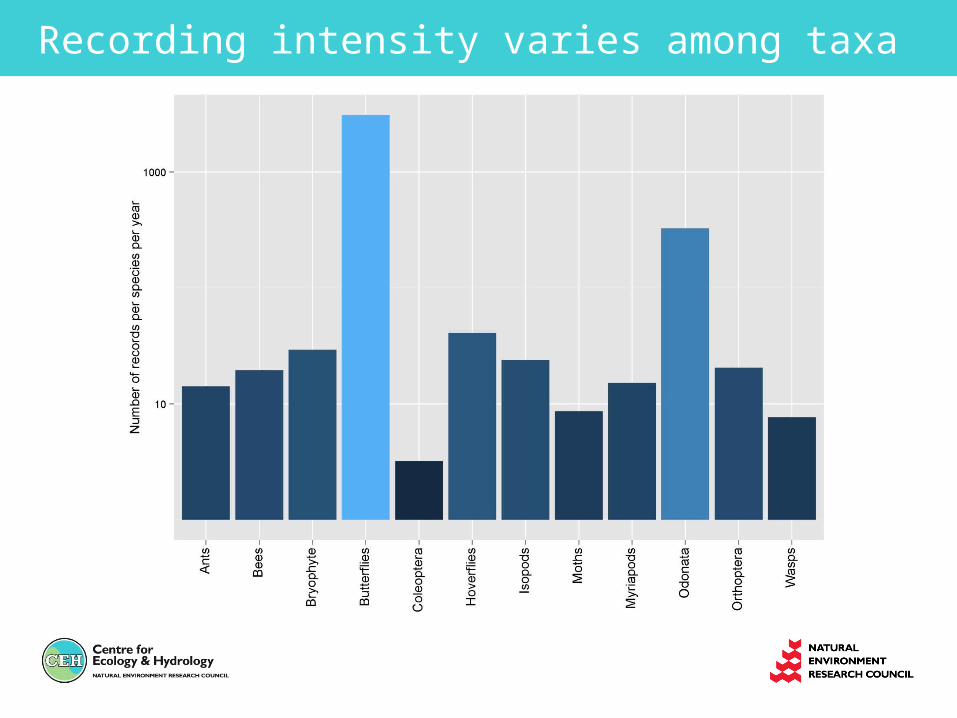
Recording intensity varies among taxa
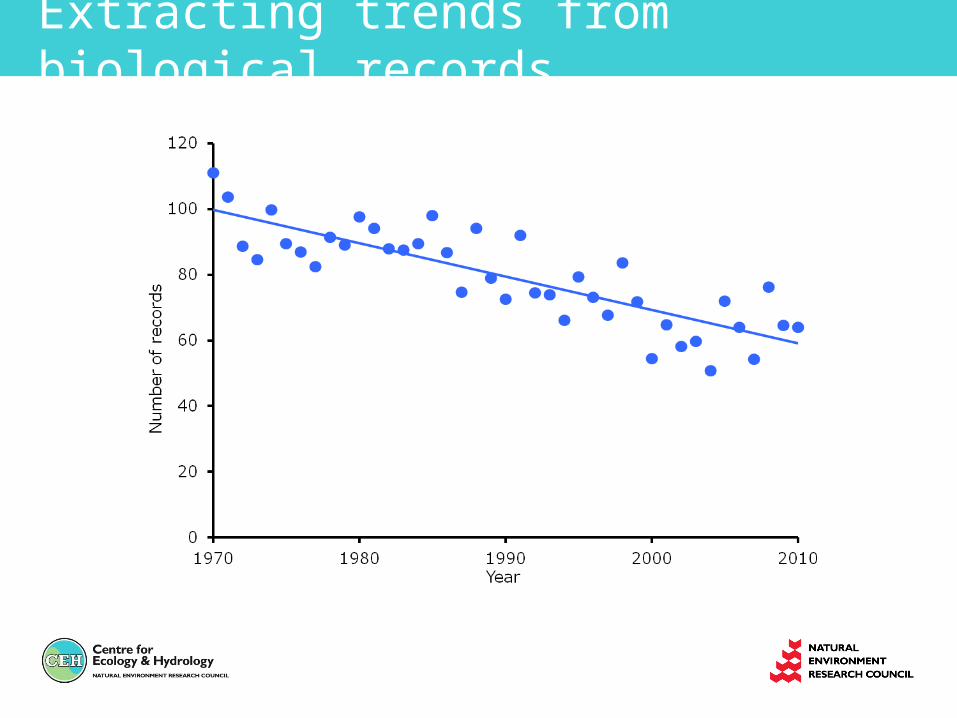
Extracting trends from biological records
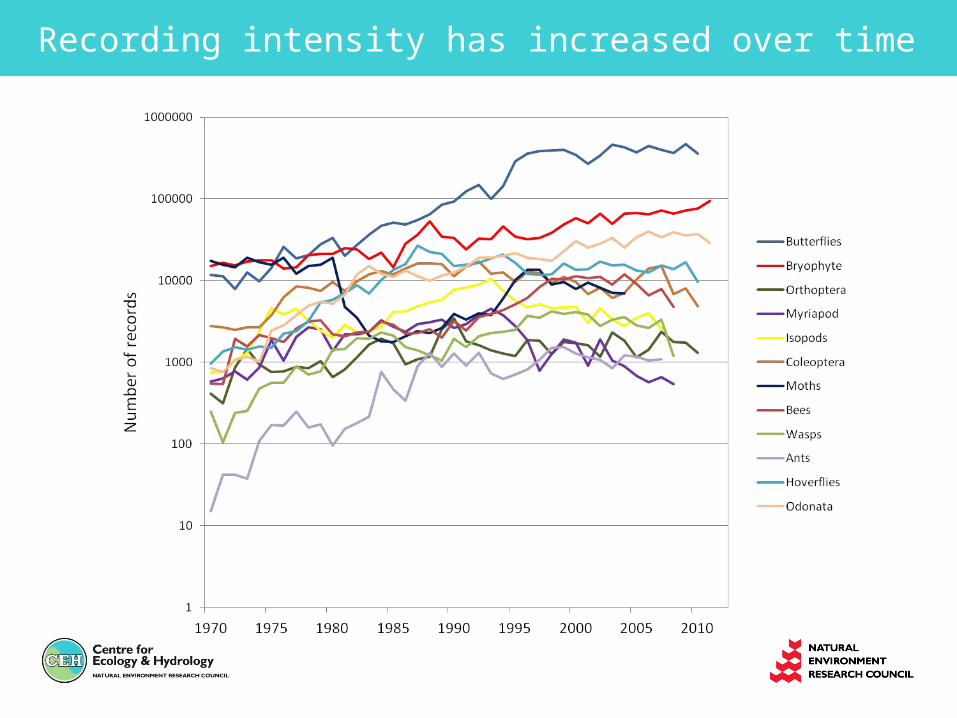
Recording intensity has increased over time
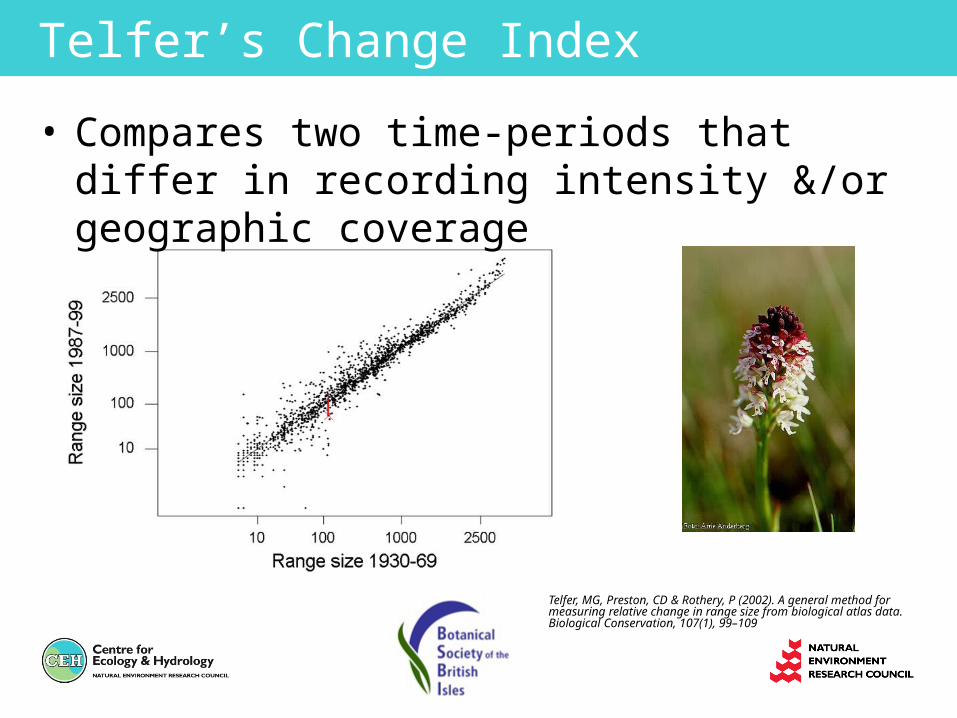
Telfer’s Change Index
Telfer, MG, Preston, CD & Rothery, P (2002). A general method for measuring relative change in range size from biological atlas data. Biological Conservation, 107(1), 99–109
• Compares two time-periods that differ in recording intensity &/or geographic coverage
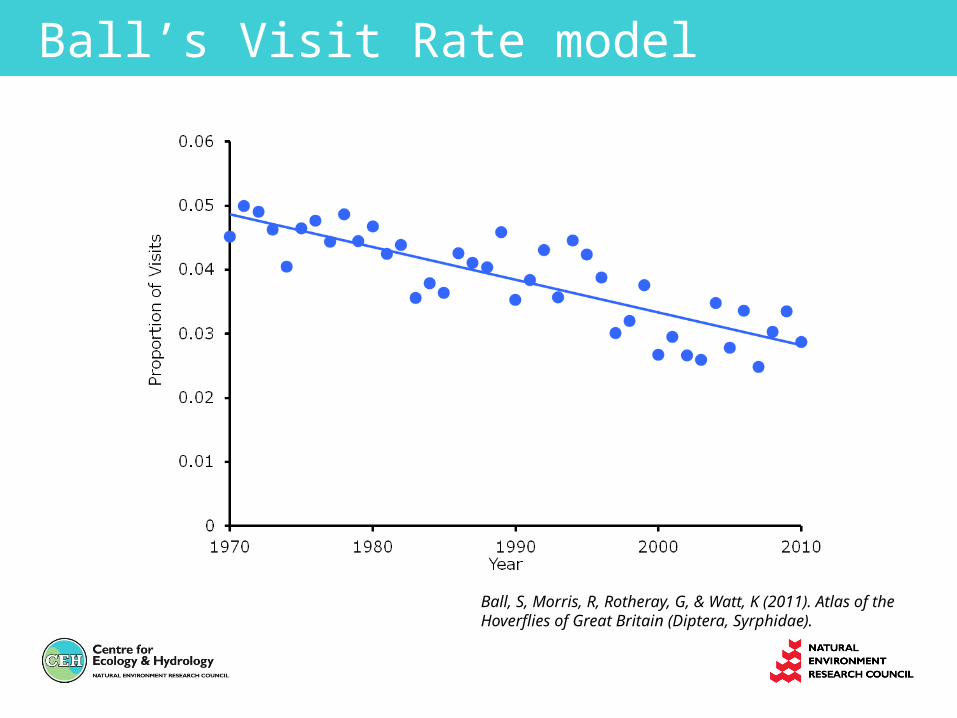
Ball’s Visit Rate model
Ball, S, Morris, R, Rotheray, G, & Watt, K (2011). Atlas of the Hoverflies of Great Britain (Diptera, Syrphidae).
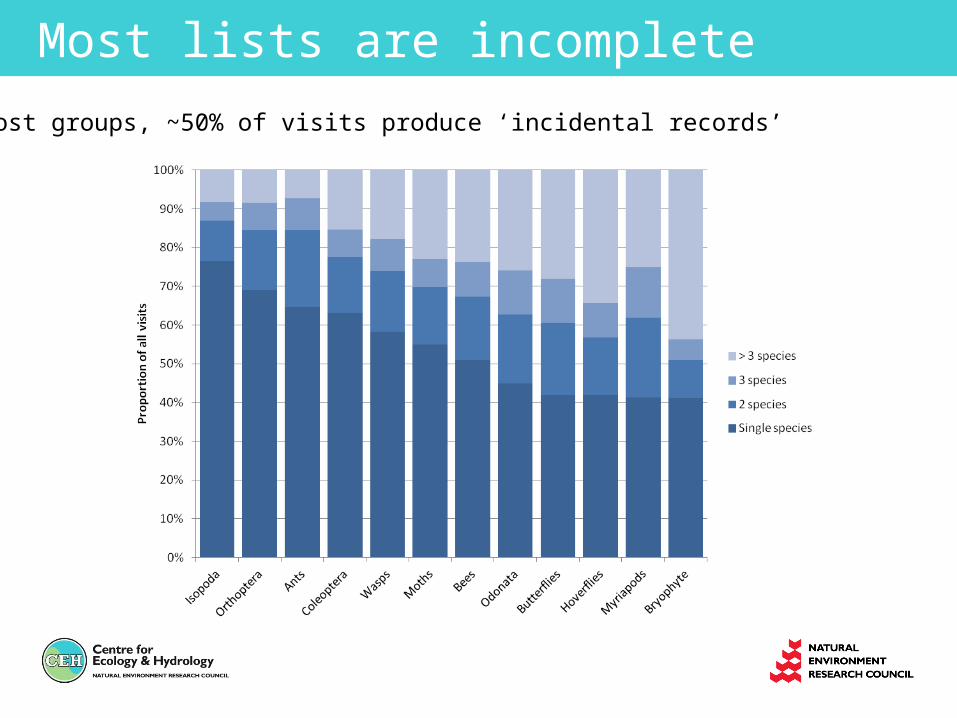
Most lists are incomplete
For most groups, ~50% of visits produce ‘incidental records’
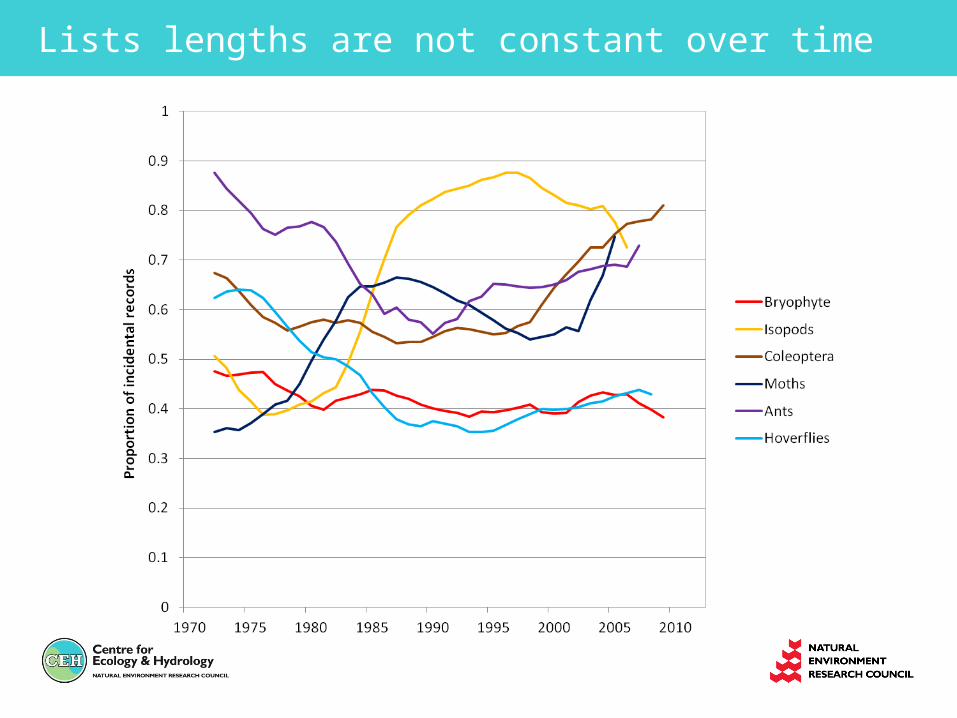
Lists lengths are not constant over time
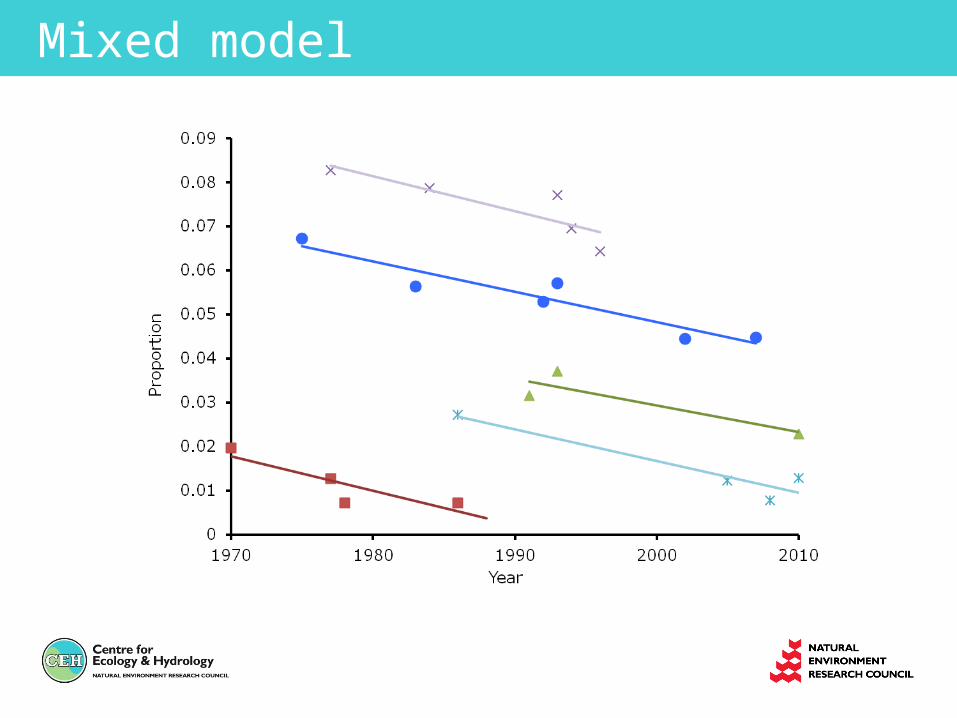
Mixed model
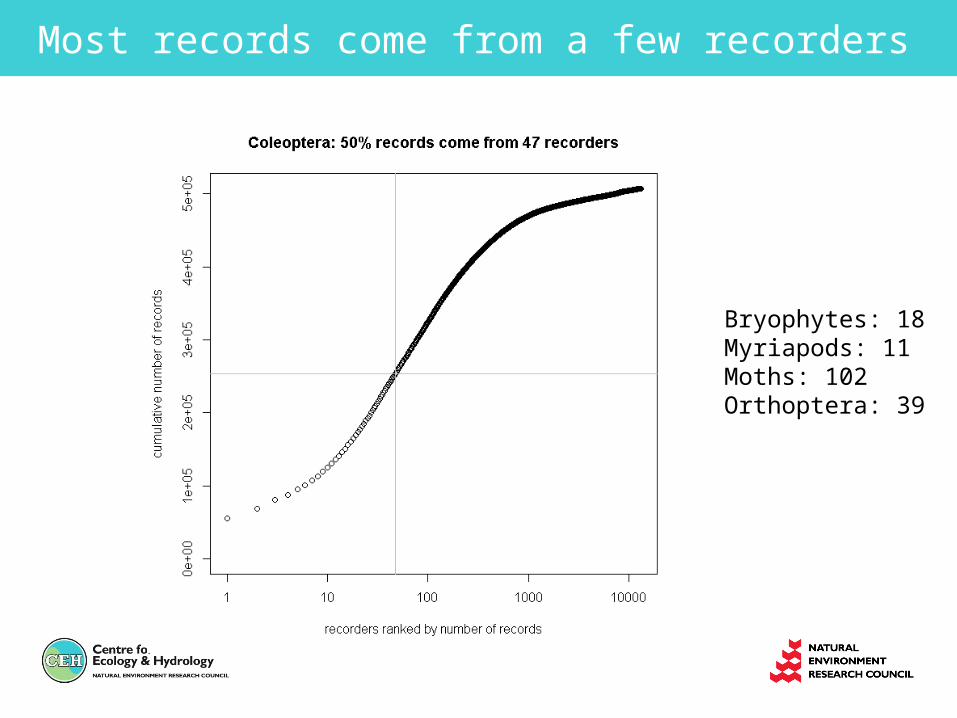
Most records come from a few recorders
Bryophytes: 18Myriapods: 11Moths: 102Orthoptera: 39
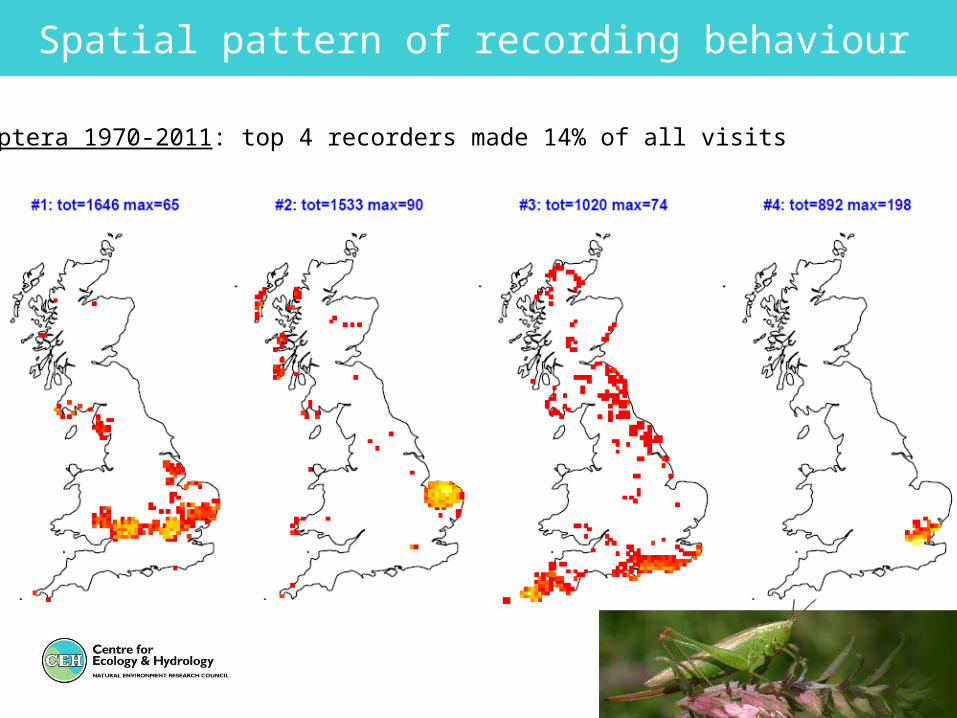
Spatial pattern of recording behaviour
Orthoptera 1970-2011: top 4 recorders made 14% of all visits
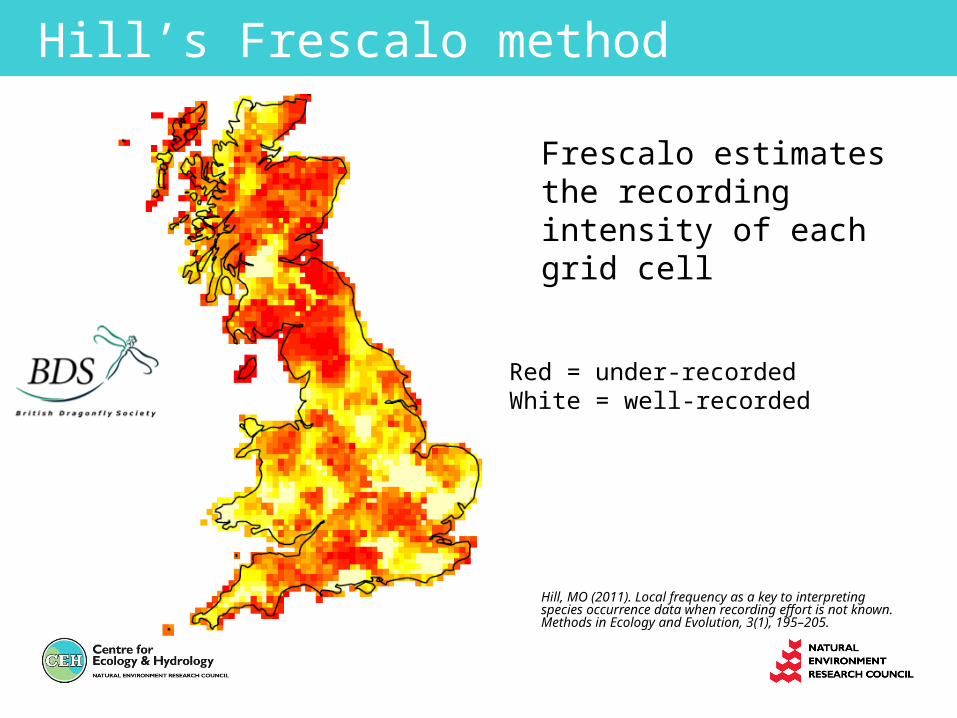
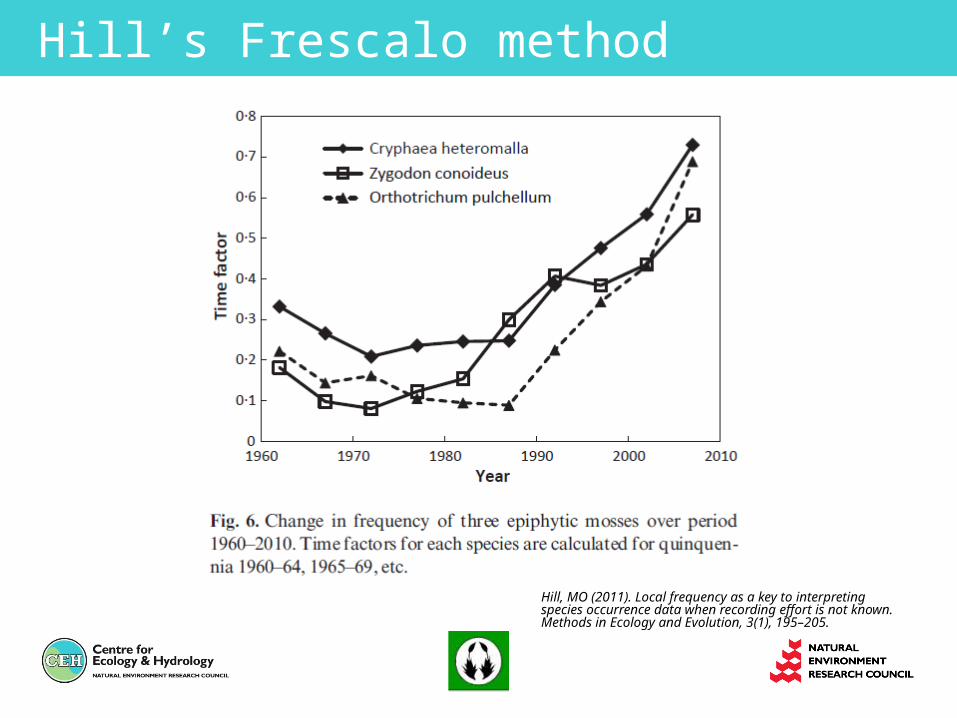
Hill’s Frescalo method
Hill, MO (2011). Local frequency as a key to interpreting species occurrence data when recording effort is not known. Methods in Ecology and Evolution, 3(1), 195–205.
Red = under-recordedWhite = well-recorded
Frescalo estimates the recording intensity of each grid cell
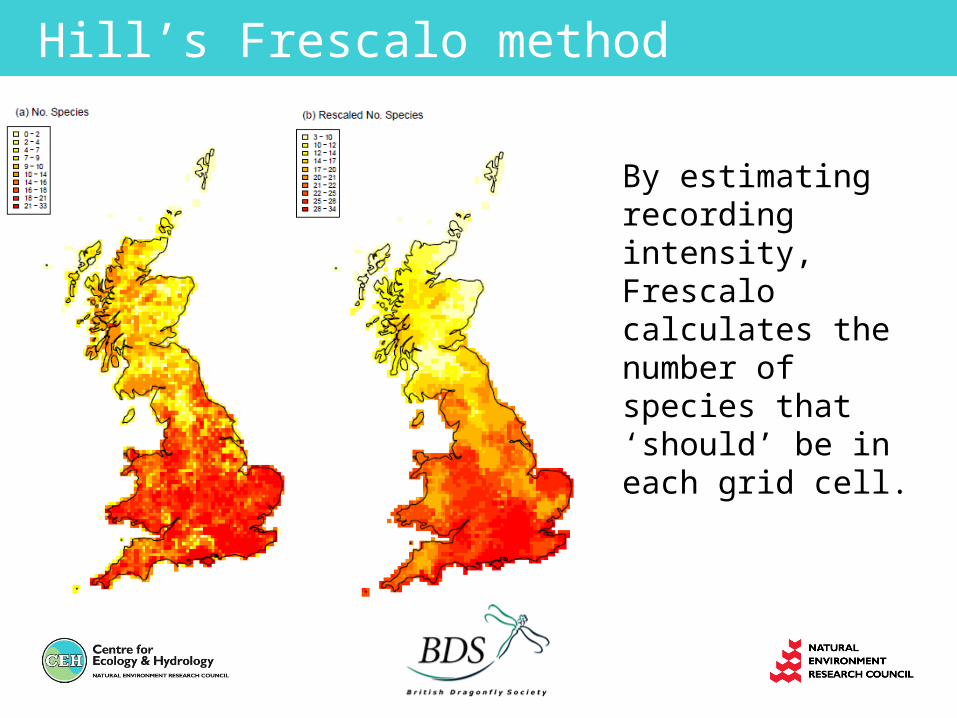
Hill’s Frescalo method
By estimating recording intensity, Frescalo calculates the number of species that ‘should’ be in each grid cell.
Hill’s Frescalo method
Hill, MO (2011). Local frequency as a key to interpreting species occurrence data when recording effort is not known. Methods in Ecology and Evolution, 3(1), 195–205.
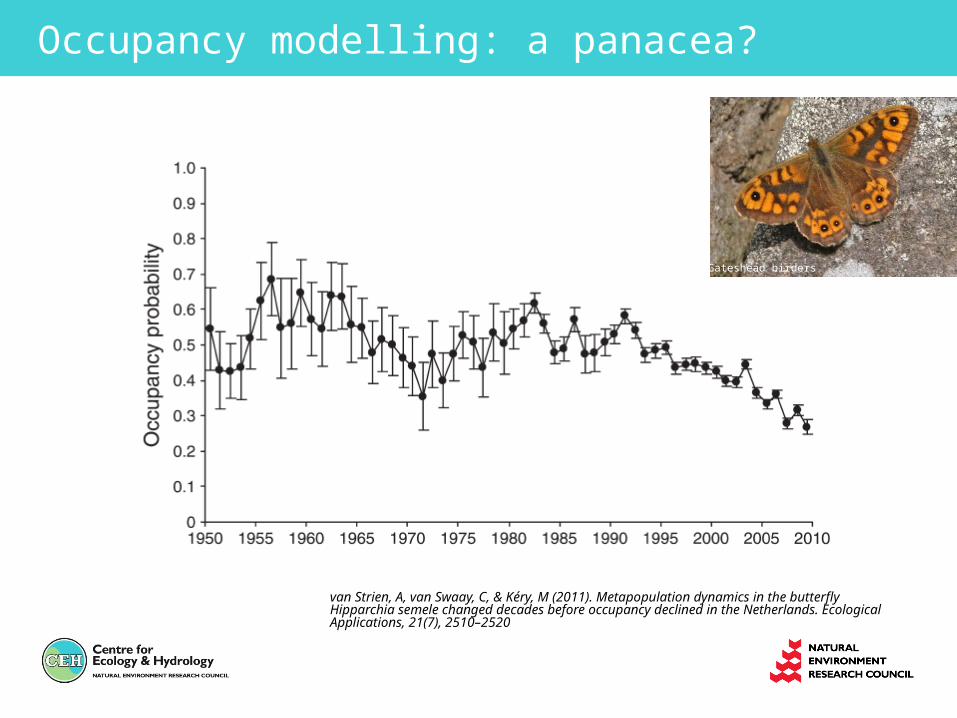
Occupancy modelling: a panacea?
van Strien, A, van Swaay, C, & Kéry, M (2011). Metapopulation dynamics in the butterfly Hipparchia semele changed decades before occupancy declined in the Netherlands. Ecological Applications, 21(7), 2510–2520
Gateshead birders
Talk outline
• Extracting trends from Biological records data• Problems & possible solutions
• Comparison of candidate methods• Simulations of recording behaviour• Which methods are useful for detecting trends?
• Applications: which species are declining?• Trends in Odonata 1970-2011• Biodiversity Indicator
Recorder behaviour
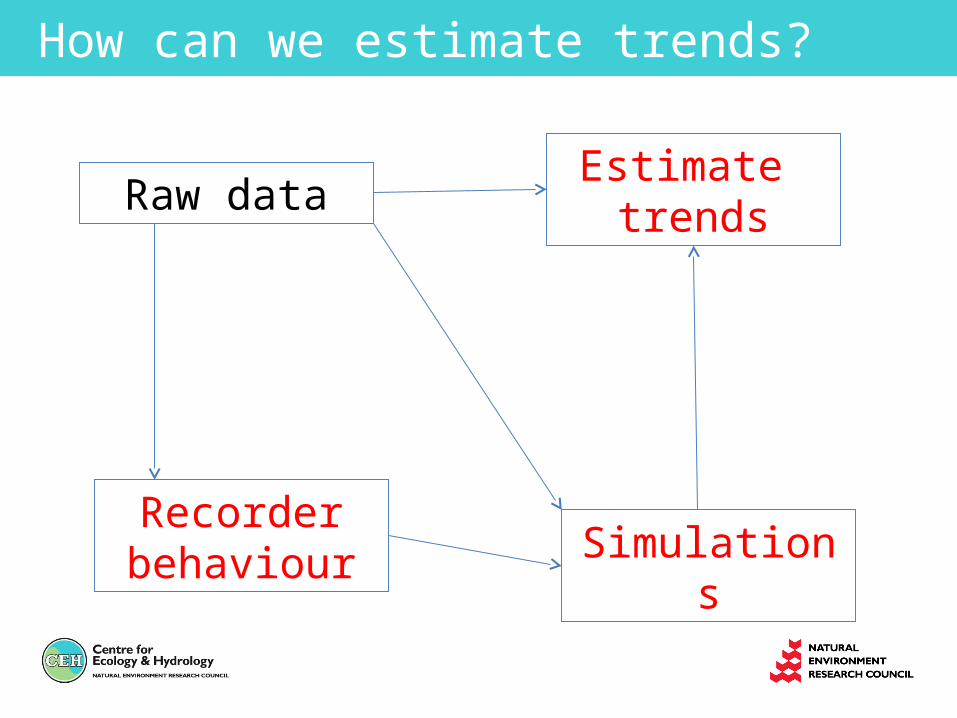
Estimate trendsRaw data
Simulations
How can we estimate trends?
Simulations
Aims:
1. To compare the performance of different methods for estimating range change under realistic scenarios of recorder behaviour
2. To discard methods that are inappropriate
3. To derive rules of thumb for when other methods are appropriate
Simulation overview
• 1000 sites (no spatial information)
• 1 focal species + 25 others
• Focal species occupies 50% sites
• Impose different patterns of recording
• Run for 10 years
• Estimate trends using different methods
Simulation patterns of recording
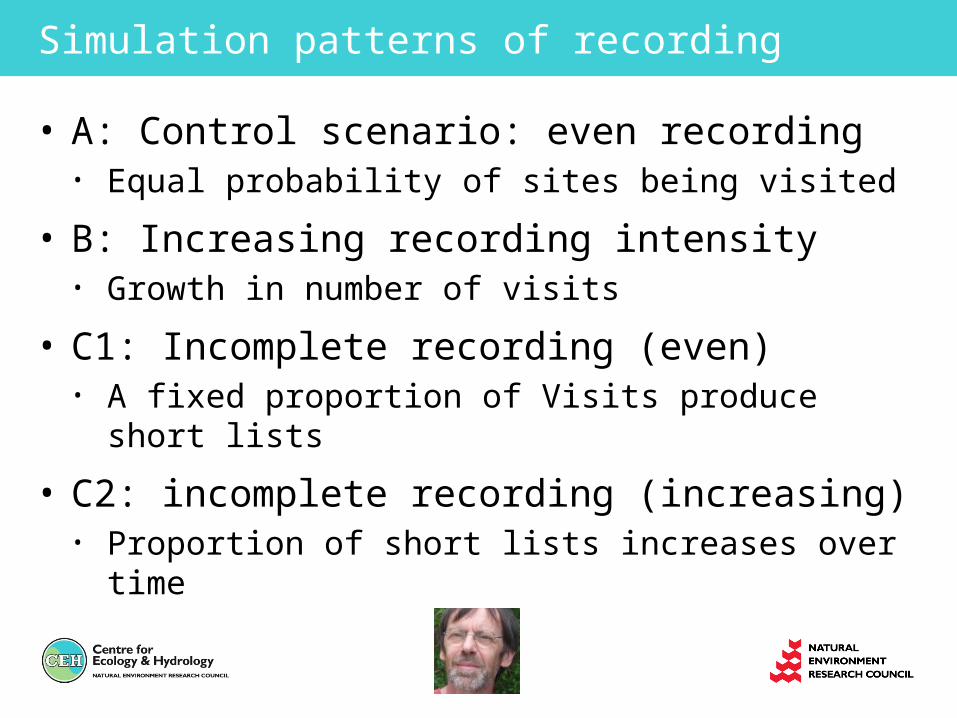
• A: Control scenario: even recording• Equal probability of sites being visited
• B: Increasing recording intensity• Growth in number of visits
• C1: Incomplete recording (even)• A fixed proportion of Visits produce short lists
• C2: incomplete recording (increasing)• Proportion of short lists increases over time
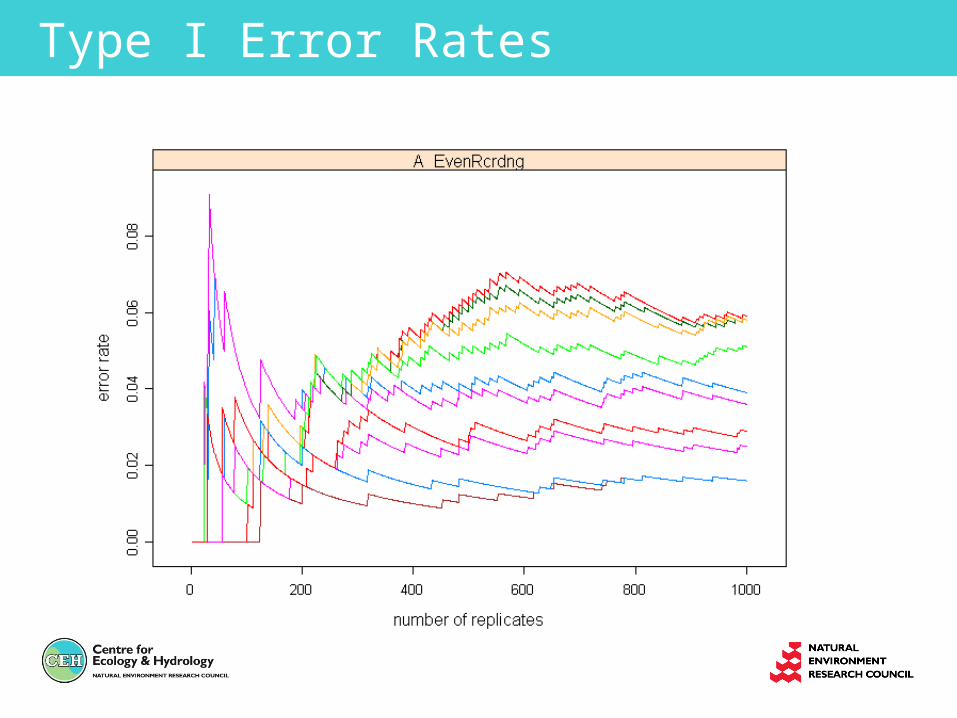
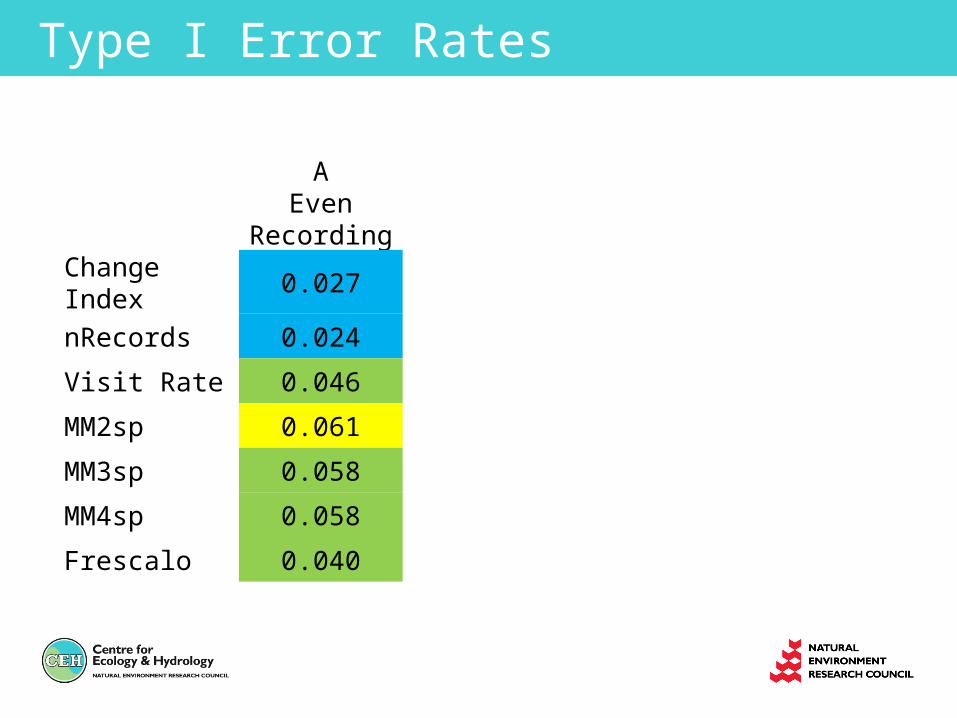
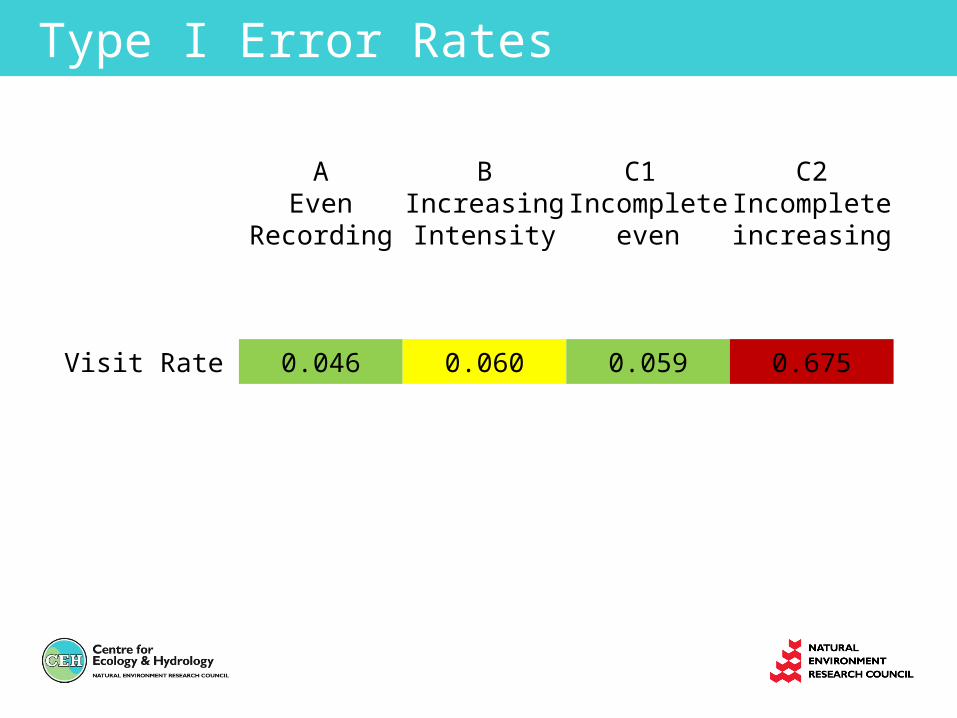
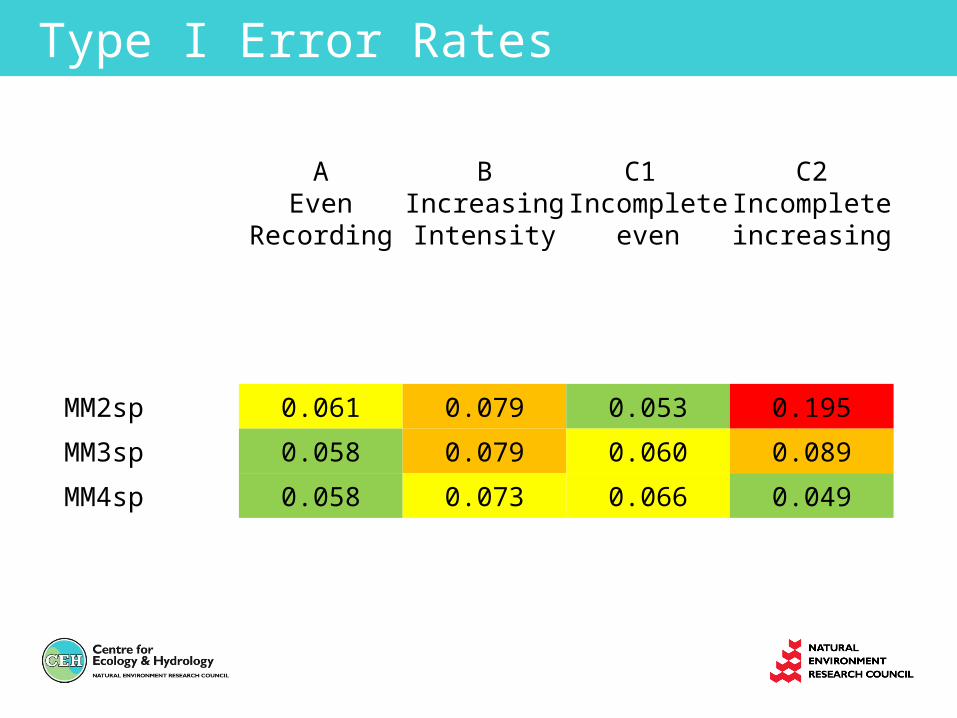
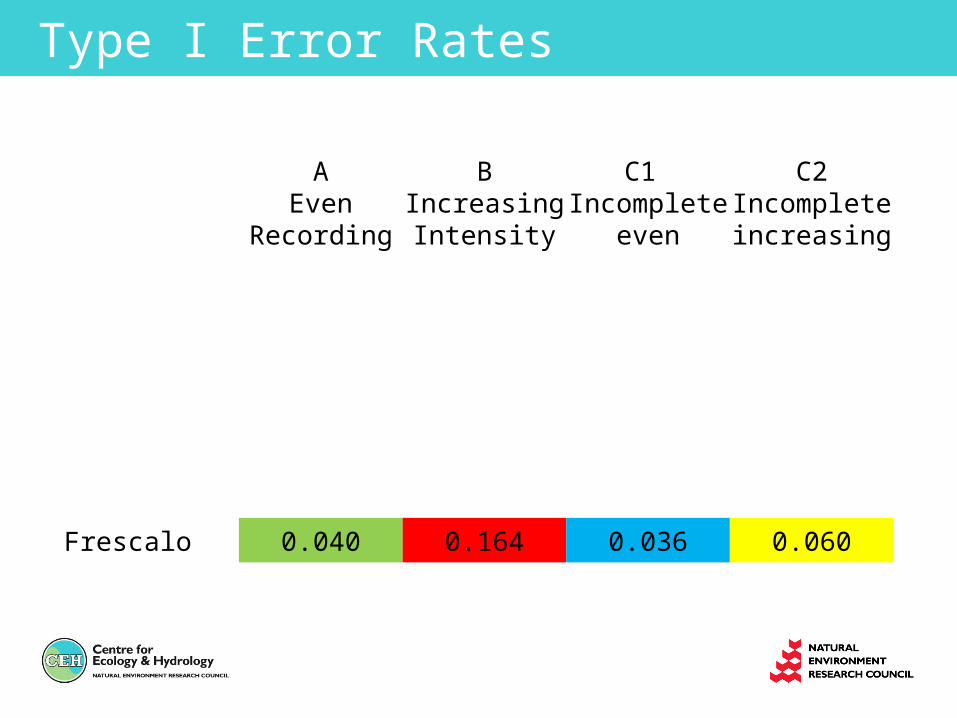
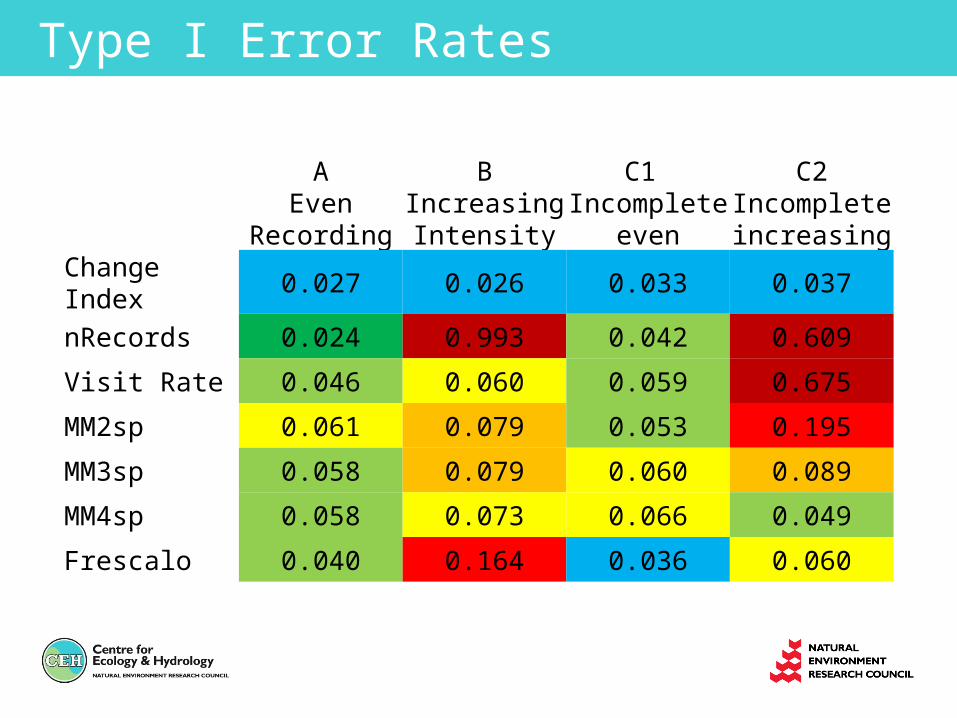
Type I Error Rates
Type I Error Rates
AEven
RecordingChange Index 0.027
nRecords 0.024
Visit Rate 0.046
MM2sp 0.061
MM3sp 0.058
MM4sp 0.058
Frescalo 0.040
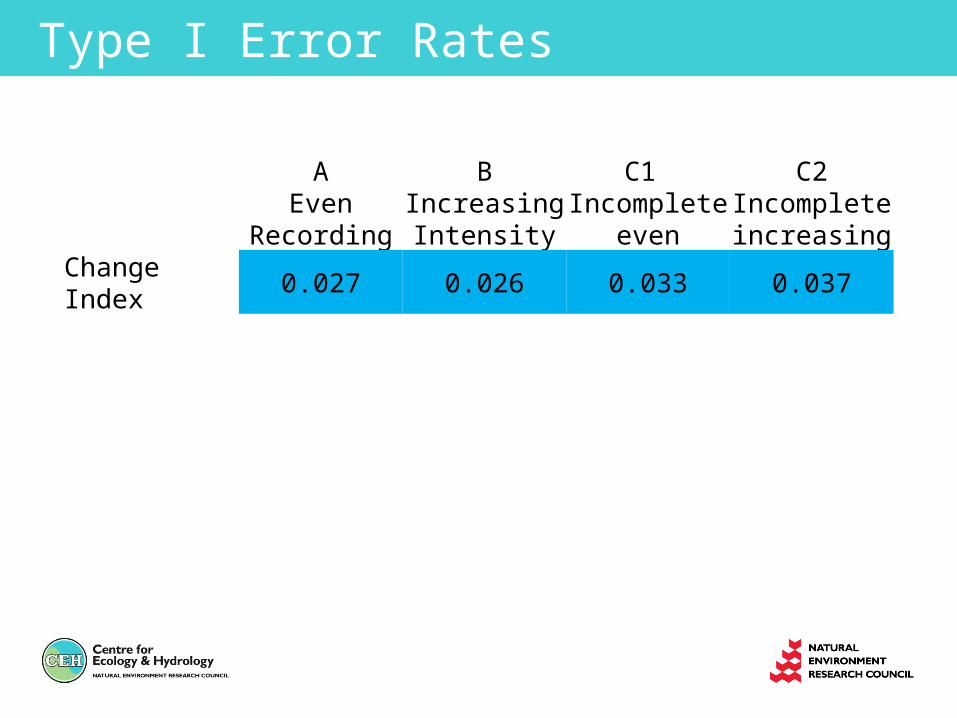
Type I Error Rates
AEven
Recording
BIncreasing Intensity
C1 Incomplete
even
C2Incomplete increasing
Change Index 0.027 0.026 0.033 0.037
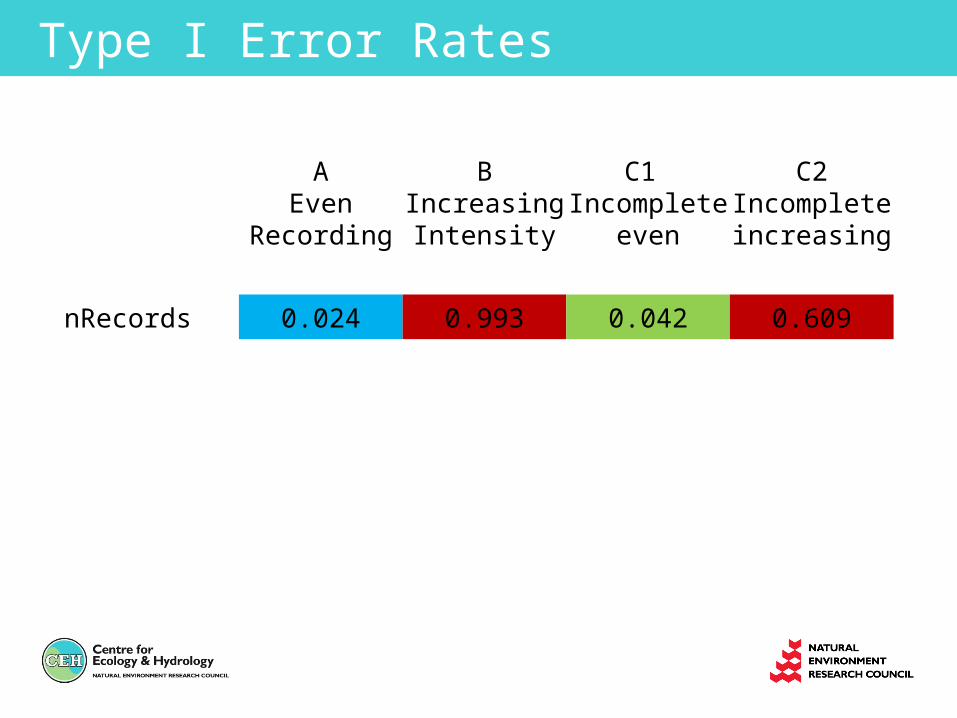
Type I Error Rates
AEven
Recording
BIncreasing Intensity
C1 Incomplete
even
C2Incomplete increasing
nRecords 0.024 0.993 0.042 0.609
Type I Error Rates
AEven
Recording
BIncreasing Intensity
C1 Incomplete
even
C2Incomplete increasing
Visit Rate 0.046 0.060 0.059 0.675
Type I Error Rates
AEven
Recording
BIncreasing Intensity
C1 Incomplete
even
C2Incomplete increasing
MM2sp 0.061 0.079 0.053 0.195
MM3sp 0.058 0.079 0.060 0.089
MM4sp 0.058 0.073 0.066 0.049
Type I Error Rates
AEven
Recording
BIncreasing Intensity
C1 Incomplete
even
C2Incomplete increasing
Frescalo 0.040 0.164 0.036 0.060
Type I Error Rates
AEven
Recording
BIncreasing Intensity
C1 Incomplete
even
C2Incomplete increasing
Change Index 0.027 0.026 0.033 0.037
nRecords 0.024 0.993 0.042 0.609
Visit Rate 0.046 0.060 0.059 0.675
MM2sp 0.061 0.079 0.053 0.195
MM3sp 0.058 0.079 0.060 0.089
MM4sp 0.058 0.073 0.066 0.049
Frescalo 0.040 0.164 0.036 0.060
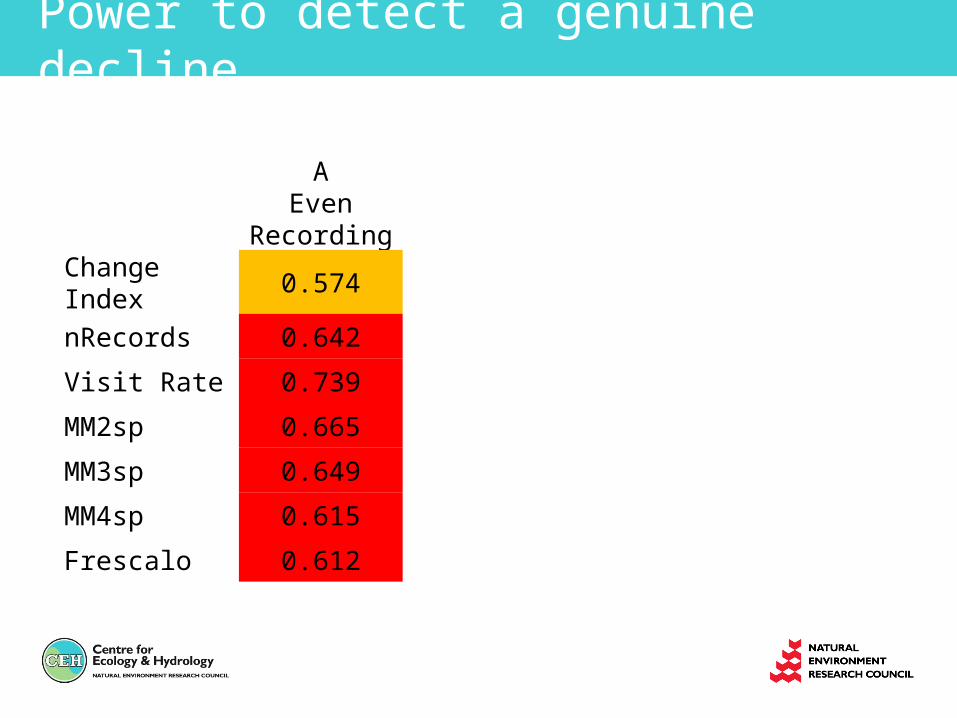
Power to detect a genuine decline
AEven
RecordingChange Index 0.574
nRecords 0.642
Visit Rate 0.739
MM2sp 0.665
MM3sp 0.649
MM4sp 0.615
Frescalo 0.612
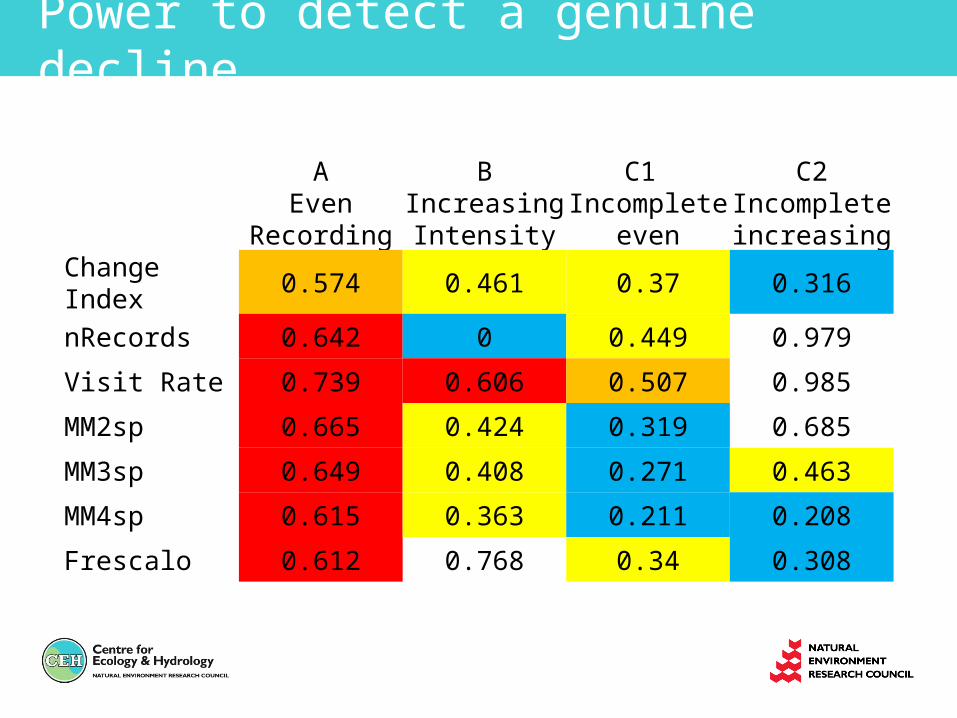
Power to detect a genuine decline
AEven
Recording
BIncreasing Intensity
C1 Incomplete
even
C2Incomplete increasing
Change Index 0.574 0.461 0.37 0.316
nRecords 0.642 0 0.449 0.979
Visit Rate 0.739 0.606 0.507 0.985
MM2sp 0.665 0.424 0.319 0.685
MM3sp 0.649 0.408 0.271 0.463
MM4sp 0.615 0.363 0.211 0.208
Frescalo 0.612 0.768 0.34 0.308
Simulations: Conclusions
• The simulation provides a framework for comparing methods under a range of recording scenarios
• The Mixed model method performs best so far (Frescalo & Occupancy results pending)
• In the best recording scenario, a decline of 30% was detected in 60% of simulated datasets
Talk outline
• Extracting trends from Biological records data• Problems & possible solutions
• Comparison of candidate methods• Simulations of recording behaviour• Which methods are useful for detecting trends?
• Applications: which species are declining?• Trends in Odonata 1970-2011• Biodiversity Indicator
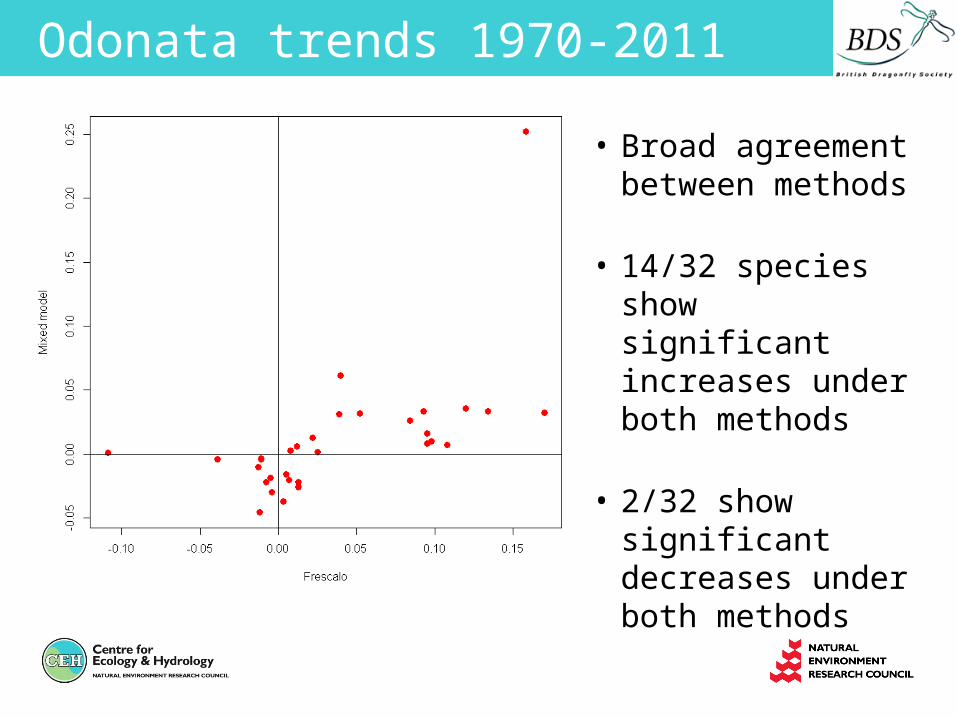
Odonata trends 1970-2011
• Broad agreement between methods
• 14/32 species show significant increases under both methods
• 2/32 show significant decreases under both methods
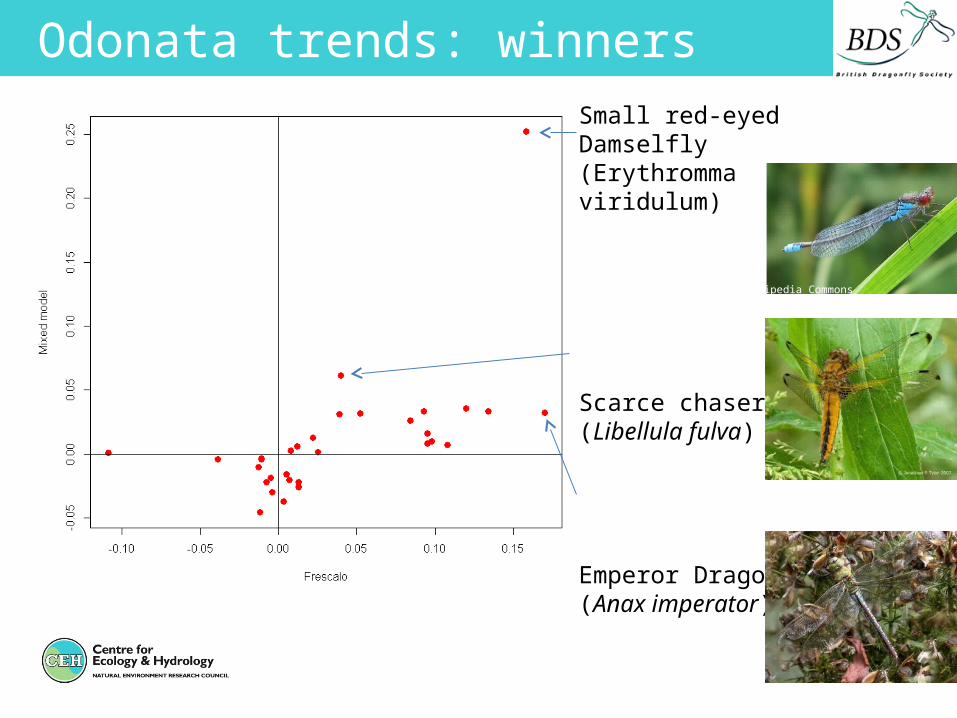
Odonata trends: winners
Wikipedia Commons
Small red-eyed Damselfly(Erythromma viridulum)
Scarce chaser(Libellula fulva)
Emperor Dragonfly(Anax imperator)
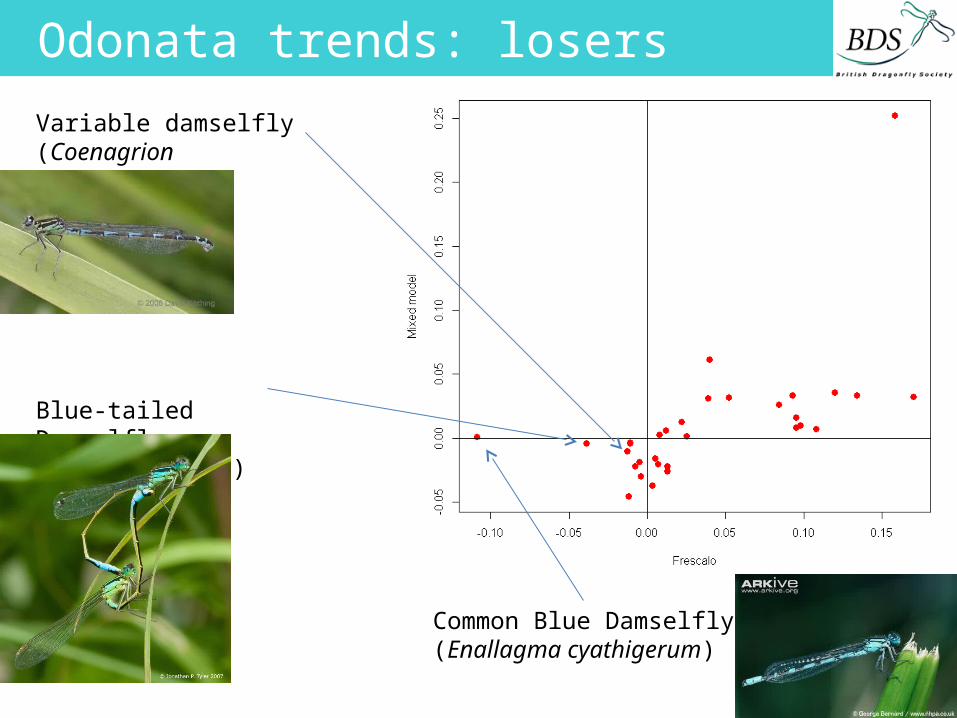
Odonata trends: losers
Variable damselfly(Coenagrion pulchellum)
Blue-tailed Damselfly(Ischnura elegans)
Common Blue Damselfly(Enallagma cyathigerum)
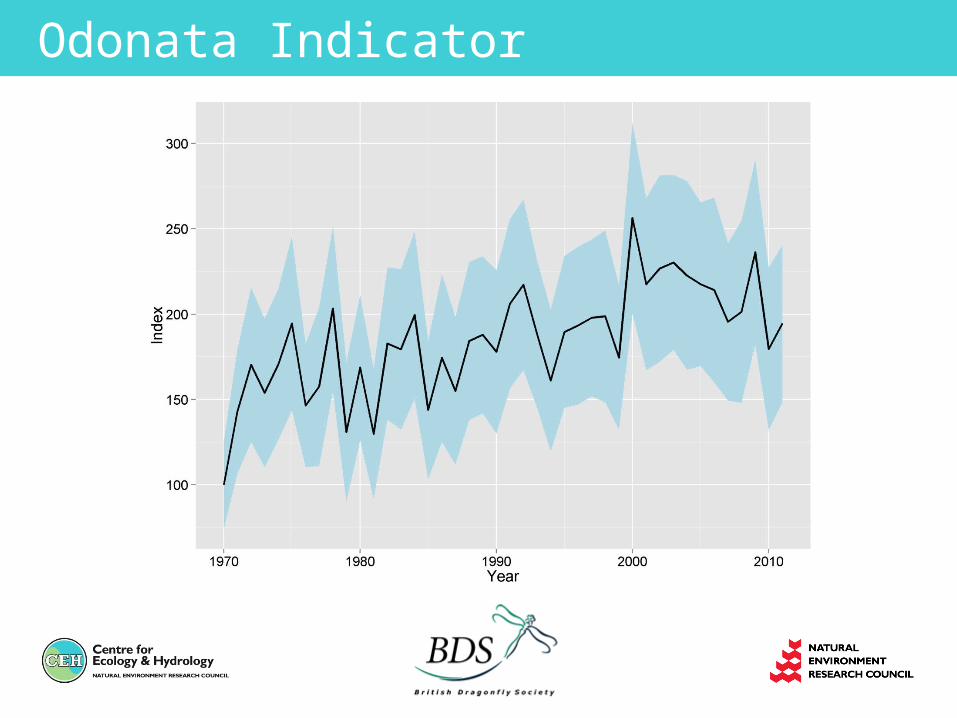
Odonata Indicator
Biological Recording for the 21st Century
• We have the tools to model biodiversity change using unstructured biological records
• This is only possible if records continue to be submitted to the database!
• We could be smarter about data collection
• We’re only just beginning to exploit the potential of biological recording data• Indicators, Red Listing, ecosystem service provision,
targeting Agri-environment schemes

AcknowledgmentsTom AugustColin HarrowerDavid Roy, Helen Roy, Michael Pocock, Gary Powney, Chris PrestonMark HillArco van Strien