Embed Size (px)
Citation preview

NI DIAdemTM
Data Acquisition and Visualization
NI DIAdem: Data Acquisition and Visualization
May 2017374987F-01

Support
Worldwide Technical Support and Product Informationni.com
Worldwide Offices
Visit ni.com/niglobal to access the branch office websites, which provide up-to-date contact information, support phone numbers, email addresses, and current events.
National Instruments Corporate Headquarters
11500 North Mopac Expressway Austin, Texas 78759-3504 USA Tel: 512 683 0100
For further support information, refer to the NI Services appendix. To comment on NI documentation, refer to the NI website at ni.com/info and enter the Info Code feedback.
© 2008–2017 National Instruments Ireland Resources Limited. All rights reserved..

Legal Information
Limited WarrantyThis document is provided ‘as is’ and is subject to being changed, without notice, in future editions. For the latest version, refer to ni.com/manuals. NI reviews this document carefully for technical accuracy; however, NI MAKES NO EXPRESS OR IMPLIED WARRANTIES AS TO THE ACCURACY OF THE INFORMATION CONTAINED HEREIN AND SHALL NOT BE LIABLE FOR ANY ERRORS.NI warrants that its hardware products will be free of defects in materials and workmanship that cause the product to fail to substantially conform to the applicable NI published specifications for one (1) year from the date of invoice.For a period of ninety (90) days from the date of invoice, NI warrants that (i) its software products will perform substantially in accordance with the applicable documentation provided with the software and (ii) the software media will be free from defects in materials and workmanship.If NI receives notice of a defect or non-conformance during the applicable warranty period, NI will, in its discretion: (i) repair or replace the affected product, or (ii) refund the fees paid for the affected product. Repaired or replaced Hardware will be warranted for the remainder of the original warranty period or ninety (90) days, whichever is longer. If NI elects to repair or replace the product, NI may use new or refurbished parts or products that are equivalent to new in performance and reliability and are at least functionally equivalent to the original part or product.You must obtain an RMA number from NI before returning any product to NI. NI reserves the right to charge a fee for examining and testing Hardware not covered by the Limited Warranty.This Limited Warranty does not apply if the defect of the product resulted from improper or inadequate maintenance, installation, repair, or calibration (performed by a party other than NI); unauthorized modification; improper environment; use of an improper hardware or software key; improper use or operation outside of the specification for the product; improper voltages; accident, abuse, or neglect; or a hazard such as lightning, flood, or other act of nature.THE REMEDIES SET FORTH ABOVE ARE EXCLUSIVE AND THE CUSTOMER’S SOLE REMEDIES, AND SHALL APPLY EVEN IF SUCH REMEDIES FAIL OF THEIR ESSENTIAL PURPOSE.EXCEPT AS EXPRESSLY SET FORTH HEREIN, PRODUCTS ARE PROVIDED "AS IS" WITHOUT WARRANTY OF ANY KIND AND NI DISCLAIMS ALL WARRANTIES, EXPRESSED OR IMPLIED, WITH RESPECT TO THE PRODUCTS, INCLUDING ANY IMPLIED WARRANTIES OF MERCHANTABILITY, FITNESS FOR A PARTICULAR PURPOSE, TITLE OR NON-INFRINGEMENT, AND ANY WARRANTIES THAT MAY ARISE FROM USAGE OF TRADE OR COURSE OF DEALING. NI DOES NOT WARRANT, GUARANTEE, OR MAKE ANY REPRESENTATIONS REGARDING THE USE OF OR THE RESULTS OF THE USE OF THE PRODUCTS IN TERMS OF CORRECTNESS, ACCURACY, RELIABILITY, OR OTHERWISE. NI DOES NOT WARRANT THAT THE OPERATION OF THE PRODUCTS WILL BE UNINTERRUPTED OR ERROR FREE.In the event that you and NI have a separate signed written agreement with warranty terms covering the products, then the warranty terms in the separate agreement shall control.CopyrightUnder the copyright laws, this publication may not be reproduced or transmitted in any form, electronic or mechanical, including photocopying, recording, storing in an information retrieval system, or translating, in whole or in part, without the prior written consent of National Instruments Corporation.National Instruments respects the intellectual property of others, and we ask our users to do the same. NI software is protected by copyright and other intellectual property laws. Where NI software may be used to reproduce software or other materials belonging to others, you may use NI software only to reproduce materials that you may reproduce in accordance with the terms of any applicable license or other legal restriction.End-User License Agreements and Third-Party Legal NoticesYou can find end-user license agreements (EULAs) and third-party legal notices in the following locations:• Notices are located in the <National Instruments>\_Legal Information and <National Instruments>
directories.• EULAs are located in the <National Instruments>\Shared\MDF\Legal\license directory.• Review <National Instruments>\_Legal Information.txt for information on including legal information in
installers built with NI products.U.S. Government Restricted RightsIf you are an agency, department, or other entity of the United States Government (“Government”), the use, duplication, reproduction, release, modification, disclosure or transfer of the technical data included in this manual is governed by the Restricted Rights provisions under Federal Acquisition Regulation 52.227-14 for civilian agencies and Defense Federal Acquisition Regulation Supplement Section 252.227-7014 and 252.227-7015 for military agencies.TrademarksRefer to the NI Trademarks and Logo Guidelines at ni.com/trademarks for more information on NI trademarks.ARM, Keil, and µVision are trademarks or registered of ARM Ltd or its subsidiaries.LEGO, the LEGO logo, WEDO, and MINDSTORMS are trademarks of the LEGO Group.TETRIX by Pitsco is a trademark of Pitsco, Inc.FIELDBUS FOUNDATION™ and FOUNDATION™ are trademarks of the Fieldbus Foundation.EtherCAT® is a registered trademark of and licensed by Beckhoff Automation GmbH.

CANopen® is a registered Community Trademark of CAN in Automation e.V.DeviceNet™ and EtherNet/IP™ are trademarks of ODVA.Go!, SensorDAQ, and Vernier are registered trademarks of Vernier Software & Technology. Vernier Software & Technology and vernier.com are trademarks or trade dress.Xilinx is the registered trademark of Xilinx, Inc.Taptite and Trilobular are registered trademarks of Research Engineering & Manufacturing Inc.FireWire® is the registered trademark of Apple Inc.Linux® is the registered trademark of Linus Torvalds in the U.S. and other countries.Handle Graphics®, MATLAB®, Simulink®, Stateflow®, and xPC TargetBox® are registered trademarks, and Simulink Coder™, TargetBox™, and Target Language Compiler™ are trademarks of The MathWorks, Inc.Tektronix®, Tek, and Tektronix, Enabling Technology are registered trademarks of Tektronix, Inc.The Bluetooth® word mark is a registered trademark owned by the Bluetooth SIG, Inc.The ExpressCard™ word mark and logos are owned by PCMCIA and any use of such marks by National Instruments is under license.The mark LabWindows is used under a license from Microsoft Corporation. Windows is a registered trademark of Microsoft Corporation in the United States and other countries.Other product and company names mentioned herein are trademarks or trade names of their respective companies.Members of the National Instruments Alliance Partner Program are business entities independent from NI and have no agency, partnership, or joint-venture relationship with NI.PatentsFor patents covering NI products/technology, refer to the appropriate location: Help»Patents in your software, the patents.txt file on your media, or the National Instruments Patent Notice at ni.com/patents.Export Compliance InformationRefer to the Export Compliance Information at ni.com/legal/export-compliance for the NI global trade compliance policy and how to obtain relevant HTS codes, ECCNs, and other import/export data.WARNING REGARDING USE OF NATIONAL INSTRUMENTS PRODUCTSYOU ARE ULTIMATELY RESPONSIBLE FOR VERIFYING AND VALIDATING THE SUITABILITY AND RELIABILITY OF THE PRODUCTS WHENEVER THE PRODUCTS ARE INCORPORATED IN YOUR SYSTEM OR APPLICATION, INCLUDING THE APPROPRIATE DESIGN, PROCESS, AND SAFETY LEVEL OF SUCH SYSTEM OR APPLICATION.PRODUCTS ARE NOT DESIGNED, MANUFACTURED, OR TESTED FOR USE IN LIFE OR SAFETY CRITICAL SYSTEMS, HAZARDOUS ENVIRONMENTS OR ANY OTHER ENVIRONMENTS REQUIRING FAIL-SAFE PERFORMANCE, INCLUDING IN THE OPERATION OF NUCLEAR FACILITIES; AIRCRAFT NAVIGATION; AIR TRAFFIC CONTROL SYSTEMS; LIFE SAVING OR LIFE SUSTAINING SYSTEMS OR SUCH OTHER MEDICAL DEVICES; OR ANY OTHER APPLICATION IN WHICH THE FAILURE OF THE PRODUCT OR SERVICE COULD LEAD TO DEATH, PERSONAL INJURY, SEVERE PROPERTY DAMAGE OR ENVIRONMENTAL HARM (COLLECTIVELY, “HIGH-RISK USES”). FURTHER, PRUDENT STEPS MUST BE TAKEN TO PROTECT AGAINST FAILURES, INCLUDING PROVIDING BACK-UP AND SHUT-DOWN MECHANISMS. NI EXPRESSLY DISCLAIMS ANY EXPRESS OR IMPLIED WARRANTY OF FITNESS OF THE PRODUCTS OR SERVICES FOR HIGH-RISK USES.
© National Instruments Ireland Resources Limited | v
Contents
About This ManualRelated Documentation .................................................................................................... ix
Chapter 1The Block Diagram Describes the Measurement TaskCreating Block Diagrams ................................................................................................. 1-1Connecting Blocks with Buses to Create a Block Diagram ............................................. 1-2
Buses Differ According to the Signals They Transport ........................................... 1-3Buses Contain Multiple Signals ............................................................................... 1-3
Combining Subtasks into Subblock Diagrams ................................................................. 1-4Editing Block Diagrams ................................................................................................... 1-6DIAdem DAC Function Groups....................................................................................... 1-7
System ...................................................................................................................... 1-8Driver Inputs and Driver Outputs ............................................................................. 1-8Simulation Inputs and Simulation Outputs............................................................... 1-9Scaling ...................................................................................................................... 1-10Processing................................................................................................................. 1-10Control ...................................................................................................................... 1-11
Chapter 2Visualizing Data and Operating FacilitiesCreating a Visualization ................................................................................................... 2-1Editing a Visualization ..................................................................................................... 2-2
Working with VISUAL Pages.................................................................................. 2-3Visualization Settings ............................................................................................... 2-3
DIAdem VISUAL Function Groups................................................................................. 2-3Manual Instruments .................................................................................................. 2-4Curve Display, Wiper and Spike Display, and Recorder Display............................ 2-4XY Display ............................................................................................................... 2-5Gauge Display .......................................................................................................... 2-5Bar Display ............................................................................................................... 2-6Alphanumeric Display.............................................................................................. 2-6Binary and Status Display ........................................................................................ 2-7Image and Video Display ......................................................................................... 2-7
Chapter 3Working with Packet ProcessingProcessing Single Values.................................................................................................. 3-1Processing Data Packets ................................................................................................... 3-1Using Packet Functions in the Block Diagram................................................................. 3-2
Block Size and Sampling Rate Determine the Data Packet Flow ............................ 3-3

Contents
vi | ni.com
Packet Processing Functions.............................................................................................3-4Packet Functions for Signal Processing....................................................................3-4Packet Functions for Signal Analysis .......................................................................3-5Packet Functions for Display and File Access..........................................................3-6Packet Functions for Data Acquisition and Output ..................................................3-7Complete Selection of Packet Functions ..................................................................3-7
Chapter 4Monitoring Processes with the Alarm SystemDefining Alarms ...............................................................................................................4-2
Specifying Alarm Attributes .....................................................................................4-3Creating Protocols.............................................................................................................4-4Setting Up User Management...........................................................................................4-5Alarm System Functions...................................................................................................4-6
Chapter 5Installing Measurement Hardware and Communicating via InterfacesInstalling Measurement Hardware....................................................................................5-1
Installing the Hardware Drivers................................................................................5-1Registering and Configuring DIAdem Drivers.........................................................5-2
Communicating via Interfaces ..........................................................................................5-4Using OPC ................................................................................................................5-4Using NI-XNET........................................................................................................5-4Using ECU Measurement and Calibration Toolkit Driver .......................................5-4Using Control File Drivers .......................................................................................5-5Using Script Drivers .................................................................................................5-5
Chapter 6The Basics of Data Acquisition with DIAdemComputer-Based Signal Acquisition ................................................................................6-1
Communication with Measurement Hardware .........................................................6-2Parameters for A/D Conversion................................................................................6-2
Measurement Mode ..........................................................................................6-2Resolution .........................................................................................................6-3Measurement Range and Gain..........................................................................6-3Sampling Rate...................................................................................................6-4Anti-Aliasing Filter...........................................................................................6-5
Computer-Based Signal Output ........................................................................................6-7Measurement Acquisition with Interrupts ........................................................................6-7Different DIAdem Measurement Modes ..........................................................................6-8
Software Clock with Windows Timing ....................................................................6-8Software Clock with Windows Timing ....................................................................6-9Hardware Clock ........................................................................................................6-9
NI DIAdem: Data Acquisition and Visualization
© National Instruments Ireland Resources Limited | vii
Appendix ANI Services
Index
© National Instruments Ireland Resources Limited | ix
About This Manual
The manual DIAdem: Acquiring and Visualizing Data explains how to create block diagrams for solving measurement tasks and how to design visualizations. With DIAdem DAC and DIAdem VISUAL, you acquire data, control processes, and visualize data. In DIAdem DAC you create block diagrams to acquire measurement values and to process and output the measurement values during the measurement. In DIAdem VISUAL you design the visualization to display the acquired and calculated measurement values and to influence the measurement with input instruments.
Use packet processing to acquire data in packets, process the data and display the data in 3D. You can monitor processes with the alarm system. Furthermore, this manual describes how to configure measurement hardware and outlines the basics of digital data acquisition as well as the measurement types available in DIAdem.
Related DocumentationFor more information on DIAdem, refer to the following documentation:• Getting Started with DIAdem
You can use the getting started guide to familiarize yourself with DIAdem functions and how to use them. This manual contains exercises that show you how to acquire, find, analyze, and present data and to combine all work steps in a script.
• NI DIAdem: Data Mining, Analysis, and Report GenerationThis DIAdem manual explains the structure of DIAdem and how to use DIAdem to find data, to run analyses, to create reports, and to combine all functions in a script.
• You can open the DIAdem Help in every dialog box with the Help button, on the toolbar with Help»Contents, or with <F1>. The DIAdem Help offers procedures and dialog box help for each panel, and references for programmers.

© National Instruments Ireland Resources Limited | 1-1
1The Block Diagram Describes the Measurement Task
In DIAdem DAC, you create block diagrams in order to acquire, to process, to visualize, and to output measurement values. For each function, you select a block from a function group, position the block in the workspace, and connect the block to other blocks. Double-click a block to configure the block in dialog boxes.
Figure 1-1. DIAdem DAC
Creating Block Diagrams You start a block diagram on the left side in the workspace with a data source, for example, a driver input from the installed hardware, use blocks for scaling and processing, and the data ends in the display instruments on the right. The data in the block diagram does not always flow from left to right, but it always flows from block outputs to block inputs.
A simple block diagram consists of a data source and a display instrument. If you want to use an inbuilt National Instruments measurement board as the data source, click NI-DAQmx Driver in the Driver Inputs function group. Then open the Display Instruments function group and click Curve. DIAdem inserts the blocks in the top left-hand corner of the workspace. Position the Curve display block to the right of the driver block. Click the data output on the right edge of the driver block and drag the crosshair to the data input on the left edge of the Curve display. Click the data input of the Curve display as soon as OK appears next to the crosshair. DIAdem connects the two blocks with a green data bus. Double-click the NIDAQ-In driver block and select the signals you want to display, from the channels defined in the Measurement & Automation Explorer.
To display the measurement values, click Start Display on the toolbar. DIAdem switches to the VISUAL panel and displays the selected signals as curves. To stop the display, click Stop Measurement on the toolbar. You also can press <Esc> to abort a measurement.

1-2 | ni.com
Chapter 1 The Block Diagram Describes the Measurement Task
If you use a block to save the measurement values in the block diagram, you must click Start Measurement so that DIAdem can visualize measurement values and can save the measurement values in the Data Portal or in a file. To save the measurement values without visualizing them, select Measure»Measurement (Without Display). In the Save block, you specify where to save the data and also the maximum number of measurement values to be saved and the measurement length. Select Measure»Last Measurement Status to see how long the last measurement with data storage took and how many values DIAdem saved. Before starting a measurement, DIAdem checks the block diagram and displays corrupt connections and settings. Use the Check Block Diagram function to find errors when you create block diagrams.
To create and test a block diagram independently of a measurement hardware, open the function group Simulation Inputs first, and use the blocks Random, Noise, or Function Generator as data sources. You also can use input instruments, data files, data channels of the Data Portal and calculation results from processing blocks as hardware-independent data sources. In the second step you exchange the simulation blocks for driver blocks. To replace a block, drop the driver input onto the simulation input in the block diagram. DIAdem replaces the simulation block with the driver block and transfers the common settings, such as the block name and the number of signals.
Connecting Blocks with Buses to Create a Block DiagramThe task determines which block you select and how you connect the blocks in a block diagram. You can connect blocks to blocks, blocks to buses, and buses to buses. If you click an output or an input of a block, the beginning of a new bus appears with a crosshair at the tip. Click a bus and press the left mouse button to create a new bus. Drag the crosshair over an input or a bus that is the same color, until DIAdem displays OK at the crosshair. Release the left mouse button for DIAdem to create the connection. If DIAdem displays a crossed out crosshair, you cannot connect the blocks.
If you drag a bus away from another bus, DIAdem displays the branch as a circle. When you join two buses, DIAdem displays a small square at the input node. The triangles in the square indicate which buses deliver signals.
If the block diagram is very complex, DIAdem might continue the bus in the background. Then the bus ends with a point, which displays the name of the bus, for example, D11 for the eleventh data bus. At a different position in the block diagram, a second point appears with the same name, D11, from which DIAdem continues the bus.

© National Instruments Ireland Resources Limited | 1-3
NI DIAdem: Data Acquisition and Visualization
Buses Differ According to the Signals They TransportDIAdem distinguishes the connections between data buses, control buses, system buses, packet buses, alarm buses, and text buses. Each bus type transports different signals. You only can connect buses and block terminals that are the same type, for example, data buses to data buses and control buses to control buses. To distinguish between the various buses, DIAdem displays each type of bus in a different color. Single point processing buses are monochrome and packet processing buses are bichrome.
Refer to Chapter 3, Working with Packet Processing, for more information on single point processing and packet processing.
DIAdem organizes the different bus types in separate display layers. To keep a block diagram clear and easy to understand, and to make it easier to make connections, you can hide the layers using the symbols on the toolbar or in the View menu. A block diagram can contain up to six layers:• The system layer contains the yellow system buses, which transport clock rate information
between the blocks. • The control layer contains the red control buses, which transfer conditions, and activate,
deactivate, or reset blocks.• The data layer contains the green data buses, which transfer analog signals or digital
signals, depending on the data source.• The packet layer contains the green and gray packet buses, which transport data packets.• The alarm layer contains the blue and gray alarm buses, which transport alarm information.• The text layer contains the gray and gray text buses, which transport text information.
The blocks have different input and output terminals. Data leaves a block on the right side of the block and reaches a block on the left side of the block. This also applies for data packets, alarms, and texts. You connect the control buses and system buses on the horizontal edges of the block: The inputs are at the top block edge and the outputs at the bottom block edge. Depending on their function, the blocks have different inputs and outputs. The processing blocks, for example, have at least one data input and one data output but, like packet blocks, they could have more. Display instruments and manual input instruments have the control inputs Start, Stop, or Reset, which enable, disable, or reset the visualization.
Buses Contain Multiple SignalsAll buses between the blocks transport multiple signals. For example, a green data bus between two blocks can transport the measured values from 20 sensors. If you connect the signal from another sensor to this data bus, the data bus contains 21 sensor signals after the input node. DIAdem displays the number of transported signals along the bus and at the inputs and the outputs.

1-4 | ni.com
Chapter 1 The Block Diagram Describes the Measurement Task
Double-click a bus to obtain a list of the signals transported in the bus. The bus dialog box lists the names of the block outputs and the names of the signals. If blocks enter more than one signal, double-click the block name to open the signal list.
You specify in the block diagram dialog boxes how many signals the block creates or processes. For example, to increase the number of signals generated by a function generator, click the List Length button in the Signal list in the dialog box of the function generator. Increase the number of outgoing signals to five, for example. After you close the dialog box, the function generator displays the number 5 at the data output. If you connect a Curve display, the display instrument shows five curves underneath each other. By default DIAdem enables the checkbox Automatically increasing in the list length of the display block, so that the display instruments automatically display all connected signals.
Note For the driver inputs, the list length must be the same as the number of terminals on the installed hardware.
You can disable signals in data sources, data outputs, and some process functions, without changing the signal list. To do so, open, for example, the signal list in the dialog box of the function generator. Click the checkbox in the fifth row of the Enabled column to disable the fifth channel. When you close the dialog box, the number 5 is still on the curve display bus. However, if you start a display, the display instrument displays only four curves. If you change the list length, the sequence of the signals changes. If you disable signals, the sequence of the signals remains unchanged. Therefore, you do not need to adjust the rest of the block diagram when you separate and then reconnect it.
Select the data signals to be processed by the block in the dialog box. For example, to disconnect signals at the curve display, click Inputs»Data. DIAdem displays a list with the five connected signals. Select a signal and click Disconnect Signal. You can select several non-consecutive signals to disconnect them all simultaneously. DIAdem deletes the signal names in the row of disconnected signals and displays in the neighboring column a disconnected plug. After you close the input dialog box, the curve display shows the number 4 at the data input.
To re-connect a data signal, you must click the empty field of the signal name. Open the selection list and select a data signal. If you want to connect several signals in one step, select all the data inputs you want to connect. Click Connect Signals to open a list with the names of the connected blocks. When you double-click a block name, DIAdem displays a list of signals you can choose from.
Combining Subtasks into Subblock DiagramsThe more blocks you insert and connect in a block diagram, the more complex the block diagram becomes. To keep the block diagram easy to understand, you can group sections of the task into subblock diagrams. A subblock diagram looks like a block with signal inputs and signal outputs. You can include other subblock diagrams in a subblock diagram and, in this way, establish a hierarchy with several levels. You can export subblock diagrams to reuse the task sections in other block diagrams.

© National Instruments Ireland Resources Limited | 1-5
NI DIAdem: Data Acquisition and Visualization
To create a subblock diagram, you select the blocks and the buses that you want to group together, and click Group Subblock Diagram on the toolbar. DIAdem packs the blocks and the buses into one subblock diagram block and creates inputs and outputs for the buses to the blocks outside the subblock diagram. Double-click to open a subblock diagram. In the following figure, you recognize the open subblock diagram by the surrounding terminal bars for importing and exporting the various types of signals. You can move and extend the terminal bars to enlarge the workspace of the subblock diagram.
Figure 1-2. Subblock Diagram with the Terminal Bars of the Various Bus Types
Use the connection bars to connect blocks inside the subblock diagram to blocks outside the subblock diagram. Double-click the terminal fields at the edges of the subblock diagram to open the dialog boxes with lists of the imported or exported signals. You can add or delete connections in these dialog boxes. If you add a new import connection for data, the respective import field of the subblock diagram receives another connection. The subblock diagram contains another data input where you can connect more signals. If you add export connections, DIAdem also generates the respective terminals in the subblock diagram and in the subblock diagram block. You only can delete terminals if no signal buses are connected to these terminals in the subblock diagram or in the subblock diagram block.
Click the Close Subblock Diagram button on the toolbar to display the subblock diagram again as a single block in the main block diagram. To integrate the blocks of a subblock diagram in a block diagram, select the subblock diagram block and click Ungroup Subblock Diagram on

1-6 | ni.com
Chapter 1 The Block Diagram Describes the Measurement Task
the toolbar. Before you ungroup a subblock diagram, you must connect each import and export terminal inside and outside the subblock diagram with buses that are the same length as the list length, otherwise DIAdem will not be able to completely unpack the subblock diagram.
You can save a subblock diagram as a file in order to reuse partial solutions for other tasks. Open the subblock diagram and select File»Save Subblock Diagram. To save a brief description of a subblock diagram, click Block Diagram Parameters on the toolbar. DIAdem saves block diagrams with the filename extension .dac and subblock diagrams with the filename extension .sub in the same file format. You can also load a block diagram as a subblock diagram and use a subblock diagram as a template for a block diagram. Use File»Load Subblock Diagram to import subblock diagrams into a block diagram. After you have selected the file name, DIAdem imports the subblock diagram without changing the main block diagram's global settings, such as the default system clock, interfaces, data storage, and measurement parameters.
Editing Block DiagramsIn the DIAdem DAC workspace, you can select and position one or more blocks. Use the alignment functions and the grid, which you activate on the toolbar, to position the blocks in relation to each other. When you move the blocks, DIAdem reconnects the buses. To move buses separately from the blocks in the block diagram, move branches and input nodes. Press <Del> to delete selected objects. To delete a bus between two blocks, for example, select the bus and press <Del>. To deselect all objects, click anywhere in the worksheet, or press the <Esc> key.
If you move a block to the right or down over the edge of the workspace, you move the visible section of the block diagram. Use the scroll bars to move the visible section anywhere in the workspace. To view the entire workspace, click Zoom Out. To enlarge a section of the block diagram overview, click Zoom In. DIAdem displays a cursor with a rectangle, which you use to specify the section you want. You can use this function repeatedly until you have the view you want. You can now click Zoom Out to undo the zoom step by step, and click Zoom Off to restore the normal view.
In complex block diagrams, you can select Edit»Find to search for blocks and signals. When DIAdem finds a block, you can open the block properties and block terminals from the search dialog box. At the same time, DIAdem selects the block in the block diagram.
You can prevent changes being made in block diagrams in DIAdem DAC. To do so, click Lock Editing on the toolbar. DIAdem saves this setting with the block diagram. However, you can still change the parameters for the display and input instruments in DIAdem VISUAL.
In the DIAdem DAC settings, you specify the maximum size of the block diagram and the display of the block diagram editor. Select Settings»DIAdem Settings»DAC/VISUAL»Measurement Kernel to specify the maximum number of blocks and signals for one block diagram. Select Settings»DIAdem Settings»DAC/VISUAL»Block Diagram to change the background colors, the block display, the bus layers, and the labels for the blocks and buses.

© National Instruments Ireland Resources Limited | 1-7
NI DIAdem: Data Acquisition and Visualization
Select Settings»Single Point Processing»Default System Clock to specify the basic sampling rate for the block diagram. Use a system clock block in the block diagram to assign a clock rate, which differs from the default system clock, to individual blocks. The blocks that are not connected to the system clock continue to work with the default system clock. If you use several system clock blocks, you can create subsystems that have different sampling rates. The settings you set in the system clock block specify whether only the DAC kernel controls the measurement, or whether the kernel and the measurement hardware control the measurement together.
Refer to the section on Different DIAdem Measurement Modes in Chapter 6, The Basics of Data Acquisition with DIAdem, for more information about the measurement modes.
If you use packet blocks in a block diagram, select Settings»Packet Processing»Default System Clock to specify the sampling rate of the packet blocks. Refer to Chapter 3, Working with Packet Processing, for more information on packet processing.
In a block diagram file with the filename extension .dac, you save the blocks, the buses, the hardware settings, the interfaces in DIAdem, the system settings, and the visualization settings. If you use a graphic for visualization, DIAdem also saves the filename, including the path, in the block diagram. A block diagram is saved by default in the Unicode format.
Enter a short description of the block diagram in the Block Diagram Parameters. In the block diagram parameters, you can also include user commands, so that you can use functions you defined in a script before and after a block diagram check and before and after a measurement. Register script files containing user commands in Settings»Extensions»User Commands so that DIAdem can add the user commands to the command collection. Refer to Accessing Objects in DIAdem DAC in the DIAdem help for information on creating scripts for DIAdem DAC.
DIAdem DAC Function GroupsDIAdem provides an extensive library of functions as blocks for signal acquisition, processing, and visualization. These blocks are arranged by category in the DIAdem DAC function groups: • System• Driver inputs and outputs• Simulation inputs and outputs• Scaling• Processing• Control• Alarm system
Refer to section Alarm System Functions in Chapter 4, Monitoring Processes with the Alarm System, for a description of the alarm functions.

1-8 | ni.com
Chapter 1 The Block Diagram Describes the Measurement Task
• Display instrumentsRefer to section DIAdem VISUAL Function Groups in Chapter 2, Visualizing Data and Operating Facilities, for a description of the display instruments.
• Packet processingRefer to section Packet Processing Functions in Chapter 3, Working with Packet Processing, for a description of the packet function.
Note The NI License Manager only enables DAC functions included in your DIAdem license. DAC functions that are not included in your DIAdem license are dimmed in the corresponding function groups. To use these DAC functions you must obtain a license for a different DIAdem edition.
SystemThe function group System includes the blocks Save Data, Save Data with Trigger, and Save in Variables for saving measured values. The blocks Save Data and Save Data with Trigger save channel group properties and channel properties together with the measured values, in the Data Portal or to a file.
To save measured values in relation to events, you can define a start trigger and a stop trigger in the system block Save Data with Trigger, and you can define consecutive triggers in the system block Trigger Sequence. For the start trigger and the stop trigger, you can define a pre-range and a post-range to save the measured values that come directly before or after a trigger. For each trigger sequence, you can define a data reduction to save only the first value, the minimum, the maximum, or the arithmetic mean of the specified interval. Select Settings»DIAdem Settings»DAC/VISUAL»Measurement Kernel»Triggers to change the maximum number of trigger sequences in a block.
Use the System Clock to create subsystems with different sampling rates. DIAdem sets the default system clock for all blocks for which you do not set a clock signal. The measurement mode in the system clock block specifies whether only the DAC kernel controls the measurement, or whether the kernel and the measurement hardware control the measurement together. To make settings for the default system clock, select Settings»Single Point Processing»Default System Clock.
Refer to the section on Different DIAdem Measurement Modes in Chapter 6, The Basics of Data Acquisition with DIAdem, for more information about the measurement modes.
Driver Inputs and Driver OutputsThe function groups Driver Inputs and Driver Outputs include functions for registered measurement hardware and interface functions. Use the function group Driver Inputs to insert signal acquisition blocks into a block diagram. Use the function group Driver Outputs to insert signal output blocks into a block diagram.

© National Instruments Ireland Resources Limited | 1-9
NI DIAdem: Data Acquisition and Visualization
Both function groups contain blocks for the interfaces XNET, OBD-II, OPC, OPC UA, and DDE. With the NI-XNET Driver, DIAdem can acquire and output data with the NI-XNET hardware. NI-XNET supports CAN (Controller Area Network), LIN (Local Interconnect Network), and FlexRay. The driver inputs contain the ECU Driver, which uses the NI ECU Measurement and Calibration Toolkit, and the NI-OBD-II Driver, which uses the NI Automotive Diagnostic Command Set, in order to acquire data from Engine Control Units (ECU). Use the NI-DAQmx Driver to access hardware from National Instruments, which you defined in the Measurement & Automation Explorer, the device configurator of National Instruments.
DIAdem uses the OPC Driver (Open Platform Communication) and the OPC UA Driver (OPC Unified Architecture) to communicate as a client with every OPC server found or registered in the network. The GPS Driver (Global Positioning System) reads geo data in the NMEA format through the serial interface. With the DDE Driver (Dynamic Data Exchange), you can establish a client/server link through DDE. DIAdem uses the Script Driver to communicate, VBS-based, with external measurement devices via the interfaces RS-232, GPIB, and TCP/IP. DIAdem uses the Control File Driver to communicate with external measurement devices on the basis of ASCII control files, through the RS-232 interface or the GPIB bus.
Refer to Chapter 5, Installing Measurement Hardware and Communicating via Interfaces, for more information on how to register measurement hardware in DIAdem or how to access external devices via interfaces.
Simulation Inputs and Simulation OutputsThe function groups Simulation Inputs and Simulation Outputs include functions for generating and displaying signals without measurement hardware. You can use simulation blocks to create and to test block diagrams without hardware, and you can later replace the data sources with hardware blocks.
The function group Simulation Inputs includes the blocks Random, Noise, Function Generator, and Constant for generating continuous signals. You operate the input instruments Switch, Push Button, Slider Control, Dial, Radio Button, and Numeric Input in DIAdem VISUAL using the mouse or the keyboard, to generate signals interactively. You can manually trigger control signals in relation to conditions. The blocks Read Channel from Data Portal, Read Channel from DAT File, and Read Channel from DAT Measurement File read data from the Data Portal or from a data file that can originate from a measurement that has finished or is still running.
Use Date and Time to display the date and time of day. You can display the output signals day, month, and year, as well as hours, minutes, and seconds directly in digit displays. The block Absolute Time has an output signal in the DIAdem time format, which you can save with the measurement signals. Both time blocks can output either the measurement duration or the time of day. You use the Stopwatch to measure the duration of events in seconds by starting, stopping, and resetting the stopwatch with control signals.
1-10 | ni.com
Chapter 1 The Block Diagram Describes the Measurement Task
You use the Counter to simulate a counter component that has a control input Clock Release, which starts counting synchronously with the system clock, and a control input Reversion, which changes the counting direction. The System Buffer Monitor monitors the filling of the measurement value buffer to give you an idea of the load the measurement subjects the computer to. Use the Buffer block to buffer data from non-real-time capable sources and to use the data later as a real-time signal in the block diagram. Use the block Read from Buffer to read data in realtime, and use the block Buffer Monitor to monitor the filling level of the buffer.
The function group Simulation Outputs includes the Loudspeaker, which outputs measured values as acoustic signals to the computer loudspeakers. Use the Execute Application block to start other applications in relation to events. Use the Open Application block to display and to hide executing programs on the screen. Use the Write to Buffer block to write data to the buffer.
ScalingThe Scaling function group includes blocks for converting the incoming signals from the measurement hardware into the measured physical quantities. Scaling blocks convert, for example, the voltage recorded on temperature sensors into the original measured temperature, with the unit degrees Celsius.
Linear Scaling scales signals linearly, using the linear equation ax+b, and Two-Point Scaling scales signals using two specified points. You can execute a calibration measurement to determine the two points. Use Free Linearization via Table to create a value table and use Free Linearization via Channels to specify channel pairs from the Data Portal which specify the interpolation points for any non-linear scalings. Use the x-channel, the y-channel, and several z-channels to create a block diagram in the interpolation matrix in a 3D Interpolation. During the measurement, the block interpolates a z-value from the incoming x-value and y-value. Use the Offset Correction function to subtract a constant from the measurement values.
The PT100 Linearization calculates the temperature from the measured resistance of a PT-100 resistance. The Thermo Linearization block calculates the temperature from the voltage measured on a thermocouple. If you execute external pre-amplification, DIAdem can convert the incoming voltage values to the voltage range on the thermocouple used, so that the linearization function processes the measured values correctly.
ProcessingThe function group Processing includes blocks for calculating data signals and controlling processes.
In the processing block Formula, you define formulas for connecting data signals to control signals, in the same way as in the DIAdem Calculator. You can execute comparison operations and Boolean operations in the formula, for example. However you cannot execute VBS commands. As the formula result, DIAdem outputs data signals such as the power, calculated from the current and the voltage. The Signal Copy creates as many copies of the input signal as the block has data outputs. However, the Signal Multiplexer, which is controlled by the selection input, groups measured values from several input signals into one data signal. Use the

© National Instruments Ireland Resources Limited | 1-11
NI DIAdem: Data Acquisition and Visualization
Control Signal–>Data Signal to convert control signals into data signals in order to, for example, display the status of control signals with the values 0 and 1.
Use the PID Controller, the Two-Point Controller, or the Three-Point Controller to calculate actuating values from the difference between the reference values and the actual value. In the non-linear blocks Two-Point Controller and Three-Point Controller, you can specify a hysteresis by entering different values for the on and off levels. With the PID Controller, you must ensure that the proportional part, the integral part, and the differential part correspond, in order to ensure good control behavior.
Use the Bit Bundling block to bundle up to 32 single-bit signals into one 32-bit signal, and the Bit Extraction block to divide a signal with up to 32 bits into single-bit signals. The processing block Mean of N Signals calculates the arithmetic mean of all the input signals and the processing block Floating Mean calculates the floating mean for each signal at an interval that you specify. The processing blocks Binary Code->Gray Code and Gray Code->Binary Code convert measured values from binary code to Gray code and vice versa.
Create your own processing functions in scripts and matching input dialog boxes in order to use the functions in the processing block VBS Script in block diagrams. You also can create function libraries (DLLs), which you register via Settings»Extensions»GPI Extensions in DIAdem and provide in this function group via Settings»Single Point Processing»Driver Function Groups.
ControlThe function group Control includes blocks for monitoring data signals, system signals, and control signals. DIAdem generates control impulses when data signals exceed thresholds, for example, or when periods of time elapse, or when a key is pressed. Control signals have the value 1 if a condition is true and the value 0 if a condition is not true. Use control signals to start or to stop the storage of measured values, to switch display instruments on and off, or to adjust the sampling rate during the measurement.
Use the setting Inverted Outputs in the dialog box Outputs»Control to add an inverted block output to the control blocks.
Use the control block Window, Slope, and Signal Alteration to monitor data signals. The Window generates a control impulse when data signals enter or leave a specified value range. The Slope block checks whether data signals exceed a threshold in the ascending or the descending direction, and the Signal Alteration block monitors the difference between consecutive values.
In the control block Formula, you define formulas for connecting data signals to control signals and for outputting control signals as the formula result, in the same way as in the DIAdem Calculator. You can execute comparison operations and Boolean operations in the formula, for example. However you cannot execute VBS commands. When you use formula blocks, remember that DIAdem processes predefined conditions, such as the Window block, faster than formulas.

1-12 | ni.com
Chapter 1 The Block Diagram Describes the Measurement Task
The Push Button, the Radio Button, and the Checkbox create a control impulse if the user presses a specified function key or selects the respective button in DIAdem VISUAL. With the Start and Stop control inputs, you can block and release the operation of the three input instruments in relation to events. The Time block realizes an on/off delay or generates a periodic control impulse, and the Absolute Time generates a time condition with the date and time.
Use the control blocks AND and OR to execute operations on control signals, and use the NOT block to invert a control signal. The Impulse Delay control block forwards a control signal, with a delay, as an impulse.
The Mono Flop and the Flip Flops work the same as the electrical engineering components. The Mono Flop is a single-shot circuit that outputs a control signal for a specific hold time, as soon as a control impulse arrives at the set input. The RS Flip Flop and the JK Flip Flop are bi-stable circuits that, after a control impulse, continue to output a control signal at the set input until a new control impulse arrives at a reset input. The Switch is similar to the RS flip flop, but DIAdem monitors only one control input: only the reset condition for a set switch and only the set condition for a switch that is not set.
Use the control blocks System Clock Status, Trigger Sequence Status, and Number of Values to monitor system signals. The System Clock Status checks the status of a system clock and the Trigger Sequence Status checks the status of a trigger sequence of a system clock rate. You can use this control information to start other clock systems or trigger sequences consecutively. The control block Number of Values generates a control impulse after a specific number of clock cycles.

© National Instruments Ireland Resources Limited | 2-1
2Visualizing Data and Operating Facilities
You use DIAdem VISUAL to design the visualization of block diagrams created with DIAdem DAC. When a measurement starts, DIAdem automatically switches to DIAdem VISUAL to display measurement data, open-loop or closed-loop control data, or monitoring data. You can position the display and input instruments freely and use graphics and audio files. This allows you to design all kinds of appropriate visualizations for your task.
Figure 2-1. DIAdem VISUAL
Creating a VisualizationWhen you create the block diagram in DIAdem DAC, you select, configure, and connect the blocks and decide which display instruments show which signals. In DIAdem VISUAL, you then design the visualization by arranging and configuring the display instruments and the input instruments. You save the definition of the visualization with the block diagram. You also can add display instruments and input instruments from the function groups in DIAdem VISUAL. With each instrument you add, you also add a block to the block diagram in DIAdem DAC, where you connect data buses, control buses, and system buses to the block.
For example, to display the data of the NI-DAQmx driver input as curves on a recorder, open the Recorder Display function group in DIAdem VISUAL and click the Horizontal Recorder Display button. DIAdem inserts the display instrument in the top left corner of the workspace. Move and resize the recorder display to position the display instrument. Double-click the instrument and select the y-scaling, specify the frame and background, and display the axis labeling and a legend in order to edit the instrument. To connect data to the display instrument, open DIAdem DAC and connect the data input of the Recorder block to the data output of the NIDAQ-In block.
To display the measurement values, click Start Display on the toolbar. DIAdem displays the connected and active signals as curves. To stop the display, click Stop Measurement on the toolbar. While a measurement is running, you cannot move or edit the instruments, you only can operate the input instruments in the workspace and click Stop on the toolbar. In DIAdem VISUAL, you can not only start a block diagram, you also can load it and save it.

2-2 | ni.com
Chapter 2 Visualizing Data and Operating Facilities
Use the full-screen mode to hide the DIAdem VISUAL user interface and display the workspace contents on the entire screen. Press <Ctrl-U> for the full-screen mode. Then press <Ctrl-F5> to start a measurement. Hit the <Esc> key to stop the measurement. Press <Ctrl-U> to disable the full-screen mode. You can neither enable nor disable the full screen mode while a measurement is running.
Editing a VisualizationYou can position display instruments, input instruments, and graphics anywhere in the visible workspace. However, you cannot move instruments over the edge of the screen as you can in DIAdem DAC, because the DIAdem VISUAL workspace is limited to the visible area. Enable the grid to position instruments exactly next to each other or above one another.
When you select an instrument, DIAdem marks the instrument with a dashed frame and small squares in the corners and at the sides. Move the squares at the sides to change the width and the height. Drag the squares at the corners to resize the instrument while maintaining the proportions. Press <Ctrl> at the same time to change the size but maintain the center.
You can select several instruments and move and resize them together. You can use the alignment functions to align selected instruments to each other and to align the size of the objects. The dashed frame is the reference point for DIAdem. To align three instruments evenly spaced underneath each other, click the Alignment»Stacked button on the toolbar. If the selection frame is smaller than the total height of all three instruments, DIAdem positions the instruments underneath each other with the edges touching, without changing the height of each instrument. If you place an instrument at an unsuitable position, or if you use the wrong alignment function, press <Ctrl-Z> to undo steps.
If you cannot select an instrument with the mouse in the workspace because the instrument is hidden by another instrument, click the instrument which is on top and select Edit»Outline to make the hidden instrument visible. To edit hidden instruments, select one instrument after another with the <Tabulator>. DIAdem places the selected instrument in the foreground.
The display instruments and the input instruments have a predefined value range of ±10. You can change the value range separately for each signal in the dialog box. In the dialog boxes for the display instruments Curve, Recorder, Wiper, and Spike, you can select automatic y-scaling so that DIAdem sets the value range according to the incoming measurement values.
Click Lock Editing on the toolbar to prevent changes to the display in DIAdem VISUAL. DIAdem saves this setting with the block diagram. However, the visualization block parameters can still be changed in DIAdem DAC.

© National Instruments Ireland Resources Limited | 2-3
NI DIAdem: Data Acquisition and Visualization
Working with VISUAL Pages Position instruments you want to view simultaneously, when the display starts, next to each other or one above the other without one instrument concealing the other. However, if you want to change the display in relation to an event, arrange the instruments so that they are stacked on top of each other and only reveal the instrument you need. The conditions you define with control blocks determine when DIAdem displays which instrument. If you connect a control bus to the start input of the curve display, DIAdem does not show this display instrument until the condition at the start input is true.
To facilitate the selection of display instruments and input instruments in complex block diagrams, which makes it easier to edit the visualization, you can group instruments together into VISUAL pages. You can display, hide, and lock VISUAL pages for editing. Use View»VISUAL Page Management to define VISUAL pages in DIAdem VISUAL, and assign a VISUAL page to each instrument in the dialog box of the instrument under Frame. To hide a group while you edit the visualization screen, click View and disable the appropriate VISUAL page.
By default, each subblock diagram uses its own VISUAL page, which has the same name as the subblock diagram. To assign another VISUAL page to a subblock diagram, open the subblock diagram in DIAdem DAC and select Settings»Block Diagram Parameters»VISUAL Page on the toolbar. To assign a different VISUAL page to an instrument of the subblock diagram, select the new VISUAL page in the dialog box.
Visualization SettingsTo specify basic visualization properties, select Settings»Block Diagram Parameters»Visualization. You specify whether DIAdem hides deactivated display instruments during the measurement, and select the VISUAL background color. DIAdem saves the sizes and positions of the instruments in relation to the workspace, to automatically adjust the visualization to different screen sizes or changed window sizes. For identical display of the sizes and positions of instruments on any screen, set the display area for the visualization, for example, to 1280x800. DIAdem then shows the same visualization screen, regardless of the screen resolution.
DIAdem VISUAL Function GroupsDIAdem provides various display and input instruments. These functions are arranged by category in the DIAdem VISUAL function groups: • Manual instruments• Curve display• Wiper and spike display• Recorder display• XY display• Gauge display• Bar display

2-4 | ni.com
Chapter 2 Visualizing Data and Operating Facilities
• Alphanumeric display• Binary and status display• Alarm system displays
Refer to section Alarm System Functions in Chapter 4, Monitoring Processes with the Alarm System, for a description of the display instruments of the alarm system.
• Image and video display
DIAdem DAC includes blocks for displaying measurement values in the function group Display Instruments and the blocks for the manual instruments in the function group Simulation Inputs.
Manual InstrumentsThe function group Simulation Inputs includes the instruments Switch, Push Button, Radio Button, Slider Control, Dial, and Numeric Input, which you can use to create data signals manually. In DIAdem DAC, use the Push Button, the Radio Button, or the Checkbox from the Control function group to manually generate a control impulse. You can operate the manual input instruments with the mouse, the keyboard, and with a data signal. After you enable remote control in the dialog box, the block receives another control and data input. The additional data signal does not control the manual input instrument unless there is an active control signal at the remote control input. You cannot control manual instruments manually and with a data input at the same time.
You use the arrow keys on the keyboard to operate the Slider Control and the Dial, and you use an assigned function key to operate the Switch and the Push Button. Select the settings for a Radio Button and a Checkbox either with the arrow keys and the enter key, or with the function keys. For Numeric Entry, you enter numbers on the keyboard and press <Enter>. If you enter a value that is outside the set value range, DIAdem uses the corresponding limit value instead.
Curve Display, Wiper and Spike Display, and Recorder DisplayThe function groups Curve Display, Wiper and Spike Display, and Recorder Display include display instruments that display signals as time-related curves.
Use the Display Curves function group to display signals as time-related curves, which DIAdem plots from left to right. The Curve display deletes the display when the curve reaches the end of the window, and re-plots the curve from the left.
Use Recorder Display to display signals as a continuous horizontal curve from right to left, or as a vertical curve from top to bottom. The recorder displays the signals as curves as if they were recorded on paper by a needle on a roller.
Use the Wiper to display signals as continuous time-related curves, and use the Spike display instrument to display signals as vertical lines over the time axis. In both of these display instruments, a vertical line moves across the instrument from left to right and deletes and re-plots

© National Instruments Ireland Resources Limited | 2-5
NI DIAdem: Data Acquisition and Visualization
the curve. Wiper and Spike display, for example, display the values measured in the last ten seconds. In this case the current values are to the left of the vertical line and the previous values are to the right of the line. This enables you to see signal changes as soon as they occur.
The display instruments display all curves in one axis system or each curve in a separate axis system. Grid lines, legends, and warning and alarm ranges make it easier to monitor the signals. To scale the time axis, you specify a time segment, which DIAdem labels with the measurement time, with the current time, or with a fixed scale. To scale the y-axis, you can choose between a scale with the percentages of the display area and a scale with the physical values. Specify the value range in the signal list; otherwise DIAdem specifies the range automatically. If you select automatic scaling, you can specify a minimum range, a fixed range, or an automatic scaling with peak hold.
If you enable the setting Allow manual changes to the value range, you can change the y-scaling interactively during a measurement. To do so, position the cursor over the y-axis scale and turn the mouse wheel when a double-arrow appears at the cursor. Rotate the mouse wheel to expand or to shrink the scale. If you position the cursor at the center of the axis, you modify the scale at both ends of the axis. If you position the cursor at the lower end or the upper end of the axis, you scale the axis at the selected end, while the opposite end remains fixed. You can move the section. At the end of the measurement, DIAdem restores the original value range.
XY DisplayUse the XY Display block to display two signals as an xy-curve. The display instrument plots a curve or moves a symbol, such as a circle or a triangle, across the display area. Use the Scatter Display to display two data signals as a scatter plot.
To scale the x-axis and the y-axis, you can choose between a scale with the percentages of the display area and a scale with the physical values. Grid lines, legends, and warning and alarm ranges facilitate signal monitoring.
Use the Map Display to display the measured geographical data in an OpenStreetMap during a measurement. The NI-GPS driver, for example, can read the geographical data from a GPS receiver. DIAdem displays the current coordinates with a rhombus and the path as a line. As soon as the rhombus moves towards the edge of the map section, DIAdem shifts the map. You can enlarge, reduce, and move the displayed map section.
Gauge DisplayThe function group Gauge Display includes display instruments such as the Gauge Display, Analog Meter, Tacho Display, Polar Display, and Cylinder Tachometers, to display the current signal values with pointers. The Analog Instrument uses a quadrant, the Gauge Display uses a semicircle, and the Tacho Display uses a three-quarter circle as the scale that the gauge moves in. You can modify the size and position of the scale for the gauge and for the tachometer.
In the Cylinder Tachometer display, the scale moves, not the pointer. DIAdem can move the cylinder vertically or horizontally and display the pointer as a line or as a double arrow. You

2-6 | ni.com
Chapter 2 Visualizing Data and Operating Facilities
specify the scale on the cylinder as a percentage that is the size of the visible segment of the value range.
Use the Polar Display to display the x-values and the y-values of signals in a polar axis system. The x-values contain the angles around which the pointer rotates and the y-values contain the amplitudes that specify the length of the pointer.
The Cylinder tachometer displays a separate display instrument for each signal, whereas you can also display all the signals in each of the other gauge displays. You can choose between a scale with the percentages of the display area, and a scale with the physical values. Legends and warning and alarm ranges make it easier to monitor the signals.
Bar DisplayUse the Bar Display to display the current signal values as horizontal or vertical bars. By default DIAdem plots bars from the bottom edge or the left edge of the instrument to the current value. If the value range is ±10, DIAdem plots a bar from -10 to -3 for the value -3. Change the reference line to specify whether the bars display on one side or on both sides of the axis. Set the reference point to 50% in the middle of the symmetrical value range in order to differentiate positive and negative values better. In vertical bar displays, DIAdem plots positive values upwards and negative values downwards.
The Container Display specifies the filling level in different-shaped containers. The level corresponds to the current measured value. You can choose between three cylindrical forms and one round form or a graphic for the selected container. To do this, select a graphic file in the dialog box of the container, and specify the transparency color. The graphic area which displays the bar must have the transparency color.
You can choose between a scale with the percentages of the display area, and a scale with the physical values. A color change in the bars indicates that the limit values have been exceeded.
Alphanumeric DisplayThe Alphanumeric Display function group includes the digital displays Numeric Display and Table Display for the numeric display of the current signal values. You can manually enter the numeric format and the font, and you can use color changes to indicate when limits are exceeded.
Use the Message Display to display events visually or acoustically. DIAdem reads the messages from a text file and displays each measured value in a separate line. Instead of text, DIAdem can also display graphics and play audio files. To display graphics, enter @graphic in the first line of the text file and enter the paths with the graphics files in the subsequent lines. To run audio files, you must enter @sound and the audio files instead. To combine graphics with audio files, use two Message blocks in the block diagram.
Use Text Display to display a description or instructions in relation to an event. DIAdem has static text and dynamic text. Dynamic text contains formula expressions and variables that

© National Instruments Ireland Resources Limited | 2-7
NI DIAdem: Data Acquisition and Visualization
DIAdem periodically updates. You can double-click to open the text editor, for example, to enter @@CurrTime@@ for the current time display.
Binary and Status DisplayThe instruments in the Binary and Status Display function group do not show measured values, they divide the measurement range into two or more statuses.
Use the binary displays Valve and Switch to display an opening or closing valve or switch. If you select the Rectangle or the Lamp instead of these symbols, a color change displays the status of the signal.
Use the Status display to differentiate between several statuses with colors, graphics, or audio files. The status display, for example, can display the various work steps of a press, such as opening the car roof or the deformation of a component.
Use the Color Matrix, for example, to show the temperature distribution on a workpiece. The temperature sensors must be positioned in a regular grid on the workpiece. The color palette that you define as the value range determines the color shading for the signals in DIAdem.
Image and Video DisplayUse the function group Image and Video Display to integrate a picture of the test rig or the company logo into the visualization. Select Load Graphic to load graphics in the standard formats. When you load a graphic, DIAdem generates a link to this file. DIAdem saves the link with the path definition in the block diagram. If you want to use the block diagram on another computer, you must copy the graphic to this computer.
The following figure shows how the icons on the buttons on the left edge make switching between components easy. The large graphic on the right of the visualization shows the part of the plant to which the measurement values are assigned.

2-8 | ni.com
Chapter 2 Visualizing Data and Operating Facilities
Figure 2-2. Monitoring a Facility at Four Critical Points
Use Record Video to record a video in addition to the measurement data of the test stand and to display it during the measurement. Select the camera and microphone connected to the computer in the dialog box and specify the video resolution. Note that the resolution and bitrate of the video influences the computing load.
As soon as you start a measurement, DIAdem enables the video recording and then the measurement data acquisition. The video recording is autonomous and independent of the sampling rate of the measurement. Because of the conditions, such as the camera, the associated driver, and the type of USB interface, the video is not synchronous with the measured data. If you adjust the video resolution or the video bit rate in the dialog box of the video block, you can increase the synchronicity. DIAdem saves additional information in the video file for post-processing in the VIEW panel.
© National Instruments Ireland Resources Limited | 3-1
3Working with Packet Processing
DIAdem provides two different methods for measuring and visualizing data: single point processing and packet processing. In single point processing, the measurement kernel controls the timing for point-by-point data acquisition, processing, and output. In packet processing, DIAdem treats the data as packets. The data flow controls the processes, which means that a function block must process an entire data packet before the subsequent function blocks can start to process the packet. You can combine single point processing and packet processing in one block diagram, for example, to execute an online FFT in the packet section and to use the maximum values of the frequency analysis for control in the single point section.
Processing Single ValuesIn single point processing, the measurement kernel controls all functions. This centralized control decides when DIAdem executes which functions, and controls the sampling rates, triggers, and conditions. The measurement kernel requests values from the device drivers or forwards values to device drivers for output, and displays the values on the screen. At any point in time, the current value of every acquired or calculated quantity is at each function block.
In single point processing, data acquisition is executed in the hardware clock or software clock. Use the hardware clock for simple, quick measurements and the software clock for long-term measurements, controlling, and rules. Refer to the section on Different DIAdem Measurement Modes in Chapter 6, The Basics of Data Acquisition with DIAdem.
Single point processing is especially suitable for the following operations:• Measurement data acquisition with individual moderate sampling rates• Long-term measurements• Event-controlled data acquisition• Open and closed control tasks with moderate real-time requirements
Processing Data PacketsIn packet processing, DIAdem does not process single values separately: DIAdem groups the single values into packets that pass through each of the processing steps consecutively. As soon as a data packet arrives, DIAdem forwards the data packet to the first processing function. The function processes, visualizes, saves, duplicates, or rejects the values and transfers the resulting data packet to the next processing function.

3-2 | ni.com
Chapter 3 Working with Packet Processing
The data packet flow works like a letter shoot. The data packets go physically from one function to the next. The reduced amount of administration effort increases the data throughput compared to single point processing. Each function works automatically as soon as a data packet arrives. This makes it possible to execute calculations such as Fourier analyses, which require a certain number of values simultaneously.
The measured values are acquired in data packets with data flow control. The measurement hardware determines which additional functions you have, for example, processing mathematical functions or complex testing tasks with short response times to plugin boards with signal processors, which reduces the computing load during processing.
Packet processing is especially suitable for the following operations:• Data acquisition with high data throughput• Fast online visualization• Complex online mathematical functions• Using special hardware features
Using Packet Functions in the Block DiagramPacket processing has its own functions for signal processing, signal analysis, signal acquisition, and signal output. To combine single values and data packets in one block diagram, use the Pack block, which groups single values into data packets, and the Unpack block, which divides the data packets into separate values.
For example, to display a signal from the single point NI-DAQ driver input defined in the block diagram as a waterfall diagram, open the function group Signal Processing (Packet Processing) and click the Pack button. Position the packet block below the existing block diagram and connect the green data bus, which is connected to the driver input, to the data input on the Pack block. Double-click this block to specify the number of values in one data packet in the block dialog box.
To display the data packets as a waterfall diagram, open the function group Display and I/O (Packet Processing) and click Oscilloscope (3D Display). Position the Oscilloscope block next to the Pack block and connect both packet blocks. DIAdem connects the two packet blocks with a green and gray packet bus. Together with the Oscilloscope block, DIAdem displays a new window which you can position anywhere on the screen, not just in the DIAdem VISUAL workspace.
When you start a measurement, the window displays axes and measurement curves as soon as the oscilloscope block receives data. The Oscilloscope window plots the curve of the current data packet in the foreground and the curves of the old data packets in the background, which creates a three-dimensional waterfall display. While a measurement is running, you can move the window around on the screen and you can modify the display of the measured values using the menus or the toolbar in the window. Click Stop Measurement on the DIAdem toolbar to stop the measurement.

© National Instruments Ireland Resources Limited | 3-3
NI DIAdem: Data Acquisition and Visualization
Unlike the display instruments in single point processing, the display of the windows is specified only in the menus or on the toolbar, and the functions of the input instruments are specified in the shortcut menus. In the dialog box of these packet blocks, you only make settings concerning the data flow. In DIAdem VISUAL you have no access to the packet processing display windows and input instruments.
Unlike the single point processing function blocks, which distinguish between data buses and control buses, you connect packet buses to the control inputs, not control buses. DIAdem monitors the packet buses to check whether the condition is true.
Block Size and Sampling Rate Determine the Data Packet FlowPacket processing transports data packets from one packet block to the next in the block diagram. Data packets are generated by hardware inputs, input instruments from packet processing, or the Pack block. DIAdem does not forward a data packet to the subsequent packet block until the data packet is completely filled with data. The subsequent packet block does not work until all the block inputs have data packets and the block outputs are vacant.
How many values a data packet contains depends on the size of the block. Most packet blocks leave the block size unchanged during processing. Several packet blocks output data packets with a smaller block size, for example, the FFT data packets are half the size of the incoming data packets.
The packet processing driver blocks deliver data packets, whose data originates from several channels used on the hardware. Multi-channel data packets generate the statistics function and the Merge packet block, which combines several data packets from several packet buses. The packet blocks Oscilloscope, File-I/O, Relay Switch, Copy, and Voltmeter can process multi-channel data packets. DIAdem arranges the data of the individual channels in multi-channel data packets value-wise. DIAdem first enters all first values, then all second values, and so on, into one data packet. The number of channels a data packet contains is indicated at the beginning of the multi-channel data packet.
The size of the data packets and the sampling rate determine the processing speed, which in turn determines the data flow in the block diagram. The sampling rate determines how fast DIAdem generates data or requests data from the measurement data acquisition board. The response time in the block diagram depends on the ratio between the block size and the sampling rate. A data acquisition block that is to measure 100 values at a sampling rate of 100 Hz, can return only one data packet per second. The packet blocks whose dialog boxes do not specify block size or sampling rate use the settings of the default system clock.
If you select Settings»Packet Processing»Default System Clock, you can specify the packet call clock as well as the block size and the sampling rate. The packet call clock is the rate at which DIAdem calls the packet blocks. At every call, DIAdem checks whether a packet block

3-4 | ni.com
Chapter 3 Working with Packet Processing
is prepared for work. A packet block can work if all block inputs contain data packets and no data packet is blocking the block outputs. As long as a packet block is working, the packet block ignores the packet call clock.
Packet Processing FunctionsThe packet processing functions in DIAdem DAC are grouped by category into four function groups. • Signal processing (packet processing)• Signal analysis (packet processing)• Display and I/O (packet processing)• Driver (packet processing)
The Complete Selection button in the function group Signal Processing (Packet Processing) contains other packet functions that you can use in your block diagram.
Note The NI License Manager only provides the packet functions if your license contains packet processing. If not, the buttons in the respective function groups are dimmed. To use the packet functions, you might have to obtain a license for a different DIAdem edition.
Packet Functions for Signal ProcessingThe function group Signal Processing (Packet Processing) includes the functions Unpack and Pack for combining packet processing with single point processing. The Unpack packet block divides the data packets of a packet bus into single values and outputs the single values to a data bus in single point processing. The Pack packet block combines values from one data bus in single point processing and outputs the data packets to a packet bus.
Use the Multiplexing packet block to output data packets from several data inputs in alternating order from a block output, and the Demultiplexing packet block to output data packets from one input signal to several block outputs in alternating order. The signal at the control input specifies which input DIAdem uses for the multiplexer or which output for the demultiplexer.
You use the Merge packet block to combine data packets from several packet buses to a new multi-channel data packet. The packet size and the sampling frequency of one-channel data packets must correspond. You use the Manager packet block to select channels from multi-channel data packets. To create single-channel data packets, enter only one channel in the channel list. This packet block forwards the unaltered input signal together with the selected channels.
The Replicator packet block repeatedly outputs a data packet, for example, for recurring use of a data packet with set points or comparative data, or to synchronize data signals that have seldom and irregularly incoming data packets with fast data signals. You use the Ignore packet block to reduce the amount of incoming data. The Ignore block can reject values, change packet sizes, or

© National Instruments Ireland Resources Limited | 3-5
NI DIAdem: Data Acquisition and Visualization
output specified sections of data depending on a control signal. You use the Offset Register packet block to reduce the block size by dividing large data packets into smaller subpackets.
You use the scaling functions to convert values, for example, to display the values in a different unit. Linear Scaling calculates with factor and offset, and 2-Point Scaling calculates with two points. Thermo Linearization converts the voltages measured with thermocouples and with PT100 resistance into temperatures. Multi-Point Scaling scales data with a non-linear calibration curve, which the packet block reads at a second data input. To change the calibration dynamically, you can exchange the calibration curve during the measurement.
The Relay Switch packet block works as an on/off switch or as a toggle switch, to interrupt data packet transport or to assign the transport to two block outputs. The signal at the control input controls the relay switch. The Trigger packet block outputs data packets in relation to events, and DIAdem monitors whether the data signal or a second signal overshoot thresholds. The Trigger block rejects all data packets before the event.
Use the Clock packet block with the single point block System Clock to change the packet call rate in the block diagram. Use the Stop packet block to stop the block diagram packet blocks or the complete measurement after a specified number of data packets.
Packet Functions for Signal AnalysisThe function group Signal Analysis (Packet Processing) includes the packet block Formula Parser, which executes mathematical functions on data packets from several packet buses, with a specified formula. DIAdem calculates the data packets of each block input value-by-value and outputs the results in a data packet that is the same size as the first data input.
Use the Averaging packet block to calculate the arithmetic mean or the moving average for entire data packets or for sections of the data packets, and use the Counter packet block to count measured values, data packets, or time ranges. The Statistics packet block calculates characteristic statistical values for data packets and the Classification block specifies the frequency distributions for the measured values in the data packets. DIAdem divides the data packets into classes and counts how many measured values each class contains.
The function group Signal Analysis (Packet Processing) includes functions such as fast Fourier transform (FFT) and third/octave analysis, which you use to monitor frequency sections of oscillations during measurements. The FFT block transfers signals from the time domain to the frequency domain, the Inverse FFT block reverts signals from the frequency domain to the time domain, and the FFT of Two Time Signals analyzes two signals with a common time channel by calculating cross spectra and transfer functions. You use the Third/Octave Analysis to check the frequency distribution in the signal for frequency domains, not for individual frequencies. To do this, the third/octave analysis sums up the amplitude values of an FFT in standardized logarithmic frequency intervals.

3-6 | ni.com
Chapter 3 Working with Packet Processing
With the Filter packet block, you can attenuate or amplify selected frequency ranges of a time-related signal. You can choose from a selection of filter types, such as lowpass, bandpass, and bandstop filter, as IIR filters and FIR filters. The following figure shows the results from the IIR filters Butterworth and Chebyshev.
Figure 3-1. Signals Filtered with Different Digital Filters Displayed in the Oscilloscope
Packet Functions for Display and File AccessThe Display and I/O (Packet Processing) function group includes the oscilloscope and the voltmeter for visualizing data packets, and packet blocks for manual input and output of data packets. These blocks have their own windows, which you can configure separately and position anywhere on the screen.
The Oscilloscope displays data packets as curves, bars, or spikes. You can display the chronological profile of signals as a three-dimensional surface or in recorder display. You use the menus and the toolbar in the display window to specify the appearance of the display, which you also can change during measurements.
Click Cursor on the toolbar to show two cursor lines for measuring curve profiles and the cursor window. You can move the cursor lines with the mouse during the measurement and enlarge the range between the two cursor lines. The cursor window shows the point numbers and the x-values and the y-values of both cursors.

© National Instruments Ireland Resources Limited | 3-7
NI DIAdem: Data Acquisition and Visualization
The Voltmeter block displays measured values with gauges, digital instruments, horizontal or vertical bars, and text. If the voltmeter contains multi-channel data packets, the window displays a separate instrument for each data channel. Use the context menu of the display window to specify the display mode for the incoming signals and to show the warning and alarm limits, the drag indicator, and the trend display.
The Generator generates signals such as sine signals and noise signals. The Manual Input blocks generate data packets with a slider control, a dial, a switch, a push button, or a bit switch. You use the context menu of the instrument to specify the instrument display. If you generate several signals with a manual input instrument, DIAdem displays an input instrument for each channel in the display window. Manual input generates data blocks that have a block size of 1. Use the bit switch to output integer data values and use the slider control and the dial to output any data values. Use the push button and the switch to output control signals. The push button and the switch blocks return the value 0 when they are off and the value 5 when they are on, whereas the slider control, the dial, and the bit switch output the set value.
The File I/O packet block writes data to files and reads data from files. The Data Read packet block reads data from the Data Portal, for example, as a reference channel and the Data Write packet block saves measurement data in the Data Portal. You use the packet blocks Network Server and Network Client to exchange data packets between DIAdem installations on a network.
Packet Functions for Data Acquisition and OutputThe function group Driver (Packet Processing) includes the functions of the packet sound drivers Sound Input, which acquires signals with the sound board in the computer, and Sound Output, which emits signals on the computer loudspeakers. For more driver functions, register the packet driver of the measurement hardware after selecting Settings»Extensions»GPI Extensions. For the acquisition, output, and processing driver functions, select Settings»Packet Processing»Driver Function Group.
Refer to section Installing Measurement Hardware in Chapter 5, Installing Measurement Hardware and Communicating via Interfaces, for more information about registering DIAdem drivers.
Complete Selection of Packet FunctionsIf you open the Signal Processing (Packet Processing) function group and click Complete Selection, you get packet functions that are not contained in the function groups.
Use the Level Calculation packet block to calculate characteristic values for describing surrounding noise, from a time-related acoustic signal. The Copy block outputs the data packets of an input signal on several packet buses simultaneously. The Trigger Finder monitors a data channel also in multi-channel data packets in order to output a control signal.

© National Instruments Ireland Resources Limited | 4-1
4Monitoring Processes with the Alarm System
You use the alarm system to monitor whether signals overshoot or undershoot limits. Define limits in two stages to trigger alarms with increasing priorities of importance. DIAdem displays the alarms continuously on the screen. You can record and comment on alarms online as they occur. The alarm log can function as an operation report that DIAdem sends straight to those in charge so they are informed about alarms that occur.
Note The NI License Manager only provides the alarm functions if your license contains the alarm system. If not, the buttons in the respective function groups are dimmed. To use the alarm system, you might have to obtain a license for a different DIAdem edition.
The following figure shows how the alarm generator monitors measured values from connected packet buses. If limit values are exceeded, the alarm generator displays alarms in the alarm table on the screen. To record the alarms in a file or to send them in an e-mail, DIAdem converts the alarm information into text. With each alarm, the alarm generator also outputs numeric data packets with the status of the alarms.
The alarm blocks are packet blocks and process the incoming measurement values in data packets in a data-controlled way. The alarm generator does not work until a data packet arrives at the input, and the subsequent alarm table does not work until an alarm packet arrives from the alarm generator. The alarm generator monitors the green and gray packet buses and outputs alarms on the blue and black alarm buses. DIAdem transports text on the gray and gray text buses.

4-2 | ni.com
Chapter 4 Monitoring Processes with the Alarm System
Figure 4-1. Alarm System Structure
Defining AlarmsThe alarm generator is the central function block in the alarm system. The measurement values to be monitored arrive in a packet bus at the alarm block, where you specify the alarm conditions. You confirm alarms in the alarm table, which displays the alarms of the alarm generator.
For example, to use the alarm system to monitor signals from the NI-DAQ driver input, which is already defined in the block diagram, open the function group Alarm System and click the Alarm Generator button shown here. Position the alarm block below the packet block Pack and connect the green and gray packet bus to the data input E on the alarm generator block. Double-click the alarm generator to open the dialog box where you define alarms and change the default settings.
Then click the Alarm Table button in the same function group and position this alarm block to the right of the alarm generator. Connect output A on the alarm generator to input E in the alarm table. DIAdem connects the two alarm blocks with a blue and gray alarm bus.

© National Instruments Ireland Resources Limited | 4-3
NI DIAdem: Data Acquisition and Visualization
Select DIAdem VISUAL to position the display instrument for the alarm table in the DIAdem VISUAL workspace. Click Start Display on the toolbar to display the alarms. As soon as the measured values exceed the limit specified in the alarm generator, the alarm table shows an alarm with a time stamp and a description in each row. As soon as the limit is no longer exceeded, DIAdem deletes the alarm from the alarm table.
Note You should match the block size of the data packets you want to monitor, with the acquisition rate. If the block is substantially larger than the acquisition rate in Hertz, the alarm generator waits a long time for the data packet that is to be monitored. If, on the other hand, the block size is much smaller than the acquisition rate, the alarm generator has to monitor many small data packets.
Specifying Alarm AttributesIn the alarm generator, you specify the alarm attributes to define alarms. DIAdem differentiates between static and dynamic attributes, as shown in the figure. You specify static attributes when you configure the alarm system. DIAdem determines the dynamic attributes during runtime. Static attributes are, for example, the name and number of the channel that is to be monitored, or the limit, the delay, or the comment. Dynamic attributes are the time stamp, the current measured value, or the alarm status. DIAdem manages the five attributes alarm group, alarm type, priority, quit level, and alarm status for all blocks, so that alarms can be filtered with these global parameters, and colors and graphics can be assigned to the alarms for visualization.

4-4 | ni.com
Chapter 4 Monitoring Processes with the Alarm System
Figure 4-2. Static and Dynamic Attributes Describe Alarms
If a limit value is exceeded, DIAdem combines the attributes to a formatted data packet, the alarm, and transports this data packet in alarm buses to the alarm table and to the alarm/text converter.
During a measurement, you can confirm alarms that occur in the alarm table, for example, if it was a false alarm or if the cause of the alarm was rectified during the measurement. DIAdem then changes the alarm status. For this purpose, you connect output A on the alarm table in the block diagram to input T on the alarm generator. You must also click the Display button in the alarm table dialog box and enable the Display button for alarm confirmation checkbox.
Creating ProtocolsTo record the alarms in a file or to send them in an e-mail, DIAdem must convert the alarms into text. To do this, use the alarm block Alarm–>Text and connect this block to the alarm bus. In the dialog box of the alarm/text converter, you select the alarm attributes that you want DIAdem to forward to the subsequent protocol blocks on the text bus. DIAdem creates a format string that consists of the appropriate variables, which are indicated by the @ characters, and text.
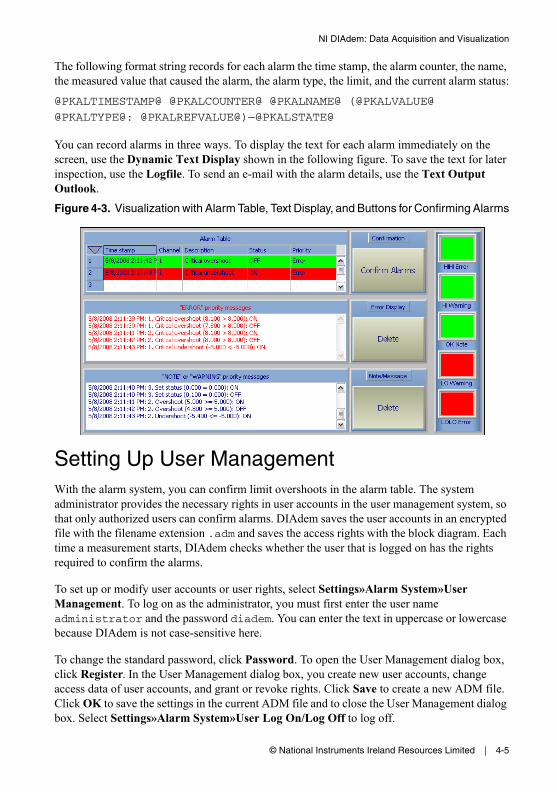
© National Instruments Ireland Resources Limited | 4-5
NI DIAdem: Data Acquisition and Visualization
The following format string records for each alarm the time stamp, the alarm counter, the name, the measured value that caused the alarm, the alarm type, the limit, and the current alarm status:@PKALTIMESTAMP@ @PKALCOUNTER@ @PKALNAME@ (@PKALVALUE@
@PKALTYPE@: @PKALREFVALUE@)—@PKALSTATE@
You can record alarms in three ways. To display the text for each alarm immediately on the screen, use the Dynamic Text Display shown in the following figure. To save the text for later inspection, use the Logfile. To send an e-mail with the alarm details, use the Text Output Outlook.Figure 4-3. Visualization with Alarm Table, Text Display, and Buttons for Confirming Alarms
Setting Up User ManagementWith the alarm system, you can confirm limit overshoots in the alarm table. The system administrator provides the necessary rights in user accounts in the user management system, so that only authorized users can confirm alarms. DIAdem saves the user accounts in an encrypted file with the filename extension .adm and saves the access rights with the block diagram. Each time a measurement starts, DIAdem checks whether the user that is logged on has the rights required to confirm the alarms.
To set up or modify user accounts or user rights, select Settings»Alarm System»User Management. To log on as the administrator, you must first enter the user name administrator and the password diadem. You can enter the text in uppercase or lowercase because DIAdem is not case-sensitive here.
To change the standard password, click Password. To open the User Management dialog box, click Register. In the User Management dialog box, you create new user accounts, change access data of user accounts, and grant or revoke rights. Click Save to create a new ADM file. Click OK to save the settings in the current ADM file and to close the User Management dialog box. Select Settings»Alarm System»User Log On/Log Off to log off.
4-6 | ni.com
Chapter 4 Monitoring Processes with the Alarm System
Alarm System FunctionsThe function group Alarm System includes all the functions you need to define, generate, display, and record alarms and to send alarms as e-mails.
Use the Alarm Generator to define alarms and to monitor data packets for limit overshoots. Use the Alarm Table to display or to confirm alarms output by the alarm generator. Use the alarm block Log User On/Off to allow the users registered in the User Management dialog box to log on and off during measurements.
The alarm block Alarm–>Text outputs selected alarm attributes via text buses, which the alarm block Dynamic Text Display displays on the screen and which the alarm block Logfile saves in a text file. Use the alarm block Text Input to enter comments from the keyboard during measurements, and to display the comments in a separate window in DIAdem VISUAL. If you display the button for confirming the text input, this alarm block displays the comment on the text bus.
Use the block Text Output Outlook to send alarm text as e-mails with Microsoft Outlook. For DIAdem to establish an OLE connection to MS Outlook, you must install MS Outlook and set it up as an active e-mail program. Use the block Text Output DDE to transfer alarm texts via the DDE (Dynamic Data Exchange) interface with fax software, e-mail software, or paging software, or to archive the packets in a database. You enter the DDE server as the recipient of the alarm texts.
Use the Text Multiplexer to combine the alarm texts from the converter with the comments, and to forward them in alternating order to the subsequent alarm blocks, on a text bus. Use the Alarm Multiplexer to combine alarms from various alarm buses. Alarm blocks can process only data packets from an alarm bus or a text bus. Use the alarm blocks Alarm Server and Alarm Client to exchange alarms, and the alarm blocks Text Server and Text Client to exchange alarm texts between DIAdem installations on one network.
© National Instruments Ireland Resources Limited | 5-1
5Installing Measurement Hardware and Communicating via Interfaces
To use DIAdem for measurements and open-loop and closed-loop control, you need an external measurement device that you connect to the computer through an interface, or an acquisition board that you can plug into the computer. You use the associated driver to access the measurement hardware. The function groups for the inputs and outputs contain blocks with prepared functions for connecting hardware and communicating via interfaces.
Installing Measurement HardwareAfter you have connected a measurement device, for example, through USB, the operating system prompts you to install the driver of the hardware manufacturer. Next, you register the associated DIAdem driver, which communicates with the hardware driver, in DIAdem DAC. Then, you can configure the DIAdem DAC function groups with the necessary driver functions.
Installing the Hardware DriversHardware manufacturers supply driver libraries, which you must install in addition to DIAdem together with the hardware. To use National Instruments hardware, install the driver library NI-DAQmx with the Measurement & Automation Explorer (short NI MAX), where you configure the device parameters and the channel parameters of the hardware. You open NI MAX in the Windows Start menu. NI MAX lists the installed hardware and software from National Instruments in a tree view. Double-click Devices and Interfaces to display the installed acquisition boards and connected measurement devices. If you select an item, NI MAX displays the board properties. Click Self-Test to test the hardware. Click Test Panels to check the board functions.
To access National Instruments hardware with DIAdem, you create channels in NI MAX for all the required inputs and outputs. In DIAdem, you use the channel names specified in NI MAX to access these channels. To create a global NI-DAQmx channel, right-click Data Neighborhood in the tree, and select New from the context menu. Select Global NI-DAQmx Virtual Channel. The Channel Wizard guides you through the configuration and specifies the measurement mode and the terminal. NI MAX lists all the virtual channels in the Data Neighborhood branch of the tree hierarchy, as shown in the following figure. A wizard helps you define a two-point calibration on the Calibration tab. To acquire data in real time, you should scale the measured values in DIAdem and not in NI MAX.

5-2 | ni.com
Chapter 5 Installing Measurement Hardware and Communicating via Interfaces
Figure 5-1. Creating an NI-DAQmx Channel in the Measurement & Automation Explorer (NI MAX)
Registering and Configuring DIAdem DriversThe DIAdem driver connects the driver library of the manufacturer to DIAdem DAC. DIAdem drivers are in DLLs (DLL: Dynamic Link Library), which you register in DIAdem by selecting Settings»Extensions»GPI Extensions. Click the Standard Extensions tab to check whether the DLL you need for your hardware is already registered in DIAdem. Click the User Extensions tab to load an additional DLL. You can obtain the DIAdem driver and the driver library from the hardware manufacturer.
The DLL GfSNIDAQ.dll is required for communication between the driver library NI-DAQmx and DIAdem and is registered by default, which means that the associated driver block is already in the driver inputs and driver outputs. To use the channels that are defined in NI MAX for data acquisition, open the Driver Inputs function group and click NI-DAQmx Driver. Double-click the block to open the block dialog box, and select the channels you want.

© National Instruments Ireland Resources Limited | 5-3
NI DIAdem: Data Acquisition and Visualization
Figure 5-2. Using NI-DAQmx Channels in DIAdem
After the registration of non-National Instruments DIAdem drivers in DIAdem DAC, you must select Settings»Single Point Processing»Driver Function Groups to specify which functions the driver offers for acquisition and output. This is not necessary for the NI-DAQmx driver. Here you can add, delete, and configure DIAdem drivers, signal inputs, signal outputs, and processing functions that the driver can also execute on the measurement hardware. Make sure that the device parameters, such as the base address or the input voltage range, are the same as the settings on the measurement hardware.
You usually use Plug&Play to specify system resources such as base address, IRQs, or DMA channels. The operating system and the hardware that is already installed ensure that the new hardware is integrated correctly. If you manually specify the system resources the hardware requires, ensure that no other application uses this resource.
Note Usually you access installed hardware with different applications, such as DIAdem and LabVIEW, alternately and not simultaneously. National Instruments hardware recognizes this type of conflict at the driver level and displays an error message.
In the function groups Driver inputs, Driver outputs, and Processing, DIAdem displays the configured driver functions. DIAdem saves all configured driver functions in the desktop file.
If you change the predefined settings of the driver blocks in the function groups, the settings of the driver blocks in the block diagram remain unchanged. DIAdem saves the settings of the driver blocks included in a block diagram, in the block diagram. If you use different hardware, you can replace the driver blocks in the block diagram with the driver inputs and driver outputs

5-4 | ni.com
Chapter 5 Installing Measurement Hardware and Communicating via Interfaces
from the new hardware. To do this, drag and drop the driver blocks of the new hardware onto the blocks you want to replace in the block diagram. Where possible, DIAdem uses the settings of the previous blocks for the new blocks.
Communicating via InterfacesCommunicate with external measurement devices connected to the computer through an interface, either directly through the OPC driver or NI-XNET driver, or indirectly through a control file or the VBS driver.
Using OPCDIAdem can communicate through the OPC interface as an OPC client with every local OPC server or with OPC servers found in the network and can access the available measurement hardware. This enables you to connect DIAdem to field bus systems and the associated hardware. In addition to the traditional OPC driver, which is based on the outdated COM/DCOM model, DIAdem supports the current standard OPC UA (Open Platform Communications Unified Architecture). DIAdem DAC can provide multiple access to one OPC UA server and can access several OPC UA servers simultaneously.
Using NI-XNETWith the NI-XNET driver, DIAdem can acquire and output data with the NI-XNET hardware. The NI-XNET hardware supports the bus systems CAN (Controller Area Network), LIN (Local Interconnect Network), and FlexRay. Describe the bus system configuration in a database file. The NI-XNET driver supports the database formats Fibex (.xml), NI-CAN (.ncd), CANdb (.dbc), and LIN (.ldf). The database file describes the network (Cluster) and the transferred data packets (Frames). Every frame contains several signals which contain the actual measurement data. The DIAdem driver accesses the signals defined in the database file directly. Frames and signals are referenced through their names. DIAdem does not support direct access to the raw data of the frames.
Using ECU Measurement and Calibration Toolkit Driver The NI ECU Measurement and Calibration Toolkit is used for acquiring data from Engine Control Units (ECUs). You must first install the NI ECU Measurement and Calibration Toolkit to use the ECU Measurement and Calibration Toolkit driver with DIAdem.
The CAN Calibration Protocol (CCP) or the more general Universal Measurement and Calibration Protocol (XCP) is used for executing the measurement data acquisition and calibration of Electronic Control Units (ECU). CCP is a protocol for measuring and calibrating ECU data and is based on CAN. The data of a control device is accessed through the description file in A2L format, which is based on the ASAM standard MCD 2MC.

© National Instruments Ireland Resources Limited | 5-5
NI DIAdem: Data Acquisition and Visualization
Using Control File DriversYou can use the control file driver to access external measurement devices in DIAdem thorugh the RS-232 interface or General Purpose Interface Bus (GPIB). This communication is based on a simply-structured text file, in which a communication protocol for linking devices is defined. Use the Example.atr control file as an example.
A control file consists of the measurement preparation, the actual measurement, and the measurement follow-up. The Init procedure starts communicating with the measurement device and the Start procedure starts a measurement. During the measurement, DIAdem calls the Input procedure for data input and the Output procedure for data output cyclically in the specified measurement clock. The Stop procedure stops the measurement and the DeInit procedure resets the measurement device. You can use several control file driver blocks in one block diagram, and you can address several external devices in one control file.
In order to communicate with external devices through the serial interfaces COM1 to COM9 and through GPIB (DIN IEC 625 or IEEE 488), use the interface monitor on the toolbar, which sends strings to a device and displays the answers on the monitor. The interface monitor is useful for testing and commissioning programmable measurement devices and for programming control files. In the hexadecimal display mode, you can see all the control characters the device sends.
Using Script DriversThe Script driver uses Visual Basic Script (VBS) to acquire, process, and output data with external devices. You can use VBS for more complex tasks such as test sum calculations, which you cannot execute with the control file driver. The UDI communication layer communicates with the interfaces RS-232, GPIB, and TCP/IP to exchange data with external devices. In the Script block you specify the inputs, outputs, the script, and the user dialog box. To create a script, click Parameter»Script Template. DIAdem opens a wizard where you select the interface and specify the script functions. DIAdem creates a template, which you can edit in DIAdem SCRIPT. Use the dialog editor in DIAdem SCRIPT to create a parameter dialog box for your script application.

© National Instruments Ireland Resources Limited | 6-1
6The Basics of Data Acquisition with DIAdem
For computer-based data acquisition of measured signals, you need to be aware of the phenomena involved in a measurement chain, so that you can choose and set the individual components correctly in order to minimize or avoid errors. This chapter gives you a brief outline of the basics of process measuring and control technology, and describes the measurement modes and sampling rates that are available in DIAdem.
Computer-Based Signal AcquisitionThe following figure shows the basic processes involved in the acquisition of temperature measurement values with DIAdem DAC. The top display solves the task with a data acquisition measurement plugin, and the bottom display solves the task with an external measurement device connected to the computer via a digital interface such as GPIB or USB.
For measured value acquisition, sensors first convert the physical quantities, which are to be measured, into voltage or current. This creates, for example, a temperature-related voltage at a thermocouple. The sensor signals are then transferred to a measurement amplifier and converted into numeric values for the computer, using an A/D converter. The A/D converter converts the continuous, analog signal into measured values that are time-discrete and amplitude-discrete. DIAdem can reconvert the measured values into the original physical quantities or save the values for later offline analyses.
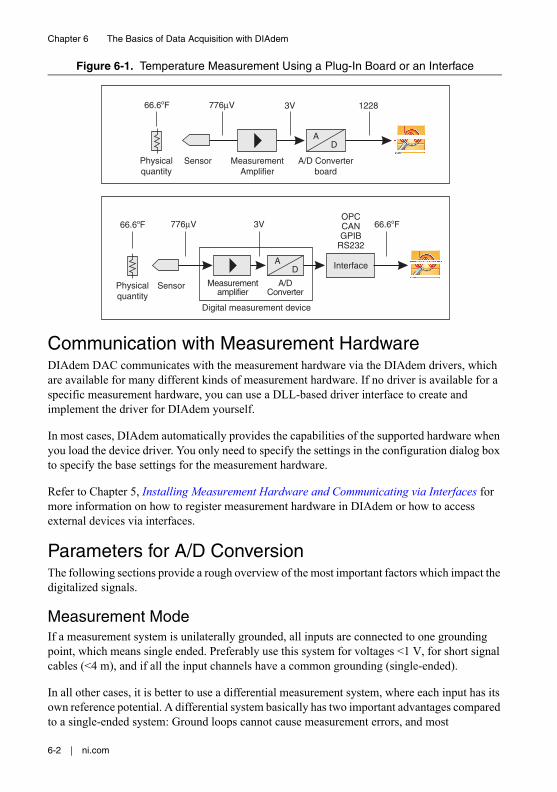
6-2 | ni.com
Chapter 6 The Basics of Data Acquisition with DIAdem
Figure 6-1. Temperature Measurement Using a Plug-In Board or an Interface
Communication with Measurement HardwareDIAdem DAC communicates with the measurement hardware via the DIAdem drivers, which are available for many different kinds of measurement hardware. If no driver is available for a specific measurement hardware, you can use a DLL-based driver interface to create and implement the driver for DIAdem yourself.
In most cases, DIAdem automatically provides the capabilities of the supported hardware when you load the device driver. You only need to specify the settings in the configuration dialog box to specify the base settings for the measurement hardware.
Refer to Chapter 5, Installing Measurement Hardware and Communicating via Interfaces for more information on how to register measurement hardware in DIAdem or how to access external devices via interfaces.
Parameters for A/D ConversionThe following sections provide a rough overview of the most important factors which impact the digitalized signals.
Measurement ModeIf a measurement system is unilaterally grounded, all inputs are connected to one grounding point, which means single ended. Preferably use this system for voltages <1 V, for short signal cables (<4 m), and if all the input channels have a common grounding (single-ended).
In all other cases, it is better to use a differential measurement system, where each input has its own reference potential. A differential system basically has two important advantages compared to a single-ended system: Ground loops cannot cause measurement errors, and most
Sensor MeasurementAmplifier
A/D Converterboard
66.6oF 3V
Physicalquantity
776µV
AD
1228
Sensor
66.6oF 3V
Physicalquantity
776µV
Interface
Measurementamplifier
A/DConverter
AD
Digital measurement device
OPCCANGPIB
RS232
66.6oF
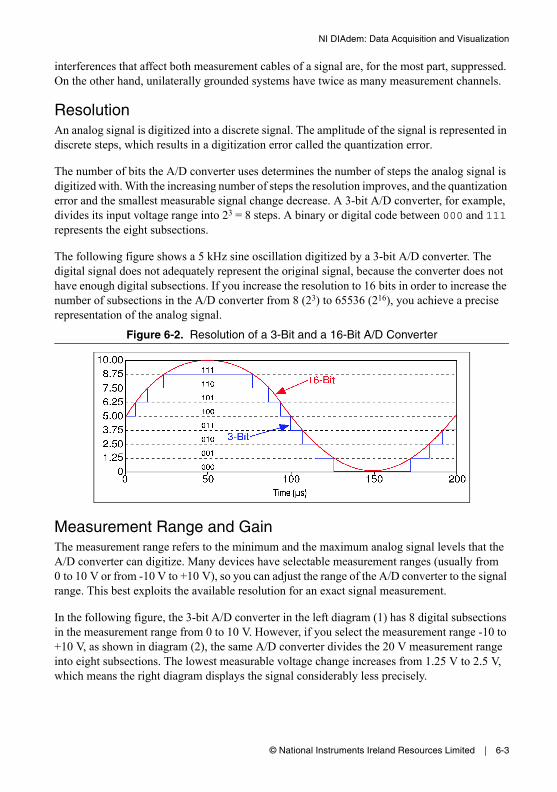
© National Instruments Ireland Resources Limited | 6-3
NI DIAdem: Data Acquisition and Visualization
interferences that affect both measurement cables of a signal are, for the most part, suppressed. On the other hand, unilaterally grounded systems have twice as many measurement channels.
ResolutionAn analog signal is digitized into a discrete signal. The amplitude of the signal is represented in discrete steps, which results in a digitization error called the quantization error.
The number of bits the A/D converter uses determines the number of steps the analog signal is digitized with. With the increasing number of steps the resolution improves, and the quantization error and the smallest measurable signal change decrease. A 3-bit A/D converter, for example, divides its input voltage range into 23 = 8 steps. A binary or digital code between 000 and 111 represents the eight subsections.
The following figure shows a 5 kHz sine oscillation digitized by a 3-bit A/D converter. The digital signal does not adequately represent the original signal, because the converter does not have enough digital subsections. If you increase the resolution to 16 bits in order to increase the number of subsections in the A/D converter from 8 (23) to 65536 (216), you achieve a precise representation of the analog signal.
Figure 6-2. Resolution of a 3-Bit and a 16-Bit A/D Converter
Measurement Range and GainThe measurement range refers to the minimum and the maximum analog signal levels that the A/D converter can digitize. Many devices have selectable measurement ranges (usually from 0 to 10 V or from -10 V to +10 V), so you can adjust the range of the A/D converter to the signal range. This best exploits the available resolution for an exact signal measurement.
In the following figure, the 3-bit A/D converter in the left diagram (1) has 8 digital subsections in the measurement range from 0 to 10 V. However, if you select the measurement range -10 to +10 V, as shown in diagram (2), the same A/D converter divides the 20 V measurement range into eight subsections. The lowest measurable voltage change increases from 1.25 V to 2.5 V, which means the right diagram displays the signal considerably less precisely.
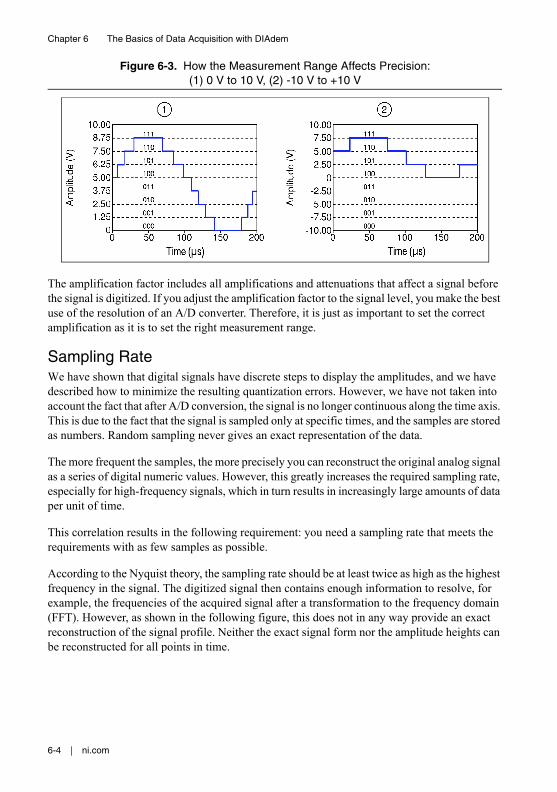
6-4 | ni.com
Chapter 6 The Basics of Data Acquisition with DIAdem
Figure 6-3. How the Measurement Range Affects Precision: (1) 0 V to 10 V, (2) -10 V to +10 V
The amplification factor includes all amplifications and attenuations that affect a signal before the signal is digitized. If you adjust the amplification factor to the signal level, you make the best use of the resolution of an A/D converter. Therefore, it is just as important to set the correct amplification as it is to set the right measurement range.
Sampling RateWe have shown that digital signals have discrete steps to display the amplitudes, and we have described how to minimize the resulting quantization errors. However, we have not taken into account the fact that after A/D conversion, the signal is no longer continuous along the time axis. This is due to the fact that the signal is sampled only at specific times, and the samples are stored as numbers. Random sampling never gives an exact representation of the data.
The more frequent the samples, the more precisely you can reconstruct the original analog signal as a series of digital numeric values. However, this greatly increases the required sampling rate, especially for high-frequency signals, which in turn results in increasingly large amounts of data per unit of time.
This correlation results in the following requirement: you need a sampling rate that meets the requirements with as few samples as possible.
According to the Nyquist theory, the sampling rate should be at least twice as high as the highest frequency in the signal. The digitized signal then contains enough information to resolve, for example, the frequencies of the acquired signal after a transformation to the frequency domain (FFT). However, as shown in the following figure, this does not in any way provide an exact reconstruction of the signal profile. Neither the exact signal form nor the amplitude heights can be reconstructed for all points in time.

© National Instruments Ireland Resources Limited | 6-5
NI DIAdem: Data Acquisition and Visualization
Figure 6-4. How a Low Sampling Rate Affects Data Acquisition
As this figure shows, a multiple of the Nyquist frequency is necessary if you want to display the correct shape of the signal as well as the frequency.
Anti-Aliasing FilterIf the sampling rate is lower than the sampling rate determined according to the Nyquist theory, an effect called Aliasing occurs. This effect causes digitized signal forms or signal frequency parts that are essentially different from the actual analog signal (alias frequencies). The data generated by undersampling display frequency contents that are substantially lower than the original signal, as shown in two examples in the following figure.
Sampling Rate 100 Hz
Sampling Rate 50 Hz
Sampling Rate 25 Hz
Sampling Rate 12 Hz
0 0.2 0.4 0.6 0.8 1–1
–0.5
0
0.5
1
Am
plitu
de
1050 15 200
0.2
0.4
0.60.8
0 0.2 0.4 0.6 0.8 1–1
–0.5
0
0.5
1
Am
plitu
de
0 0.2 0.4 0.6 0.8 1–1
–0.5
0
0.5
1
Am
plitu
de
0 0.2 0.4 0.6 0.8 1
Time
–1–0.5
0
0.5
1
1050 15 200
0.2
0.4
0.6
0.8
1050 15 200
0.2
0.4
0.6
0.8
1050 15 20
Frequency
0
0.2
0.4
0.6
0.8
Am
plitu
de

6-6 | ni.com
Chapter 6 The Basics of Data Acquisition with DIAdem
Figure 6-5. Aliasing Effects Caused by Undersampling a Signal
You cannot distinguish between these apparent signal sections of the digitized signal and the real signal frequencies. Therefore, you cannot correct errors caused by aliasing.
If you cannot attain the sampling frequency that is required to measure a signal, or if the highest frequency in the signal is unknown, you must filter the analog signal with lowpass filters (anti-aliasing filters) before the A/D conversion. Alternatively, you can increase the sampling frequency by using other measurement hardware or a different type of measurement.
According to the Nyquist criterion, an appropriate lowpass filter must only let through signals that have frequencies lower than half the sampling rate used for the A/D conversion. In this case, filters that have very steep slopes are most suitable.
Note Do not confuse anti-aliasing filters with digital filters on the digital side after the A/D converter.
Unwanted noise distorts the analog signal before the signal is converted into a digital signal. You can limit external influences by using suitable signal conditioning, such as filtering and amplification, before digitization. Another way to reduce noise distortion is to oversample the signal, which means using a higher sampling rate for data acquisition and then averaging the digitized values.
0 0.5 1.0 1.5 2 2.5Zeit
–1
–0.75
–0.5
–0.25
0
0.25
0.5
0.75
1
+
+
+ ++
+
+
++ +
+
+
+
+ ++
+
0 0.5 1 1.5 2 2.5
Time
–1
–0.75
–0.5
–0.25
0
0.25
0.5
0.75
1
++
++
++ + + + + + + + +
++
+
Am
plitu
deA
mpl
itude +
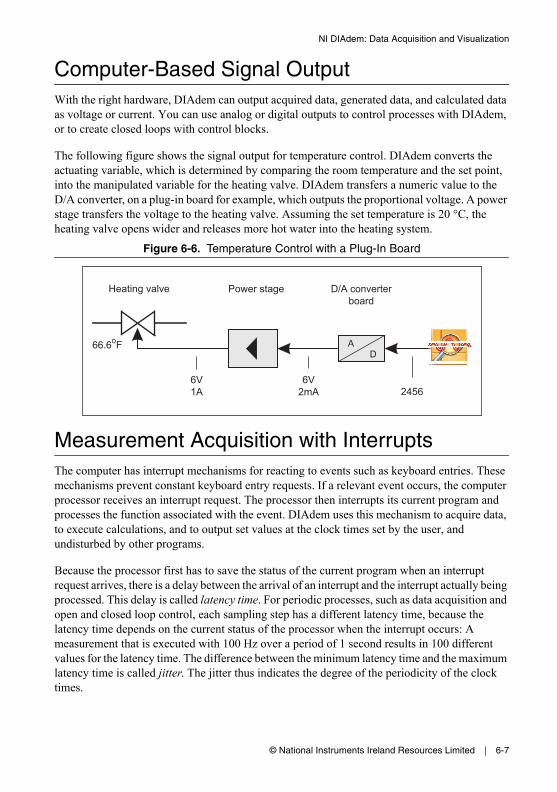
© National Instruments Ireland Resources Limited | 6-7
NI DIAdem: Data Acquisition and Visualization
Computer-Based Signal OutputWith the right hardware, DIAdem can output acquired data, generated data, and calculated data as voltage or current. You can use analog or digital outputs to control processes with DIAdem, or to create closed loops with control blocks.
The following figure shows the signal output for temperature control. DIAdem converts the actuating variable, which is determined by comparing the room temperature and the set point, into the manipulated variable for the heating valve. DIAdem transfers a numeric value to the D/A converter, on a plug-in board for example, which outputs the proportional voltage. A power stage transfers the voltage to the heating valve. Assuming the set temperature is 20 °C, the heating valve opens wider and releases more hot water into the heating system.
Figure 6-6. Temperature Control with a Plug-In Board
Measurement Acquisition with InterruptsThe computer has interrupt mechanisms for reacting to events such as keyboard entries. These mechanisms prevent constant keyboard entry requests. If a relevant event occurs, the computer processor receives an interrupt request. The processor then interrupts its current program and processes the function associated with the event. DIAdem uses this mechanism to acquire data, to execute calculations, and to output set values at the clock times set by the user, and undisturbed by other programs.
Because the processor first has to save the status of the current program when an interrupt request arrives, there is a delay between the arrival of an interrupt and the interrupt actually being processed. This delay is called latency time. For periodic processes, such as data acquisition and open and closed loop control, each sampling step has a different latency time, because the latency time depends on the current status of the processor when the interrupt occurs: A measurement that is executed with 100 Hz over a period of 1 second results in 100 different values for the latency time. The difference between the minimum latency time and the maximum latency time is called jitter. The jitter thus indicates the degree of the periodicity of the clock times.
6V1A
D/A converterboard
AD
Power stageHeating valve
6V2mA 2456
66.6oF

6-8 | ni.com
Chapter 6 The Basics of Data Acquisition with DIAdem
The acceptable jitter level depends on the particular task at hand. In visualization tasks, tests have shown that delays of up to 100 ms are not actually perceived as delays. Therefore, it is acceptable for an alarm light to respond with a delay of up to 100 ms after the time the alarm occurs. On the other hand, the periods between the output times have to be precise in digital closed loop control. The output time is the time when the D/A converter is accessed to output the manipulated variable. If the controller output is to be made with 1 khz and the periodicity error of the output time is less than 5%, the maximum valid jitter is 100 microseconds.
Different DIAdem Measurement ModesDIAdem differentiates between the measurement types software clock and hardware clock, which you select in the system clock block. DIAdem, Windows, and the computer generate the rate for the software clock and the measurement hardware generates the rate for the hardware clock.
The standard DIAdem clock is the software clock, which fully supports the entire range of DIAdem functions. In the Software Clock measurement mode, the DAC kernel controls the complete measurement procedure. You can use the software clock in Windows timing or in multicore timing. By default, DIAdem automatically sets the best possible timing for the computer hardware and the measurement hardware. To specify the timing in DIAdem DAC, select Settings»Single Point Processing»Measurement Parameters»Timer. If you select multicore timing, you can execute only one measurement. If you select Windows timing, you can execute several measurements in different DIAdem instances.
When measuring with several system clocks, DIAdem uses the least common multiple of the single sampling rates as the total sampling rate, in the software clock. If the total sampling rate is too high, DIAdem tries to adjust the single sampling rates. If the DAC kernel cannot find a solution for the computer and the measurement hardware used, DIAdem aborts the measurement preparations.
In the Hardware clock mode, the measurement hardware generates the clock and the DAC kernel checks the measurement sequence control according to the buffered data. This measurement mode supports the entire range of DIAdem functions with a few limitations, which include not being able to output signals in the hardware clock.
Software Clock with Windows TimingIf you set the software clock with Windows timing, DIAdem uses the computer multimedia timer for the clock rate. In this measurement mode, you can process analog and digital signals and execute measurements with nearly every hardware and a number of different devices. The Windows timing allows channel sampling rates of up to 1 khz and latency times of a few milliseconds.

© National Instruments Ireland Resources Limited | 6-9
NI DIAdem: Data Acquisition and Visualization
You can use Windows timing to execute measurements with different sampling rates simultaneously on one measurement hardware. DIAdem requests the measurement values from the hardware at a clock rate that Windows generates. DIAdem processes the measured values, displays the results, and outputs signals. Other programs might require the operating system and prevent an accurate clock rate. The deviations can be in the millisecond range. You can reduce these deviations if you do not execute other processes on the computer at the same time.
For most process measurement and control tasks, Windows timing is completely adequate for clock rate generation, which is why most hardware drivers support only this type of timing. For time-critical processes that require more precise reaction times, you must use the software clock with multicore timing.
Software Clock with Windows TimingIf DIAdem runs in the software clock mode together with multicore timing, DIAdem uses one processor core exclusively and with top priority to generate the base clock. DIAdem uses this base clock to process the measurements defined in the block diagram, on other processor cores. Multicore timing achieves sampling rates above 1 khz and better latency times than Windows timing. If the computer is suitable, Windows timing drivers also support multicore timing. Under Windows the multicore timing offers the best timing in the software clock.
Multicore timing is not available on computers with only one processor core.
Hardware ClockIn the Hardware clock measurement mode, timers on the measurement hardware generate the clock rate. Use the hardware clock to acquire data at high sampling rates. The maximum clock rate nearly always reaches the specified maximum sampling rate of the measurement hardware. You can generally only use the hardware clock with analog inputs, because digital inputs usually work with no clock rate on the hardware and thereby do not support the hardware clock.
The hardware clock achieves very high sampling rates. During the measurement preparations, DIAdem transfers the specified sampling rate and the channel list to the measurement hardware and then starts the measurement. The measured data first goes into the measurement hardware buffer. The data is read from this buffer at regular intervals and forwarded to DIAdem. Data output has priority because the device buffer is limited. DIAdem buffers the data again if the data is not processed immediately. Depending on the driver, this computer buffer can expand to several megabytes for very fast measurements.
The hardware clock delivers data that is acquired at a guaranteed high-speed sampling rate. However, processing is always slightly delayed, because the data can never be read from the buffer in real time. In many applications, it is irrelevant whether data is displayed or saved a few milliseconds slower, as long as the end-result and the time reference are correct. However, if immediate reactions are required during the measurement, the delay can lead to unacceptable results.
6-10 | ni.com
Chapter 6 The Basics of Data Acquisition with DIAdem
Because usually digital signals cannot be recorded in the hardware clock, the signals must be measured in parallel in the software clock. This can lead to delays because the timers on the computer and the measurement hardware cannot be synchronized at the start of or during the measurement. Because two timers never start at exactly the same time and never run at exactly the same speed, the times in the time channels are not exactly the same after a measurement. The deviation usually amounts to a few milliseconds.
© National Instruments Ireland Resources Limited | A-1
ANI Services
NI provides global services and support as part of our commitment to your success. Take advantage of product services in addition to training and certification programs that meet your needs during each phase of the application life cycle; from planning and development through deployment and ongoing maintenance.
To get started, register your product at ni.com/myproducts.
As a registered NI product user, you are entitled to the following benefits:• Access to applicable product services.• Easier product management with an online account.• Receive critical part notifications, software updates, and service expirations.
Log in to your MyNI user profile to get personalized access to your services.
Services and Resources
• Maintenance and Hardware Services—NI helps you identify your systems’ accuracy and reliability requirements and provides warranty, sparing, and calibration services to help you maintain accuracy and minimize downtime over the life of your system. Visit ni.com/services for more information.– Warranty and Repair—All NI hardware features a one-year standard warranty that
is extendable up to five years. NI offers repair services performed in a timely manner by highly trained factory technicians using only original parts at an NI service center.
– Calibration—Through regular calibration, you can quantify and improve the measurement performance of an instrument. NI provides state-of-the-art calibration services. If your product supports calibration, you can obtain the calibration certificate for your product at ni.com/calibration.
• System Integration—If you have time constraints, limited in-house technical resources, or other project challenges, National Instruments Alliance Partner members can help. To learn more, call your local NI office or visit ni.com/alliance.
A-2 | ni.com
Appendix A NI Services
• Training and Certification—The NI training and certification program is the most effective way to increase application development proficiency and productivity. Visit ni.com/training for more information.– The Skills Guide assists you in identifying the proficiency requirements of your
current application and gives you options for obtaining those skills consistent with your time and budget constraints and personal learning preferences. Visit ni.com/skills-guide to see these custom paths.
– NI offers courses in several languages and formats including instructor-led classes at facilities worldwide, courses on-site at your facility, and online courses to serve your individual needs.
• Technical Support—Support at ni.com/support includes the following resources:– Self-Help Technical Resources—Visit ni.com/support for software drivers and
updates, a searchable KnowledgeBase, product manuals, step-by-step troubleshooting wizards, thousands of example programs, tutorials, application notes, instrument drivers, and so on. Registered users also receive access to the NI Discussion Forums at ni.com/forums. NI Applications Engineers make sure every question submitted online receives an answer.
– Software Support Service Membership—The Standard Service Program (SSP) is a renewable one-year subscription included with almost every NI software product, including NI Developer Suite. This program entitles members to direct access to NI Applications Engineers through phone and email for one-to-one technical support, as well as exclusive access to online training modules at ni.com/self-paced-training. NI also offers flexible extended contract options that guarantee your SSP benefits are available without interruption for as long as you need them. Visit ni.com/ssp for more information.
• Declaration of Conformity (DoC)—A DoC is our claim of compliance with the Council of the European Communities using the manufacturer’s declaration of conformity. This system affords the user protection for electromagnetic compatibility (EMC) and product safety. You can obtain the DoC for your product by visiting ni.com/certification.
For information about other technical support options in your area, visit ni.com/services, or contact your local office at ni.com/contact.
You also can visit the Worldwide Offices section of ni.com/niglobal to access the branch office websites, which provide up-to-date contact information, support phone numbers, email addresses, and current events.
© National Instruments Ireland Resources Limited | I-1
Index
AA/D Conversion, 6-1, 6-2Alarm attributes, 5-3Alarm Buses, 2-3, 5-1Alarm System, 5-1
Alarm attributes, 5-3Alarm blocks, 5-1Alarm definition, 5-2Alarm generator, 5-2Alarm multiplexer, 5-6Alarm table, 5-2Confirming alarms, 5-4Converting alarms into text, 5-4Dynamic text display, 5-6Functions, 5-6Logfile, 5-6Recording alarms, 5-4Sequencers, 5-1Server-client communication, 5-6Text entry, 5-6Text multiplexer, 5-6Text output DDE, 5-6Text output Outlook, 5-6User management, 5-5
Alphanumeric Display, 3-6Amplification, 6-4Analog Instruments, 3-5Anti-Aliasing Filter, 6-5
BBar Display, 3-6Binary and Status Display, 3-7Block Diagram Parameters, 2-7Block Diagrams
Check, 2-2Create, 2-1Creating a bus, 2-2Defining data source, 2-1Edit, 2-6Lock editing, 2-6Measurement definition, 2-1Measurement kernel settings, 2-6
Overview display, 2-6Save, 2-7Search, 2-6Specifying the sampling rate, 2-6Using driver blocks, 1-3
Block Terminals, 2-3Inverted outputs, 2-11
Buses, 2-3Breaks, 2-2Create, 2-2Display layers, 2-2Linking, 2-2
CColor Matrices, 3-7Container, 3-6Control
Absolute time, 2-11Checkbox, 2-11Formula, 2-11Impulse delay, 2-11Inverted outputs, 2-11JK flip flop, 2-12Mono flop, 2-12Number of values, 2-12Operators, 2-11Push button, 2-11Radio button, 2-11Relay switch, 2-12RS flip flop, 2-12Signal alteration, 2-11Slope, 2-11System clock status, 2-12Time range, 2-11Trigger sequence status, 2-12Window, 2-11
Control Buses, 2-3, 2-11Block terminals, 2-3Control signals, 2-11Inverted outputs, 2-11
Control File Driver, 1-4, 2-8Controller, 2-10

Index
I-2 | ni.com
Curve Display, 3-4Cylinder Tachometer, 3-5
DD/A Conversion, 6-7Data Buses, 2-3Data Packets, 4-1
Multi-channel, 4-3DDE, 5-6Default System Clock, 2-6DIAdem VISUAL, 3-1Dial, 3-4Driver Inputs, 1-3, 2-1, 2-8Driver Outputs, 1-3, 2-8Driver Packet Processing, 4-7
EECU Driver, 2-8
FFormulas, 2-10, 2-11Full-screen mode, 3-2
GGauge Display, 3-5GPS Driver, 2-8Graphics, 3-7
HHardware Clock, 6-9Hardware Driver, 6-2
IInstruments
Align, 3-2Edit, 3-2Outline, 3-2Packet processing, 4-7
Interfaces, 1-1Control file driver, 1-4, 2-8DDE, 2-8GFSUDI, 1-5GPIB, 1-5Interface monitor, 1-5OPC, 1-4, 2-8OPC UA, 2-8Registering hardware, 1-4RS-232, 1-5Script driver, 1-5, 2-8TCP/IP, 1-5XNET, 2-8
Interrupts, 6-7
JJitter, 6-7
LLights, 3-7List Length, 2-3Lock Editing, 2-6, 3-2
MManual Instruments, 3-4Map Display, 3-5Measurement & Automation Explorer, 1-1Measurement and Control, 2-1Measurement Engineering, 6-1
Amplification, 6-4Anti-aliasing filter, 6-5Measurement range, 6-3Resolution, 6-3Sampling rate, 6-4Signal acquisition, 6-1Signal output, 6-7
Measurement Hardware, 6-2Configuring driver function group, 1-3Control file driver, 1-4Driver installation, 1-1Install, 1-1NI MAX, 1-1Register DIAdem drivers, 1-2

NI DIAdem: Data Acquisition and Visualization
© National Instruments Ireland Resources Limited | I-3
Measurement ModeDifferential, 6-3Single-ended, 6-3
Measurement Modes, 6-8Measurement Range, 6-3Measurements
Cancel, 2-1Display without data storage, 2-1Request status, 2-2Saving data, 2-8With data storage, 2-2Without display, 2-2
Message Display, 3-6Monitoring, 3-7Monitoring Limit Values, 5-1Multicore Timing, 6-9
NNumeric Input, 3-4Nyquist Criterion, 6-6
OOBD-II Driver, 2-8OPC, 1-4Oscilloscopes, 4-2, 4-6
PPacket Buses, 2-3Packet Processing, 4-1
2-point scaling, 4-5Block size, 4-3Clock, 4-5Complete selection, 4-7Control signals, 4-3Copy, 4-7Counter, 4-5Data acquisition and output, 4-7Demultiplexer, 4-4Display instruments, 4-6Display window, 4-3FFT, 4-5Filters, 4-5Formula parser, 4-5Generator, 4-7
Input/output, 4-6Level calculation, 4-7Linear scaling, 4-5Manager, 4-4Manual input, 4-7Manual input instruments, 4-3Mean value, 4-5Merge, 4-4Multiple point scaling, 4-5Multiplexer, 4-4Network server/client, 4-7Offset register, 4-4Online classifications, 4-5Oscilloscope, 4-2Oscilloscopes, 4-6Pack, 4-2, 4-4Read and write data, 4-7Relay switch, 4-5Replicator, 4-4Sampling rate, 4-3Sections, 4-4Signal analysis, 4-4, 4-5Statistics, 4-5Stop, 4-5System clock, 4-3Thermo linearization, 4-5Third/octave analysis, 4-5Trigger, 4-5Trigger finder, 4-7Unpack, 4-4Visualization, 4-6Voltmeter, 4-6Working method, 4-1, 4-3
Polar Display, 3-6Processing
2-point controller, 2-103-point controller, 2-10Binary code -> Gray code, 2-11Bit bundling, 2-11Bit extraction, 2-11Control signal->Data signal, 2-10Formula, 2-10GPI extensions, 2-11Mean of n signals, 2-11Moving mean, 2-11

Index
I-4 | ni.com
PID controller, 2-10Signal copy, 2-10Signal multiplexer, 2-10Using measurement hardware, 1-3VBS script, 2-11
Push Button, 3-4
QQuantization Error, 6-3
RRadio Button, 3-4Recorder, 3-4Recording Video, 3-8Rectangles, 3-7Resolution, 6-3Response Time, 6-7
SSampling Rate, 6-4, 6-8Scaling
3D interpolation, 2-10Free linearization, 2-10Linear scaling, 2-10Offset correction, 2-10Pt100 linearization, 2-10Thermo linearization, 2-10Two-point scaling, 2-10
Scatter Display, 3-5Script Driver, 1-5, 2-8Signal Acquisition, 6-1Signal Output, 6-7Signals
Connect, 2-4Disable, 2-4Disconnect, 2-4Inputs, 2-4
Simulation Inputs, 2-2, 2-9Absolute time, 2-9Buffer monitor, 2-9Constant, 2-9Counter, 2-9Date, 2-9Dial, 2-9
Function generator, 2-9Noise, 2-9Numeric input, 2-9Push button, 2-9Radio button, 2-9Random, 2-9Read channel from DAT file, 2-9Read channel from DAT measurement
file, 2-9Read channel from Data Portal, 2-9Read from buffer, 2-9Slider control, 2-9Stopwatch, 2-9Switch, 2-9System-buffer monitor, 2-9Time, 2-9
Simulation Outputs, 2-9Activate window, 2-9Execute application, 2-9Loudspeakers, 2-9Write to buffer, 2-9
Single Point Processing, 4-1Slider Control, 3-4Software Clock, 6-8
Measure in interrupt mode, 6-7Multicore timing, 6-9Response time, 6-7Windows timing, 6-8
Spikes, 3-4Start Display, 2-1Status, 3-7Subblock Diagrams, 2-4
Import, 2-5VISUAL pages, 3-3
Switch, 3-4, 3-7System
Save in variables, 2-8Saving data, 2-8Saving data with a trigger, 2-8System clock, 2-8Trigger sequence, 2-8
System Buses, 2-3System Clock, 6-8
NI DIAdem: Data Acquisition and Visualization
© National Instruments Ireland Resources Limited | I-5
TTachometer, 3-5Text Buses, 2-3, 5-1Text Display, 3-6
UUser Commands, 2-7User Management, 5-5
VValves, 3-7Visualization, 3-1
Alphanumeric display, 3-6Bar display, 3-6Binary and status display, 3-7Create, 3-1Curve display, 3-4Edit, 3-2Full-screen mode, 3-2Gauge display, 3-5Image and video display, 3-7Input instruments, 3-4Lock editing, 3-2Packet Processing, 4-6Recorder, 3-1Recorder display, 3-4Settings, 3-3Spike display, 3-4VISUAL pages, 3-2Wiper display, 3-4XY display, 3-5
Voltmeter, 4-6
WWindows Timing, 6-8Wiper, 3-4
XXY Display, 3-5