Embed Size (px)
Citation preview

MN DEP T OFTISTAT IIIIION
3 0314 00026 8135
Final 999Report 1999-I 19
Next Generation R/WIS:Concept and Prototype
ImplementationCTSTE228.3.K861999
,AL
L
^ ' ,
'^
I;;


47 7/L0-5Technical Report Documentation Page
1. Report No. 2. 3. RecipientOs Accession No.
MN/RC - 1999-19
4. Title and Subtitle 5. Report Date
NEXT GENERATION R/WIS: CONCEPT AND PROTOTYPE March 1999IMPLEMENTATION
6.
7. Author(s) 8. Performing Organization Report No.
Taek Mu Kwon
9. Performing Organization Name and Address 10. Project/Task/Work Unit No.
University of Minnesota DuluthDepartment of Electrical and Computer Engineering271. Contract () or Grant (G) No.
10 University Drive (C) 74708 TOC #47Duluth, MN 55802
12. Sponsoring Organization Name and Address 13. Type of Report and Period Covered
Minnesota Department of Transportation Final Report 1997 - 1999395 John Ireland BoulevardSt. Paul Minnesota, 55155 14. Sponsoring Agency Code
15. Supplementary Notes
16. Abstract (Limit: 200 words)
The Minnesota Department of Transportation (Mn/DOT) conducted a two-year study on developing a concept of the NextGeneration Road/Weather Information System (NG-R/WIS). This report describes the concept and a prototype implementationof the NG-R/WIS in Minnesota District-1.
Traditional R/WISs offer limited scope of data types, limited communication methods, and proprietary incompatibilityproblems. The R/WIS in Minnesota District-1 experienced the typical problems of the traditional R/WIS. This project looked asolution to those problems-developing a new layered hierarchical architecture referred to as NG-R/WI.
Four layers--a sensor layer, a data integration, a database layer, and an application layer--form the basis of the NG-R/WIS formthe basis of the NG/RWIS. This architecture allowed integration of heterogeneous systems through the data integration layerand provided structured data to applications through a standard relational database and computer networks.
This project developed three applications: web page service, automated voice service, and live stream-video service. The webpages and automated voice services provided solutions for unlimited access from anywhere, unified data format, ease of use,and no requirements of special terminals or software. The live video stream demonstrated integration capability of the systemand provided a new class of information. The report concludes with the recommendations and future directions of the proposedNG-RWIS.
17. Document Analysis/Descriptors 18. Availability Statement
R/WIS No restrictions. Document available from:
Web pages Automated voice server National Technical Information Services,Data dissemination Springfield, Virginia 22161
Database server
19. Security Class (this report) 20. Security Class (this page) 21. No. of Pages 22. Price
Unclassified Unclassified 126


Next Generation R/WIS: Conceptand Prototype Implementation
Final Report
Prepared by:
Taek Mu Kwon, Ph.D
Department of Electrical and Computer EngineeringUniversity of Minnesota, Duluth
Duluth, MN 55812
March 1999
Prepared for the
Minnesota Department of TransportationOffice of Research Administration
First Floor395 John Ireland Boulevard, MS 330
St. Paul, Minnesota 55155
This report represents the results of research conducted by the author and does not necessarilyrepresent the views or policy of the Minnesota Department of Transportation. This report doesnot constitute a standard, specification, or regulation.


ACKNOWLEDGEMENTS
The author would like to express appreciation to the Mn/DOT Office of Research of
Administration and the many people involved in this project. Special thanks to Mr. Edward
Fleege for his tireless help and leadership in all phases of the project. Thanks to Don Jacobson,
Brad Bohlman, and Nick Bacigalupo of the Mn/DOT Duluth office who provided valuable
assistance in computer networks. Thanks also to Jay Koski of the Mn/DOT St. Paul office who
arranged all the technical advisory meetings and didn't mind two and half hours of driving up to
Duluth for meetings. Thanks to John Moreland in the Mn/DOT St. Paul office for making the
R/WIS web page available to outside the Mn/DOT network using a cache server. Several
students at the University of Minnesota Duluth participated in this research and provided
programming and web design assistance; they are Scott Findley, Mark Sholund, Eric VanGuilder,
and Andy Olson. The author thanks to all of them.

ii

CONTENTS
ACKNOWLEDGEMENTS i
LIST OF TABLES v
LIST OF FIGURES v
EXECUTIVE SUMMARY vii
1 INTRODUCTION 1
1.1 Background 1
1.2 Existing Problems 2
1.3 Solutions and Project Goals 5
2 NEXT-GENERATION R/WIS: CONCEPT 7
2.1 System Design Goal 7
2.2 Architecture 7
2.2.1 Layer 1: Sensor Layer 8
2.2.2 Layer 2: Data Integration Layer 10
2.2.3 Layer 3: Database Layer 11
2.3.4 Layer 4: Application Layer 12
3 EXISTING R/WIS AT MN/DOT DISTRICT-1 15
3.1 Vaisala System 15
3.2 SSI System 19
4 IMPLEMENTATION OF THE NEXT-GENERATION R/WIS AT
MN/DOT DISTRICT-1 23
4.1 Sensor Layer 24
4.2 Data Integration Layer 25
4.3 Database Layer 28
4.4 Application Layer 33
iii
5 APPLICATIONS DEVELOPED IN THE APPLICATION LAYER 35
5.1 Web Service 35
5.2 Live Video Stream Service 41
5.3 Automated Voice-Answering Service 45
6 PROJECT EVALUATION 51
7 CONCLUSION 55
7.1 Future Work and Recommendation 55
7.2 Conclusion 58
REFERENCES 61
APPENDIX
A Sensor Data Available from District-1 RPU Sites
B Extraction of Data from Vaisala and SSI Servers
C SQL Scripts for Table Creation
D SQL Server Maintenance
E Voice Server Programming
F Next-Generation R/WIS Questionnaire
iv

LIST OF TABLES
Table 1: Unified format of RPU data 27
Table 2: Unified format of pavement conditions 28
LIST OF FIGURES
Figure 1: Layered architecture 8
Figure 2: Picture of Silver Cliff RPU 16
Figure 3: Picture of Pier 20 RPU 16
Figure 4: Picture of South Abutment RPU 17
Figure 5: System status page for Vaisala sites 17
Figure 6: Terminal screen interface for Vaisala sites 18
Figure 7: Garfield Avenue RPU 20
Figure 8: Lafayette RPU 20
Figure 9: Thompson Hill RPU 20
Figure 10: Terminal screen interface for SSI sites 21
Figure 11: Block diagram of NG-R/WIS implementation at Mn/DOT District-1 23
Figure 12: Front page of NG-R/WIS web site 36
Figure 13: District-1 RPU map 36
Figure 14: Aerial image of Silver Cliff RPU site 37
Figure 15: Site menu for Garfield Ave. RPU 37

Figure 16: Realtime table from Garfield Ave. site 38
Figure 17: Site map from Garfield Ave. site 39
Figure 18: Sample 24-hour graph from Silver Cliff site 40
Figure 19: Sample 12-hour historic data 40
Figure 20: Video image taken from the intersection of Central Entrance and
Garfield Avenue, Duluth, Minnesota 44
Figure 21: Flow graph of voice server program 49
vi

EXECUTIVE SUMMARY
The present Road/Weather Information System (R/WIS) in the Minnesota Department of
Transportation (Mn/DOT) District-1 consists of equipment from three different vendors: Surface
Systems Incorporated (SSI), Vaisala LTD, and Climatronics. Each company provided hardware
interfaces and data collection methods designed specifically for their own sensor packages and
servers. Thus, the systems are incompatible and made it laborious to use and maintain them. For
example: 1) the user must learn three different operating systems; 2) the user must understand
three different data formats and presentation methods; 3) the user must remember three different
user names, passwords, and access phone numbers; and 4) the system administrators must learn
and maintain three different types of hardware interfaces and operating environments. As a result,
the R/WIS data was difficult to access, understand, analyze, or utilize. In addition, the data
dissemination methods were poorly designed. The users have been accessing the data through
serial ports of the servers or modems attached to them. Since the servers cannot communicate
with each other, three terminals must be connected or three modem connections must be made to
each server in order to access all of the R/WIS data. Due to these limitations and the
inconvenience of the systems, the maintenance engineers rarely used the data. Some useful
features, such as graphics, were available but only to a few special terminals which were loaded
with special software. This requirement further limited the availability of useful data to the
maintenance engineers.
The goal of this project was to provide solutions to the above problems as well as to introduce
new concepts and technologies to improve the quality of information and the methods of data
warehousing and dissemination. The new system, referred to as the Next Generation R/WIS
(NG-R/WIS), was designed based on a long term view of the overall system, technological and
managerial growth, adaptation to different needs and environment, interaction with other
information systems, and the flexibility to integrate new technologies or information. The
resulting NG-R/WIS consisted of four interacting hierarchical layers: 1) Sensor Layer, 2) Data
Integration Layer, 3) Database Layer, and 4) Application Layer. The two lower layers gather all
vii

of the sensor data from the existing R/WIS systems and store them in the database layer, from
which various applications are deployed. The key to this architecture is in the data integration
and database layers where different data formats from heterogeneous systems are unified and the
servers in the layers are networked together through the Mn/DOT Intranet to allow modem
computer communication between the layers and users. As a result, users and applications can
access the R/WIS data from anywhere within the Mn/DOT network. This integrated layered
architecture solved the non-uniform data format and the limited access problem of the original
system.
The user interface occurs in the application layer. Three applications were developed in this
project: 1) web service, 2) automated voice-answering service, and 3) live video-stream service.
The web service includes: 1) a realtime data table and a graphical display, both of which present
information on what is occurring at the present time; 2) a 24-hour graph which gives information
on the trend of the pavement, air, and dew point temperatures; and 3) a 12-hour table which
includes the types of data that cannot be expressed in the 24-hour graph. These web pages are
tightly integrated, easy to use, and can be simultaneously accessed from anywhere within the
Mn/DOT network by many users. An automated voice-answering service was developed for
users who do not have direct access to the Mn/DOT network. For this service, the users need
only make a simple phone call to a preassigned phone number to get pavement and weather
information. This service is particularly useful for the maintenance engineers who are working
outside their Mn/DOT offices and also for travelers who do not have access to the Mn/DOT
network. In addition, a live video-stream was broadcasted through the web pages to integrate
visual information of road conditions to the traditional pavement and weather information. This
visual information provides additional data that cannot be obtained from traditional R/WIS
information, such as traffic conditions, and helps the assessment accuracy of road conditions.
Since the video stream is broadcasted through the Mn/DOT Intranet, it can be also viewed from
anywhere within the Mn/DOT network.
In conclusion, the goal of developing a next-generation R/WIS that can seemingly integrate
viii

heterogeneous systems and can grow with new technologies while improving the old systems,
was achieved through the introduction of a layered hierarchical architecture. The web integrated
data dissemination methods, along with the automated voice answering service and live video
streams, not only achieve the goal of designing an easy-to-use system, but also provide much
higher quality information than the original system. However, there is still much work to be done
to further improve the NG-R/WIS. Examples include integration of traffic information,
snowplow information, pavement condition forecasts, new sensors such as slipperiness sensors,
customized data delivery to specific groups or individuals, etc.
ix


1 INTRODUCTION
1.1 Background
Road/Weather Information Systems (R/WIS) are specialized computer networks that collect,
process, and disseminate information related to current and forecasted road/weather conditions to
the end users. The R/WIS information is typically used by maintenance engineers and decision
makers to help ensure that snow plowing and deicing operations are timely and effective. Other
usages include decision support for transportation planning and travelers' information service.
In October 1992, the New Technology Research Committee (NTREC) of Minnesota Department
of Transportation (Mn/DOT) established an R/WIS Task Force and charged it to study feasibility
of implementing a statewide R/WIS in Minnesota. From this charge, the R/WIS Task Force
performed a feasibility study and recommended a plan for implementing 276 sites statewide [1].
Since then Mn/DOT has committed to establish a statewide system and has been developing new
R/WIS concepts and detailed implementation plans. In 1994, a mobile sensor vehicle was
developed by Dr. Taek Mu Kwon at the University of Minnesota for thermal mapping purposes.
Thermal mapping is a technique that has been used to find reasonably good locations of
environmental sensor sites such that data interpolation between sites would be achievable [2]. In
the following year, Mn/DOT conducted data collection from the state major highways for the
purpose of thermal mapping using the developed vehicle. In 1996, Mn/DOT sponsored a
workshop to promote implementation of a statewide R/WIS. In 1997, Dr. Taek Kwon proposed
development of a next generation R/WIS (NG-R/WIS) as a demonstration project which includes
development of a working prototype for the statewide model. The prototype introduces a new
standardized open-architecture along with the new R/WIS concepts. These and many other
efforts (not mentioned here) finally led to the development of a request for proposal (RFP) for
1998 R/WIS which calls for implementation of 75 new R/WIS sensor sites (hereafter it is called
Remote Processing Units (RPUs)) and integration of the existing 17 RPUs.
1.2 Existing Problems
This section mainly focuses on identifying the problems related to the existing R/WIS servers
and RPUs in District-1 (vicinity of Duluth, Minnesota). However, the similar problem
statements would be applicable to the R/WIS presently installed in other parts of the Minnesota
state.
Present R/WIS in District-1 consists of equipment from three different vendors, i.e., Surface
Systems Incorporated (SSI), Vaisala LTD, and Climatronics. Each company provides hardware
interface and data collection methods specific to their own sensor packages which can only work
with their own systems. Therefore, the sensors and interfacing mechanisms are not compatible
among different systems. In addition, three different proprietary servers from each manufacturer
control their own RPUs in order to provide data storage and terminal connections for viewing the
data. As a result, the terminal interface, data format, user interface, and the operating systems are
all incompatible with each other. This incompatible and non-standard operating environment
creates expensive inefficiencies in many areas of the system usage. For example, data collected
from the seven RPUs must be viewed using three different computers and visual interfaces.
These system differences make the data difficult to understand, share, compare, and analyze. The
users and system administrators of the District-1 R/WIS must learn and maintain three different
operating environments. Moreover, since the system components from the three companies are
all incompatible, it requires a high maintenance cost. For example, if each vendor introduces a
new version of server and terminal interface programs, three different copies must be purchased
and installed. Also, the proprietary operating environment of these systems demands high
development cost for new applications, thereby discouraging innovation by third party
developers.
A second problem with the existing system is that the data accessibility is very limited. The
basic method of data communication in all of the three systems is through serial ports of the
server or modems attached to it. Since the servers cannot communicate each other, at a minimum
2

three phone lines and modems are required just to have one connection per server. Indeed, each
server presently has only a single modem attached to it and has been used for both users and
service access. With the present structure, if two operators want information on SSI sites
simultaneously, only one of those operators will have access to the information even though three
phone lines are available. Moreover, each user must obtain login names and passwords from each
system. This means that the user must remember three phone numbers, login names, and
passwords, along with three different command sets. It is truly too much to ask of maintenance
engineers. Adding to these, the time it takes to make three seperate modem connections, typing in
the user name and password, and getting the data from the server consume extraordinary work
for such a limited amount of data. Due to these limitations and inconvenience, snowplow
operators rarely use the system. The system should have been designed to be accessible from
anywhere, simultaneously by hundreds of people with ease-of-use such that absolutely no
learning is required. This project solves this problem by disseminating the information through
World-Wide-Web (WWW) and by developing intuitive and easy-to-use web page designs.
A third problem with the present system is that even a small change requires modification of
three systems. For example, when daylight-saving time starts and ends, it is not a matter of a
Mn/DOT technician resetting the clocks. The proprietary nature requires that each company
must be contacted so that a representative can dial-in to their servers and set the clock for
Mn/DOT.
A forth problem is that there is no easy way of adding new sensors to the existing R/WIS. For
example, the amount of sun radiation, visibility, and video data are extremely useful information
for the District-1 R/WIS, and yet there is no easy way to add these into the existing system. It
requires redesign of the RPUs and sever programs, which would be an enormous task. Even
worse, no documentation is available for the design of internal interfacing mechanisms and the
server programs. As of today, each manufacturer still does not follow any standards and builds
proprietary closed systems which are incompatible with each other. This practice will
continuously makes future expansion and innovation, such as integration of newly developed

sensors or improved technologies, extremely difficult.
A fifth problem is that developing a new application using the databases of the existing R/WIS is
extremely difficult. First, there is no documentation available to users for accessing the database
of each system, such that guess work and reverse engineering are required. Some systems do not
even have any long-term databases. Second, the present system uses neither standard relational
databases nor standard network communication protocols, such that the data cannot be accessed
through the networked Mn/DOT computers. Third, the databases do not provide multiuser and
multiprocessing capabilities, this makes it difficult to develop services which allow access from
many users. Forth, databases are not compatible each other, thus it is difficult to develop an
integrated application that works with all of the three existing systems. Consequently, a lack of
standard database mechanisms makes future improvements of the system extremely difficult.
A sixth problem is that there is no easy way of verifying the accuracy of the data gathered by the
RPU. A malfunction or miscalibration in a sensor continues to provide data (false data) instead
of sending no data or an error message. There is a need for checking or validating the correctness
of the data from the server side. Presently, no mechanism exists for such purposes.
Some useful graphics exist that are only available on the main computer at the DOT
headquarters. These graphics can be useful for spotting and predicting potentially dangerous
trends. For example, a graph can be used to compare air, freezing point, dew point, and
pavement temperatures. If the graph shows that the air and dew point temperatures are
approaching each other, then precipitation is likely to occur. If the air temperature is above the
freezing point and the pavement temperature is below the freezing point, the pavement is likely
to be covered with ice. Therefore, such information is very useful to the maintenance engineers
and public, but it can be viewed only at the designated terminal in the DOT headquarters. The
Next-Generation R/WIS provides the same information through a web page to everybody as long
as they are connected to the Internet and have a common web browser.

1.3 Solutions and Project Goals
The goal of this project is to provide solutions to those problems described in Section 1.2 as well
as introducing new applications and infrastructure. The new system should be designed such that
it would integrate the pre-existing software and hardware with newly introduced technologies. It
should not only improve the present information infrastructure, but also provide higher quality of
information while solving the present problems. It should allow easy integration of new
technologies and applications as well as easy modification of the existing technologies. The
system should include standard relational databases and WWW technologies as its infrastructure.
To distinguish this new system from the existing one, the new system will be referred to as the
Next Generation R/WIS (NG-R/WIS). This system is proposed to have the following
characteristics:
1. Employment of a centralized data center which houses standard relational
databases. This centralized database concept will promote data collected or
presented in different formats to be stored or retrieved in a uniform format. It
provides standard open methods for database-access and can be evolved along
with new data warehousing technologies. It provides a well developed set of
standard management tools for the data.
2. Employment of one uniform user interface. The users are only responsible for
learning one system as opposed to many different systems in the original system.
Moreover, the system should be designed to be easy enough that users do not
require any training.
3. Dissemination of information through Internet. Choosing this presentation
method solves the limited access problem of the original system. In the new
system, the only requirement for a user access is a web browser and an Internet
connection. With this approach, many users (hundreds) can simultaneously access
the information from anywhere in the world at anytime.
4. Integration of video stream. Video cameras can be installed at each site to provide

remote verification of sensor data. Also, visual information provides assessment
of road conditions that was not possible with the traditional weather related data
(see Section 5.2 for details). Video feeds should be accessible through the same
web browser used to view the data.
5. Easy to use graphical user interface. Data itself may have very little value if it is
not transformed into information that is useful and easy to understand. One of the
primary goals of the new system is providing an intuitive graphical user interface
that is simple and easy to understand. With a proper design, no learning should be
required to use the system.
6. Automated voice service through phone line. This service is provided for the
circumstance where the user does have direct access to the Mn/DOT Intranet or
Internet. In such a case, the user can still call the automated phone service to get
the R/WIS information. This approach provides a greater accessibility to the user
by complementing the web service.

2 NEXT-GENERATION R/WIS: CONCEPT
2.1 System Design Goal
The Next-Generation R/WIS (NG-R/WIS) should be established on the basis of a long term
view of the overall system, technological and managerial growth, adaptation to different needs
and environments, interaction with other information systems, and flexibility to integrate new
technology or information. The information gathered by the R/WIS should be standardized and
widely accessible through Local Area Networks (LANs), Wide Area Networks (WANs) and
Internet. The system should store data in standard relational database servers to allow efficient
access to or from other systems or applications. The type of data collected should not be limited
to only road/ weather related information. The system should be open to adopt any type of data as
long as it helps the Mn/DOT needs and goals. The system should be designed as an open
architecture; its architecture should be disclosed to the public for free competition of applications
and system developments.
2.2 Architecture
The architecture chosen for the NG-R/WIS is a layered hierarchical system. The system consists
of four hierarchical layers as shown in Figure 1: 1) Sensor Layer, 2) Data Integration Layer, 3)
Database Layer, and 4) Application Layer. Each layer should be independent enough that
technological advances in one layer should not lead to modification in the other layers. Each
layer only represents a logical division but not the physical division, such that the architecture
does not prevent a system from implementing more than one layer in one physical device. Each
layer may have sublayers, but the architecture does not define the detailed division of sublayers.
It is left to each individual implementation. Each layer is further described below.

Layer 4: Application Layer
Layer 3: Database Layer
Layer 2: Data Integration Layer
Layer 1: Sensor Layer
Figure 1: Layered Architecture
2.2.1 Layer 1: Sensor Layer
The sensor layer represents a collection of various devices that detect physical and logical
occurrences of events. For quantization or representation of sensor values, Mn/DOT
recommends the sensor data to conform the standard specified by the National Transportation
Communications for ITS Protocol (NTCIP) [3]. The NG-R/WIS also conforms to the NTCIP
standard. However, it should be noted that the NTCIP standard only specifies well defined
environment sensor values, and some of newly developed sensor information is not defined yet.
For example, the density and height of blowing snow is very critical information for road
maintenance and travel, but is not specified in NTCIP. Therefore, NG-R/WIS simply
recommends that any sensor that could help Mn/DOT goals can be added in addition to those
defined in the NTCIP. This category includes new sensors in research and development stages.
We identify the following components as the important devices and parameters for the sensor
layer.
8

I Atmospheric Sensors. This includes sensors that measure air temperature,
humidity, dew point, precipitation type, precipitation rate, wind speed, wind
direction and pressure. All of these are commonly available from RPUs and
specified in the NTCIP.
U Pavement sensors. The information measured by pavement sensors includes
surface/subsurface temperatures, chemical factors, pavement freezing point and
water/snow/frost/ice detection. Representations and quantization of all of these
parameters are specified in the NTCIP and should be conformed.
U Visibility. It is defined as the greatest distance at which an object of specified
characteristics can be seen and detected with the naked eye [4]. Reduced visibility
is directly related to atmospheric conditions such as fog, smog, rain, snow, etc.
Therefore, it is also desirable to combine the cause of reduced visibility along
with the metric of visibility value. Since visibility is a critical information for
drivers, it is recommended for inclusion in the sensor layer. The data format of
visibility is specified in the NTCIP.
I Snow depth. This represents current depth of packed or unpacked snow on the
road surface or adjacent area. The data format is specified in the NTCIP.
Q Slipperiness. This value indicates measured coefficient of friction. Since friction
of the road surface directly influences the braking distances of a vehicle, it is a
critical piece of information for drivers. Maintenance engineers can utilize this
parameter to maintain the road-surface friction to an appropriate level.
Q Blowing snow. Blowing snow (includes drifting snow) can cause reduced
visibility and slipperiness. This parameter may be expressed using a combination
of several parameters: frequency, width, height, speed of movement, density and
visibility.
O Video stream. Live video stream can be used to verify the parameters provided
by the other sensors in a certain degree without sending a maintenance person to
the site. Viewing the live video also greatly helps maintenance workers to assess
the actual work conditions before going out to the site and allows them to be
9

mentally prepared. Moreover, it provides general visual information of the road
such as shape, color and traffic. Also, reduced visibility, fire, or other severe
problems can be easily observed through the live video stream. Therefore, video
cameras are recommended for inclusion in the sensor layer.
Q Traffic sensor. The parameters in this category includes average traffic speed,
occupancy and vehicle counts. These values can be utilized in transportation
planning and maintenance operations. The correlation between weather and traffic
patterns could provide data for advance traffic management.
U Solar radiation. The amount of sunshine exposed to pavement is the most
dominant factor that influences the temperature variation on the road surface.
Therefore, it is an essential parameter for forecasting the road surface conditions
and temperature. It is expressed in Jules per square meter and specified in the
NTCIP. This sensor value is recommended for inclusion.
Some of the sensors listed above may not be available at the present time, but recommended for
future inclusion in the sensor layer as they are available. The above listing does not include the
status of road treatment such as when the road was plowed and salted, but such information can
be also included as it is available in the future. The basic concept of the NG-R/WIS supports
inclusion and integration rather than rigid definition and exclusion. Therefore, the above list only
serves as an example of the present needs which may change over time.
2.2.2 Layer 2: Data Integration Layer
The data integration layer takes the role of a mediation layer between the sensor layer and the
database layer. Its role is to collect data from the sensor layer, transform them into a uniform
format acceptable to the database and transfer them to the database layer. In general, this layer
will consist of two types of subsystems: Remote Processing Units (RPUs) and RPU Integration
Servers (RISs). RPUs are the first data collection point in a remote site where several sensors are
10

installed and serve as a remote data unit. It should include the readings of all sensors in the site as
well as the operating status of the sensors. Since RPUs also provide the first integration point of
the sensor data, they should be designed to be expandable to add new sensors. RISs are typically
located in the regional Mn/DOT headquarters and poll RPUs to receive the latest sensor data.
RISs process data to a format appropriate to the central database, make connections to the central
database servers and store the formatted data into an appropriate table. It should be noted that
the final unification of the data format is done at the database layer. Therefore, if different data
formats exist in the RPUs due to heterogeneous equipment from multiple vendors, RIS will be
responsible for transforming them to a uniform format that is acceptable to the central database.
For the communication between the database layer and the data integration layer, the standard
TCP/IP protocol is recommended, since it provides the most widely accepted communication
means to intranet and Internet infrastructure.
2.2.3 Layer 3: Database Layer
This layer combines all heterogeneous information collected from the data integration layer to a
single unified resource through database tables. In order to maintain a strong standard
conformation, the NG-R/WIS recommends the Structured Query Language (SQL) based
databases in this layer. The databases in this category are also called a relational database. The
most recent standard of SQL is specified in ANSI SQL-92. The databases used in this layer must
conform to this standard. Open Database Connectivity (ODBC) is a standard application program
interface (API) for database access that is supported by nearly all database vendors and
independent software developers. All database servers used in this layer should conform to the
most recent ODBC. Presently, ODBC is an ANSI and International Standard Organization (ISO)
standard.
In the actual implementation, the database layer should consist of multiple database servers that
are connected through a computer network. In order to avoid loss of a large data table by a server
failure, it is recommended that the database size of each server be limited to a certain size. A
11

single large table usually requires longer search and query time and is prone to a single point
failure. On the other hand, creating many small tables can increase the complexity of query and
maintenance. Therefore, the size of the tables in the database should be determined to reflect the
optimal performance in both search time and maintenance.
2.3.4 Layer 4: Application Layer
This layer includes various applications that utilize the data available from the database layer. In
general, the application layer does not impose any restrictions on its data format or in the
presentation methods. Applications should have full freedom in their presentation methods.
However, their access frequency and methods to the databases must be efficient, such that they
do not waste the database server time.
It is possible that some applications may directly obtain data from the data integration layer, but
its status should be still tied to the database layer. For example, suppose that we want to create an
application that sends live video-streams of RPU sites to the users through web pages. Since
video streams consist of enormous amounts of data, it is clearly not suitable to store them into a
database table. In this case, the database should only store the status and statistic information
about the video streams such as where the camera is located, what is the resolution, how many
users are allowed and what is the IP address. The video stream is then directly transmitted
through web pages.
Several applications are identified in the NG-R/WIS project and listed below. As new
technologies are available in the future, some of the listed applications could be obsolete and
replaced with new applications.
Data dissemination methods
Q World Wide Web
D File Transfer Protocol (FTP)
12

Q Automated or on-demand email warning system
O Automated or on-demand FAX delivery
U AM and FM radio broadcasting system
Q Automated pager system
O Automated voice answering system
O Wireless cell phone delivery system
Forecasts
D Pavement temperature
0 Pavement condition
El Blowing or drift snow
1 Amount of snowfall
U Traffic
Service
O Travel advising system
U Crew scheduling for maintenance
U Incident detection and monitoring system
L Decision support system
U Traffic control support system
O Snowplow information network
li Route optimization system for snowplow trucks
D Input to variable message signs
13

14
3 EXISTING R/WIS AT MN/DOT DISTRICT-1
Presently, Mn/DOT District-1 has three R/WIS units made by three different companies. These
systems include three RPUs and one server from Vaisala, three RPUs and one server from SSI,
and one RPU and one server from Climatronics. For the NG-R/WIS project, only two systems,
one from Vaisala and one from SSI, were considered. The system from Climatronics was not
included in the project due to its extremely slow communication speed (300 baud rate) and lack
of technical supports. This section briefly describes the existing system along with the available
environmental sensor information.
3.1 Vaisala System
The Vaisala system consists of three RPUs in the field which are linked by a Unix based server
located at the District-1 Mn/DOT headquarters. The three RPUs are installed at the following
locations:
* TH61 at mile point 30.49, Silver Cliff Tunnel, approximately 4 miles
north of Two Harbors. This RPU is called Silver Cliff station.
* 1-535 on the Blatnik Bridge over St. Louis Bay at Pier 20 on the Wisconsin
side. This RPU is called Pier 20 station.
* 1-535 at the south abutment on the Wisconsin side of the Blatnik Bridge
over St. Louis Bay. This RPU is called South Abutment station.
The pictures of three sites are shown in Figures 2, 3, and 4. The communication method used to
poll the Silver Cliff station is a microwave link. The Pier 20 and South Abutment stations are
polled through a combination of UHF-radio and microwave links. The server at the District-1
headquarters polls these three field stations every 10 minutes and maintains a small database.
The user interfaces are done through a special graphic terminal which is provided by the vendor.
The useful information is provided by the two terminal screens as shown in Figures 5 and 6,
which we later convert to a data entry form of the SQL database in NG-R/WIS.
15

Figure 2: Picture of Silver Cliff RPU
Figure 3: Picture of Pier 20 RPU
16

Figure 4: Picture of South AbutmentRPU
................. ... .. ...... .....
....... ... .£. .. ... .... ... .. .. ... ...w. q..::: , .... .. ... ......
ACcnreted0.0h3 VTTQQ .................,.'::!•:, i!;~~!!i!!i!.! i ii!i!•!~ i•!i; • i•.!!•!:}i!• •!..h !:!•:?:,•! :}!•!.} i !.: .!!•:! .::
Figure 5 System status page for Vaisala sites
17
SYSTEM STATUS DATA TIME: 17:55 12-Apr-98 CDT
Site Name Time Air T R.H DewPt P PRate Wind Dir PaveT FrzPt SS AlF % F in/h mph F F
TH61 Silver Clif 17:50 52.2 62 39.4 0.00 3 23 59.7 32.0 DRPier 20, Blatnik 17:50 73.5 31 41.3 0.00 29 206 65.2 32.1 DRBlatnik S.Abut 17:50 74.0 30 40.9 L 0.00 19 192 68.6 32.1 DR
SYSTEM STATUS PAGE UP/DOWN OR <RETURN> FOR MAIN MENU
.. .. .... .. ... .. ... ... ... ... .. .... ...... ... ... ... ... .. ... ... ... .... ... ... ... .... .... .... .. ... ..... .. ..... .. .... .. ... .... ... ... ... .. ... ... ... .;'K~~;:~l:~,~;;;;~ ·~;-:·:·- :-:~~~s~: :··::::~ ~ irii~ill:~:::2~i;~:': ~ ;;'i·:::n;~:.~: ··:::; ·~i;·;·;: ~ --: ~·::';:...... ... .. i~ ~i :
S..... .... ...... .......... .... ... .. .......... ..... .... ..... ..... ...................;; ~ ···-·- ·······~~: ··· ···~~'~--~;~'~;`'·;·-·:::~''''· ::::'· ~ i:::~::'~:'':l~i:~~:i :I:·;: ±
:.:-c::
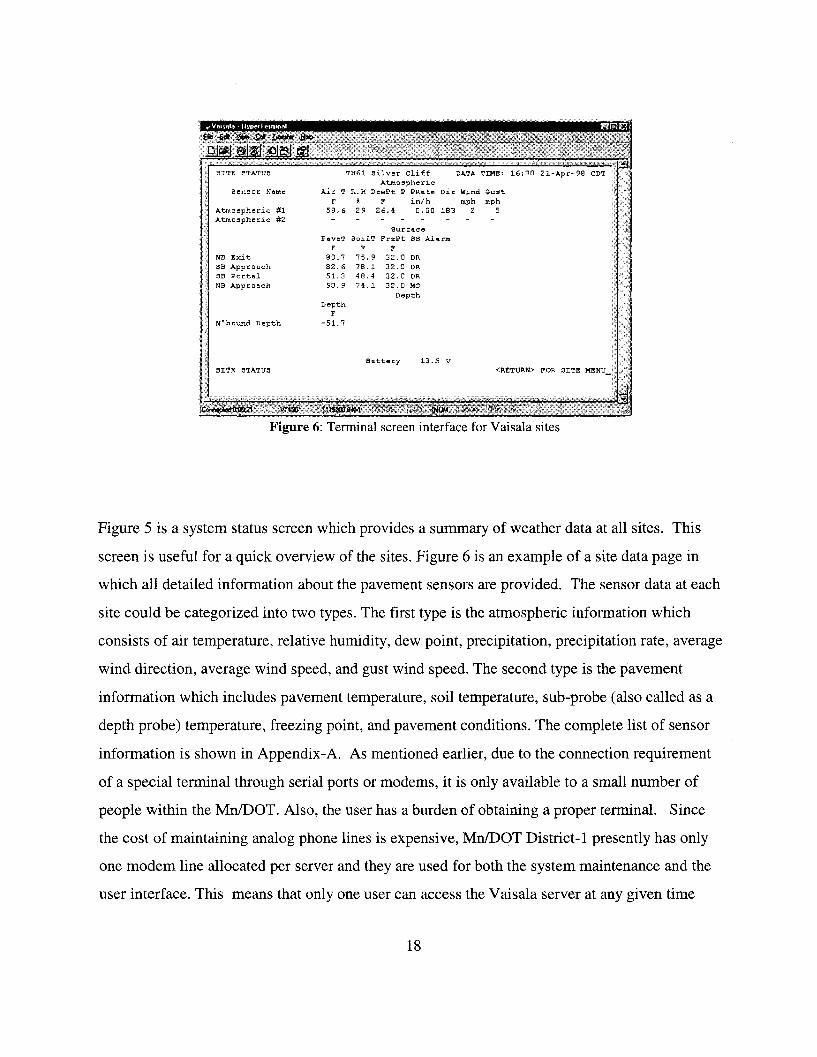
Figure 6: Terminal screen interface for Vaisala sites
Figure 5 is a system status screen which provides a summary of weather data at all sites. This
screen is useful for a quick overview of the sites. Figure 6 is an example of a site data page in
which all detailed information about the pavement sensors are provided. The sensor data at each
site could be categorized into two types. The first type is the atmospheric information which
consists of air temperature, relative humidity, dew point, precipitation, precipitation rate, average
wind direction, average wind speed, and gust wind speed. The second type is the pavement
information which includes pavement temperature, soil temperature, sub-probe (also called as a
depth probe) temperature, freezing point, and pavement conditions. The complete list of sensor
information is shown in Appendix-A. As mentioned earlier, due to the connection requirement
of a special terminal through serial ports or modems, it is only available to a small number of
people within the Mn/DOT. Also, the user has a burden of obtaining a proper terminal. Since
the cost of maintaining analog phone lines is expensive, Mn/DOT District-1 presently has only
one modem line allocated per server and they are used for both the system maintenance and the
user interface. This means that only one user can access the Vaisala server at any given time
18
.. .. ... .

through a modem. Another critical limitation of this system comes from the proprietary nature of
the sequential database used in the server. This database is primitive and cannot communicate
with other databases. Presently no application is running using this database. Due to these
limitations and the problems discussed in Section 1.2, the data collected using the Vaisala system
has been underutilized.
3.2 SSI System
The SSI system consists of three RPUs located in the field and a server located in the District-1
headquarters. The server polls the three RPUs every five minutes. The three RPUs are located at
the following sites:
* 1-35 at mile point 255.91 located approximately 700 feet northeast of Garfield
Avenue in downtown Duluth. This RPU is called Garfield Avenue station.
* TH 61 at Lafayette Tunnel approximately 8 miles north of Two Harbors. This
RPU is called Lafayette station.
* 1-35 at mile point 247.9 located between Thompson Hill and Nopeming just south
of Duluth. This RPU is called Thompson Hill station.
The pictures of these sites are shown in Figures 7, 8, and 9. The communication means used in
polling the Garfield Avenue and Thompson Hill stations are the plain analog voice-graded phone
services. The Lafayette station is polled through a microwave link. The SSI server is also based
on a Unix operating system and can be accessed through a terminal interface. A sample terminal
screen is shown in Figure 10. The screen printing method in SSI is different from that of
Vaisala. The SSI interface does not use any escape sequences of terminal characters while the
Vaisala system does. This makes access easier to the SSI server than to the Vaisala server from
the programmer's point of view.
19

r igure /: uarlleiu venue ts u
r gure o: Larayete K u
Figure 9: Thompson Hill RPU
20
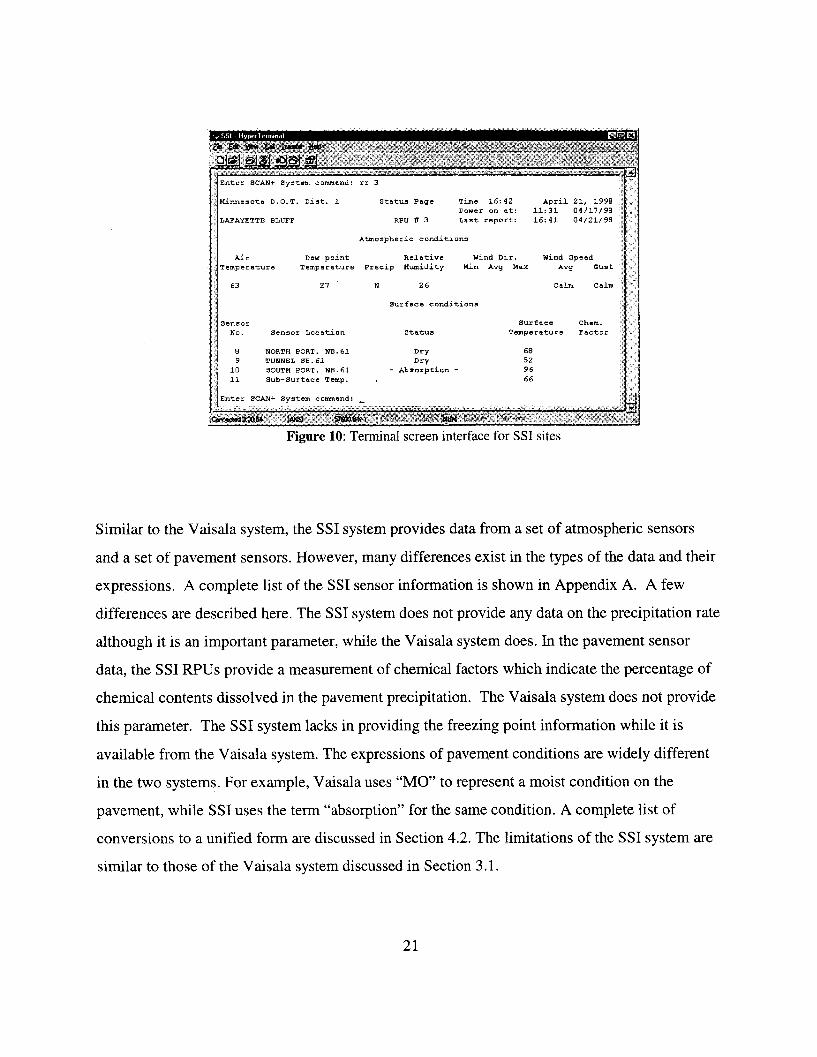
Figure 1u: lernunal screen interlace ror SM1 sites
Similar to the Vaisala system, the SSI system provides data from a set of atmospheric sensors
and a set of pavement sensors. However, many differences exist in the types of the data and their
expressions. A complete list of the SSI sensor information is shown in Appendix A. A few
differences are described here. The SSI system does not provide any data on the precipitation rate
although it is an important parameter, while the Vaisala system does. In the pavement sensor
data, the SSI RPUs provide a measurement of chemical factors which indicate the percentage of
chemical contents dissolved in the pavement precipitation. The Vaisala system does not provide
this parameter. The SSI system lacks in providing the freezing point information while it is
available from the Vaisala system. The expressions of pavement conditions are widely different
in the two systems. For example, Vaisala uses "MO" to represent a moist condition on the
pavement, while SSI uses the term "absorption" for the same condition. A complete list of
conversions to a unified form are discussed in Section 4.2. The limitations of the SSI system are
similar to those of the Vaisala system discussed in Section 3.1.
21

22

4 IMPLEMENTATION OF THE NEXT-GENERATION
R/WIS AT MN/DOT DISTRICT-1
This chapter describes how the concept of the NG-R/WIS developed in Chapter 2 is actually
implemented in the R/WIS of Mn/DOT District-1. Figure 11 shows a block diagram of the four-
layer architecture which was actually implemented. The sensor layer which is shown at the
bottom of the figure is composed of the existing atmospheric and pavement sensors of the
Vaisala and SSI sites. The integration layer consists of three sub-layers, i.e., an RPU sub-layer,
an RPU server sub-layer, and an integration server sub-layer. The RPU servers collect data from
their RPUs, while the integration server collects data from the two RPU servers and then passes
the data to the database layer through the Mn/DOT Intranet.
iIIIrrIIIIiIIiIrIIIiIIiIIII,r'If
((1
-----
utomaed Lrre Vbeo ApplicatonWeb-Page Voice Stream LayerService Answering 9ericeLIIII~---- ~ CI ----- ----------~-~·
Si Da1.baseM S SQL Databa se Server Layer- -. __
DataIntegratoinLayer
SensorlaI qp r
CanmeralEnviron mental Seon sors
Figure 11: Block diagram of NG-RWIS implementation at Mn/DOTDistrict-1.
23

A database server is located at the District-1 headquarters and connected to the Mn/DOT
network, through which it provides data access to the application layer as long as the application
is connected to the Mn/DOT network. In the application layer a web service is provided, from
which access to the R/WIS information is available to anyone who has an Internet connection. If
one does not have an Internet connection such as while on the road, she or he can call the
automated voice answering service where the desired information can be obtained through touch-
tone navigation. Each layer is further described in the following sections.
4.1 Sensor Layer
Since one of the characteristics of NG-R/WIS is the ability of integrating different types of
sensors from heterogeneous vendors into a unified form of data, the system adopts all of the
present environmental sensors from the District-1 Vaisala and SSI systems.
In addition to the SSI and Vaisala sensors, one sensor independent of the existing servers was
added. The added sensor was a video camera for broadcasting a live video stream of the road
conditions near the sites to the end users. With the advances in Internet technologies, sending
video signals through the Internet is inexpensive and efficient. Moreover, video images have
been proven to provide extremely important information in many transportation applications and
have been widely used. For example, video images can be used to detect reduced visibility [4],
blowing snow, traffic incidents, traffic flow, road maintenance, and other visible conditions.
Another important use of video information is in verification of the collected data from the
environmental sensors. With the present RPUs and server set up, there exists no easy way of
verifying whether the sensor data coming from the field is true or not. In fact, the accuracy of the
data is one of the biggest concerns that the maintenance engineers have been raising [5]. Video
information can be used to confirm some of the R/WIS sensor data. For example, if the
pavement sensor indicates detection of snow, the image seen from the video camera should show
the road color as white. Therefore, the sensor layer was implemented using the existing sensors
and a color video camera.
24

4.2 Data Integration Layer
The data integration layer consists of three levels of sub-layers as shown in Figure 11: an RPU
sub-layer, an RPU server sub-layer, a data integration server sub-layer. The RPUs, located in the
field and at the bottom of the data integration layer, collect data directly from the field sensors,
pack the data to an efficient form for transmission and wait until it is polled. There are six RPUs
installed in the field (see Chap 3 for more details), from which three of them are Vaisala units
and the other three are SSI units. Each RPU server polls their three RPUs through a phone line or
microwave links in a predetermined interval. The polled data are then stored in the local disk
storage of the server. In this project, no additional work was done to improve the RPU or its
server side codes. Both systems worked well in bringing the data to the central office, and there
was no need for modifying the working system. However, the RPU servers were not connected
to the Mn/DOT network, so there was no direct network path from the database server to the
RPU servers.
Since the only way that another computer could access the data at the RPU servers was through a
serial port with a modem, an intermediate unit that could communicate with the RPU servers and
reroute the data to the database server through the Mn/DOT network was needed. This
intermediate unit was referred to as an integration server. If the RPU servers were connected to
the Mn/DOT network, the data could have been directly passed to the database layer. However,
this approach had a problem, the research team was not allowed to modify the RPU server
hardware and programs. Therefore, introduction of an integration server was imperative. The
integration server was implemented as an NT standalone server (Version 4) with an Ethernet
connection to the Mn/DOT network. The role of the integration server is truly integrating the
data from different sources. It also serves as a video server from which video signals are rerouted
from the live encoder to the end users. Since it also serves as a video server and possibly for
other new sensor-data in the future, a large amount of memory was needed. For this reason, 128
Mega Bytes of random access memory (RAM) were installed in the integration server.
25

The integration server polls the RPU servers every three minutes through a dial-up phone line.
The three minute interval was chosen in order to capture the five minute and ten minute data-
refresh cycles of the SSI and Vaisala systems, respectively. Since the RPU servers only know
terminal interfaces, a program residing in the integration server must remove all unnecessary
control characters and extract the true information. This process is somewhat tedious and thus
described in Appendix B. Once all data items are collected, the integration server connects itself
to a database server through the Mn/DOT Intranet and sends an insert command to the database
to store the R/WIS data.
Since the types of data collected from the RPU servers are not homogeneous, the integration
server takes the role of unifying these data to a single form. Table 1 summarizes the unified
specification of atmospheric and pavement data developed in this project along with each
vendor's format. The basic philosophy used here was inclusion. This means, if the same type of
sensor data is not available from one vendor but available from the other vendor, the data type
was included in the unified form. For example, the parameter, freezing point, is only available
from the Vaisala unit as shown in the Table 1. In this case, the unified form includes the freezing
point.
Notice in Table 1 that the wind direction of the unified form is represented in a cardinal direction
(due to the Mn/DOT's request), but it was actually stored in the database as degrees following
the NTCIP recommendations. The conversion was done through mapping from (0°, 45°, 90,
1350, 1800, 2250, 2700, 315°) to (N, NE, E, SE, S, SW, W, NW), approximating any value
between them to the nearest. According to Mn/DOT users, a cardinal direction was much easier
to understand than the unit of degrees. Moreover, they expressed that accurate degree of wind
direction is not needed in their applications. Therefore, all of the user interfaces in the application
layer for the wind directions were expressed using the cardinal direction.
The representations of pavement conditions in both systems were quite different. Therefore, a
unified specification was also developed for the pavement conditions and summarized in Table 2.
26

This unified format of data is used in the web data dissemination and to store the data in the
database ( see the sample web page of the realtime data-table shown in Figure 16).
Table 1: Unified format of RPU data
Unified Vaisala SSI
SiteName Name Name
DateTime Data Time Time
AirTemp F Air F Air Temperature
R.H. % R.H. % Relative Humidity
DewPoint F DewPt F Dew Point Temperature
Precip [Y/N][Rate in/h] Prate in/h
P Precip
Windspeed mph Wind mph Wind Speed Avg[Avg][Gust]
WindDir [Avg][Max][Min] Dir Wind Dir Min
Wind Dir Avg
Wind Dir Max
FreezP F FrzPt
PaveTemp F PaveT Surface Temperature
PaveCond SS Status
SoilTemp F SoilT Sub-Surface Temp.
ChemFactor Chem. Factor
Alarm Alarm
27

Table 2: Unified format of pavement conditions
4.3 Database Layer
The database layer consists of one or more relational database servers and provides a structured
query and maintenance of data to the application layer. We chose an NT server 4.0 with a
Microsoft SQL (MS SQL) 6.5 for implementation of this layer. The NT operating system was
chosen due to its low cost and wide spread use of operating systems within Mn/DOT. The MS
SQL was chosen, since it conforms to the ANSI SQL standard and integrates very well with the
NT operating system.
A relational database is constructed based on one or more tables which hold the data. It is based
on a set rather than a list and provides efficient retrieval of data. It works with multi-users and
multi-processing allowing simultaneous access from many users. Many databases can exist
28
Unified Vaisala SSI
Dry DR DRY
Moist MO Absorption, Dew, orAbsorption @Dewpt
Wet WE WET
Wet & Treated WT Chemical Alert
Frost FR FROST
Snow/Ice SN or IC Snow/Ice Alert
Treated TC
Sensor Short SH
Unknown ? ?

within one database server, and retrieval of data can be accomplished in relation to other
databases. Moreover, many database servers can coexist in a network and share or distribute the
data. Often, mirroring of databases is implemented in two database servers to minimize the
possibility of losing all data. Database servers can generate automated emails and web pages if a
pre-specified condition occurs. Most database managerial functions are built in and can be
executed without stopping the regular activities of the database. These include back-up,
generation of a new database, mirroring, etc.
For implementation of the NG-R/WIS database layer, a database named "rwis" was created. In
order to control the growth of the database search time, the maximum size of the database was
set not to exceed 2 Gbytes. Since the NG-R/WIS project includes six sites, six table objects were
created. These database objects are:
dbo.garfield
dbo.lafayette
dbo.pier_20
dbo.s_abut
dbo.silver_cliff
dbo.thompson
If many sites are implemented in one database, it is recommended that a separate table be created
for maintaining site names, locations, maintenance information and other parameters that are not
frequently changed. The SQL script information for creating the above tables is shown in
Appendix C. For each table, a trigger was created to update the historic data-table in the web
page whenever new data is inserted in the corresponding table.
Microsoft Visual Basic Enterprise Edition provides tools for easy access to the MS SQL 6.5.
Therefore, all programs for adding new data to or retrieving data from the database were written
in Microsoft Visual Basic.
29

There are several issues that are very important in creating and maintaining the database. These
issues are briefly discussed here. The first issue is, how big the size of the database should be. In
MS SQL and in most relational databases, the size of databases can be expanded as much as the
hard disk space is allowed. However, it is important to plan ahead and decide how much you
would want to allow the database to grow, i.e., determine the maximum allowable size ahead of
time. It is very important to consider the reasons and factors for this decision, which are
discussed below:
Q As the size of database tables gets larger, the search, sort, insert and retrieval
operations will take longer since the relational database is based on a set concept.
For example, the insert command in SQL, which occurs frequently in the R/WIS
database, checks all entries of the table before executing the insert operation in
order to prevent any duplicated rows. Consequently, if the size of the table is very
large, it will take a significant amount of time in checking the duplicated data
before inserting the values. Similarly, such slow down could occur in query
operations. Therefore, creating a single large data table is not desirable for the
realtime requirement of R/WIS applications; the database designer should avoid
storing every data in a single large table.
Q Operating a single very-large database is prone to a single-point failure. For
example, suppose that one of the database operators mistakenly dropped the table,
then every data in the table will be lost unless it was backed up. Also, if the hard-
disk of the server crashes, no data would be available until the server is restored.
Therefore, smaller size databases distributed over multiple servers are preferred in
the NG-R/WIS database layer in order to increase the reliability of the data
warehousing operation. As another alternative to increase the reliability, database
mirroring could be applied. However, mirroring of a large database is again less
efficient than a smaller size.
O Small fragmented databases over many servers could drastically increase the
burden of management and complicate the development of applications, although
30

it may drastically reduce the risk of losing all data. In general, simple well planned
medium-sized databases are most likely desirable for the R/WIS databases.
O Database backup plans are very important to safeguard the database from server
failures. Since database engines heavily use hard-disk access for its operations,
the disk is almost always spinning during database operations. Therefore, it is
safe to assume that the hard-disk will eventually fail in the future, thus the
database should be backed up regularly. The question is how frequently should
the database be backed up at what level. The required backups include master db,
R/WIS db, and transaction logs. A proper plan should consider the size of the
databases, transactions, and priorities. In fact, the backup plan should be laid out
when the databases and tables are created.
In the District-1 NR-R/WIS design, since the complete implementation requires creation of tables
for six sites, only one database server was used. The maximum size of the database that houses
the six tables was limited to 2 G bytes by creating a separate partition for the R/WIS database
device. This partition holds the master db and all site tables as well as the transaction logs. The
next question is, how many rows should be allowed in each table. In one year, the maximum
number of rows in a table would be (12*24*365)=105,120 rows, since the shortest data refresh
interval is five minutes. The search time of this many entries took long enough to slow down the
response time of the application layer. For example, the automated voice service which will be
described in Chapter 5 queries the most recent data from the database whenever a call is
received. With the table size of one year of data, the retrieval time was so slow that the user had
to wait almost 30 seconds in the worst data traffic condition. One way of resolving this problem
was creating two databases: one short-term database and one long-term database. The concept
and operations of these databases are described in the following paragraphs.
(1) Short-term Realtime Database
This database holds data from 2 to 6 months old up to the present. At the end of every
month data is moved to a long-term standby database. The role of this database is to
31
provide short term storage for the realtime data. It provides services to those applications
that require frequent accesses of the most recent data. Example applications include the
real-time web data table and the realtime data voice service. As the data gets older than a
specified time span, it is moved to a long term standby database, from which long-term
historical data services are provided. In this way, a long-term database will be available
on line, while keeping the most frequently accessed database to a smaller efficient size.
(2) Long-term Standby Database
A long-term standby database is a database that is served for suppling data for
applications which require a large chunk of data, but do not have to query the database in
realtime. For example, monthly graphing is needed to be performed only once a month,
and it would not make much difference even if the query takes one or two minutes. This
database collects data from the realtime short-term database at the end of every month.
This database will hold data up to maximum of two years. Every year, one year of the
past data will be archived to a permanent storage using a permanent storage device like
CD-Rs (write once CD ROMs).
(3) Permanent Retired Database
A permanent retired database is an off-line database which is stored in CD-Rs. It serves
as an archive of R/WIS data history. Therefore, the data format should be universally
accessible ASCII format with the meaning of the data supplied right in the same disk.
Yearly data is saved from the long-term standby database.
By creating the three stages of databases as described above, one to two years of data could be
available on line, while keeping the most frequently accessed database to a smaller size. An
additional description on how to manage the database is described in Appendix D.
The NG-R/WIS implementation in District-1 includes a live video stream as a part of the system.
The question is how do we want to integrate the video stream to the NG-R/WIS architecture.
32

Since the amount of data produced by a video digitizer is enormously large and does not require
frequent retrieval, only the information about the video stream should be stored in the database.
Such information may include the location of camera, connection type, data encoder
characteristics, installation and maintenance data, etc. A similar approach could be made, if an
application requires a large size of text. In this case, the database may store the location, name,
size, last update time, etc. of the file.
4.4 Application Layer
For this NG-R/WIS project, three applications were developed and implemented. These are data
dissemination through web pages, a live video stream delivery, and automated voice answering
system. This section describes a brief summary of these applications. The details are described in
Chapter 5.
One of the goals set out for this NG-R/WIS project was to allow the users to have access to all of
the R/WIS data as easy as possible regardless of the incompatibility problems which may exist
among sensors, RPUs, and RPU servers which are provided by different vendors. Users should
not need any special tools or skills and should be able to access the data from any location. This
goal was achieved through two means. The first means was presenting the data through
Interet/Intranet web pages. Since almost all of the Mn/DOT computers are connected to
Internet, anyone having a standard web browser is now able to access the data. The web pages
were designed using hyper links of text and graphics, so it is extremely easy to navigate and get
the desired information. The web pages presently provide various tables and graphical designs
for user interfaces. The details of the main features are described in Chapter 5. It is expected that
the presentation by web pages will be continuously improved in the future to provide even more
intuitive and easy- to-use data presentations along with more content.
Sometimes, the users of the NG-R/WIS may not have an Internet connection. This happens,
33

when the maintenance engineers are working on outside the Mn/DOT headquarters for such as
snow removal operations, where real-time information on the pavement conditions and the
surface temperature is needed. In order to provide the R/WIS information where no
Internet/Intranet connections are available, this project included development of an automated
voice answering system. With this service, users can simply dial-in with a phone and can receive
the R/WIS information through voice recordings by navigating through the menu using the
touch-tone keys of the telephone set. The voice information is produced by a voice server which
retrieves the most recent data from the main database and converts them into a voice file.
Anybody who knows how to use a regular phone should be able to use this system. The details on
the design aspects of the voice service are discussed in Section 5.3.
Integration of real-time video is another enhancement of the information provided by the NG-
R/WIS, which is typically not available from the traditional R/WIS. It was found that visual
information of the road scene significantly improves the accuracy of the road condition
assessment when it is incorporated with the numerical and graphical R/WIS data. Moreover, live
video information provided additional information that cannot be obtained from the traditional
weather related sensor information such as floods, road damages, etc. Therefore, a live-video
stream was integrated to the NG-R/WIS as part of the application layer. Further details on video
implementation are discussed in Section 5.2.
34

5 APPLICATIONS DEVELOPED IN THE
APPLICATION LAYER
5.1 Web Service
One of the system deficiencies of the existing District-1 R/WIS, as described in Section 1.2, was
the inability of data delivery to many users with a uniform easy-to-use data presentation. This
deficiency was solved by disseminating information through web pages. The web service delivers
almost unlimited connections to the users from anywhere in the world as long as an Internet
connection exists. One of the big advantages of this method of data dissemination is that neither
learning of the system commands nor passwords are required, since a standard web browser is
the only software needed to access the R/WIS information. A proper design of web pages could
also present the R/WIS information to the users as easy as possible.
To implement the web service, a web server running Windows NT 4.0 was implemented initially
as a Mn/DOT Intranet service. The Internet service was implemented using the Microsoft
Internet Information Server. Later, Wisconsin DOT and others requested access to the Mn/DOT
R/WIS web pages. Therefore, a cache server was specially created to provide the web service
outside the Mn/DOT network. Creation of a cache server was necessary due to the fire-wall
protection of the Mn/DOT network.
Since our goal was providing information to users as easily as possible, the design of the web
pages was based on intuitive graphical user interfaces. Envisioning a state-wide R/WIS system,
the web page starts from a state map as shown in Figure 12. The state-map then leads the user to
a District-1 RPU map as shown in Figure 13. The RPU sites are hyper-linked to red circles, and
the sites' aerial photographs are linked to the blue squares. One of the areal photographs is
shown in Figure 14 which provides scenery of the area. The red circles lead to the
corresponding site menu which provides various sensor information as shown in Figure 15.
35

Figure 12: Front page of the NG-R/WIS web site
Figure 13: District-1 RPU map.
36

Figure 14: Aerial image of Silver Cliff RPU site.
W(Sr~Yj\3t~MI ~ xl
Figure 1S: Site menu ior uarnielau ve. iru
37

From the site menu, the user can choose four different types of data presentations: realtime data
table, site map, 24 hour graph, and 12 hour table. The realtime table provides the atmospheric
and pavement information of the site that was most recently retrieved from the RPU as a form of
tables. Two tables are provided: one table for the atmospheric weather data and the other table
for the pavement information. An example taken from the Garfield Ave. site is shown in Figure
16. This realtime data is then transformed into a graphical form called a site map as shown in
Figure 17. The site map shows the actual locations of the pavement sensors at the site along with
the atmospheric weather and pavement information at that time. The pavement conditions are
color coded as the following: Green represents "Dry", "Moist", "Wet", "Wet and Treated";
Yellow represents "Frost"; Red represents "Snow/Ice", and Blue represents "Sensor Short" or
"Unknown" conditions. Since all of the pavement conditions can also be read as a text, knowing
or memorizing the color code is not that important. The color code was simply applied to give a
different level of attention to the users depending on the pavement conditions.
Figure 10: Kealtime table trom uiarnela Ave. ilte
38

Figure 17: Site map from Garfield Av. Site
Very often understanding the trend of air and pavement temperature along with the dew point is
important. For example, if the dew point and air temperature are nearly in a merging state and
the pavement temperature falls below the freezing point, frost will be formed on the pavement
which is considered hazardous. The 24-hour plot can give information on such trends. Therefore,
the web site provides 24-hour realtime plots which are updated every five to ten minutes
depending on the site. An example plot is shown in Figure 18. In order to plot the data whenever
a new data is inserted into the database, the program utilizes a technique based on a Windows
registry for time synchronization between the integration server and database server. The
program for generating the 24-hour graphs was completely written in MS Visual Basic 5.0 and
Active-X packages. The line graph has limitations in expressing some other types of data, such
as wind direction, wind speed, pavement conditions, etc. In order to compensate the additional
information to the graph, a 12-hour data table is provided. In this way, the general trend is
provided by the 24-hour graph while accurate data instances and pavement conditions are
provided in a 12-hour table form. An example of the 12-hour table is shown in Figure 19. The
12-hour table is produced by an SQL trigger whenever a new data is inserted to the
corresponding table.
39

100F I...
90-
80-
70-
60-
50-
40-
30-
20-
10-
100 F
90
S 80
* 70
S 60
S50
40
- 30
S 20
S10
i I I lI I I I I I i I I I I I
21 22 2300 01 02 03 04 05 06 07 08 09 10 11 1213 14 15 16 17 18 19 20 2126-Apr-98 - - 27Apr-98lAirTemp $DewPoint F,,PaveT emp
Figure 18: sample z4-nour grapn trom ilver (lltt site
Figure 19: Sample 12-hour historic data
40
U k ................. ------------
IWF7-77-SOvei Cliff -Nelm-ape ----------- ---------------
-----" " -:.-. - -----"-,-----.---^ -- ": ." ^- :-"-- ::-.......... . .. ... .... . . ... . .. • .. .:•.. , • .
·- · /•;...,,. ::• .•.·.· ,... .,.-/

5.2 Live Video Stream Service
Although video information does not seem directly related to the traditional concept of R/WIS, a
close look will immediately reveal that it has a strong tie with any realtime weather information.
Suppose that a TV station is reporting about the progress of a big snow storm, flood, or strong
winds, what they will show you first would be the video images of the severe weather activities.
From these images along with other weather parameters, people can quickly and more accurately
assess the situation, and will react accordingly. Also, video information is an excellent source of
information for verifying the data received from the environmental sensors and can help assess
the details of what has happened as a result of the severe weather. In the author's present view,
no other single sensor would be able to replace the capacity of video information.
There are several other important information that can be directly derived from video images in
addition to the visual verifications. With recent advances in video processing and computing
technologies, many automated detection schemes can be implemented using video images. The
following list shows few examples which are presently under research or already developed.
U Visibility can be effectively computed using still video images. This technique has
been studied by Kwon [4].
O Blowing and drifting snow can be detected and measured using a motion analysis
of sequential frames of the video images.
O Traffic volume and speed can be measured.
D Disastrous conditions such as flood or fire can be detected. This is one of the
examples that the traditional R/WIS sensors are not effective, while video images
can be very effective.
O Car accidents or severe visible damages of road ways or signs can be detected
from video images.
41

As a general rule, video cameras with the following features are recommended for the R/WIS
applications.
Q 24-bit color is desirable, but NTSC color would also be acceptable.
O l Auto iris function is required to adapt to various lighting conditions. Iris
automatically controls the amount of light. It is generally controlled through the
exposure time in a CCD camera and a necessary function to acquire a good
picture.
O Pixel resolution of 640X480 is considered adequate.
U An automatic back light compensation is necessary in order to minimize any
drastic drop of contrast at the objects when the camera is against sunlight.
U During the cold winter or damp summer days, frost or fog on the lens can severely
degrade the quality of images. Heaters and cooling fans are required to defrost or
defog the camera lens.
Q Snow, mud, dust, etc., can severely distort the original image. An automatic
cleaning function or a protective mechanism is required to maintain the lens in a
clean state.
For this project, a 0.5" color CCD camera (model No. 1335-2000/EH35) made by Cohu
Company was installed. The camera was sealed and pressurized in a 3.5" diameter tube of
environmental housing. A standard NTSC signal was used. Since the purpose of this project
was to demonstrate how video information can be integrated with the traditional weather related
R/WIS data, only one camera was installed at the top of the District-1 headquarters building.
The method of video integration chosen for this project was through the Mn/DOT Intranet.
Mn/DOT Intranet provides an easy access of information through a well developed infrastructure
and is sufficient for the bandwidth requirement of the video stream. Moreover, video
information can be easily integrated to a web page and can be viewed using common web
browsers.
42

Presently, many video servers and viewers designed for Internet are available in the market. Most
of them are based on compression techniques developed by Motion Picture Experts Group
(MPEG) standards. Presently, MPEG I and MPEG II standards are available. The video streams
can be live or stored files on demand, and can be viewed by a simple click of mouse.
The system chosen for the video implementation in this project was the Xing Technology
Corporation's MPEG live encoder and players. This system can provide both live and on-demand
video streams through Internet web browsers and was considered adequate for the present
application. The system consists of three parts: an MPEG encoder (hardware), a video server
(software) and multiple video players (software). The encoder supplied by the Xing Technology
Corporation was a MPEGLive!Encoder. This encoder is a PC box which has a video card and an
encoder built into the system. The encoder and video server are separate computer and connected
through the Mn/DOT LAN. The video server program is installed in the web server and routs the
video streams to the users. The working theory of the overall system is simple. Suppose that the
port number of the video server transmitter is 1234, and the port number of the encoder is 6789.
When a video player requests video stream, the video server simply reroutes the stream coming
from the encoder which is 6789 to the server transmitter port (1234). In order to facilitate this
rerouting, the files hyper-linked at the web server must have the encoder port number which is
6789 in this case. For the encoder, it simply needs to know the IP address of the video server.
An example image extracted from a live video feed is shown in Figure 20. This image was taken
at night and shows the intersection between Garfield Avenue and Central Entrance. One of the
characteristics of the video encoders that is more desirable for R/WIS applications is utilizing the
bandwidth towards higher quality of pictures than capturing the fast motion. This is because
losing few motions is much less significant than losing the quality of the images in maintenance
applications. The Xing's MPEGLive!Encoder utilized the available bandwidth towards higher
quality than capturing the fast motions.
An informal survey was conducted within District-1 to determine whether prerecorded video
images of the road scenes are useful or not. It was found that prerecorded video images are not
43

Iof much use unless a significant incident was captured into the video images such as a car
accident or a natural disaster. The most value of video was found in a live video feed, from
which we can assess the road conditions. I
In order to determine what combinations of data give the most useful information, a simple test
was conducted using the following method. First, the observer tries to detect the present weather
condition such as rain, snow and fog through the Internet video feed only. And then the observer Ichecks the weather conditions using the R/WIS realtime and historic data. The observer draws a
conclusion regarding the pavement and weather conditions based on these two sets of data. Next,
the observer goes out to the field and verifies his assessment. Similar experiments were Iconducted using the R/WIS realtime data alone, realtime and historic data, and video data alone.
The best assessment of the road conditions was obtained when the realtime data, 24-hour historic Idata, 12-hour table data, and the live video data were combined. This shows that integrated data
is much more effective than any single data alone.
I
IS
I
r igure zu: viaeo image taken from the intersection of CentralEntrance and Garfield Avenue, Duluth, Minnesota. I
44
II

5.3 Automated Voice-Answering Service
The principal idea of relaying the R/WIS information over the phone line through voice is that
there is no special skills or computer is required. Anyone who knows how to use a phone can
call this user friendly system and obtain the information. For maintenance engineers, this service
is very useful when they are working outside their office where they do not have any Internet
connection or a computer. Travelers can also use this call service to obtain the R/WIS
information for their travel plans.
The phone number presently assigned to this automated voice answering system is (218) 723-
4827. From here, we will refer to this automated voice information system as a "voice server."
The general operation of this system works as follows. When a user calls the number (218) 723-
4827, the voice server detects the ring and enquires the most recent data from the database server.
Simultaneously, the voice server side becomes an off-hook state, and a voice menu is played to
the caller. The caller makes a selection by pressing one of the touch-tone keys read by the voice
menu. The voice server transforms the retrieved R/WIS data to a voice and then plays it to the
caller. After sending the data, the voice server repeats the menu again. The caller can quit any
time during the phone session by pressing the "*" key or by hanging up. Keeping the spirit of the
NG-R/WIS, the system was designed as easy-to-use and user friendly.
The equipment used to develop the automated voice service is as follows:
* Computer: Compaq Presario 4504 200 MHz, 16M RAM
* Modem: Hayes Accura 336B Data, Fax, and Voice
* Telephone Line Simulator Hardware: Skutch Electronics AS-4
* Telephone Line Simulator Software: Parity SimPhone
* Development Software: Microsoft Visual Basic V5.0
Parity VoiceBocx
Parity CallSuite Wizard Add-in
45
* Sound Editing Software:
For setting up a voice server, a voice modem or a telephony board is required. In addition,
Windows TAPI (Telephony Applications Programming Interface) must be installed. In most
recent PCs, a version of TAPI is already installed. This is used in conjunction with one or more
Microsoft's TSPs (Telephone Service Providers). Most systems running under Windows will
have the Microsoft Unimodem TSP which was the case in our system. The software Simphone
provided by Parity software can be used for recording and playing back sound files. Obviously, a
sound card, a microphone, and speakers are needed. Also, the sound card must have a WAVE
driver.
The standard sound format used in Windows is the WAVE format which is identified by the
".wav" file extension. It is most commonly recorded at a 16-bit, 11 kHz sampling rate, but can
also be in other formats which have higher quality but more memory requirements. There is
another family of schemes known as ADPCM (Adaptive Differential Pulse Code Modulation),
which is frequently used in voice processing hardware. The ADPCM sound format that most
telephony cards use is called VOX (from the Latin work "vox" which means "voice") and is
identified by the ".vox" file extension. VOX files are not compatible with the Windows WAVE
files. VOX files are usually in a 4 bit, 6 KHz configuration which is the case of the sound files in
this project. There is no file header for its sample size and sampling rate like there is in a WAVE
file.
When working on the application from the CallSuite Wizard Add-in, the files are recorded from
the microphone attached to the sound card using SimPhone and are immediately converted into
VOX format as they are being recorded. This is what was used to create the longer phrases used
in the voice server. For the shorter little variable words like "One", "Monday", "April", and
"Dollars", we used the VOX studio software to do the recording. VOX Studio has the capability
to record sound files in WAVE format and convert them into VOX format. We only used the trial
version so sound files were restricted to five seconds in length. First the sound was record with
46
Zentec Vox Studio
the microphone and saved in the standard wave format. Then the current file is converted into a
Dialogic, 4-bit ADPCM, 6 KHz format and saved with a ".vox" extension. In general, the
WAVE format has much better sound quality.
Short variable words and phrases are used in TTS (Text to Speech) conversion which is the
process of generating spoken phrases from input text. There are a couple main types of phrases
that can be played by the built in features of VoiceBocx.
* Numbers: 2538 -> "Two Thousand Five Hundred Thirty Eight"
* Ordinals: 61 -> "Sixty First"
* Money: $72.01 -> "Seventy Two Dollars And One Cent"
* Dates: 19980103 -> "January Third Nineteen Ninety Eight"
* Times: 1336 -> "One Thirty Six PM"
* Strings: 12o#p -> "One Two Oh Pound Pee"
All of these little sound files are put into another type of sound file called an Indexed Prompt File
(IPF). An IPF is a collection of VOX files combined into a large single file. IPFs are read only
and cannot be edited. If one tries to edit the sound files in an IPF, it would start creating small
wasted spaces by replacing a longer file with a shorter one and would write over some of the next
sound by replacing a smaller file with a larger one. The alternative would be to have a lot of
overhead to handle the re-organizing of the IPF. In order to edit the whole sound files in the
existing IPF files (Stan24ke.ipf and STdt24ke.ipf), the utilities "expipf.exe" and "mkipf.exe" are
used. "Expipf.exe" breaks the IPF file into separate editable VOX files and "Mkipf.exe" takes a
group of VOX files defined by the header file and makes an IPF file out of them.
In order to test the application during the development stage, a telephone simulator called
SimPhone is used. It is as simple as moving the mouse to the ring button once the application has
started and then to the desired buttons for the menu options. Everything from each procedure can
be heard through the speakers connected to the sound card. The main features of SimPhone
47

include:
* Projects can be developed without having all of the necessary hardware to actually
run it. It can be saved on a disk and put on a computer that has a Dialogic board or
voice modem installed to run the project.
* Projects can be easily demonstrated to others without requiring an actual call.
* It supports VOX format unlike the other sound players that run in a Windows
environment. When an application is running, it can play and record VOX files
through a WAVE compatible sound card.
* VoiceBocx and SimPhone were designed to work together so the same program
can be run on an actual phone line or on Simphone without changing settings. It
will automatically adjust to work on the simulated line.
SimPhone must be started before the application is started in order for it to be recognized. In a
Visual Basic development environment, Simphone can be started by clicking on the Simphone
option under the add-ins menu. It does not need to be started before starting Visual Basic itself.
When there is no current telephony application running, the Ring command button will be greyed
out. That way the ring signal cannot be sent to a program that does not exist. Once an application
has started, the Ring button becomes enabled. The telephone icon shows whether or not the
phone line is open or closed. The phone on-hook declares a closed line. Once the phone is off-
hook, the ring button turns into a hang-up button. Clicking on this will then simulate a
disconnection. Clicking on any of the numerals will put that digit on the simulated channel.
SimPhone is nice for developing and demonstrating, but testing with a real phone line is the only
way that can ensure that the application runs correctly. For the development of software,
CallSuite Wizard can be used as the first step to generate an initial template, and then Visual
Basic codes can be added to complete the software. Figure 21 shows the state diagram of the
program developed and summarizes how the overall program works. Programming techniques
are further explained in Appendix E.
48

No
Yes
No
Figure 21: Flow graph of voice server program
49

50

6 PROJECT EVALUATION
Implementation of all four layers of NG-R/WIS was completed at the end of April 1998 for
demonstration and evaluation. On May 12, 1998, Mr. Ed Fleege at Mn/DOT organized a meeting
to evaluate and make suggestions for the NG-R/WIS project. The members who participated in
the meeting consisted of five Mn/DOT engineers and decision makers and four UMD students
participated in the projects and the project leader Dr. Taek Kwon.
The participants are:
Mn/DOT
Ed Fleege
Bruce Larson
Dean Cummins
Roberta Dwyer
Jay Koski
Lauraine Cramer
UMD
Taek Kwon
Mark Sholund
Scott Findley
Erik VanGuilder
Andy Olson
The meeting started by introducing the project background and overview by Dr. Taek Kwon.
Mr. Bruce Larson described the past state of the R/WIS at Mn/DOT District-1 and summarized
his view on the project. He further summarized the general evaluation of Mn/DOT regarding the
work result as:
51

"The overall project exceeded our expectation."
Mr. Ed Fleege went through the web pages one by one using a screen projector and asked
suggestions on what could be improved at the user interface end. The following summarizes the
list of suggestions that came out of the evaluation meeting.
Main and District-1 Map pages
* The "Modem and Site Status" link is difficult to understand. Provide "a help
page" in describing the meaning of this page. Also, password protection may be
needed.
* Change the color of the main page on video indicators, so that it stands out.
* Per district-1 map, provide pop-up labels at each RPU location for the
identification purpose of the site.
* From the aerial photo, make the site names standout by writing the letter on a high
contrast background stripe.
Realtime Data Table
* Spell out Yes/No instead of using Y/N.
* For wind direction, use a cardinal notation, i.e., N, NE, SE, .... etc.
Site Map
* Have color change to reflect the pavement condition.
* Use light blue background instead of blue background for atmospheric data.
* Correct the sensor locations.
* Make the site map be the first page to access from the Dist-1 map.
* Add a menu to the site map to lead to other pages.
* Label sensors on the site map.
52

* Per RPU towers, provide a narrative paragraph.
* Remove the password requirement from the realtime table.
* Correct the arrows in the aerial photo. Do not use the word RPU on the label.
Live Video Stream
No suggestions were received.
Automated Voice Service
* Add wind direction information.
These suggestions were carefully reviewed and reflected to the design of the overall application
layer. At the end of the meeting, Dr. Kwon distributed a survey questionnaire to all Mn/DOT
members in the meeting to further evaluate and probe the present work. Only one person replied
to the questionnaire due to limited time. The questionnaire is attached in Appendix F.
53

54

7 CONCLUSIONS
7.1 Future Work and Recommendation
This project merely developed and demonstrated a new concept and architecture from the
existing R/WIS that could grow with new technologies and applications. The emphasis of the
architecture was given to the development of the integration and dissemination infrastructures to
improve the main deficiency of the present system. However, there is still more work to be done
than what has already been done in order to achieve the full benefit of the proposed NG-R/WIS.
Several issues on future work and recommendations of the author's opinion are discussed here.
Presently, no standards exist in the data integration layer of the NG-R/WIS. Due to this absence,
it is very difficult to add new sensors to or remove the old ones from the existing RPUs and
integration servers unless the integrator is the original manufacturer of the units. It is desirable
that RPUs be designed, such that they follow a standard programmable environment from which
users can easily add, remove, or modify the sensors connected to RPUs. Therefore, it is
recommended that Mn/DOT establishes a standard for the data integration layer.
Present implementation of web pages simply provide a pool of general information, from which
everybody sees the same data. This application can be further developed into a new technology
called "push technology" which provides customized information to each individual or group of
people instead of providing the same information to everybody. This application could be
integrated with the technology called data mining' in order to extract the information needed for
specific users or groups from the central database and process them to meet the customized
needs. Along with this, automated emails or paging systems could be easily developed from the
present NG-R/WIS to supplement the use of web pages.
'Data mining is a term used to describe "data-driven discovery of trends and relations inarchival data."
55

Although sensor technologies have been steadily improving during the last decade or so due to
the rapid evolution in digital technologies, several critically important sensors for road
information have yet to be developed. These include sensors that could measure the amount of
snow on the road, slipperiness of the pavement, and visibility in blowing snow. In particular,
there is a need for developing a method or a sensor that could measure how much snow is on the
road, because if the amount of snow is known, it is then possible to calculate how much salt
would be required to melt the snow under the given pavement temperature. Such information
could significantly reduce the amount of salt used and will lead to huge savings in snow removal
cost, minimum damage to the environment, and increased efficiency of the snow removal
operations. Unfortunately, present R/WIS sensors can not detect how much snow is actually on
the road surface, although it may detect the existence and the rate of fall. Therefore, it is
recommended that some research work should be done to develop a new sensor for snow
measurements. Next, information on the slipperiness of a road surface is equally important for
road maintenance and driver safety, because it provides a feedback to the maintenance engineers
on how much they have to improve the traction of the road surface, and because it provides an
early warning to the public for precaution. Presently, slipperiness of road surface can be
measured, but the equipment available is too expensive for use in practice. Consequently, most
states do not measure the slipperiness of the road. Therefore, a large effort in developing a low-
cost slipperiness sensor is needed and is recommended for future research work.
National Weather Service provides excellent data for the present and forecasted weather. This
information is extremely valuable for predicting the pavement conditions and have been used by
Mn/DOT maintenance engineers. Therefore, it is recommended that the National Weather
Service data be integrated with the existing R/WIS and disseminated through the web pages.
Snow storms and related bad pavement conditions are one of the leading causes of traffic
disruption in Minnesota. One of the purposes of winter road maintenance is to provide good
driving conditions for travelers, such that traffic flows smoothly and accidents are minimized.
56

Therefore, there is a need for an integrated treatment of the R/WIS data, the traffic management
strategy, and the snow removal operations. For example, if the pavement traction of an
intersection was significantly reduced due to snow and ice on the ground, each phase of the
traffic control signal should be extended to compensate the slow response time. If, however, the
pavement condition was improved due to the maintenance operation, the control logic should be
operated back to a normal mode. Such an adjustment of the traffic control according to the
pavement condition has not been employed in Minnesota. Therefore, it is recommended that the
traffic and incident data be integrated with the R/WIS data, such that both traffic and
maintenance engineers have a better understanding on how each side affects and benefits by
coordinating their operations.
The R/WIS database provides a set of road conditions and forecasts which could be extremely
beneficial to travelers. Such information can be easily customized for travelers from the present
R/WIS architecture and provided to the public in the form of web pages. Going one step further,
if the road conditions become hazardous to drive, variable message signs could be used to warn
the public based on the realtime information available from the NG-R/WIS database. Therefore,
development of a travelers information system that incorporates the NG-R/WIS information is
recommended.
When a snowstorm occurs, travelers not only need to know the amount of snow fall, but also
when the road was last plowed in order to assess their journey. Therefore, there is a need for
creating a snowplow information network (SIN) that could report snow removal activities to the
public in realtime. Creating such a network and integrating it as a part of R/WIS will benefit both
travelers and snow removal operators. Travelers would get information on which roads are
cleared, while the maintenance engineers will get information on which road needs to be cleared.
Therefore, development of a SIN is recommended.
In R/WIS, the sensor data at each RPU only represents a sample along a long stretch of the road.
In many cases the distance between RPUs could exceed more than 100 miles, and the weather
57

and pavement data between the RPU sites could be significantly different from the RPU sites.
Therefore, there is a need for mathematically estimating the data between RPUs where sensors
are not available. Such a technique is called a now-forecast and requires a mobile sensor vehicle
in order to collect sample data between the RPU sites. The historical data collected from each
RPU site and the mobile sample of data along the stretch of the road provide the two essential
components needed for the now-prediction. Another component suggested by many researchers
is the inclusion of geographical characteristics along the stretch of the road such as rock-cut,
vegetation area, etc. to increase the forecast accuracies [2]. It is recommended that Mn/DOT
incorporates now-prediction as a basic function of the R/WIS.
Other future works recommended include an automated pager system that calls maintenance
engineers to the affected area, AM/FM radio broadcast system for data dissemination, crew
scheduling and decision support system, automated incident detection and monitoring, and video
integration at RPU sites.
7.2 Conclusions
The original R/WIS in the Mn/DOT District 1 office consisted of equipment from three different
manufacturers and had a number of problems that made it difficult for users to access and use the
system. This project recognized those problems and set out to provide solutions. In addition, this
project was intended to build a system that could serve as a prototype for the newly initiated
statewide R/WIS project. The immediate goals were developing a system that is easy to use,
allows unlimited access from anywhere, provides unified data format, requires neither special
terminals nor software, and has an architecture that is scalable and easy to integrate. In order to
achieve these goals, a new concept of layered architecture called the Next-Generation R/WIS was
introduced and implemented. This architecture allowed integration of heterogeneous systems
through the data integration layer and provided structured data to applications through a standard
relational database. Three applications were developed in this project: web page service,
58

automated voice service, and live stream-video service. The data dissemination method through
web pages and automated voice services provided the solutions for the design goals of unlimited
access from anywhere, unified format, ease of use, and no requirements of special terminals or
software. The live video-stream service demonstrated integration capability of the system and
provided a new class of information. According to the comments from the evaluation meeting,
the project was successfully completed and exceeded the Mn/DOT's expectation.
59

60

REFERENCES
[1] Road Weather Information System, Minnesota Department of Transportation, Task Force
Report to New Technology Research Committee, June 1993
[2] Jorgen Borgren, Application of a Local Climatological Model for Prediction of Air and Road
Surface Temperature, GUNI rapport 31, University of Gothenburg, Department of Physical
Geography, 1990.
[3] National Transportation Communications for ITS Protocol (NTCIP) Object Definitions for
Environmental Sensor Stations (ESS), Draft Version 97.01.09, July 30, 1997.
[4] Taek Kwon, An Automatic Visibility Measurement System Based on Video Cameras,
Minnesota Department of Transportation, MN/RC-1998-25, September, 1998.
[5] D.S. Roosevelt and R.A. Hanson, Evaluation of the Availability and accuracy of the Virginia
Department of Transportation' Road Weather Information System, VTRC 98-R21,
November 1997.
[6] Bob Edgar, PC Telephony: The Complete Guide to Designing, Building and Programming
Systems Using Dialogic and Related Hardware, 4' Ed., Flatrion Publishing, Inc., New York,
1997.
61

62

Appendix A
Sensor Data Available from District-1 RPU Sites


Appendix A: Sensor Data Available from District-1 RPU
Sites
A.1 SSI RPUs
SSI RPUs are installed at the following sites: Lafayette Bluff, Garfield Av. Duluth, and
Thompson Hill. Atmospheric and pavement data are available from all sites and summarized
below.
A.1.1 Atmospheric Data
(1) Air Temperature: Degrees in Fahrenheit
(2) Wind Direction: Min, Avg, Max in 0 to 360 Degrees
(3) Wind Speed: Avg, Gust in Miles per Hour
(4) Relative Humidity: Percent
(5) Dew Point Temperature: Degrees in Fahrenheit
(6) Precipitation: [Y/N]
(7) Precipitation Type and Intensity: Not available from District-1 installation,
WIVIS must be installed.
(8) Precipitation Rate: Not available from District-1 installation,
WIVIS must be installed.
(9) Daily Precipitation Accumulation: Not available from District-1 installation,
WIVIS must be installed.
A.1.2 Pavement Data
A. 1.2.1 Surface Sensor
(1) Status:
A-1

Dry
Wet
Chemical Wet:
Precipitation occurring, moisture present on the surface, and surface
temperature at or below 32 degrees Fahrenheit.
Snow/Ice Alert:
Precipitation occurring, moisture in liquid form on the surface starting to
freeze. Precipitation occurring, moisture on the surface which has frozen.
Absorption:
Moisture present on surface in an insufficient amount to present a hazard
and no precipitation is present.
Dew:
Moisture present on surface, no precipitation , surface temperature is equal
to or less than dew point, and surface temperature is above 32 degrees.
Frost:
No precipitation, surface temperature moving through dew point, and
surface temperature is below 32 degrees.
Absorption @Dpt:
Moisture present on surface in an insufficient amount to present a hazard,
dew point has been reached, and no precipitation is present.
(2) Surface Temperature: Degrees in Fahrenheit
(3) Chem Factor: Percent
A.1.2.2 Sub-Surface Sensor
(1) Temperature: Degrees in Fahrenheit
A-2

A.2 Vaisala RPUs
Vaisala RPUs are located at the following sites: Pier 20 and South Abutment of Blatnik Bridge
and Thompson Hill. Atmospheric and pavement data are available from all sites and summarized
below.
A.2.1 Atmospheric Data
(1) Air Temperature: Degrees in Fahrenheit
(2) Relative Humidity: Percent
(3) Dew Point: Degrees in Fehrenheit
(4) Precipitation Type:
H: Heavy, above 8 mm per hour
M: Medium, 2-8 mm per hour
L: Light, 0-2 mm per hour
R: Rain, precipitation reported at the time of observation
r: Recent rain, precipitation recorded between the last observation and this
observation.
(5) Precipitation Rate: Inches per Hour
(6) Wind Direction: 0 to 360 Degrees
(7) Wind Speed: Avg and Gust peed in miles per hour.
A.2.2 Pavement Data
(1) Pavement Temperature: Degrees in Fahrenheit
(2) Soil Temperature: Degrees in Fahrenheit
(3) Freezing Point: Degrees in Fahrenheit
(4) Surface Status:
DR: Dry
A-3

MO: Moist
WE: Wet
TR: Trace, residual chemical on surface
WT: Wet and Treated, surface wet and deicing chemical present
FR: Frost
SN: Snow
IC: Ice
SH: Sensor short, short circuit perhaps due to cable fault
A-4

Appendix B
Extraction of Data from Vaisala and SSI RPU Servers


Appendix B: Extraction of Data from Vaisala and SSI RPU
Servers
The integration server polls the Vasala and SSI RPU severs every three minutes through
modem. Since both RPU servers are designed to work with terminals, it sends out terminal
control characters which are mixed with the data we need. This appendix describes how the
data are extracted.
B.1 Vaisala Data
Through a terminal capture function, Vaisala server data is captured into a file where extra
control characters are mixed with the R/WIS data. This data represents the formatting codes
sent to the screen to make the display easy to read. This additional data just gets in the way of
extracting the relevant data and must be removed before data extraction can take place.
The formatting codes all begin with an escape character ('' in a text display) and end with the
letter "H". The raw data file is sent to a Visual Basic procedure Character_Remove() which
writes each character from the raw data file to a new file but excludes all characters between
and including the beginning escape character and ending "H". This new file contains the
information shown in Figure 6 in a non formatted form with a few additional strings intermixed.
The process of extracting data from each of the three sites is the same, with the Silver Cliff data
provided as an illustration.
The first bit of useful information is the name of the site, TH61 Silver Cliff, but this is preceded
in the capture file by some useless data. This data contains two occurrences of the string
(characters between spaces) "STATUS", so it is a simple matter of getting a string, checking to
see if it is "STATUS", and then stopping when "STATUS" is encountered the second time.
This second occurrence is the "STATUS" seen at the top of Figure 6. The current string now
B-l

contains "SITESTATUSTH61SilverCliffDATA". The name of the site imbedded in this string
is determined by comparing it with the string "Silver" and "Pier". If it is not one of these two, it
is interpreted as the third site name.
The second piece of information is the time. This is extracted by skipping the next string and
reading the following string into a variable. The date follows immediately after this is written
to a variable. All data starting from "CDT" to "#1" is skipped and the air, soil, and freezing
point temperatures are read into their respective variables. The next string is examined to see if
it starts with a digit. This produces two cases with different results:
1 It is a digit. "N" is written to the precipitation variable and the current string is
written to the precipitation rate variable.
2. It is not a digit. The character in the current string is written to the precipitation
variable and the next string is read and written to the precipitation rate variable.
The wind direction (0° to 3600 with 0° being a wind from the north, 900 being from the east
and so on), average wind speed, and wind gust speed are written to their respective variables.
Data is skipped to reach the name of the first pavement sensor, here the string "NB". This, and
all subsequent strings, are written as an entry into an array of pavement names until the current
string contains a period. This indicates that data is encountered and the pavement, soil, and
freezing point temperatures are read and written into variables. Then the pavement condition
code is written to a variable. If only one character appears in the next string, then it is an alarm
code that is then written to an array. This step is repeated until all of the pavement information
is read. Here, three more lines of data must be interpreted. When all of the data for the
pavement sensors are contained in variables, all of the data collected for the site can be written
to a table in an SQL database. As a final step before proceeding to the remain sites, an HTML
(HyperText Markup Language) file is written in which all of this data is presented in a table.
With all of the data recorded, the process of reading and writing data is repeated for the two
B-2

remaining Vaisala sites (Pier 20 on the Blatnik Bridge and Blatnik Bridge's South Abutment).
B.2 SSI Data
Unlike Vaisala, the data in Figure 10 does not contain formatting codes that appear when that
data is captured. The removal of extra data is not necessary.
The first step to interpreting data SSI data is to get the name of the site that is being scanned.
This is accomplished by looking for a string in the format MM/DD/YY. This will read and skip
every string up to the "Power on" date. The name of the site is then read into a string variable
until "RPU" is encountered. The next piece of information is the time. This can be found by
looking for a string of the format HH:MM and the data we want follows.
The next piece of data we want to read is the air temperature. This can be found by looking for
a string that has a digit as the first character. In Figure 10, 63 is the air temperature and is read
into a variable. The dew point is then read in the same fashion. The precipitation indicator is
either "Y" or "N" indicating whether or not precipitation is currently falling. The relative
humidity is read as the next number and then the data becomes a bit tricky. Two cases now
arise:
1. It is a calm day. No wind directions will be shown. For our program to work
correctly however, a wind direction must always be given so we set the three
directions variables to 0°. The Average Wind Speed, "Calm", is converted to 0
mph and the Gust Wind Speed is read. If that is a number, everything is okay,
but if it is "Calm" as well, then it is converted to 0 mph also.
2. It is a windy day. This is a different case than the figure shows, but it occurs
nonetheless. The three wind directions are read as one of eight cardinal direction
strings (N, NE, E, SE, S, SW, W, or NW) and each is converted to an angle (0 °,
45°, 90°, 135 , 180°, 225 , 270°, 315 ). Since a definite wind direction exists,
B-3

there will be average and gust wind speeds.
Now a series of pavement sensors providing a name, condition, temperature, and chemical
factor must be read. The first sensor's name can be reached by reading strings until a number is
found. This will position the file pointer right before the next pavement sensor. Strings are
read and added to the sensor name until a known pavement condition is reached. This
condition must be converted to a meaningful value and the next string can be read as the
temperature at that sensor. Now the chemical factor must be read, but one might not be present.
The way to remedy this is to assume that one exists, read it as the chemical factor and then look
at the next string. If the next string is not a digit, then no chemical factor exists. Set the
chemical factor to "NULL" to reflect this. This procedure is done for the rest of the pavement
sensors until the "Sub-Surface Temperature" string is found; only a temperature is read. The
sensor station is now completely interpreted. The data from this site can be written to a
database and the remaining two sites (one on Thompson Hill in Proctor, MN and one at the
"intersection" of Interstate 35 and Garfield Avenue in downtown Duluth) are examined using
the same procedure.
B-4

Appendix C
SQL Scripts for Table Creation


Appendix C: SQL Scripts for Table Creation/* Microsoft SQL Server - Scripting */
/* Server: D1ANTS060 */
/* Database: rwis */
/* Creation Date 12/8/98 4:38:20 PM */
/****** Object: Table dbo.garfield Script Date: 12/8/98 4:38:21 PM ******/
CREATE TABLE dbo.garfield (
datetime datetime NOT NULL,
air_temp real NOT NULL,
rh tinyint NOT NULL,
dewpt real NOT NULL,
precip char (1) NOT NULL,
avgwindspeed int NOT NULL,
gustwindspeed int NOT NULL,
avgwinddir int NULL,
minwinddir int NULL,
maxwinddir int NULL,
pavetemp l real NOT NULL,
pavetemp2 real NOT NULL,
pavetemp3 real NOT NULL,
pavetemp4 real NOT NULL,
pavecondl char (15) NOT NULL,
pavecond2 char (15) NOT NULL,
pavecond3 char (15) NOT NULL,
pavecheml int NULL,
pavechem2 int NULL,
pavechem3 int NULL
C-1
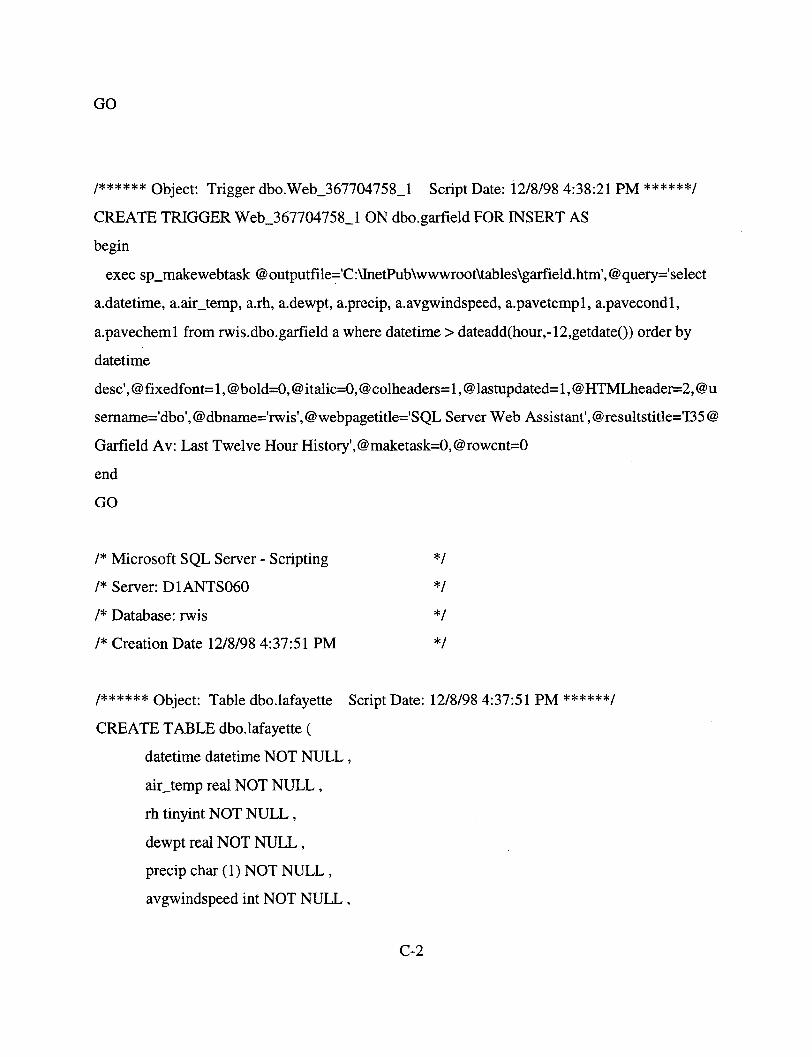
GO
/****** Object: Trigger dbo.Web_367704758_1 Script Date: 12/8/98 4:38:21 PM ******/
CREATE TRIGGER Web_367704758_1 ON dbo.garfield FOR INSERT AS
begin
exec sp_makewebtask @outputfile='C:\InetPub\wwwroot\tables\garfield.htm', @query='select
a.datetime, a.airtemp, a.rh, a.dewpt, a.precip, a.avgwindspeed, a.pavetempl, a.pavecondl,
a.pavecheml from rwis.dbo.garfield a where datetime > dateadd(hour,-12,getdate() order by
datetime
desc', @fixedfont= 1, @bold=0, @italic=0, @colheaders= 1, @lastupdated= 1, @HTMLheader=2, @u
serame='dbo', @dbname='rwis',@webpagetitle='SQL Server Web Assistant', @resultstitle='I35 @
Garfield Av: Last Twelve Hour History', @maketask=0, @rowcnt=0
end
GO
/* Microsoft SQL Server - Scripting
/* Server: D1ANTS060
/* Database: rwis
/* Creation Date 12/8/98 4:37:51 PM
*1
*1
*1
*1
/****** Object: Table dbo.lafayette Script Date:
CREATE TABLE dbo.lafayette (
datetime datetime NOT NULL,
air_temp real NOT NULL,
rh tinyint NOT NULL,
dewpt real NOT NULL,
precip char (1) NOT NULL,
avgwindspeed int NOT NULL,
12/8/98 4:37:51 PM ******/
C-2

gustwindspeed int NOT NULL,
avgwinddir int NULL,
minwinddir int NULL,
maxwinddir int NULL,
pavetempi real NOT NULL,
pavetemp2 real NOT NULL,
pavetemp3 real NOT NULL,
pavetemp4 real NOT NULL,
pavecondl char (15) NOT NULL,
pavecond2 char (15) NOT NULL,
pavecond3 char (15) NOT NULL,
pavecheml int NULL,
pavechem2 int NULL,
pavechem3 int NULL
GO
/****** Object: Trigger dbo.Web_399704872_3 Script Date: 12/8/98 4:37:52 PM ******/
CREATE TRIGGER Web_399704872_3 ON dbo.lafayette FOR DELETE AS
begin
exec sp_makewebtask @outputfile='C:\InetPub\wwwroot\tables\afayette.htm', @query='select
a.datetime, a.air_temp, a.rh, a.dewpt, a.precip, a.avgwindspeed, a.pavetempl, a.pavecondl,
a.pavecheml from rwis.dbo.lafayette a where datetime > dateadd(hour,-12,getdate() order by
datetime
desc', @fixedfont= 1, @bold=0, @italic=0, @colheaders= 1, @lastupdated= 1, @HTMLheader=2, @u
semame='dbo', @dbname='rwis', @webpagetitle='SQL Server Web
Assistant', @resultstitle='Lafayette Bluff: Last Twelve Hour History', @maketask=0, @rowcnt=0
end
C-3

GO
/* Microsoft SQL Server - Scripting */
/* Server: D1ANTS060 */
/* Database: rwis */
/* Creation Date 12/8/98 4:37:11 PM */
/****** Object: Table dbo.pier_20 Script Date: 12/8/98 4:37:12 PM ******/
CREATE TABLE dbo.pier20 (
datetime datetime NOT NULL,
air_temp real NOT NULL,
rh tinyint NOT NULL,
dewpt real NOT NULL,
precip char (1) NOT NULL,
prate real NULL,
avgwinddir int NULL,
avgwindspeed int NOT NULL,
gustwindspeed int NOT NULL,
pavetempi real NOT NULL,
pavetemp2 real NOT NULL,
soiltempl real NOT NULL,
soiltemp2 real NOT NULL,
freezel real NULL,
freeze2 real NULL,
pavecondl varchar (15) NOT NULL,
pavecond2 varchar (15) NOT NULL,
alarml char (1) NULL,
alarm2 char (1) NULL
C-4

GO
/****** Object: Trigger dbo.Web_416004513_1 Script Date: 12/8/98 4:37:14 PM ******/
CREATE TRIGGER Web_416004513_1 ON dbo.pier_20 FOR INSERT AS begin exec
sp_makewebtask @outputfile='C:\Inetpub\wwwroot\tables\pier_20.htm',@query='select
datetime, air_temp,rh,dewpt,precip, pavetempl,pavecondl,avgwindspeed from pier_20 where
datetime > dateadd(hour, -12, getdate() order by datetime
desc', @ fixedfont= 1, @bold=0, @italic=0, @colheaders= 1, @lastupdated= 1, @HTMLheader=2, @u
sername='dbo', @dbname='rwis', @webpagetitle='Pier 20, Blatnik', @resultstitle='Pier 20, Blatnik:
Last Twelve Hour History', @maketask=0,@rowcnt=0 end
GO
/* Microsoft SQL Server - Scripting */
/* Server: D1ANTS060 */
/* Database: rwis */
/* Creation Date 12/8/98 4:36:24 PM
/****** Object: Table dbo.s_abut Script Date: 12/8/98 4:36:24 PM ******/
CREATE TABLE dbo.s_abut (
datetime datetime NOT NULL,
air_temp real NOT NULL,
rh tinyint NOT NULL,
dewpt real NOT NULL,
precip char (1) NOT NULL,
prate real NULL,
avgwinddir int NULL,
avgwindspeed int NOT NULL,
C-5

gustwindspeed int NOT NULL,
pavetemp l real NOT NULL,
pavetemp2 real NOT NULL,
pavetemp3 real NOT NULL,
soiltempi real NOT NULL,
soiltemp2 real NOT NULL,
soiltemp3 real NOT NULL,
freeze 1 real NULL,
freeze2 real NULL,
freeze3 real NULL,
pavecondl varchar (15) NOT NULL,
pavecond2 varchar (15) NOT NULL,
pavecond3 varchar (15) NOT NULL,
alarml char (1) NULL,
alarm2 char (1) NULL,
alarm3 char (1) NULL
GO
/****** Object: Trigger dbo.S_Abutl Script Date: 12/8/98 4:36:25 PM ******/
CREATE TRIGGER S_Abutl ON dbo.s_abut FOR INSERT AS begin exec sp_makewebtask
@outputfile='C:\lnetPub\wwwroot\tables\South_Abut.htm', @query='select datetime, air_temp,
rh, dewpt, precip, pavetempi, pavecondl, avgwindspeed from S_Abut where datetime >
dateadd(hour, -12, getdate() order by datetime
desc', @fixedfont=1, @bold=0, @italic=0, @colheaders= 1, @lastupdated= 1, @HTMLheader=2, @u
sername='dbo',@dbname='rwis',@webpagetitle='Blatnik S. Abut',@resultstitle='Blatnik S. Abut:
Twelve Hour History',@maketask=0,@rowcnt=0 end
C-6

GO
/* Microsoft SQL Server - Scripting
/* Server: D1ANTSO60 */
/* Database: rwis */
/* Creation Date 12/8/98 4:09:21 PM */
/****** Object: Table dbo.silver_cliff Script Date: 12/8/98 4:09:22 PM ******/
CREATE TABLE dbo.silver_cliff (
datetime datetime NOT NULL,
air_temp real NOT NULL,
rh tinyint NOT NULL,
dewpt real NOT NULL,
precip char (1) NOT NULL,
prate real NULL,
avgwinddir int NULL,
avgwindspeed int NOT NULL,
gustwindspeed int NOT NULL,
pavetempl real NOT NULL,
pavetemp2 real NOT NULL,
pavetemp3 real NOT NULL,
pavetemp4 real NOT NULL,
soiltemp l real NOT NULL,
soiltemp2 real NOT NULL,
soiltemp3 real NOT NULL,
soiltemp4 real NOT NULL,
freeze 1 real NOT NULL,
freeze2 real NOT NULL,
freeze3 real NOT NULL,
C-7

freeze4 real NOT NULL,
pavecondl varchar (15) NOT NULL,
pavecond2 varchar (15) NOT NULL,
pavecond3 varchar (15) NOT NULL,
pavecond4 varchar (15) NOT NULL,
alarml char (1) NULL,
alarm2 char (1) NULL,
alarm3 char (1) NULL,
alarm4 char (1) NULL
GO
/****** Object: Trigger dbo.Web_368004342_1 Script Date: 12/8/98 4:09:22 PM ******/
CREATE TRIGGER Web_368004342_1 ON dbo.silver_cliff FOR INSERT AS begin exec
spmakewebtask @ outputfile='C:\Inetpub\wwwroot\tables\silver_cliff.htm', @query='select
datetime, airtemp,rh,dewpt,precip, pavetempl,pavecondl,avgwindspeed from silver_cliff
where datetime > dateadd(hour, -12, getdate()) order by datetime
desc', @fixedfont= 1, @bold=0, @italic=0, @colheaders= 1, @lastupdated= 1, @HTMLheader=2, @u
sername='dbo', @dbname='rwis', @webpagetitle='Silver Cliff, @resultstitle='Silver Cliff: Last
Twelve Hour History', @maketask=0, @rowcnt=0 end
GO
/* Microsoft SQL Server - Scripting */
/* Server: D1ANTS060 */
/* Database: rwis */
/* Creation Date 9/22/98 1:14:04 PM */
/* This is to rebuild the thompson table */
C-8
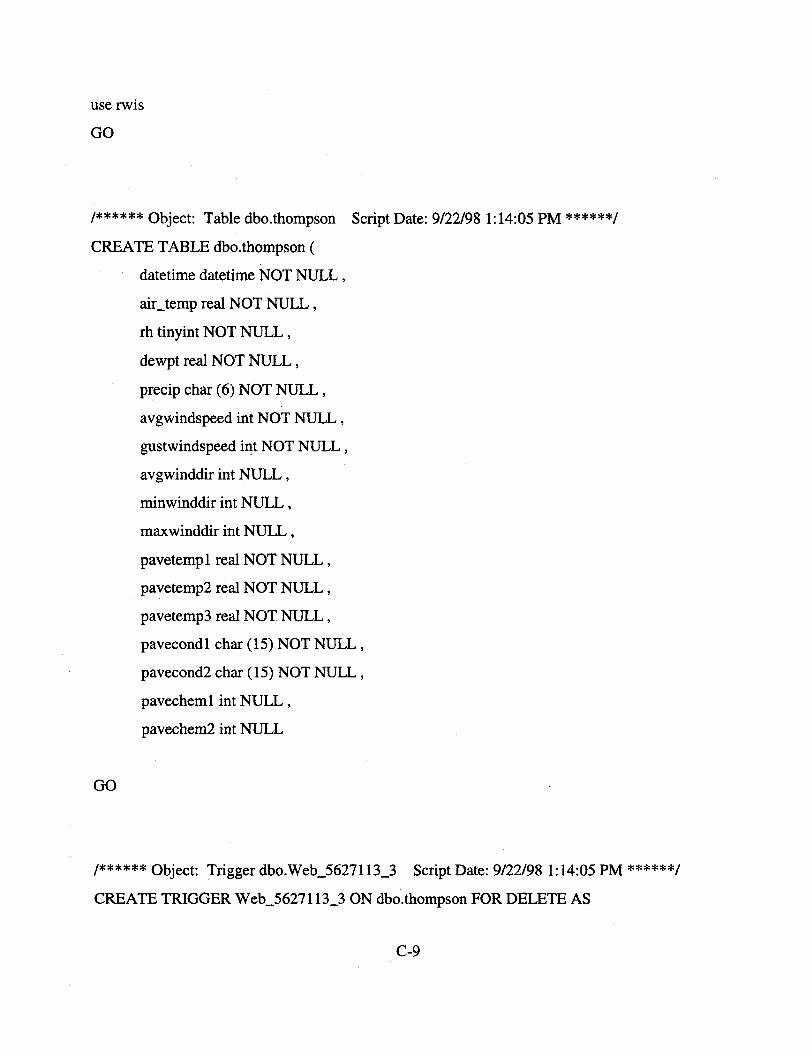
use rwis
GO
/****** Object: Table dbo.thompson Script Date: 9/22/98 1:14:05 PM ******/
CREATE TABLE dbo.thompson (
datetime datetime NOT NULL,
air_temp real NOT NULL,
rh tinyint NOT NULL,
dewpt real NOT NULL,
precip char (6) NOT NULL,
avgwindspeed int NOT NULL,
gustwindspeed int NOT NULL,
avgwinddir int NULL,
minwinddir int NULL,
maxwinddir int NULL,
pavetempl real NOT NULL,
pavetemp2 real NOT NULL,
pavetemp3 real NOT NULL,
pavecond1 char (15) NOT NULL,
pavecond2 char (15) NOT NULL,
pavecheml int NULL,
pavechem2 int NULL
GO
/****** Object: Trigger dbo.Web_5627113_3 Script Date: 9/22/98 1:14:05 PM ******/
CREATE TRIGGER Web_5627113_3 ON dbo.thompson FOR DELETE AS
C-9

begin
exec sp_makewebtask @outputfile='CL:netPub\wwwroot\tables\thompson.htm', @ query='select
datetime, air_temp, rh, dewpt, precip, pavetemp1, pavecondl, avgWspeed=avgwindspeed from
thompson where datetime > dateadd(hour,-12,getdate() order by datetime desc
', @ fixedfont= 1, @bold=0, @italic=0, @colheaders= 1, @lastupdated= 1, @HTMLheader=2, @usern
ame='dbo',@ dbname='rwis', @webpagetitle='SQL Server Web Assistant', @resultstitle='Query
Results', @maketask=0, @rowcnt=0
end
GO
C-10

Appendix D
SQL Server Maintenance


Appendix D: SQL Server Maintenance
A quick guide to SQL programming and maintenance methods are provided in this Appendix.
D.1 SQL Identifiers
Maximum up to 30 characters
NOT sensitive to cases
Allowed characters are letters, digits, #, $,_
Spaces are not allowed except in form 'Air temp' but Air_temp is a better way
D. 2 Table Creation, Inserts, Deletes and Updates
D.2.1 How to create tables
Let's call the table to be created as 'thompson' which will have the following entries.
datetime air_temp RH
11/20/98 10:05 30 50
11/20/98 10:15 35 36
11/20/98 10:25 40 68
Since the values in the column datetime from the above table are unique in every
row, use the datetime as the primary key of this table. Assuming that database named
'rwis' was created before, the following SQL code will create the table 'thompson'
D-1

use rwis
go
create table thompson
(datetime datetime NOT NULL primary key clustered,
air_temp real,
rh tinyint)
go
'go' is used to execute multiple SQL instructions in the script file.
D.2.2 How to insert data to the created table 'thompson'
Use the following code.
Insert into thompson
Values ('11/29/98 10:00', 30.5, 40)
Note: datetime is alway enclosed by a pair of single quotation.
By the above code, datetime= '11/29/98 10 : 00 ', airtemp=30.5 and rh=40 are
inserted into the table. Again, 'go' instruction can be used in the script file in order to
execute multiple SQL instructions.
D.2.3 How to delete a row from a table
Use the following example for maintenance.
delete from thompson
where datetime = '11/29/98 10:00'
D-2
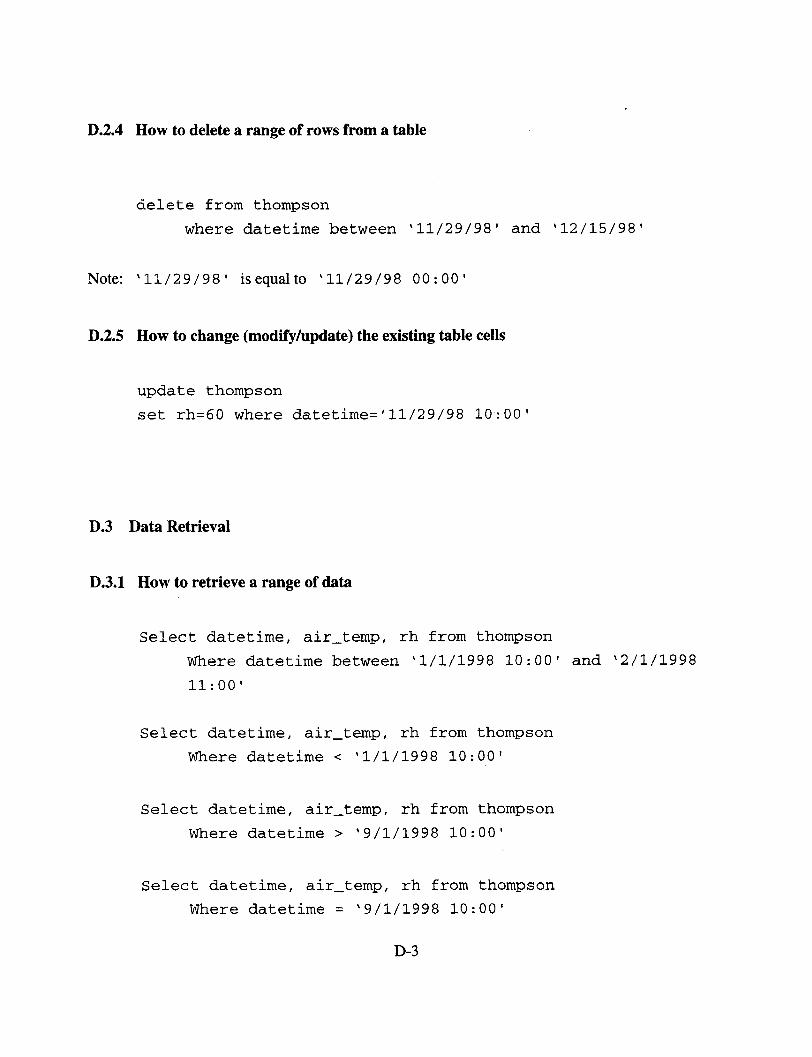
D.2.4 How to delete a range of rows from a table
delete from thompson
where datetime between '11/29/98' and '12/15/98'
Note: '11/29/98' isequalto '11/29/98 00:00'
D.2.5 How to change (modify/update) the existing table cells
update thompson
set rh=60 where datetime='11/29/98 10:00'
D.3 Data Retrieval
D.3.1 How to retrieve a range of data
Select datetime, air_temp, rh from thompson
Where datetime between '1/1/1998 10:00' and '2/1/1998
11:00'
Select datetime, air_temp, rh from thompson
Where datetime < '1/1/1998 10:00'
Select datetime, air_temp, rh from thompson
Where datetime > '9/1/1998 10:00'
Select datetime, air_temp, rh from thompson
Where datetime = '9/1/1998 10:00'
D-3

D.3.2 Retrieve the last 24 hours of data
Select datetime, air_temp, rh from thompson
Where datetime > dateadd (hour, -24,getdate())
Order by datetime desc
'Order by datetime desc' retrieves the latest data first, since the 'desc' key word sorts the
largest value first. You can also use 'order by 1' to sort the data by the first column (1
indicates the first column) in an ascending (default) order.
D.3.3 Retrieve the most recently inserted data
Method 1: use a variable by declaring
declare @last_time datetime
select @last_time=max(datetime) from thompson
select * from thompson where datetime=@last_time
Method 2: a single command approach
select datetime, air_temp, rh from thompson
where datetime=(select max(datetime) from thompson)
D.3.4 How to check the time of oldest data entry
select min(datetime) from thompson
D.3.5 Find the average pavement temprature between '2/1/98' and '3/2/98'
select 'avg pavetemp' =avg (pavetempl) from thompson
where datetime between '2/1/98' and '3/2'98'
D-4

The avg () can be replaced with other functions such as max (), min (), sum ( ,
count() .
D.4 Database Maintenance Instructions
D.4.1 Database check instructions
In order to check a database, use the following codes using the SQL query tool.
dbcc memusage
dbcc checkdb
dbcc newalloc
Provides detailed reports on memory use. It reports: 1) how the
server's memory was allocated at startup time. 2) how much
memory is used by the 20 largest objects in the buffer cache. 3)
how much memory is used by the 12 largest objects in the
procedure cache.
Checks the specified database to see that index and data pages are
correctly linked.
(rwis)
Checks the specified database to make sure that all pages are
correctly allocated and used. Details all table information.
dbcc checkcatalog(rwis)
Checks for consistency in and between system tables.
sp_helpdevice Reports information about SQL Server database devices and dump
devices.
sp_helpdb rwis Reports information about the specified database.
D-5
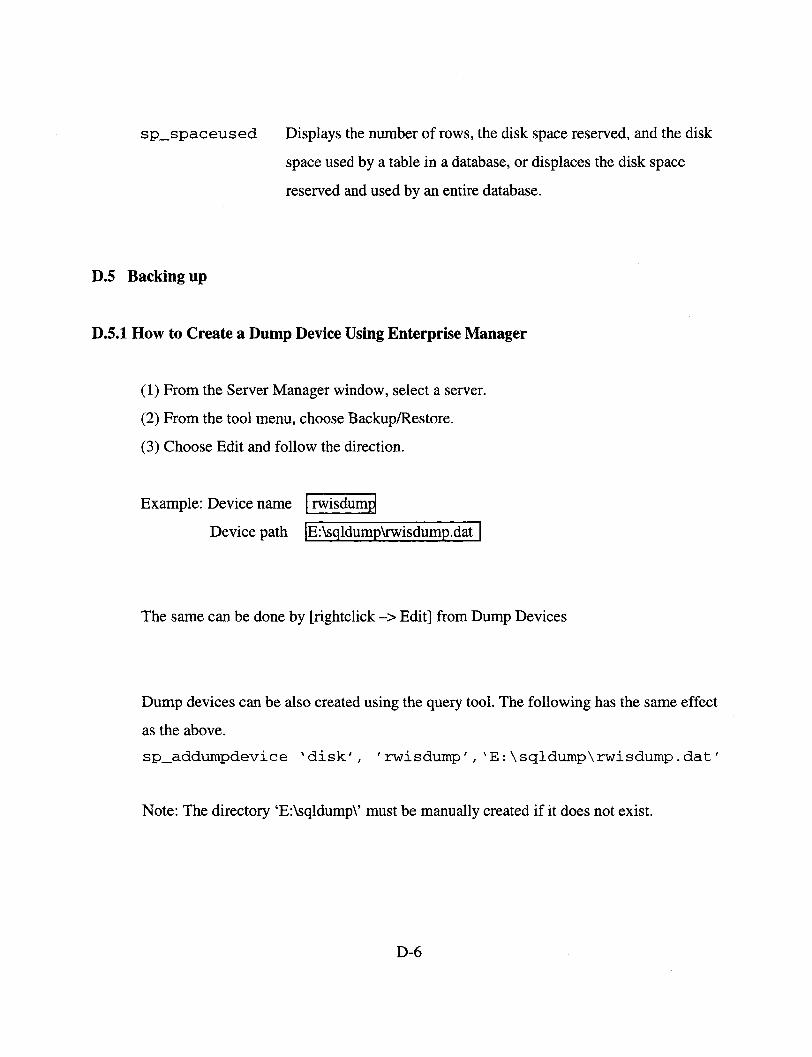
sp_spaceused Displays the number of rows, the disk space reserved, and the disk
space used by a table in a database, or displaces the disk space
reserved and used by an entire database.
D.5 Backing up
D.5.1 How to Create a Dump Device Using Enterprise Manager
(1) From the Server Manager window, select a server.
(2) From the tool menu, choose Backup/Restore.
(3) Choose Edit and follow the direction.
Example: Device name I rwisdump
Device path IE:\sqldump\rwisdump.dat
The same can be done by [rightclick -> Edit] from Dump Devices
Dump devices can be also created using the query tool. The following has the same effect
as the above.
sp_addumpdevice 'disk', ' rwisdump', 'E:\sqldump\rwisdump.dat'
Note: The directory 'E:\sqldump\' must be manually created if it does not exist.
D-6

D.5.2 Backup using Dump
The Backup/Restore tool is recommended when a scheduled backup is performed. If it is
an immediate backup, the query tool is simple. The following code works well.
dump database rwis to rwisdump
dump transaction rwis to rwisdump with noinit
For the Zip drive
sp_addumpdevice 'disk', 'masterdump' , 'F \masterdump.dat'
dump database master to masterdump
or
sp_addumpdevice 'disk', 'rwisdump', 'F: \rwisdump.dat'
dump database rwis to rwisdump
D.5.3 Backing up or transferring data using bcp from the NT command line
The bcp commands must be run at the NT command line.
D.5.3.1 If the bcp is used for backup, use the native format. It will copy back exactly the same
way using binary format. The key option character used is '/n' for this command.
bcp rwis..thompson out c:\sqlbcp\thompson_nat /n
D-7

When a password is asked, supply the password.
The file can be copied back by
bcp rwis..thompson in e:\sqlbcp\thompson_nat /n
One more useful bcp command options:
/Ffirstrow
/L lastrow
Row #12 3 4 5 67 89 10 11 12 13 14 15 19 17
I<--------------------------->1
I<----------------->1
/F 8
/L 10
; 8 to 17
; 1 to 10
Note: When copying data from a file into a table that has no indexes, be sure that the "Select
Into/Bulk Copy" has been set to true. Use sp_dboption to set the option:
Sp_dbopt ion Displays a list of the database options when no parameter is
given.
Sp_dboption rwis, 'select into', true
SQL server understands any unique string that is part of the option
name.
D-8

D.5.4 Use the Character format when it is going to be used as input data for other
applications or for long term storage.
D.5.4.1 The following example uses a character format with the comma as a field terminator and
the new line character (\n) as a row terminator.
bcp rwis..thompson out e:\sqlbcp\thompson_ch /c /t , /r \n
D.5.4.2 If you do not specify the /n or /c options, the bcp utility prompts you for more
information. Using this method, you can create a format file along with the output file.
bcp rwis..thompson out e:\sqpbcp\thompson.txt
Enter the file storage type of field datetime [datetime]: char
Enter prefix length of field datetime [0]:
Enter length of field datetime [6]:
Enter field terminator [none]: ,
Repeat entering 'char', and comma as the terminator. For the last field, use 'char' and
'\n'.
Enter the file storage type of field chemfact3 [integer]: char
Enter prefix length of field chemfact3 [0]:
Enter length of field chemfact3 [4]:
Enter field terminator [none]: \n
Do you want to save this format information in a file? [Y/N] y
Host filename: [bcp_fmt] thompson.fmt
D.5.4.3 Once the format file is constructed, it can be used over and over again. No need to go
D-9

through the above procedure. Use the following command.
bcp rwis. .thompson out e:\sqpbcp\thompson.txt /fe: \sqlbcp\thompson. fmt
D.5.4.4 Copying the data file back into SOL
If the file was stored by:
bcp rwis..thompson out e:\sqlbcp\thompson_ch /c /t , /r \n
then, it can be restored back by:
bcp rwis..thompson in e:\sqlbcp\thompson_ch /c /t , /r \n
If a format file exists due to 2.2, use the format file as:
bcp rwis . thompson in e:\sqpbcp\thompson. txt /fe: \sqlbcp\thompson. fmt
D.6 How to shrink the size of the tempdb
The database must be started as a single user. The following describes how to load the SQL
server as a single user:
1. From the service of NT control window, set the SQL and SQL exec to manual start.
2. From the NT command line, type in
Sqlservr/c /m
D-10

3. Right click on tempdb and choose Edit. Choose shrink and follow the direction.
Once it is loaded as a single user, the following query can be used to shrink the tempdb.
use tempdb
go
dbcc shrinkdb(tempdb)
go
.Displays the present size and information on how much it can be shrunken
dbcc shrinkdb(tempdb, 6144)
go
The representation of 6144: this number must be specified by units of 2k pages, i.e.
6144*2K=12 Mbytes, (6144/512)=12 Mbytes. Let's say, you wish to shrink 80Mbytes, then
80*512=40960 (2k pages) must be in the parenthesis. If you feel it is too complicated, just right
click on the tempdb and choose edit and follow the direction.
When a database is expanded by the edit tool (right click -> edit), the meaning of the number
should not be confused. It is easy to make a mistake.
Data Device Master I Size in MBI 30
The number 30 indicates the amount that you are adding to the selected database. It is not the
total amount of your hard disk allocated to the database.
D-11

D.6 Database backup and distribution strategy.
The following database management strategy was developed for realtime database applications
and may not be suitable for those databases that do not require realtime constraints. In this
strategy, two databases are always maintained on-line.
D.6.1 Short-term Realtime Database
This database holds data from present to 2 to 6 month old data. At the end of every
month data is moved to the long-term standby database. The role of this database is
providing a short term storage for the realtime data, such as realtime web pages and voice
services which require frequent and fast access of data. In a relational database, as the
number of rows is reduced as is the search time. Therefore, keeping a smaller size
database in memory increases the service time and efficiency. Since old data are not
frequently used, those should be moved to the long-term standby database. In order to
achieve this role, the following SQL scripts are needed.
i. A script for monthly data retrieval and copy of data to a standby database. It is
executed at the end of every month.
ii. A script for deleting the rows of old data.
iii. A weekly scheduled backup.
D-12

D.6.2. Long-term Standby Database
A standby long-term database is a long term database that is used for suppling data for
applications which require a large chunk of data, but do not require frequent queries. For
example, monthly graphing is only needed to be performed once a month. This database
collects data from the short-term realtime database and will keep data up to maximum
two years. Every year this data will be archived using an ASCII readable format as a
permanent record such as CD-R.
D.6.3. Permanent Retired Database
The permanent retired database is an off-line database which is stored in CD-Rs or Zip
disks. It serves as a Mn/DOT archive for the weather history. The data format should be
universally accessible ASCII format with the meaning of data supplied right in the same
disk. This will allow other applications to read the data without special decoding
procedures. A yearly data is saved from the long-term standby database. The backup for
this database is done through the bcp command of NT.
Yr2I Yr3
I
I IBcp Bcpto toCD CD
Mol Mo2 6
Copyto Copyto CopytorwisLT rwisLT rwisLT
Wkl Wk2 Wk3
Yr4
A recommendedBcp Jan. 1to evryyr backup plan isCD
summarized using a
diagram below.
First dayof cvrymonh
Every FridayDump rwisDump rwisLT
D-13
1 IYrI


Appendix E
Voice Server Programming


Appendix E: Voice Server Programming
As a starting point, the CallSuite Wizard can be used to create a main template, from
which codes can be added or modified. The examples given in this Appendix provide some
development helps as to how to write the code.
For all of the play routines the same general form is used. This is how the "Hello" Play Routine
looks like.
Public Sub Play_Hello(Vbocxl As Vbocx)
If Vbocx1.NrDigits = 0 Then
Call Vbockl.Play("C:\windows\desktop\SrProj\VOX\Hello.vox", VOXTYPE 24K, "")
End If
End Sub
The first line is the definition of the routine and its parameter. Vbockl is the default name
assigned to a VoiceBocx control by Visual Basic. The second line "if statement" checks to see if
there is a digit in the digit buffer. When the application is running in the real system, after a
touch tone is pressed, the current routine will quit playing and then next routine will start without
knowing an option has been selected. The if statement makes sure the next routine will not start
if there is a digit in the digit buffer. If there is no digit in the digit buffer, then it will do the next
line which actually plays the file. The first parameter to the command is the path to the sound
file. The next is the type of sound file because there is no way to tell if it is not defined. And the
last is the digits defined as stop tones. In this case there are no stop tones because it is the
welcome message and I wanted to give the file update program some time to update the file
before it was accessed. In almost every other play routine, the stop tones are defined as
"1234567890*#ABCD". This means that the pushing of any touch-tone key will result in the
stopping of the routine. The last line is just the end of the if.
The other types of routines used are the phrase routines. Here is the code for the "Air Temp"
E-1

Phrase Routine.
Public Sub PhraseAir Temp(Vbock As Vbock, Num 1 As Long, Strl As Sing, Num2 As Long)
Dim Phrase As String
Phrase = ""
Phrase = Phrase + "C:\windows\desktop\SrProj\Air_Temp.vox,0;"
Phrase = Phrase + "num=" = Str(Numl) + ";"
Phrase = Phrase + "str=" +Strl + ";"
Phrase = Phrase + "num=" +Str(Num2) + ";"
Phrase = Phrase + "C:\windows\desktop\SrProj\Degrees.vox,O;"
If Vbockl.NrDigits = 0 Then
Call Vbckl.PlayPhrase(Phrase, "1234567890*#ABCD")
End If
End Sub
The first line again defines the routine and its parameters. This time there are more parameters to
deal with. The first is the usual VBocxl. The next is Numl which will be passed to the routine
as the integer value of the temperature. Then is the Strl which will be passed as a ".", and last is
Num2 which is the decimal number. Now the next two lines of code declares Phrase to an empty
string. Each line afterward adds an element to the string until the if statement which works the
same as mentioned before. The next line takes the entire string and plays it through in the order
the elements were added on. For example when Numl = 12, Strl = ., and Num2=6 the final
Phrase will sound like this, "The air temperature was twelve point six degrees Fahrenheit." All
the Phrase routines are in the same basic form. These routines are in the CallSuiteRoutines
Module. Another small but very important module is the FileMod Module. The whole module
is shown as follows,
Option Explicit
Type LocationInfo
Location As String * 20
DateNow As String * 10
TimeNow As String * 6
E-2

AirTemp As String * 6
Precip As String * 6
WindSpeed As String * 6
PaveTemp As String * 6
End Type
This module is the definition of a variable type LocationInfo. This way we could get the
necessary information from the data fields just by stating which information from the location we
wanted to get. For example if there was a variable gLocation that was declared as a variable of
type LocationInfo, INFO=gLocation.AirTemp would set INFO to be the AirTemp for that
location.
The last main part of the code is the actual main program. This is where everything ties together,
in the actual main project form. Here is some of the code for the form.
Call Trace("OffHook")
Trace is a built in feature of VoiceBocx that simply writes text to the text window in the form of
the project. In this case it would put OffHook in the window and the time of the call.
gRecordLen = Len(gLocation)
gFileNum = FreeFile
Open "C:\windows\desktop\srproj\data.dat" For Random As gFileNum Len + gRecordLen
The first line sets gRecordLen to be the length of the variable field that was specified in FileMod
module. The next line sets gFileNum to be the number of the first available file that is not
presently open. And the last line opens the file if it exists and creates it if it doesn't exist as the
length of one gLocation field.
MainMenu:
Call Trace("Running Main Menu.")
E-3

Digit$ = Menu Main Menu(Vbocx 1)
Call Trace("Main Menu returns "& Digit$ & "")
Select Case Digit$
Case "1"
Call Menu 1
Case "2"
Call Menu 2
Case "3"
Call Menu 3
Case "4"
Call Menu 4
Case "5"
Call Menu 5
Case "6"
Call Menu 6
Case "*"
Call Menu Star
GoTo Hangup
Case Else
Call Menu Error
GoTo Hangup
End Select
This is the subroutine labeled menu. It starts of by getting the return digit of the users response
to the menu and puts it in the variable Digit$. Then the case statements check to see if the return
value was 1, 2, 3, 4, 5, 6, or *. Then calls the appropriate routine for each response. If Digit$ is
a star or is illegal it will run the proper routine then jump to the hang up subroutine.
Private Sub Menu 1()
Call Trace("Playback Menu Response 1.")
Get #gFileNum, 1, gLocation
Call Trace("Weather at SilverCliff")
Call Play_SilverCl(Vbocx1)
End Sub
E-4

This is one of the Menu routines; this one in specifically is for the pressing of the number one.
All this does is Trace a couple of things, set gLocation to be first field of length of gLocation in
the open file, and it plays "At Silver Cliff." After the main menu is run, it plays the information
of the selected location defined in the menu routines. In this case Menu 1 sets gLocation to be
the first field, in other words information for Silver Cliff. Then it plays date and time, air
temperature, pavement temperature, wind speed, and whether or not there is precipitation in that
order.
Call Trace("Playing air Temperature")
If (IsNumeric(Trim(gLocation,AirTemp))) Then
Call Split Num(Val(Trim(gLocation.AirTemp)),Airl,Air2)
Call PhraseAirTemp(Vbocxl,Airl, ".", Air2)
Else
Call PlayInvalid_Air(Vbocxl)
End If
This is the portion that plays the air temperature. After the Trace it checks to make sure if the air
temperature data is a valid number. If it is not, it play the invalid air temperature sound file. If it
is valid data, it takes the floating point number and breaks it into the integer value and the
decimal value. If the air temperature was -25.9, Airl would become -25, and Air2 would become
9. Then it calls for the phrase to be played as explained earlier. The other information that
follows, like pavement temperature etc., is played in a similar manner.
Private sub Split_Num(Num As Double, DigNum As Long, DecNum As Long)
Dim Neg As Integer
Neg = 0
If (Num < 0) Then
Neg = 1
Num = 0-Num
End If
DigNum = Format (Num, "000")
DecNum = (Num - DigNum) * 10
E-5
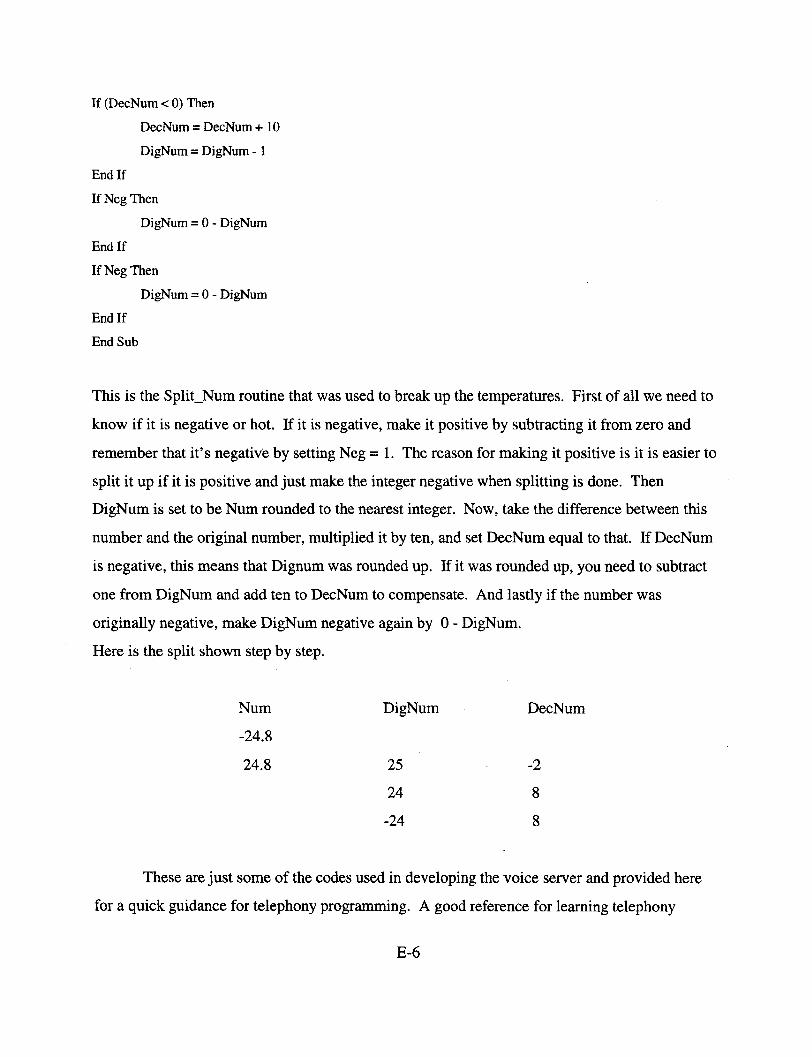
If (DecNum < 0) Then
DecNum = DecNum + 10
DigNum = DigNum - 1
End If
If Neg Then
DigNum = 0 - DigNum
End If
If Neg Then
DigNum = 0 - DigNum
End If
End Sub
This is the Split_Num routine that was used to break up the temperatures. First of all we need to
know if it is negative or hot. If it is negative, make it positive by subtracting it from zero and
remember that it's negative by setting Neg = 1. The reason for making it positive is it is easier to
split it up if it is positive and just make the integer negative when splitting is done. Then
DigNum is set to be Num rounded to the nearest integer. Now, take the difference between this
number and the original number, multiplied it by ten, and set DecNum equal to that. If DecNum
is negative, this means that Dignum was rounded up. If it was rounded up, you need to subtract
one from DigNum and add ten to DecNum to compensate. And lastly if the number was
originally negative, make DigNum negative again by 0 - DigNum.
Here is the split shown step by step.
Num DigNum DecNum
-24.8
24.8 25 -2
24 8
-24 8
These are just some of the codes used in developing the voice server and provided here
for a quick guidance for telephony programming. A good reference for learning telephony
E-6

programming can be found from the book by Bob Edgar, " PC Telephony: The Complete Guide
to Desinging Building and Programming Systems Using Dialogic and Related Hardware," 4t
edition [6].
E-7


Appendix FNext-Generation R/WIS Questionnaire


Appendix F: Next-Generation R/WIS Questionnaire
Web Page
1. How easy is navigating throughout the R/WIS site?
2. Is the site map easy to read? Is there anything that could be changed about the site map?
3. Where would you intend to use the live video stream in conjunction with the R/WISinformation?
Automated Voice R/WIS Answering System
1. Were you satisfied with the voice and dialog of the voice-information system? If not, whatwould you like to see improved.
2. Did you feel the system was easy to use?
3. Is the present information adequate? If not, what would you like to add or remove?
4. Would it be better to include menus for each location to hear only the desired information?
Any Suggestions or Application Ideas?
F-1