Embed Size (px)
Citation preview
NEWTON COUNTY, INDIANA AND INCORPORATED AREAS COMMUNITY COMMUNITY NAME NUMBER BROOK, TOWN OF 180180 GOODLAND, TOWN OF* 180181 KENTLAND, TOWN OF 180182 NEWTON COUNTY (unincorporated areas) 180179 MOROCCO, TOWN OF* 180551 MOUNT AYR, TOWN OF* 180552 *No Special Flood Hazard Areas Identified
PRELIMINARY:
Federal Emergency Management Agency FLOOD INSURANCE STUDY NUMBER 18111CV000A

NOTICE TO FLOOD INSURANCE STUDY USERS
Communities participating in the National Flood Insurance Program have established repositories of flood hazard data for floodplain management and flood insurance purposes. This Flood Insurance Study (FIS) report may not contain all data available within the Community Map Repository. Please contact the Community Map Repository for any additional data. The Federal Emergency Management Agency (FEMA) may revise and republish part or all of this FIS report at any time. In addition, FEMA may revise part of this FIS report by the Letter of Map Revision process, which does not involve republication or redistribution of the FIS report. Therefore, users should consult with community officials and check the Community Map Repository to obtain the most current FIS report components. Selected Flood Insurance Rate Map panels for this community contain information that was previously shown separately on the corresponding Flood Boundary and Floodway Map panels (e.g., floodways, cross sections). In addition, former flood hazard zone designations have been changed as follows: Old Zone: New Zone: A1 through A30 AE B X C X Initial Countywide FIS Effective Date:
i
TABLE OF CONTENTS
Page 1.0 INTRODUCTION 1
1.1 Purpose of Study 1 1.2 Authority and Acknowledgments 1 1.3 Coordination 2
2.0 AREA STUDIED 3
2.1 Scope of Study 3 2.2 Community Description 4 2.3 Principal Flood Problems 5 2.4 Flood Protection Measures 6
3.0 ENGINEERING METHODS 6
3.1 Hydrologic Analysis 6 3.2 Hydraulic Analysis 7 3.3 Vertical Datum 8
4.0 FLOODPLAIN MANAGEMENT APPLICATIONS 9
4.1 Floodplain Boundaries 9 4.2 Floodways 10
5.0 INSURANCE APPLICATIONS 12 6.0 FLOOD INSURANCE RATE MAP 13 7.0 OTHER STUDIES 13 8.0 LOCATION OF DATA 13 9.0 BIBLIORAPHY AND REFERENCES 15
FIGURES
Figure 1: Floodway Schematic 11
ii
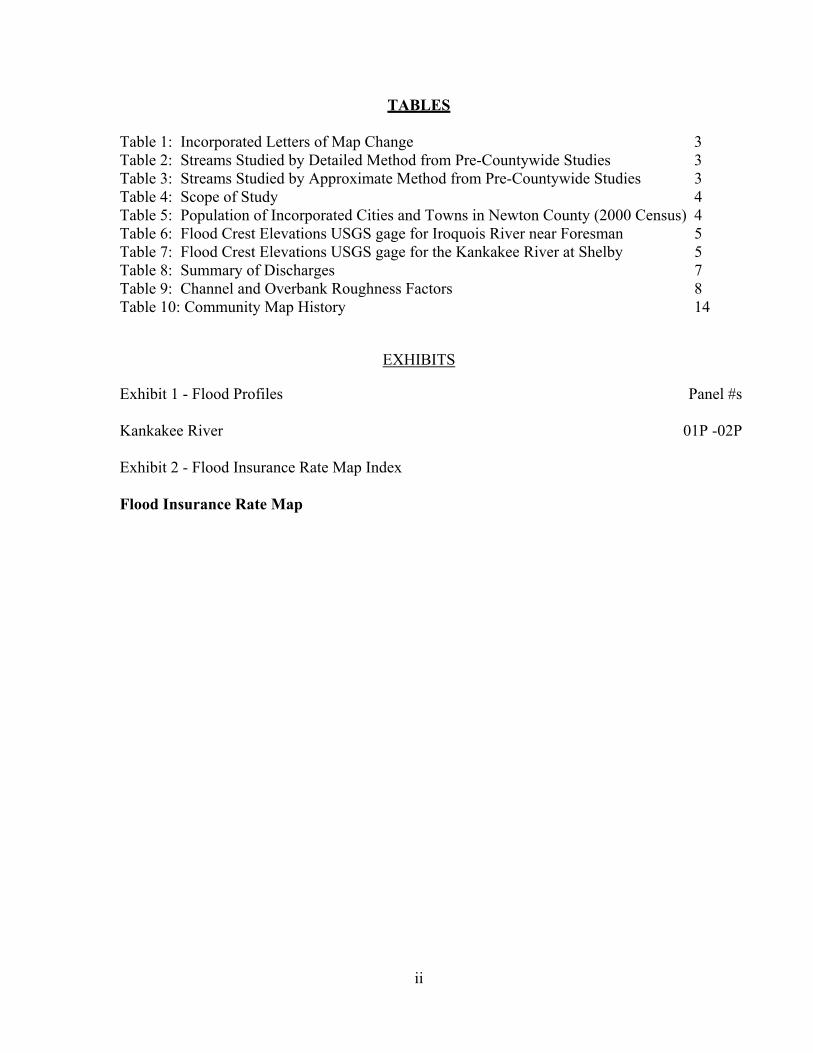
TABLES Table 1: Incorporated Letters of Map Change 3 Table 2: Streams Studied by Detailed Method from Pre-Countywide Studies 3 Table 3: Streams Studied by Approximate Method from Pre-Countywide Studies 3 Table 4: Scope of Study 4 Table 5: Population of Incorporated Cities and Towns in Newton County (2000 Census) 4 Table 6: Flood Crest Elevations USGS gage for Iroquois River near Foresman 5 Table 7: Flood Crest Elevations USGS gage for the Kankakee River at Shelby 5 Table 8: Summary of Discharges 7 Table 9: Channel and Overbank Roughness Factors 8 Table 10: Community Map History 14
EXHIBITS
Exhibit 1 - Flood Profiles Panel #s Kankakee River 01P -02P Exhibit 2 - Flood Insurance Rate Map Index Flood Insurance Rate Map
1
FLOOD INSURANCE STUDY NEWTON COUNTY, INDIANA AND INCORPORATED AREAS
1.0 INTRODUCTION
1.1 Purpose of Study
This Flood Insurance Study (FIS) revises and supersedes the FIS reports and Flood Insurance Rate Maps (FIRMs) in the geographic area of Newton County, Indiana, including the Towns of Brook, Goodland, Kentland, Morocco, and Mount Ayr, and the unincorporated areas of Newton County (hereinafter referred to collectively as Newton County), and aids in the administration of the National Flood Insurance Act of 1968 and the Flood Disaster Protection Act of 1973. This study has developed flood risk data for various areas of the community that will be used to establish actuarial flood insurance rates and to assist the community in its efforts to promote sound floodplain management. This information will also be used by Newton County to update existing floodplain regulations as part of the Regular Phase of the National Flood Insurance Program (NFIP), and by local and regional planners to further promote sound land use and floodplain development. Minimum floodplain management requirements for participation in the National Flood Insurance Program (NFIP) are set forth in the Code of Federal Regulations at 44 CFR, 60.3.
In some states or communities, floodplain management criteria or regulations may exist that are more restrictive or comprehensive than the minimum Federal requirements. In such cases, the more restrictive criteria take precedence and the State (or other jurisdictional agency) will be able to explain them.
The Digital Flood Insurance Rate Map (DFIRM) and FIS report for this countywide study have been produced in digital format. Flood hazard information was converted to meet the Federal Emergency Management Agency (FEMA) DFIRM database specifications and Geographic Information System (GIS) format requirements. The flood hazard information was created and is provided in a digital format so that it can be incorporated into local GIS and be accessed more easily by the community. No Special Flood Hazard Areas have been identified in the Town of Goodland, Town of Morocco, and Town of Mount Ayr.
1.2 Authority and Acknowledgments
The sources of authority for this Flood Insurance Study are the National Flood Insurance Act of 1968 and the Flood Disaster Protection Act of 1973.
2
Information of the authority and acknowledgements for each of the new studies and previously printed FIS reports and Flood Insurance Rate Maps (FIRMs) for communities within Newton County was compiled and is shown below: New Studies: The hydrologic and hydraulic analyses for approximate
stream reaches of Newton County were performed by Lawson-Fisher Associates, on behalf of the Indiana Department of Natural Resources, under Indiana Public Works Project Number E060022. The Indiana Department of Natural Resources managed the production of this study as part of their Cooperating Technical Partner agreement with the Federal Emergency Management Agency dated April 29, 2004, which was defined by the Indiana DNR Mapping Activity Statement 08-01 dated June 23, 2005 and funded under agreement number EMC-2005-GR-7022.
Hydrologic and hydraulic analyses for the Kankakee River was performed by the U.S. Department of Agriculture, Soil Conservation Service, for the Federal Insurance Administration, under Inter-Agency Agreement No. H-18_75, Project Order No. 4, and Inter-Agency Agreement No. H-8-77, Project Order No. 3. This study was completed in July 1978 for the Lake County Unincorporated Areas FIS. Digitization of effective detailed study area for the Kankakee River was performed by Stantec Consulting Services Inc. for FEMA Region V under Contract No. EMC-2001-CO-2018, Task Order No. EMC-2001-TO-06 for the Lake County Countywide FIS. Redelineation of the previously effective flood hazard information for this FIS report, correction to the North American Vertical Datum of 1988, and conversion of the unincorporated and incorporated areas of Newton County into the Countywide format was performed by Lawson-Fisher Associates, on behalf of the Indiana Department of Natural Resources, under Indiana Public Works Project Number E060022. The Indiana Department of Natural Resources managed the production of this study as part of their Cooperating Technical Partner agreement with the Federal Emergency Management Agency dated April 29, 2004, which was defined by the Indiana DNR Mapping Activity Statement 08-01 dated June 23, 2005 and funded under agreement number EMC-2005-GR-7022.
1.3 Coordination The purpose of an initial Consultation Coordinated Officer’s (CCOs) meeting is to discuss the scope of the FIS. A final CCO meeting is held to review the results of the study.
3
The coordinate system used for the production of the digital FIRMs is the Transverse Mercator projection, Indiana State Plane coordinate system, East Zone, referenced to the North American Datum of 1983 and the GRS 1980 spheroid
For this countywide FIS, an initial CCO meeting was held on November 27, 2007, and was attended by FEMA, NRCS, IDNR, the Newton County Building Commission, the Newton County Surveyor, and other representatives of Newton County. The results of the countywide study were reviewed at the final CCO meeting held on --, and attended by representatives of FEMA, IDNR and representatives from Newton County. All problems raised at that meeting have been addressed.
2.0 AREA STUDIED
2.1 Scope of Study This FIS covers the geographic area of Newton County, Indiana, including the incorporated communities listed in Section 1.1 All FIRM panels for Newton County have been revised, updated, and republished in countywide format as a part of this FIS. The FIRM panel index, provided as Exhibit 2, illustrates the revised FIRM panel layout. Approximate methods of analysis were used to study those areas having a low development potential or minimal flood hazards as identified during the initial CCO meeting. For this study, three new stream reaches were studied using approximate methods. The scope and methods of new Zone A studies were proposed and agreed upon by FEMA, the IDNR, and Newton County. This FIS update also incorporates the determination of letters issued by FEMA resulting in map changes (Letters of Map Change, or LOMCs). All Letters of Map Revision (LOMRs) are summarized in Table 1.
Table 1: Incorporated Letters of Map Change
Flooding Source Community and Project Id Date Issued Type None None None None
Table 2: Streams Studied by Detailed Method from Pre-Countywide Studies
Kankakee River
Table 3: Streams Studied by Approximate Method from Pre-Countywide Studies
Iroquois River Kent Ditch Montgomery Ditch
4
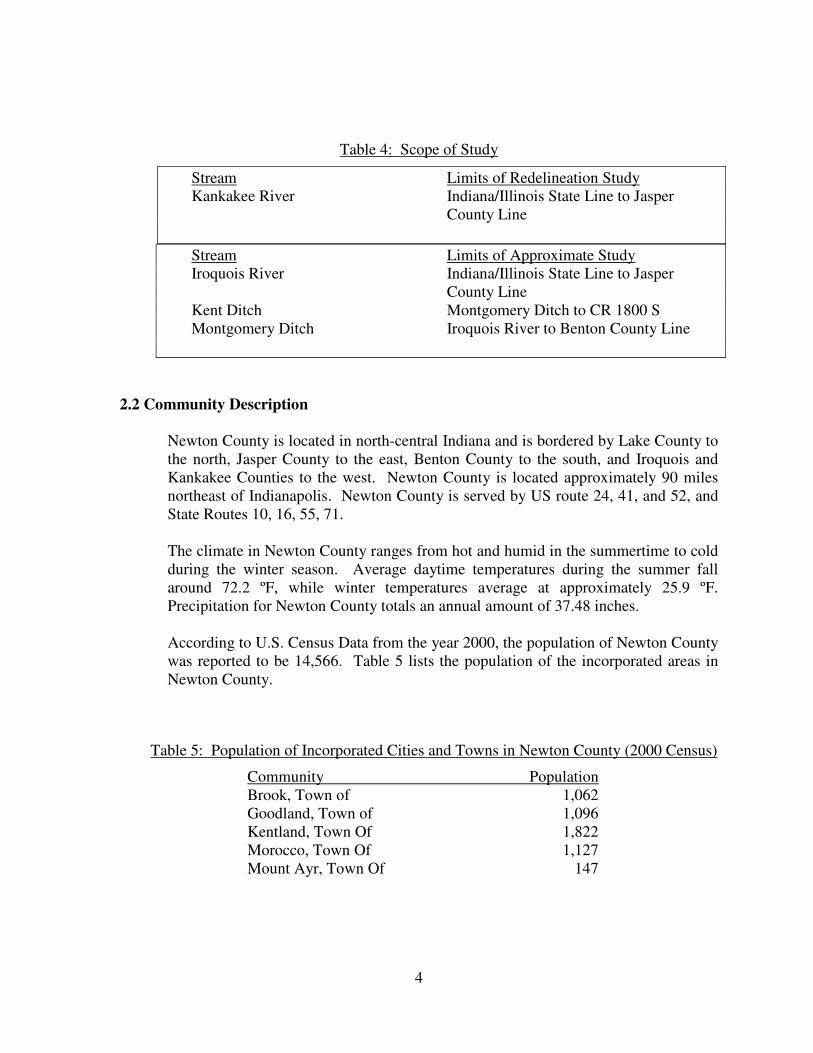
Table 4: Scope of Study
Stream Limits of Redelineation Study
Kankakee River Indiana/Illinois State Line to Jasper
County Line
Stream Limits of Approximate Study
Iroquois River Indiana/Illinois State Line to Jasper
County Line
Kent Ditch Montgomery Ditch to CR 1800 S
Montgomery Ditch Iroquois River to Benton County Line
2.2 Community Description
Newton County is located in north-central Indiana and is bordered by Lake County to
the north, Jasper County to the east, Benton County to the south, and Iroquois and
Kankakee Counties to the west. Newton County is located approximately 90 miles
northeast of Indianapolis. Newton County is served by US route 24, 41, and 52, and
State Routes 10, 16, 55, 71.
The climate in Newton County ranges from hot and humid in the summertime to cold
during the winter season. Average daytime temperatures during the summer fall
around 72.2 ºF, while winter temperatures average at approximately 25.9 ºF.
Precipitation for Newton County totals an annual amount of 37.48 inches.
According to U.S. Census Data from the year 2000, the population of Newton County
was reported to be 14,566. Table 5 lists the population of the incorporated areas in
Newton County.
Table 5: Population of Incorporated Cities and Towns in Newton County (2000 Census)
Community Population
Brook, Town of 1,062
Goodland, Town of 1,096
Kentland, Town Of 1,822
Morocco, Town Of 1,127
Mount Ayr, Town Of 147
5
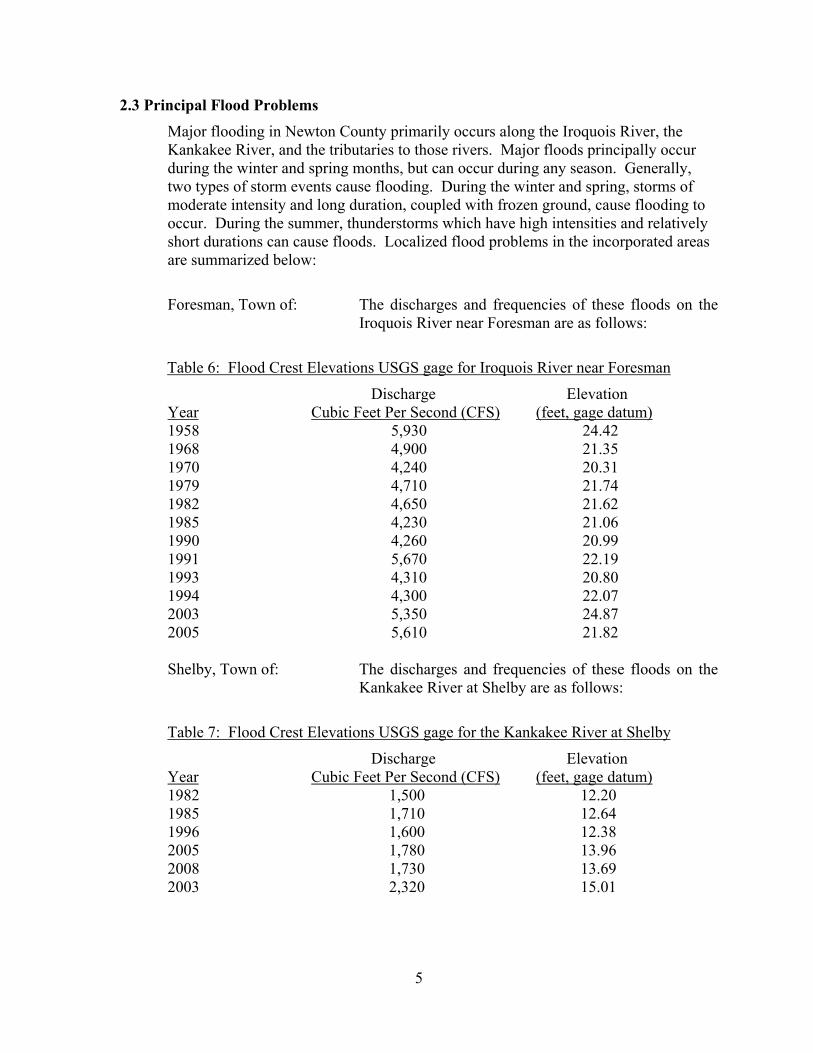
2.3 Principal Flood Problems Major flooding in Newton County primarily occurs along the Iroquois River, the
Kankakee River, and the tributaries to those rivers. Major floods principally occur during the winter and spring months, but can occur during any season. Generally, two types of storm events cause flooding. During the winter and spring, storms of moderate intensity and long duration, coupled with frozen ground, cause flooding to occur. During the summer, thunderstorms which have high intensities and relatively short durations can cause floods. Localized flood problems in the incorporated areas are summarized below:
Foresman, Town of: The discharges and frequencies of these floods on the
Iroquois River near Foresman are as follows:
Table 6: Flood Crest Elevations USGS gage for Iroquois River near Foresman
Discharge Elevation Year Cubic Feet Per Second (CFS) (feet, gage datum) 1958 5,930 24.42 1968 4,900 21.35 1970 4,240 20.31 1979 4,710 21.74 1982 4,650 21.62 1985 4,230 21.06 1990 4,260 20.99 1991 5,670 22.19 1993 4,310 20.80 1994 4,300 22.07 2003 5,350 24.87 2005 5,610 21.82 Shelby, Town of: The discharges and frequencies of these floods on the
Kankakee River at Shelby are as follows:
Table 7: Flood Crest Elevations USGS gage for the Kankakee River at Shelby
Discharge Elevation Year Cubic Feet Per Second (CFS) (feet, gage datum) 1982 1,500 12.20 1985 1,710 12.64 1996 1,600 12.38 2005 1,780 13.96 2008 1,730 13.69 2003 2,320 15.01
6
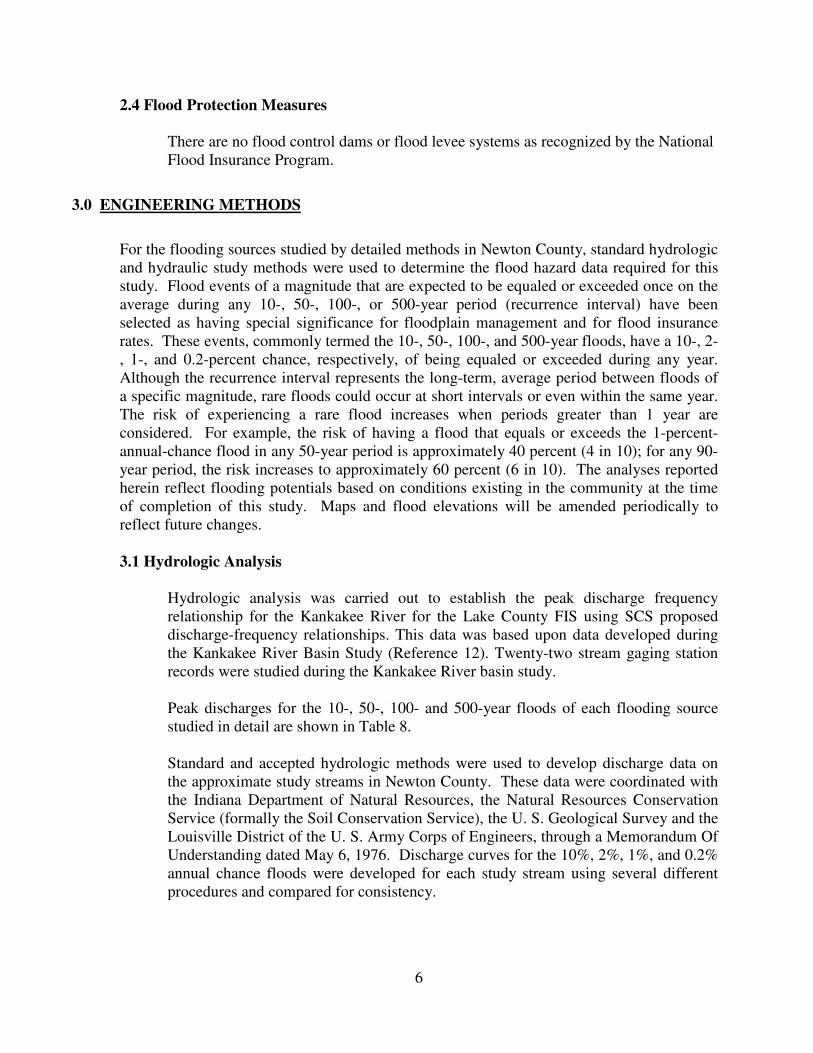
2.4 Flood Protection Measures
There are no flood control dams or flood levee systems as recognized by the National
Flood Insurance Program.
3.0 ENGINEERING METHODS
For the flooding sources studied by detailed methods in Newton County, standard hydrologic
and hydraulic study methods were used to determine the flood hazard data required for this
study. Flood events of a magnitude that are expected to be equaled or exceeded once on the
average during any 10-, 50-, 100-, or 500-year period (recurrence interval) have been
selected as having special significance for floodplain management and for flood insurance
rates. These events, commonly termed the 10-, 50-, 100-, and 500-year floods, have a 10-, 2-
, 1-, and 0.2-percent chance, respectively, of being equaled or exceeded during any year.
Although the recurrence interval represents the long-term, average period between floods of
a specific magnitude, rare floods could occur at short intervals or even within the same year.
The risk of experiencing a rare flood increases when periods greater than 1 year are
considered. For example, the risk of having a flood that equals or exceeds the 1-percent-
annual-chance flood in any 50-year period is approximately 40 percent (4 in 10); for any 90-
year period, the risk increases to approximately 60 percent (6 in 10). The analyses reported
herein reflect flooding potentials based on conditions existing in the community at the time
of completion of this study. Maps and flood elevations will be amended periodically to
reflect future changes.
3.1 Hydrologic Analysis
Hydrologic analysis was carried out to establish the peak discharge frequency
relationship for the Kankakee River for the Lake County FIS using SCS proposed
discharge-frequency relationships. This data was based upon data developed during
the Kankakee River Basin Study (Reference 12). Twenty-two stream gaging station
records were studied during the Kankakee River basin study.
Peak discharges for the 10-, 50-, 100- and 500-year floods of each flooding source
studied in detail are shown in Table 8.
Standard and accepted hydrologic methods were used to develop discharge data on
the approximate study streams in Newton County. These data were coordinated with
the Indiana Department of Natural Resources, the Natural Resources Conservation
Service (formally the Soil Conservation Service), the U. S. Geological Survey and the
Louisville District of the U. S. Army Corps of Engineers, through a Memorandum Of
Understanding dated May 6, 1976. Discharge curves for the 10%, 2%, 1%, and 0.2%
annual chance floods were developed for each study stream using several different
procedures and compared for consistency.

7
Table 8: Summary of Discharges
Peak Discharge (cfs) 10% 2% 1% 0.2% Flooding Source Drainage Area Annual Annual Annual AnnualAnd Location (Square Miles) Chance Chance Chance Chance KANKAKEE RIVER State Route 55 1,778 5,550 6,700 7,150 8,350 Above Beaver Lake Ditch (two miles downstream of Schneider) 1,846 5,700 6,900 7,380 8,400 State Boundary 1,920 5,850 7,100 7,580 8,850
3.2 Hydraulic Analysis
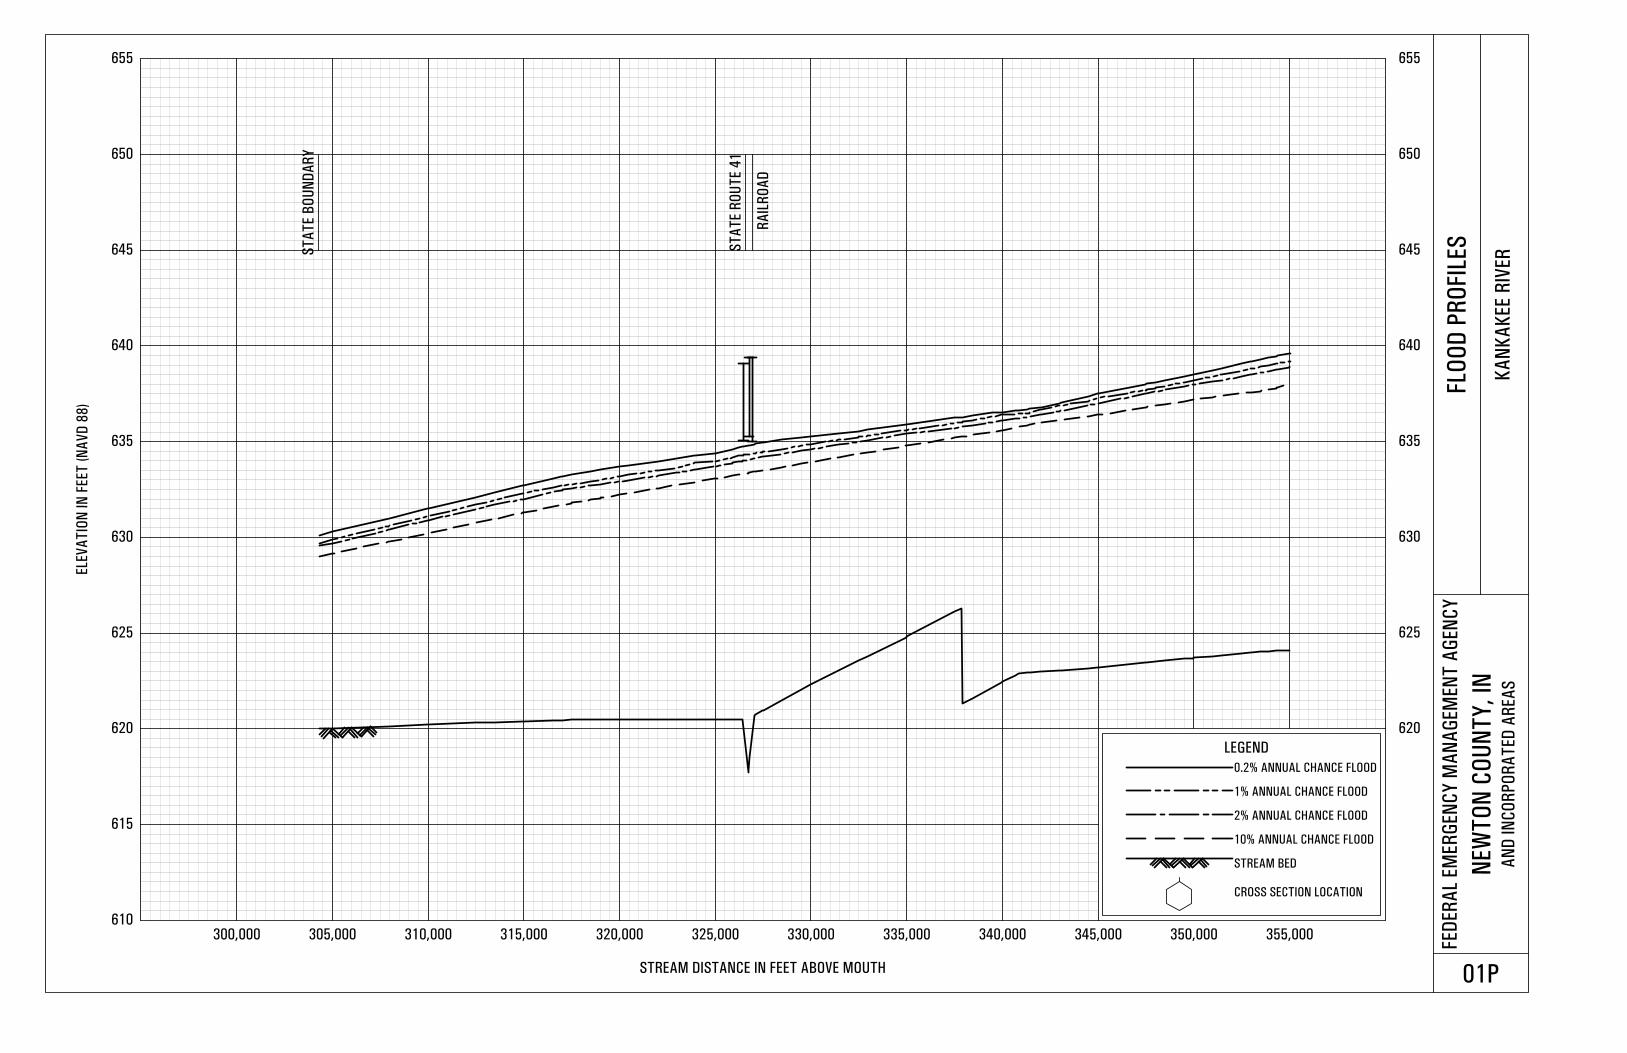
Analyses of the hydraulic characteristics of flooding from the sources studied were carried out to provide estimates of the elevations of floods of the selected recurrence intervals. Users should be aware that flood elevations shown on the Flood Insurance Rate Map (FIRM) represent rounded whole-foot elevations and may not exactly reflect the elevations shown on the Flood Profiles or in the Floodway Data table in the FIS report. Flood elevations shown on the FIRM are primarily intended for flood insurance rating purposes. For construction and/or floodplain management purposes, users are cautioned to us the flood elevation data presented in this FIS report in conjunction with the data shown on the FIRM. Cross sections for the hydraulic analysis of the Kankakee River were obtained from aerial photographes flown in May 1975 and March 1977 (References 13 and 14). Starting water-surface elevations for the Kankakee River were taken from the Kankakee River basin study (Reference 12) Cross sections for the backwater analyses were obtained from a variety of sources including: physical survey data, IDNR contour mapping, USGS topographic mapping and local contour mapping. Water-surface elevations for floods of the selected recurrence intervals were computed through use of the USACE HEC-2 step-backwater computer program. For the new Zone A study reaches, the USACE HEC-RAS program was used. HEC-RAS is an updated version of the HEC-2 program used to perform step-backwater analyses. For a countywide FIS, any flood profiles and approved LOMRs have been consolidated into continuous stream reaches and adjusted to reflect the current vertical datum as described in Section 3.3.
8
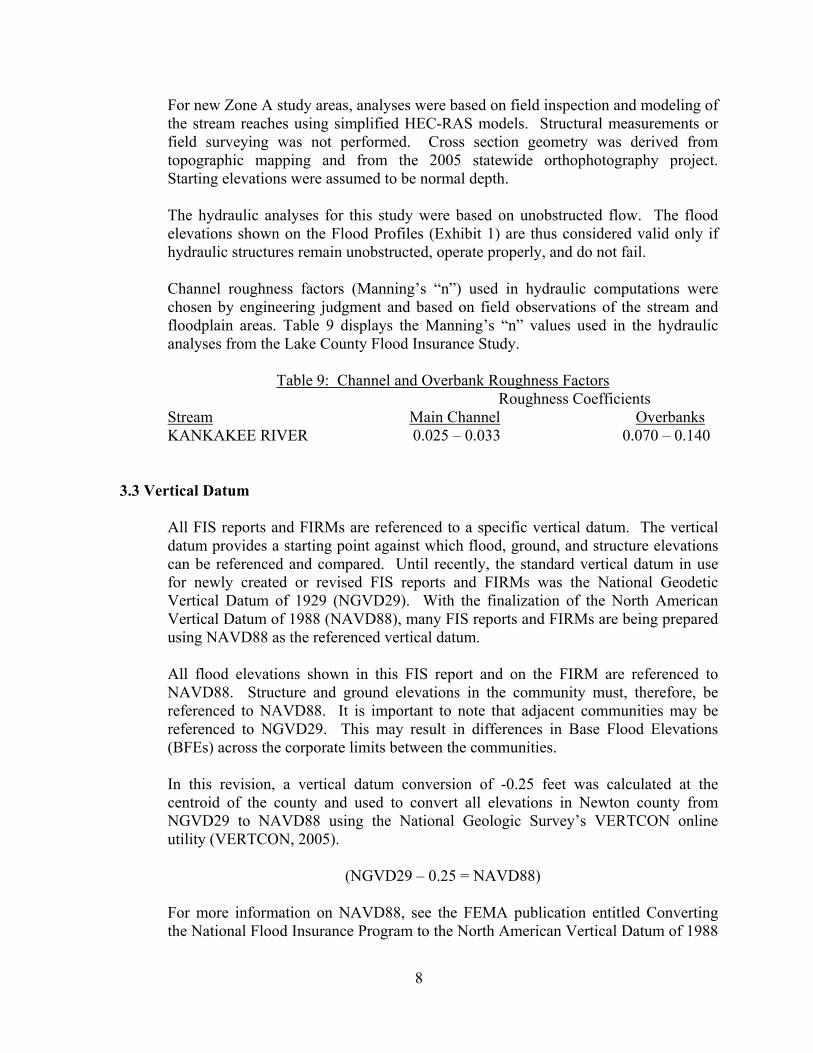
For new Zone A study areas, analyses were based on field inspection and modeling of the stream reaches using simplified HEC-RAS models. Structural measurements or field surveying was not performed. Cross section geometry was derived from topographic mapping and from the 2005 statewide orthophotography project. Starting elevations were assumed to be normal depth. The hydraulic analyses for this study were based on unobstructed flow. The flood elevations shown on the Flood Profiles (Exhibit 1) are thus considered valid only if hydraulic structures remain unobstructed, operate properly, and do not fail. Channel roughness factors (Manning’s “n”) used in hydraulic computations were chosen by engineering judgment and based on field observations of the stream and floodplain areas. Table 9 displays the Manning’s “n” values used in the hydraulic analyses from the Lake County Flood Insurance Study.
Table 9: Channel and Overbank Roughness Factors Roughness Coefficients Stream Main Channel Overbanks KANKAKEE RIVER 0.025 – 0.033 0.070 – 0.140
3.3 Vertical Datum All FIS reports and FIRMs are referenced to a specific vertical datum. The vertical datum provides a starting point against which flood, ground, and structure elevations can be referenced and compared. Until recently, the standard vertical datum in use for newly created or revised FIS reports and FIRMs was the National Geodetic Vertical Datum of 1929 (NGVD29). With the finalization of the North American Vertical Datum of 1988 (NAVD88), many FIS reports and FIRMs are being prepared using NAVD88 as the referenced vertical datum. All flood elevations shown in this FIS report and on the FIRM are referenced to NAVD88. Structure and ground elevations in the community must, therefore, be referenced to NAVD88. It is important to note that adjacent communities may be referenced to NGVD29. This may result in differences in Base Flood Elevations (BFEs) across the corporate limits between the communities. In this revision, a vertical datum conversion of -0.25 feet was calculated at the centroid of the county and used to convert all elevations in Newton county from NGVD29 to NAVD88 using the National Geologic Survey’s VERTCON online utility (VERTCON, 2005).
(NGVD29 – 0.25 = NAVD88) For more information on NAVD88, see the FEMA publication entitled Converting the National Flood Insurance Program to the North American Vertical Datum of 1988
9
(FEMA, June 1992), or contact the Vertical Network Branch, National Geodetic Survey, Coast and Geodetic Survey, National Oceanic and Atmospheric Administration, Rockville, Maryland 20910 (Internet address http://www.ngs.noaa.gov). Temporary vertical monuments are often established during the preparation of a flood hazard analysis for the purpose of establishing local vertical control. Although these monuments are not shown on the FIRM, they may be found in the Technical Support Data Notebook associated with the FIS report and FIRM for this community. Interested individuals may contact FEMA to access these data.
4.0 FLOODPLAIN MANAGEMENT APPLICATIONS The NFIP encourages State and local governments to adopt sound floodplain
management programs. Therefore, each FIS provides 1-percent-annual-chance flood elevations and delineations of the 1- and 0.2-percent-annual-chance floodplain boundaries and 1-percent-annual-chance floodway to assist communities in developing floodplain management measures. This information is presented on the FIRM and in many components of the FIS report, including Flood Profiles, and the Floodway Data table. Users should reference the data presented in the FIS report as well as additional information that may be available at the local map repository before making flood elevation and/or floodplain boundary determinations.
4.1 Floodplain Boundaries
To provide a national standard without regional discrimination, the 1-percent-annual-chance flood has been adopted by FEMA as the base flood for floodplain management purposes. The 0.2-percent-annual-chance flood is employed to indicate additional areas of flood risk in the community. For each stream studied by detailed methods, the 1- and 0.2-percent-annual-chance floodplain boundaries have been delineated using the flood elevations determined at each cross section. Between cross sections, the boundaries were interpolated using topographic mapping. The 1- and 0.2-percent-annual-chance floodplain boundaries are shown on the FIRM (Exhibit 2). On this map, the 1-percent-annual-chance floodplain boundary corresponds to the boundary of the areas of special flood hazards (Zones A and AE); and the 0.2-percent-annual-chance floodplain boundary corresponds to the boundary of areas of moderate flood hazards. In cases where the 1- and 0.2-percent-annual-chance floodplain boundaries are close together, only the 1-percent-annual-chance floodplain boundary has been shown. Small areas within the floodplain boundaries may lie above the flood elevations but cannot be shown due to limitations of the map scale and/or lack of detailed topographic data. For the streams studied by approximate methods, only the 1-percent-annual chance floodplain boundary is shown on the FIRM (Exhibit 2).
10
4.2 Floodways
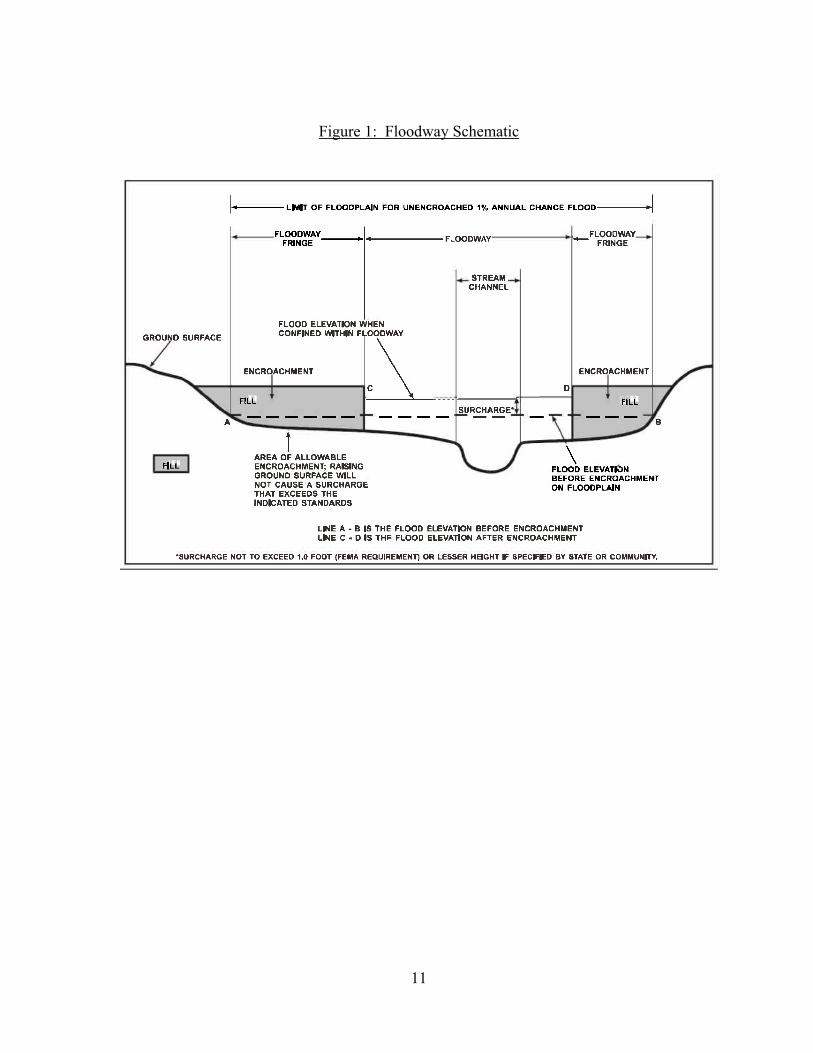
Encroachment on floodplains, such as structures and fill, reduces flood-carrying capacity, increases flood heights and velocities, and increases flood hazards in areas beyond the encroachment itself. One aspect of floodplain management involves balancing the economic gain from floodplain development against the resulting increase in flood hazard. For purposes of the NFIP, a floodway is used as a tool to assist local communities in this aspect of floodplain management. Under this concept, the area of the 1-percent-annual-chance floodplain is divided into a floodway and a floodway fringe. The floodway is the channel of a stream, plus any adjacent floodplain areas, that must be kept free of encroachment so that the 1-percent-annual-chance flood can be carried without substantial increases in flood heights. Minimum Federal standards limit such increases to 1.0 foot, provided that hazardous velocities are not produced. The floodways in this study are presented to local agencies as minimum standards that can be adopted directly or that can be used as a basis for additional floodway studies. The State of Indiana, however, per Indiana Code IC 14-28-1 and Indiana Administrative Code 312 IAC 10, has designated that encroachment in the floodplain is limited to that which will cause no significant increase in flood height. As a result, floodways for this study are delineated based on a flood surcharge of less than 0.15 feet. The floodways in this study were approved by the IDNR, and are presented to local agencies as minimum standards that can be adopted directly or that can be used as a basis for additional floodway studies. The floodway presented in this FIS report and on the FIRM was computed for certain stream segments on the basis of equal conveyance reduction from each side of the floodplain. Floodway widths were computed at cross sections. Between cross sections, the floodway boundaries were interpolated. The area between the floodway and 1-percent-annual-chance floodplain boundaries is termed the floodway fringe. The floodway fringe encompasses the portion of the floodplain that could be completely obstructed without increasing the water-surface elevation of the 1-percent-annual-chance flood more than 1.0 foot at any point. Typical relationships between the floodway and the floodway fringe and their significance to floodplain development are shown in Figure 1: Floodway Schematic.
11
Figure 1: Floodway Schematic
12
5.0 INSURANCE APPLICATIONS For flood insurance rating purposes, flood insurance zone designations are assigned to a community based on the results of the engineering analyses. These zones are as follows: Zone A Zone A is the flood insurance risk zone that corresponds to the 1-percent-annual-chance floodplains that are determined in the FIS by approximate methods. Because detailed hydraulic analyses are not performed for such areas, no BFEs or base flood depths are shown within this zone. Zone AE Zone AE is the flood insurance risk zone that corresponds to the 1-percent-annual-chance floodplains that are determined in the FIS by detailed methods. In most instances, whole-foot BFEs derived from the detailed hydraulic analyses are shown at selected intervals within this zone. Zone X Zone X is the flood insurance risk zone that corresponds to areas outside the 0.2-percent-annual-chance floodplain, areas within the 0.2-percent-annual-chance floodplain, and areas of 1-percent-annual-chance flooding where average depths are lessthan 1 foot, areas of 1-percent-annual-chance flooding where the contributing drainage area is less than 1 square mile, and areas protected from the 1-percent-annual-chance flood by levees. No BFEs or base flood depths are shown within this zone.
13
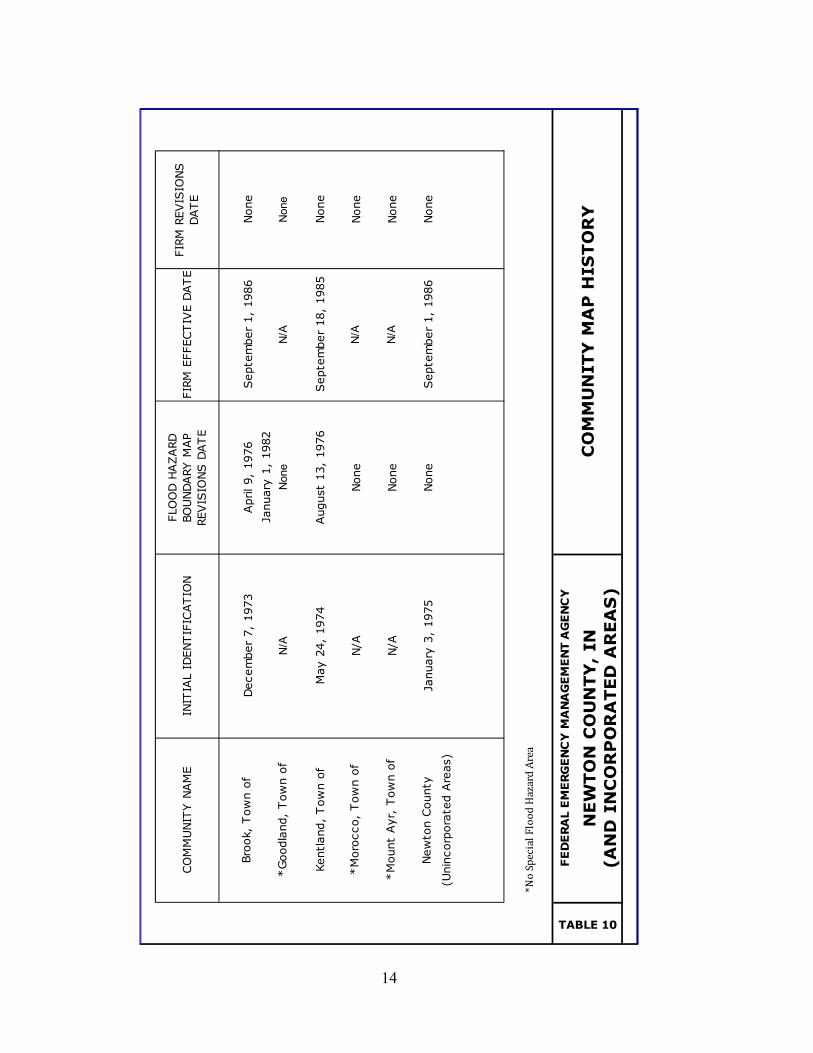
6.0 FLOOD INSURANCE RATE MAP The FIRM is designed for flood insurance and floodplain management applications. For flood insurance applications, the map designates flood insurance risk zones as described in Section 5.0 and, in the 1-percent-annual-chance floodplains that were studied by detailed methods, shows selected whole-foot BFEs or average depths. Insurance agents use the zones and BFEs in conjunction with information on structures and their contents to assign premium rates for flood insurance policies. For floodplain management applications, the map shows by tints, screens, and symbols, the 1- and 0.2-percent-annual-chance floodplains, floodways, and the locations of selected cross sections used in the hydraulic analyses and floodway computations. The current FIRM presents flooding information for the entire geographic area of Newton County. Previously, separate FIRMs were prepared for each identified flood prone incorporated community and for the unincorporated areas of the county. Historical data relating to the maps prepared for each community are presented in Table 10.
7.0 OTHER STUDIES This FIS report either supersedes or is compatible with all previous studies on streams studied in this report and should be considered authoritative for purposes of the NFIP.
8.0 LOCATION OF DATA Information concerning the pertinent data used in the preparation of this study can be obtained by contacting the Flood Insurance and Mitigation Division, Federal Emergency Management Agency, Region V, 536 S. Clark Street, 6th Floor, Chicago, IL 60605
14
Bro
ok,
Tow
n o
fDecem
ber
7,
1973
April 9,
1976
Septe
mber
1,
1986
None
January
1,
1982
*Goodla
nd,
Tow
n o
fN
/AN
one
N/A
Non
e
Kentland,
Tow
n o
fM
ay 2
4,
1974
August
13,
1976
Septe
mber
18,
1985
None
*M
oro
cco,
Tow
n o
fN/A
None
N/A
None
*M
ount
Ayr,
Tow
n o
fN/A
None
N/A
None
New
ton C
ounty
January
3,
1975
None
Septe
mber
1,
1986
None
(Unin
corp
ora
ted A
reas)
*No Special Fl
ood Hazard Ar
ea
FIR
M R
EVIS
IONS
DATE
CO
MM
UN
ITY
MA
P H
ISTO
RY
FE
DE
RA
L E
ME
RG
EN
CY
MA
NA
GE
ME
NT A
GE
NC
Y
NEW
TO
N C
OU
NTY
, IN
(AN
D I
NC
OR
PO
RA
TED
AR
EA
S)
TABLE 10
CO
MM
UNIT
Y N
AM
EIN
ITIA
L ID
ENTIF
ICATIO
NFLO
OD H
AZARD
BO
UNDARY M
AP
REVIS
IONS D
ATE
FIR
M E
FFECTIV
E D
ATE
15
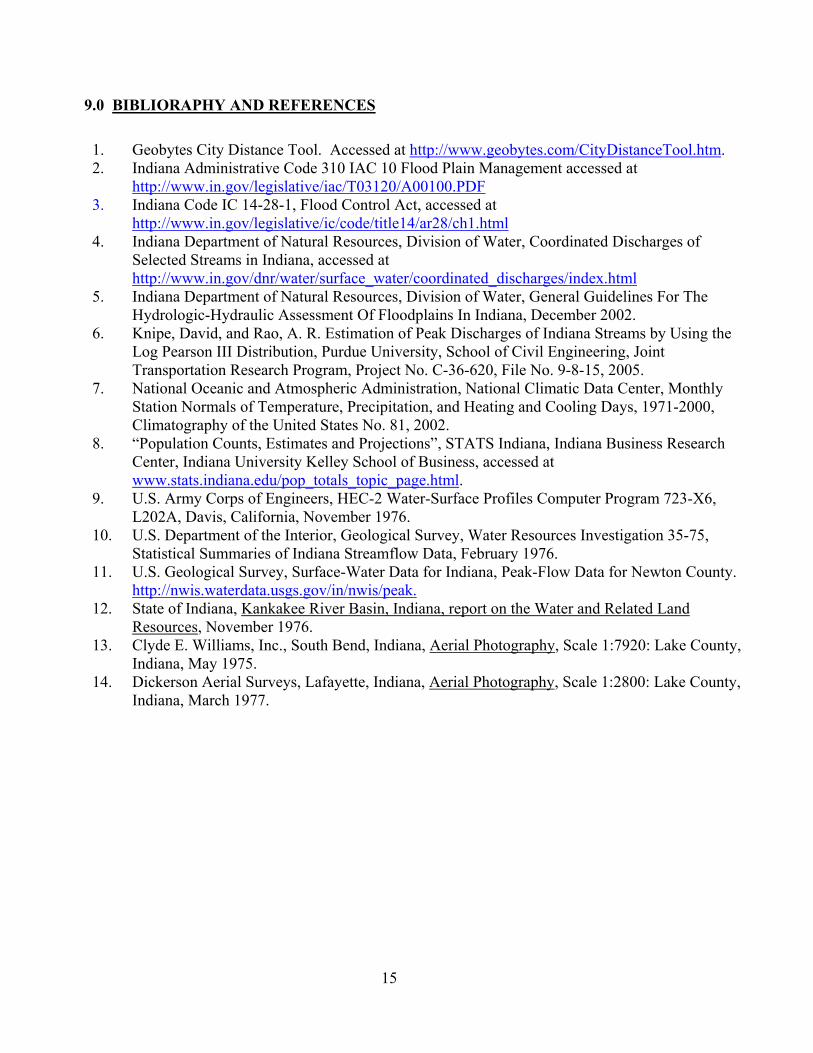
9.0 BIBLIORAPHY AND REFERENCES
1. Geobytes City Distance Tool. Accessed at http://www.geobytes.com/CityDistanceTool.htm. 2. Indiana Administrative Code 310 IAC 10 Flood Plain Management accessed at
http://www.in.gov/legislative/iac/T03120/A00100.PDF 3. Indiana Code IC 14-28-1, Flood Control Act, accessed at
http://www.in.gov/legislative/ic/code/title14/ar28/ch1.html 4. Indiana Department of Natural Resources, Division of Water, Coordinated Discharges of
Selected Streams in Indiana, accessed at http://www.in.gov/dnr/water/surface_water/coordinated_discharges/index.html
5. Indiana Department of Natural Resources, Division of Water, General Guidelines For The Hydrologic-Hydraulic Assessment Of Floodplains In Indiana, December 2002.
6. Knipe, David, and Rao, A. R. Estimation of Peak Discharges of Indiana Streams by Using the Log Pearson III Distribution, Purdue University, School of Civil Engineering, Joint Transportation Research Program, Project No. C-36-620, File No. 9-8-15, 2005.
7. National Oceanic and Atmospheric Administration, National Climatic Data Center, Monthly Station Normals of Temperature, Precipitation, and Heating and Cooling Days, 1971-2000, Climatography of the United States No. 81, 2002.
8. “Population Counts, Estimates and Projections”, STATS Indiana, Indiana Business Research Center, Indiana University Kelley School of Business, accessed at www.stats.indiana.edu/pop_totals_topic_page.html.
9. U.S. Army Corps of Engineers, HEC-2 Water-Surface Profiles Computer Program 723-X6, L202A, Davis, California, November 1976.
10. U.S. Department of the Interior, Geological Survey, Water Resources Investigation 35-75, Statistical Summaries of Indiana Streamflow Data, February 1976.
11. U.S. Geological Survey, Surface-Water Data for Indiana, Peak-Flow Data for Newton County. http://nwis.waterdata.usgs.gov/in/nwis/peak.
12. State of Indiana, Kankakee River Basin, Indiana, report on the Water and Related Land Resources, November 1976.
13. Clyde E. Williams, Inc., South Bend, Indiana, Aerial Photography, Scale 1:7920: Lake County, Indiana, May 1975.
14. Dickerson Aerial Surveys, Lafayette, Indiana, Aerial Photography, Scale 1:2800: Lake County, Indiana, March 1977.
610
615
620 620
625 625
630 630
635 635
640 640
645 645
650 650
655 655
300,000 305,000 310,000 315,000 320,000 325,000 330,000 335,000 340,000 345,000 350,000 355,000
ELE
VA
TIO
N IN
FEET
(N
AV
D 8
8)
STREAM DISTANCE IN FEET ABOVE MOUTH
FED
ER
AL
EM
ER
GEN
CY
MA
NA
GEM
EN
T A
GEN
CY
NEW
TO
N C
OU
NT
Y,
INA
ND
IN
CO
RP
OR
AT
ED
AR
EA
S
FLO
OD
PR
OFI
LES
KA
NK
AK
EE R
IVER
01P
ST
AT
E R
OU
TE 4
1
RA
ILR
OA
DLEGEND
0.2% ANNUAL CHANCE FLOOD
1% ANNUAL CHANCE FLOOD
2% ANNUAL CHANCE FLOOD
10% ANNUAL CHANCE FLOOD
STREAM BED
CROSS SECTION LOCATION
ST
AT
E B
OU
ND
AR
Y
620
625
630 630
635 635
640 640
645 645
650 650
655 655
660 660
665 665
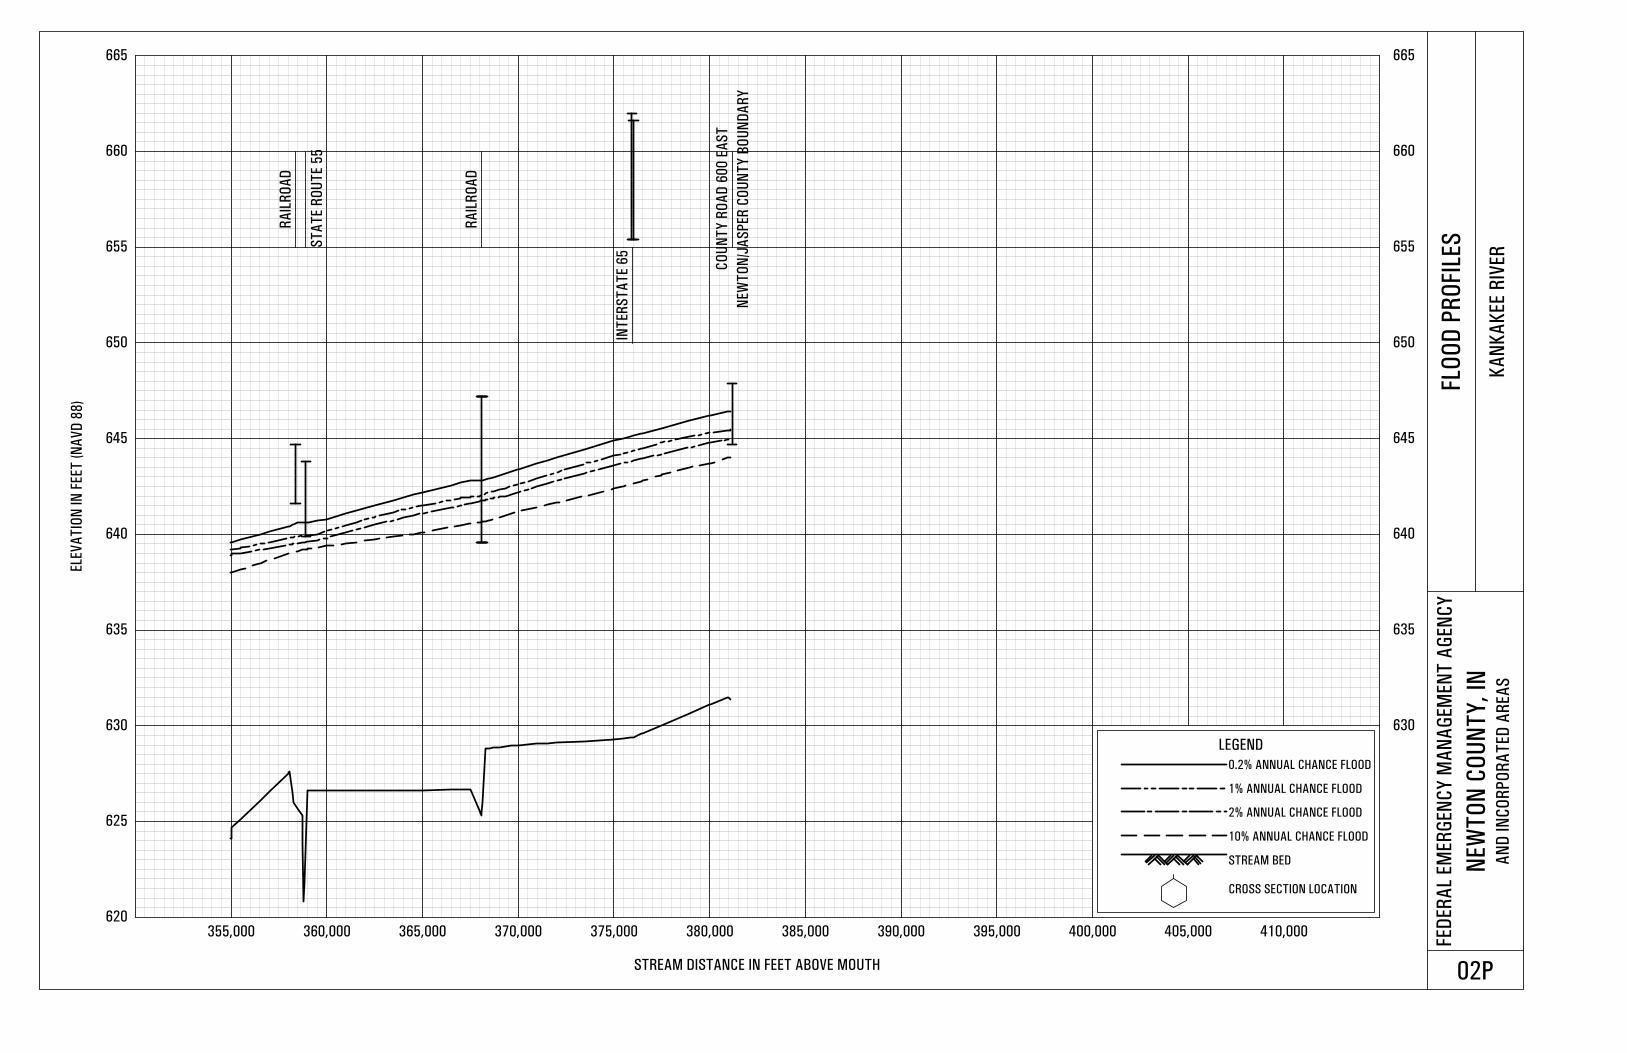
355,000 360,000 365,000 370,000 375,000 380,000 385,000 390,000 395,000 400,000 405,000 410,000
ELE
VA
TIO
N IN
FEET
(N
AV
D 8
8)
STREAM DISTANCE IN FEET ABOVE MOUTH
FED
ER
AL
EM
ER
GEN
CY
MA
NA
GEM
EN
T A
GEN
CY
NEW
TO
N C
OU
NT
Y,
INA
ND
IN
CO
RP
OR
AT
ED
AR
EA
S
FLO
OD
PR
OFI
LES
KA
NK
AK
EE R
IVER
02P
RA
ILR
OA
D
ST
AT
E R
OU
TE 5
5
RA
ILR
OA
D
INT
ER
ST
AT
E 6
5
CO
UN
TY
RO
AD
60
0 E
AS
T
LEGEND
0.2% ANNUAL CHANCE FLOOD
1% ANNUAL CHANCE FLOOD
2% ANNUAL CHANCE FLOOD
10% ANNUAL CHANCE FLOOD
STREAM BED
CROSS SECTION LOCATION
NEW
TO
N/J
AS
PER
CO
UN
TY
BO
UN
DA
RY