Embed Size (px)
Citation preview
Bluetooth® Measurement Fundamentals
Application Note
Bluetooth® wireless technology is an open specification for a wireless personal area network (PAN). It provides limited range wireless connectivity for voice and data transmissions between informationappliances. Bluetooth wireless technology eliminates the need forinterconnecting cables. Unique formost wireless communications systems, Bluetooth enables ad hocnetworking among devices, withoutthe need for infrastructure such asbase stations or access points.
Named after a tenth-century DanishKing, Bluetooth invokes images ofViking conquests and plundering;notwithstanding this, the good KingHarald Blatand is credited with uniting Denmark and Norway duringhis reign. Similarly today, Bluetoothunites devices through its wirelesscommunications link.
Bluetooth wireless technology allowsseamless interconnectivity amongdevices. Imagine your computer synchronizing files and databaseswith your personal digital assistant(PDA), simply because you carriedthe PDA into the vicinity of the PC.
Wireless headsets can simplify hands-free operation of mobilephones as a convenient and safe wayto talk while driving. The potential of this technology is limitless whenone considers the growing sector ofinformation appliances that wouldbenefit from wireless connectivity. Thisapplication note describes transmitterand receiver measurements to test and verify Bluetooth RF includingenhanced data rate (EDR) designs.Test procedures range from manual
intervention or custom software control, to easy-to-use, one-buttonmeasurements. A list of AgilentTechnologies solutions for Bluetoothmeasurements is provided inAppendix D: Agilent Solutions forBluetooth Wireless Technology. Thisapplication note assumes a basicunderstanding of RF measurements.To learn more about basic RF measurements, refer to Appendix C:Recommended Reading for Bluetooth,at the end of this application note.
Introduction . . . . . . . . . . . . . . . . . . . . .1
1. Basic Concepts of Bluetooth . . . . .3
1.1 Bluetooth radio unit . . . . . . . . . . . . . . .41.2 Bluetooth link control unit and link
management . . . . . . . . . . . . . . . . . . . . .61.3 Bluetooth RF test suite structure . . .8
2. Transmitter Measurements . . . . .10
2.1 Test conditions and setup . . . . . . . . .102.2 Power tests . . . . . . . . . . . . . . . . . . . . .132.3 Transmit output spectrum . . . . . . . . .162.4 Modulation tests . . . . . . . . . . . . . . . .182.5 Timing tests . . . . . . . . . . . . . . . . . . . . .23
3. Transceiver Measurements . . . . .26
3.1 EDR in-band spurious emissions . . .26
4. Receiver Measurements . . . . . . . .27
4.1 Test conditions and setup . . . . . . . . .274.2 Sensitivity - single-slot packets . . . .304.3 Sensitivity - multi-slot packets . . . . .314.4 EDR sensitivity . . . . . . . . . . . . . . . . . .314.5 EDR BER floor performance . . . . . . .314.6 Carrier-to-interference (C/I)
performance . . . . . . . . . . . . . . . . . . . .324.7 EDR carrier-to-interference (C/I)
performance . . . . . . . . . . . . . . . . . . . .324.8 Blocking performance . . . . . . . . . . . .334.9 Intermodulation performance . . . . . .334.10 Maximum input level . . . . . . . . . . . . .334.11 EDR maximum input level . . . . . . . . .33
5. Power Supply Measurements . . .34
Appendix A: Glossary . . . . . . . . . . . . . . . .35
Appendix B: Symbols and Acronyms . . .36
Appendix C: Recommended Reading . . .37
Appendix D: Agilent Solutions for Bluetooth . . . . . . . . . . . . . . . . . . . . . .38
Appendix E: References . . . . . . . . . . . . . .39
2
Table of Contents

A wide variety of Bluetooth radioblock diagrams are in use. For transmission, these range from directvoltage controlled oscillator (VCO)modulation to IQ mixing at the finalradio frequency (RF.) In the receiver, aconventional frequency discriminatoror IQ down-conversion combinedwith analog-to-digital conversion isnoted.
While many options can satisfy theBluetooth radio specifications, eachwill have its own characteristics if not operating correctly. TheBluetooth system consists of a radiounit, a baseband link control unit,and link management software. Italso includes higher-level softwareutilities that focus on interoperabilityfeatures and functionality. Figure 1 is a block diagram for this type of frequency hopping system, showingthe baseband controller and the RFtransmitter and receiver sections.
EDR is an enhancement to theBluetooth 1.2 standard and isdescribed in the Bluetooth 2.0 specification. It is backwards compatible with the earlier Bluetoothstandards. It uses a phase shift keying (PSK) modulation scheme to achieve a data rate of 2 or 3 Mb/s.It allows greater possibilities forusing multiple devices on the sameconnection because of the increasedbandwidth. Due to EDR having areduced duty cycle, there is lowerpower consumption compared to astandard Bluetooth link.
Bluetooth, in its most elementaryform, is defined as a global specification for wireless connectivity.Because it is intended to replacecables, cost must be low and operationmust be intuitive and robust. Theserequirements for Bluetooth createmany challenges. Bluetooth meetsthese challenges by several means.The radio unit employs frequencyhopping spread spectrum (FHSS),and the design emphasis is on verylow power, extremely low cost, and robust operation in the uncoordinated, interference-dominatedRF environment of the industrial, scientific, and medical (ISM) radioband.
3
1. Basic Concepts of Bluetooth
Figure 1. Block diagram of a Bluetooth system
RFBaseband
Transmitter
Receiver
Control/processor
Frequency hopping control
to host
RFfilter
Switchdriver
Burstmodulator
Quadraturemodulator
Quadraturedemodulator
IFfilter
Low-passfilter
Thresholddetector& clock
recovery
16-bitµ processor
DSPbaseband processor(burst mode control)
Clock
RAM
FlashROM
Input/output
DAC

The Bluetooth channels are each 1 MHz wide. The frequency hoppingoccurs over the 79 channels. Figure 2 depicts the frequency hopping channels, divided by geographic regions.
The modulation in a standardBluetooth system is Gaussian frequency shift keying (GFSK) thisgives a gross air data rate of 1 Mb/s.This is a digital modulation format
in which the modulated carrier shifts between two frequencies representing a “1” and a “0”. As aresult, GFSK provides one bit of dataper symbol. Figure 3 is an example of GFSK modulation illustrating the two discrete frequencies. Unlike many other forms of digitalmodulation, such as GSM, amplitudeand phase are not of primary concernin this type of modulation scheme.
1.1 Bluetooth radio unitThe Bluetooth radio unit is shown in Figure 1 as the transmitter andreceiver sections of the block diagram. The transmitter up-convertsthe baseband information to the frequency-modulated carrier.Frequency hopping and bursting areperformed at this level. Conversely,the receiver down-converts anddemodulates the RF signal. Table 1summarizes some of the key RF characteristics of Bluetooth.
4
Table 1. Key Bluetooth RF characteristics
Characteristic Specification Notes
Carrier frequency1 2400 to 2483.5 MHz (ISM radio band) f = 2402 + k MHz, k = 0, 1, 2...,78
Modulation Standard 0.5 BT Gaussian-filtered 2FSK at 1 Msymbol/s Digital FM schemeModulation index: 0.28 to 0.35 (0.32 nominal) The peak frequency deviation allowed is 175 kHz0.4 BT π/4-DQPSK at 2 Msymbol/s 0.4 BT 8DPSK at 3 Msymbol/s
Hopping 1600 hops/s (in normal operation)2 The channel hopping sequence is designed to visit each1 MHz channel spacing frequency regularly and with roughly equal probability.1) page hopping sequence The system has five different hopping sequences.2) page response sequence It has a periodicity of 23 hours and 18 minutes.3) inquiry sequence4) inquiry response sequence5) channel hopping sequenceThe first four are restricted hopping sequences used during connection setup. The normal channel hopping sequence is pseudorandom based on the master clock value and device address.
Transmit power Power class 1: 1 mW (0 dBm) to 100 mW (20 dBm) Class 1 power control:+4 to +20 dBm (required)–30 to +4 dBm (optional)
Power class 2: 0.25 mW (–6 dBm) to 2.5 mW (+4 dBm) Class 2 power control:–30 to 0 dBm (optional)
Power class 3: 1 mW (0 dBm) max power Class 3 power control:–30 to 0 dBm (optional)
Operating range 10 cm to 10 m (100 m with power class 1) Range depends on amount of interference
Maximum data throughput The asynchronous channel can support an asymmetric Data throughput is lower than the 1 Msymbol/s rate asink of maximally 721 kb/s in either direction while a result of the overhead, which is inherent in the protocolpermitting 57.6 kb/s in the return direction, or a 432.6 kb/s symmetric link. EDR 3 Mb/s has a real data throughput of 2.1 Mb/s
1. The Bluetooth specification includes a special frequency hopping pattern to provide provisions for compliance with national limitations such as those in France. The frequency range for France is 2.4454 to 2.4835 GHz and the corresponding RF channels are f = 2454 + k MHz, k = 0,...,22.
2. Hop speed may vary, depending on packet length.
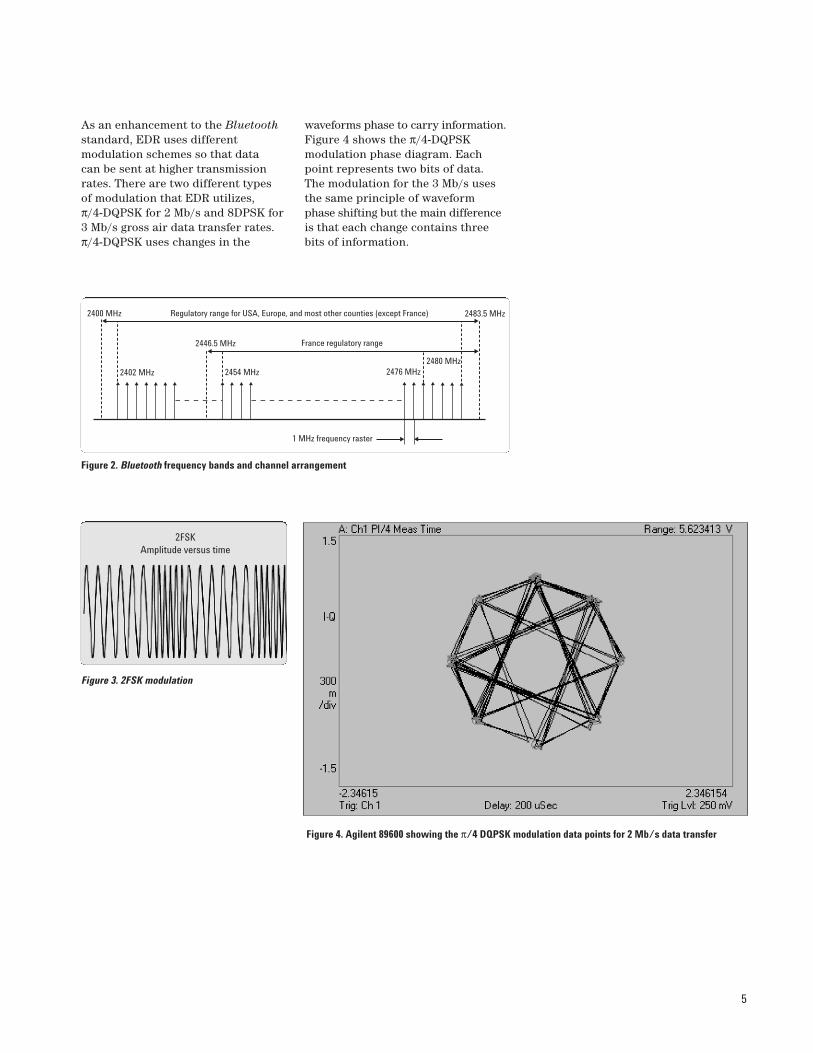
waveforms phase to carry information.Figure 4 shows the π/4-DQPSK modulation phase diagram. Eachpoint represents two bits of data. The modulation for the 3 Mb/s usesthe same principle of waveform phase shifting but the main differenceis that each change contains threebits of information.
As an enhancement to the Bluetoothstandard, EDR uses different modulation schemes so that data can be sent at higher transmissionrates. There are two different types of modulation that EDR utilizes, π/4-DQPSK for 2 Mb/s and 8DPSK for3 Mb/s gross air data transfer rates.π/4-DQPSK uses changes in the
5
Figure 2. Bluetooth frequency bands and channel arrangement
2446.5 MHz
2400 MHz
2402 MHz 2454 MHz 2476 MHz2480 MHz
2483.5 MHz
1 MHz frequency raster
France regulatory range
Regulatory range for USA, Europe, and most other counties (except France)
Figure 3. 2FSK modulation
2FSKAmplitude versus time
Figure 4. Agilent 89600 showing the π/4 DQPSK modulation data points for 2 Mb/s data transfer
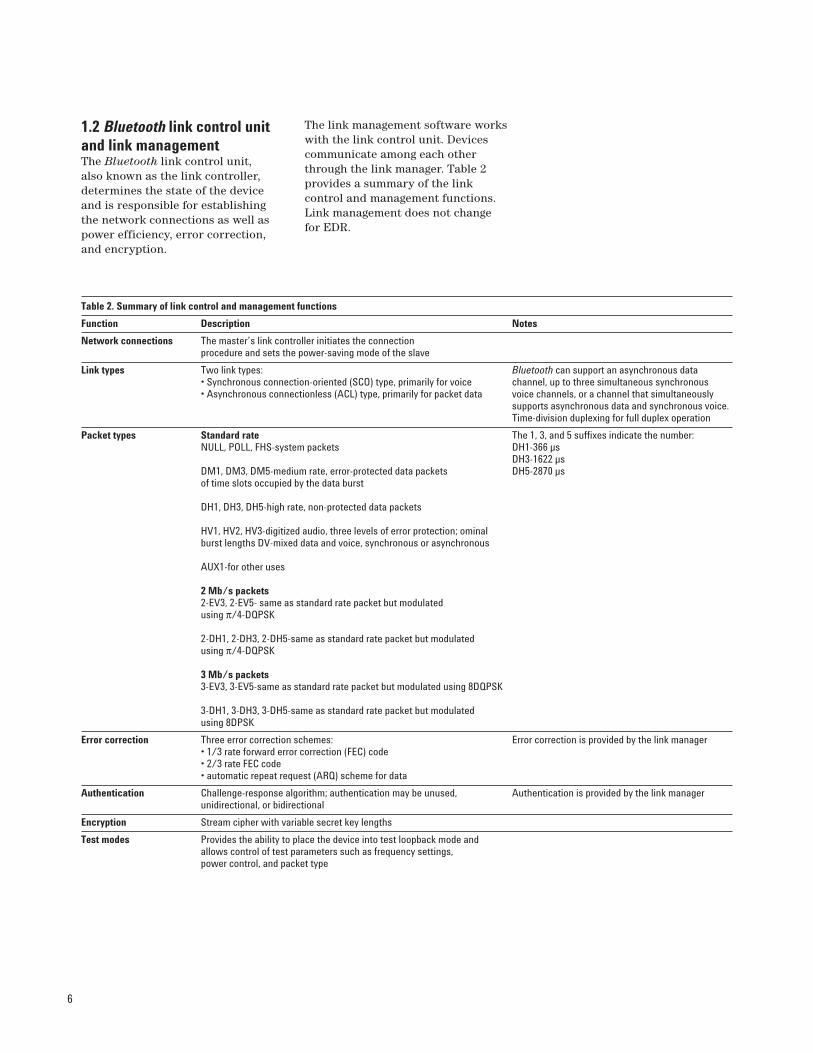
The link management software workswith the link control unit. Devicescommunicate among each otherthrough the link manager. Table 2provides a summary of the link control and management functions.Link management does not changefor EDR.
1.2 Bluetooth link control unitand link managementThe Bluetooth link control unit, also known as the link controller,determines the state of the deviceand is responsible for establishingthe network connections as well aspower efficiency, error correction,and encryption.
6
Table 2. Summary of link control and management functions
Function Description Notes
Network connections The master’s link controller initiates the connection procedure and sets the power-saving mode of the slave
Link types Two link types: Bluetooth can support an asynchronous data• Synchronous connection-oriented (SCO) type, primarily for voice channel, up to three simultaneous synchronous• Asynchronous connectionless (ACL) type, primarily for packet data voice channels, or a channel that simultaneously
supports asynchronous data and synchronous voice.Time-division duplexing for full duplex operation
Packet types Standard rate The 1, 3, and 5 suffixes indicate the number:NULL, POLL, FHS-system packets DH1-366 µs
DH3-1622 µsDM1, DM3, DM5-medium rate, error-protected data packets DH5-2870 µsof time slots occupied by the data burst
DH1, DH3, DH5-high rate, non-protected data packets
HV1, HV2, HV3-digitized audio, three levels of error protection; ominal burst lengths DV-mixed data and voice, synchronous or asynchronous
AUX1-for other uses
2 Mb/s packets 2-EV3, 2-EV5- same as standard rate packet but modulated using π/4-DQPSK
2-DH1, 2-DH3, 2-DH5-same as standard rate packet but modulated using π/4-DQPSK
3 Mb/s packets 3-EV3, 3-EV5-same as standard rate packet but modulated using 8DQPSK
3-DH1, 3-DH3, 3-DH5-same as standard rate packet but modulated using 8DPSK
Error correction Three error correction schemes: Error correction is provided by the link manager• 1/3 rate forward error correction (FEC) code• 2/3 rate FEC code• automatic repeat request (ARQ) scheme for data
Authentication Challenge-response algorithm; authentication may be unused, Authentication is provided by the link managerunidirectional, or bidirectional
Encryption Stream cipher with variable secret key lengths
Test modes Provides the ability to place the device into test loopback mode and allows control of test parameters such as frequency settings, power control, and packet type
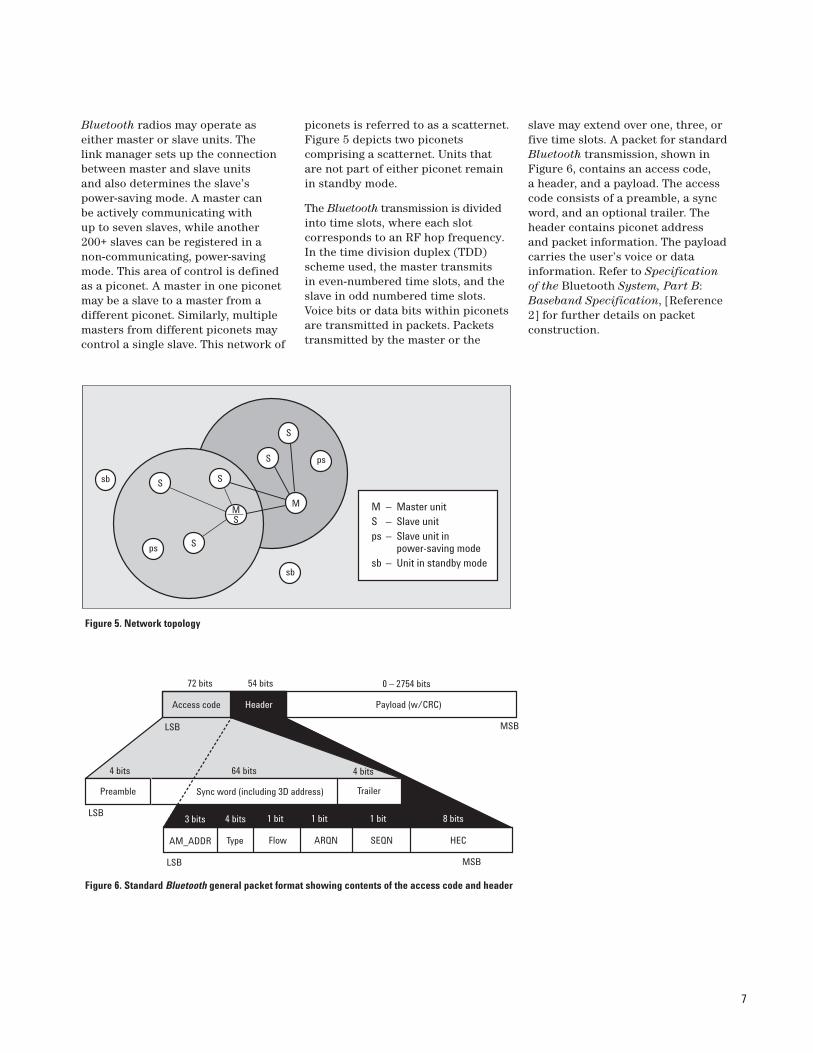
piconets is referred to as a scatternet.Figure 5 depicts two piconets comprising a scatternet. Units thatare not part of either piconet remainin standby mode.
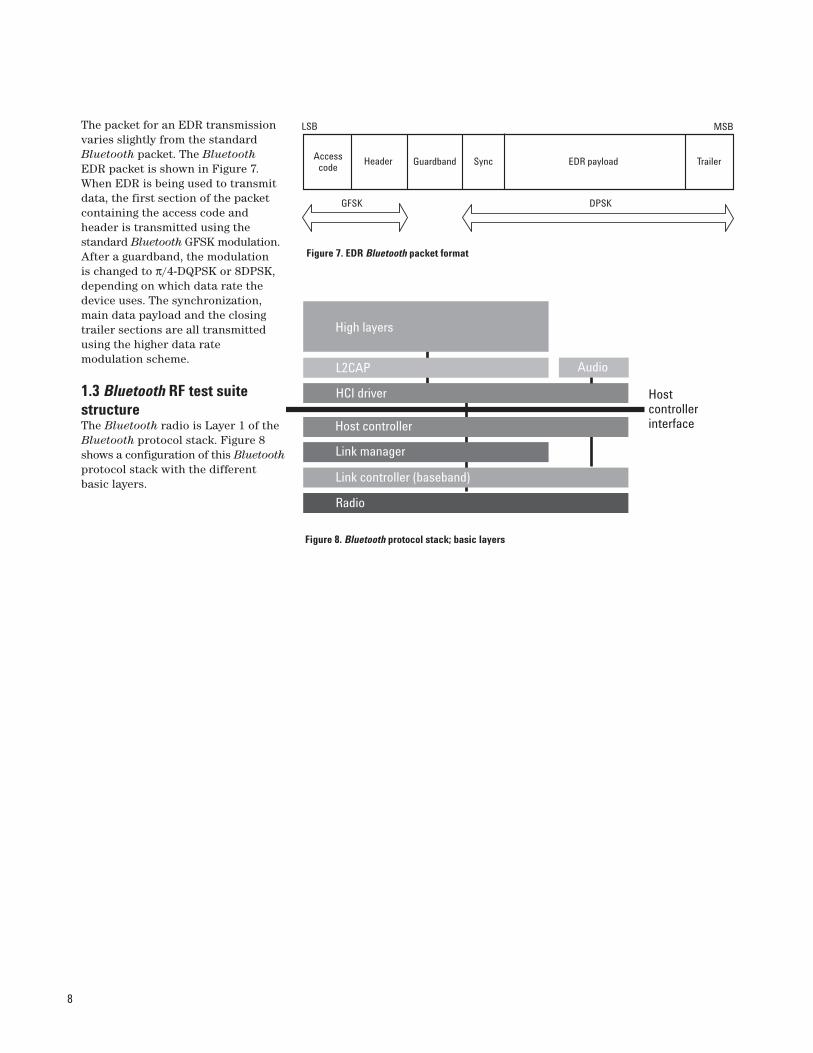
The Bluetooth transmission is dividedinto time slots, where each slot corresponds to an RF hop frequency.In the time division duplex (TDD)scheme used, the master transmits in even-numbered time slots, and theslave in odd numbered time slots.Voice bits or data bits within piconetsare transmitted in packets. Packetstransmitted by the master or the
slave may extend over one, three, orfive time slots. A packet for standardBluetooth transmission, shown inFigure 6, contains an access code, a header, and a payload. The accesscode consists of a preamble, a syncword, and an optional trailer. Theheader contains piconet address and packet information. The payloadcarries the user’s voice or data information. Refer to Specification of the Bluetooth System, Part B:Baseband Specification, [Reference2] for further details on packet construction.
Bluetooth radios may operate aseither master or slave units. The link manager sets up the connectionbetween master and slave units and also determines the slave’spower-saving mode. A master can be actively communicating with up to seven slaves, while another200+ slaves can be registered in anon-communicating, power-savingmode. This area of control is definedas a piconet. A master in one piconetmay be a slave to a master from a different piconet. Similarly, multiplemasters from different piconets maycontrol a single slave. This network of
7
Figure 5. Network topology
sb
sb
S S
S
S
S
M
ps
ps
MS
M – Master unitS – Slave unitps – Slave unit in power-saving modesb – Unit in standby mode
Figure 6. Standard Bluetooth general packet format showing contents of the access code and header
54 bits72 bits
4 bits64 bits4 bits
0 – 2754 bits
3 bits 4 bits 8 bits1 bit 1 bit1 bitLSB
LSB
LSB
MSB
MSB
AM_ADDR ARQN SEQN HECType Flow
TrailerPreamble
Access code Header Payload (w/CRC)
Sync word (including 3D address)
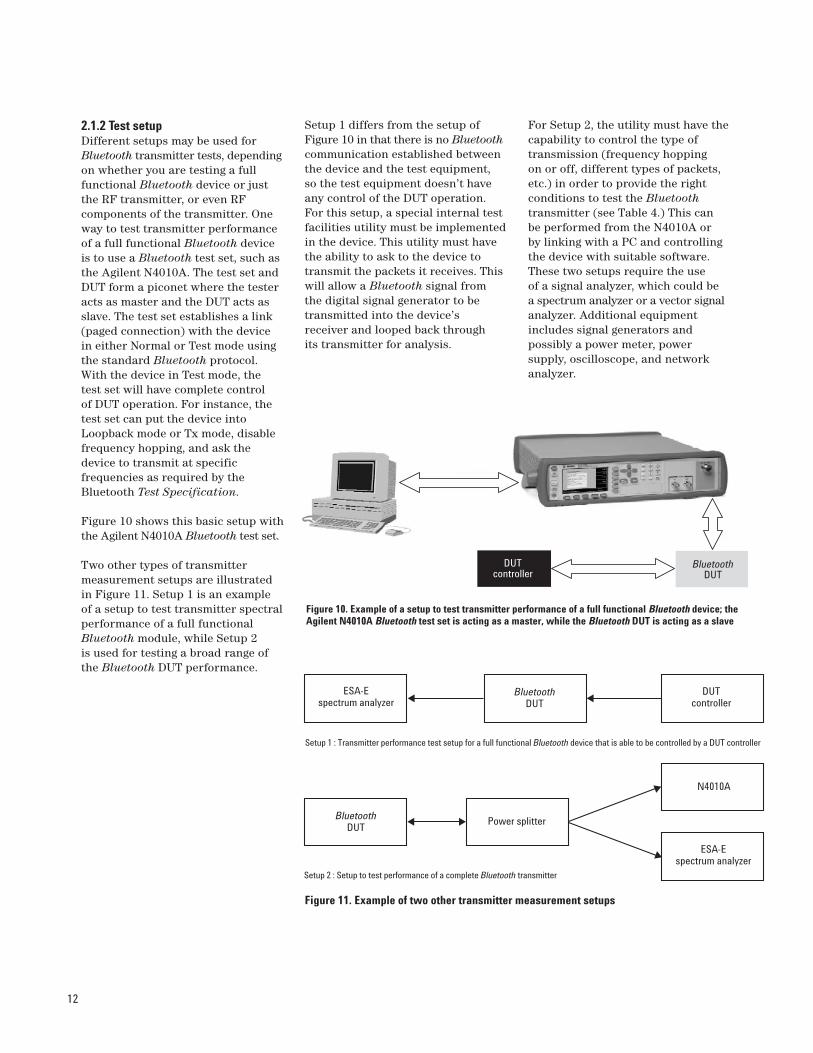
The packet for an EDR transmissionvaries slightly from the standardBluetooth packet. The BluetoothEDR packet is shown in Figure 7.When EDR is being used to transmitdata, the first section of the packetcontaining the access code and header is transmitted using the standard Bluetooth GFSK modulation.After a guardband, the modulation is changed to π/4-DQPSK or 8DPSK,depending on which data rate thedevice uses. The synchronization,main data payload and the closingtrailer sections are all transmittedusing the higher data rate modulation scheme.
1.3 Bluetooth RF test suitestructureThe Bluetooth radio is Layer 1 of theBluetooth protocol stack. Figure 8shows a configuration of this Bluetoothprotocol stack with the differentbasic layers.
8
Figure 7. EDR Bluetooth packet format
MSB
Trailer
DPSK
EDR payloadSync
GFSK
GuardbandHeader
LSB
Accesscode
Figure 8. Bluetooth protocol stack; basic layers
High layers
L2CAP
HCI driver
Host controller
Link manager
Link controller (baseband)
Radio
Audio
Hostcontrollerinterface

The Bluetooth Special Interest Group(SIG) has proposed a list, entitled“Bluetooth RF Test Suite Structure,”which defines tests to perform forcertification of the Bluetooth radiolayer. Table 3 provides this list of testswith their test purpose identifiers.
The following sections of this application note provide a description of these different testsand how they can be performed. For specific information on testrequirements, such as initial condition,test procedure, test condition, orexpected outcome, refer to theBluetooth Test Specification - RF[Reference 1]. This document hasbeen defined by the Bluetooth SIGand is the definitive guide.1
1. At the time of this writing, the revision of thisdocument is 2.0.E.3 (Test Specification RF forSpecification 2.0 - March 21, 2005). Since then,some errata in this document may have been list-ed on the Bluetooth SIG web site under “TESTSPECIFICATION ERRATA.” Refer to this for up-to-date test requirements.
9
Table 3. Bluetooth RF test suite structure
Test cases for certification testing of the Bluetooth RF Layer Identifier1
Transmitter testsOutput power TRM/CA/01/CPower density TRM/CA/02/CPower control TRM/CA/03/CTx output spectrum-frequency range TRM/CA/04/CTx output spectrum-20 dB bandwidth TRM/CA/05/CTx output spectrum-adjacent channel power TRM/CA/06/CModulation characteristics TRM/CA/07/CInitial carrier frequency tolerance TRM/CA/08/CCarrier frequency drift TRM/CA/09/C
Receiver testsSensitivity/single-slot packets RCV/CA/01/CSensitivity/multi-slot packets RCV/CA/02/CC/I performance RCV/CA/03/CBlocking performance RCV/CA/04/CInter-modulation performance RCV/CA/05/CMaximum input level RCV/CA/06/C
Bluetooth EDR RF test suite structure
Transmitter testsEnhanced data rate relative transmit power TRM/CA/10/CEnhanced data rate carrier frequency stability and modulation accuracy TRM/CA/11/CEnhanced data rate differential phase encoding TRM/CA/12/CEnhanced data rate in-band spurious emission TRM/CA/13/C
Receiver testsEnhanced data rate sensitivity RCV/CA/07/CEnhanced data rate BER floor sensitivity RCV/CA/08/CEnhanced data rate C/I performance TP/RCV/CA/09/CEnhanced data rate maximum input level RCV/CA/10/C
1Note: Identifier format is: (Test)/CA/NN/C, in whichTRM = Transmitter testTRC = Transceiver testRCV = Receiver testCA = Capability test (defines the type of testing)NN = Test purpose numberC = Conformance test performed on dedicated Bluetooth test system (defines the scope)

This chapter provides a frameworkfor the Bluetooth transmitter testsand test methodology. It describesthe measurements that can be madeon Bluetooth components and systems. Examples and supportinginformation are provided.
2.1 Test conditions and setup
2.1.1 Test conditionsTable 4 is a summary list of the conditions under which the transmittertests need to be performed.
10
2. Transmitter Measurements
Table 4. Transmitter test conditions
Frequency Test mode Packet type Payload data Measurement hopping bandwidth
Output power TRM/CA/01/C On Loopback1 DH52 PRBS 9 3 MHz RBW3 MHz VBW
Power density TRM/CA/02/C On Loopback1 DH52 PRBS 9 100 kHz RBW100 kHz VBW
Power control TRM/CA/03/C Off Loopback1 DH1 PRBS 9 3 MHz RBW3 MHz VBW
Tx output spectrum-frequency range TRM/CA/04/C Off Loopback1 DH5 or DM52 PRBS 9 100 kHz RBW300 kHz VBW
Tx output spectrum –20 dB bandwidth TRM/CA/05/C Off Loopback1 DH5 or DM52 PRBS 9 10 kHz RBW30 kHz VBW
Tx output spectrum-adjacent channel power TRM/CA/06/C Off Loopback DH1 PRBS 9 100 kHz RBW300 kHz VBW
Modulation characteristics TRM/CA/07/C Off Loopback1 DH5 or DM52 11110000 –10101010
Initial carrier frequency tolerance TRM/CA/08/C On Loopback1 DH1 PRBS 9 –
Carrier frequency drift TRM/CA/09/C On Loopback1 DH1 10101010 –DH3DH52
EDR transmitter test conditions
EDR relative transmit power TRM/CA/10/C Off Loopback1 2-DHx or 2-Evx PRBS 9 3 MHz RBW3-DHx or 3-Evx2, 3 3 MHz VBW
EDR carrier frequency stability and modulation accuracy TRM/CA/11/C Off Loopback1 2-DH5 or 3-DH52, 3 PRBS 9 –
EDR differential phase encoding TRM/CA/12/C Off Tx 2-DH1 or 2-EV3 PRBS 9 –3-DH1 or 3-EV32, 3
EDR in band spurious emissions TRM/CA/13/C Off Loopback 2-DHx or 2-Evx PRBS 9 100 kHz RBW3-DHx or 3-Evx2, 3 300 kHz VBW
1. If loopback is not available, the use of Tx (transmitter mode) is allowed.2. If packet is not supported, use the longest supported packets (with the longest supported payload length).3. The packet to be used depends on what modulation scheme is being tested number 2 prefix for π/4 DQPSK and number 3 prefix for 8DPSK.

Test modeThe Bluetooth device can operate indifferent modes:• normal mode• transmitter (Tx) test mode• loopback test mode
Normal mode consists of having astandard Bluetooth communication.For instance, when the tester is acting as a master and the Bluetoothdevice as a slave, in normal mode thetester will send some POLL packetsand the device will confirm thereception of these packets by sendingback a NULL packet. The descriptionof POLL and NULL packets can befound in Specification of theBluetooth System, Part B: BasebandSpecification [Reference 2].
In Test mode, the Bluetooth device is operating in a specific state. InLoopback test mode, the Bluetoothdevice (slave) is asked to decode thepackets sent by the tester (master)and send back the payload using the same packet type. While inTransmitter test mode, the Bluetoothdevice is simply asked to transmit atype of packet according to specificinstructions sent by the tester (master)
via POLL packets. An illustration ofLoopback and Transmitter test modeis provided in Figure 9.
The implementation of Test mode in Bluetooth devices is required tofacilitate testing of transmitter andreceiver performance of a device. By putting the device into Test mode, different transmission and/orreception parameters can be controlled, such as frequency selection, Tx frequency, packet typeand length, bit pattern, poll period,and power level.
Note: To allow the tester (master) toput the device (slave) into Test mode,the host device will need to send aspecial command (LMP command) inorder to prepare the device to enterTest mode. That is one of the reasonswhy in the different setups presentedin the following sections, a DUT controller is included. The controlcould be performed either by protocolsent over an RF connection or bydirect digital control of the device.For more details on Test mode and its activation, refer to page 285, “Test Mode,” in the Specification ofthe Bluetooth System [Reference 2].
Payload dataNotice that three different types of payload data are called for in different test cases. They are PRBS9,10101010, and 11110000. Each pattern provides different stressmechanisms and is selectively chosenfor each measurement. PRBS9 is apseudorandom bit sequence of period29–1 that is intended to simulate livetraffic and so produces a modulatedsignal with a spectral distributionapproximating that of a real signal.The 10101010 pattern provides anadditional test for the modulation filter. It also changes the spectralshape of the transmitter output. The11110000 pattern allows a check ofthe Gaussian filtering. After a seriesof four 1s or four 0s, the outputshould have reached its fully settledcondition. The use of different patterns also helps identify problemswith IQ modulation schemes. Notethat an ideal Gaussian filter will produce a ratio of 88 percent betweenthe peak frequency deviation of a10101010 signal and that of the11110000 signal. The Bluetooth radiospecification calls for > 80 percent to be achieved.
Frequency hoppingThe adaptive frequency hopping of the Bluetooth system adds a further degree of complexity to signal analysis. Hopping is needed for testing the functional capability of the Bluetooth device, whereas for parametric tests, hopping is notessential. To reduce the number ofvariables and identify individual performance characteristics, hoppingis turned off for a number of tests.However, the transmit and receivechannels can be set at the extremeends of the band, forcing the VCO inthe device under test (DUT) to switchfrequency. Each method is tailored to the requirements of the test and is documented in the Bluetooth TestSpecification.
11
Figure 9. Loopback and Transmitter test mode
Transmitter test mode
Loopback test mode
Burst length Burst length
Test packet Test packet
POLL POLL
TimeMaster Tx Master Tx Master Tx
Master Tx Master Tx Master Tx
Slave Tx Slave Tx Slave Tx
Slave Tx Slave Tx Slave Tx Time
Tx packet Tx packet Tx packetRx packet Rx packet Rx packet
Payload Payload Payload
ARQNARQNARQN
Setup 1 differs from the setup ofFigure 10 in that there is no Bluetoothcommunication established betweenthe device and the test equipment, so the test equipment doesn’t haveany control of the DUT operation. For this setup, a special internal testfacilities utility must be implementedin the device. This utility must havethe ability to ask to the device totransmit the packets it receives. Thiswill allow a Bluetooth signal from the digital signal generator to betransmitted into the device’s receiver and looped back through its transmitter for analysis.
For Setup 2, the utility must have thecapability to control the type oftransmission (frequency hopping on or off, different types of packets,etc.) in order to provide the right conditions to test the Bluetoothtransmitter (see Table 4.) This can be performed from the N4010A or by linking with a PC and controllingthe device with suitable software.These two setups require the use of a signal analyzer, which could be a spectrum analyzer or a vector signalanalyzer. Additional equipmentincludes signal generators and possibly a power meter, power supply, oscilloscope, and networkanalyzer.
2.1.2 Test setupDifferent setups may be used forBluetooth transmitter tests, dependingon whether you are testing a fullfunctional Bluetooth device or justthe RF transmitter, or even RF components of the transmitter. Oneway to test transmitter performanceof a full functional Bluetooth deviceis to use a Bluetooth test set, such asthe Agilent N4010A. The test set andDUT form a piconet where the testeracts as master and the DUT acts asslave. The test set establishes a link(paged connection) with the device in either Normal or Test mode usingthe standard Bluetooth protocol.With the device in Test mode, the test set will have complete control of DUT operation. For instance, thetest set can put the device intoLoopback mode or Tx mode, disablefrequency hopping, and ask thedevice to transmit at specific frequencies as required by theBluetooth Test Specification.
Figure 10 shows this basic setup withthe Agilent N4010A Bluetooth test set.
Two other types of transmitter measurement setups are illustratedin Figure 11. Setup 1 is an example of a setup to test transmitter spectralperformance of a full functionalBluetooth module, while Setup 2 is used for testing a broad range ofthe Bluetooth DUT performance.
12
Figure 10. Example of a setup to test transmitter performance of a full functional Bluetooth device; theAgilent N4010A Bluetooth test set is acting as a master, while the Bluetooth DUT is acting as a slave
DUTcontroller
BluetoothDUT
Figure 11. Example of two other transmitter measurement setups
ESA-Espectrum analyzer
BluetoothDUT
DUTcontroller
Power splitterBluetoothDUT
N4010A
ESA-Espectrum analyzer
Setup 1 : Transmitter performance test setup for a full functional Bluetooth device that is able to be controlled by a DUT controller
Setup 2 : Setup to test performance of a complete Bluetooth transmitter
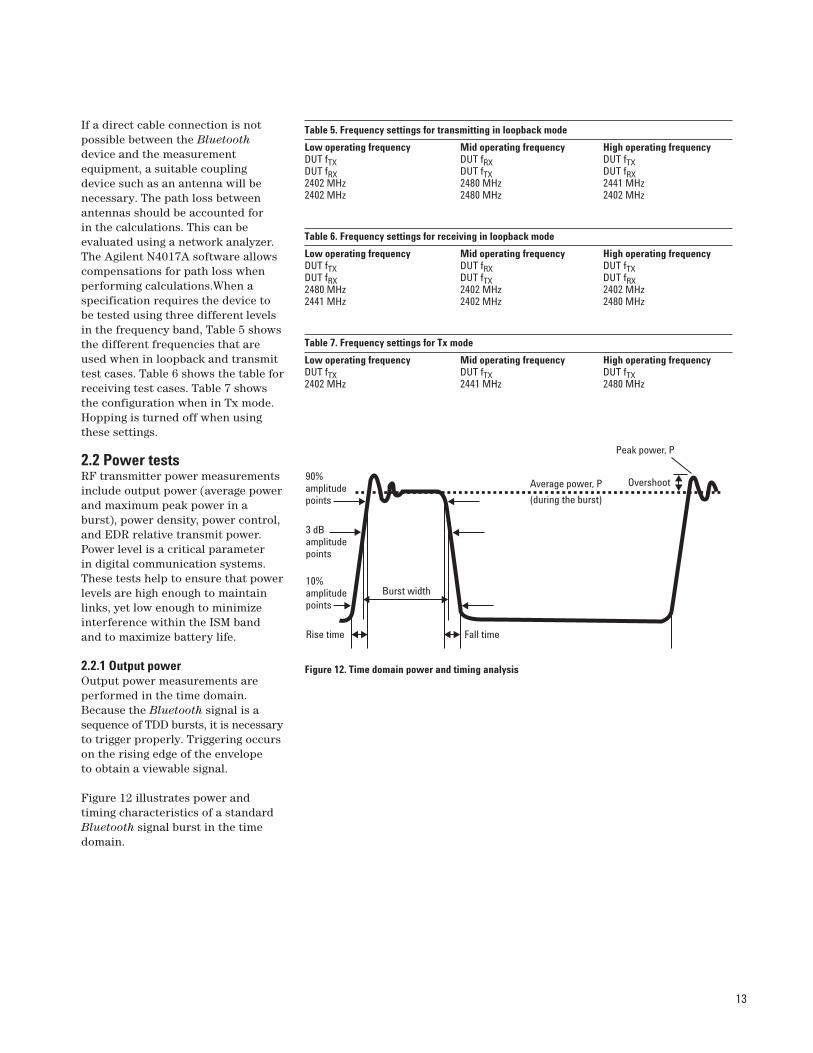
If a direct cable connection is notpossible between the Bluetoothdevice and the measurement equipment, a suitable coupling device such as an antenna will benecessary. The path loss betweenantennas should be accounted for in the calculations. This can be evaluated using a network analyzer.The Agilent N4017A software allowscompensations for path loss whenperforming calculations.When a specification requires the device tobe tested using three different levelsin the frequency band, Table 5 showsthe different frequencies that areused when in loopback and transmittest cases. Table 6 shows the table forreceiving test cases. Table 7 showsthe configuration when in Tx mode.Hopping is turned off when usingthese settings.
2.2 Power testsRF transmitter power measurementsinclude output power (average powerand maximum peak power in aburst), power density, power control,and EDR relative transmit power.Power level is a critical parameter in digital communication systems.These tests help to ensure that powerlevels are high enough to maintainlinks, yet low enough to minimizeinterference within the ISM band and to maximize battery life.
2.2.1 Output powerOutput power measurements are performed in the time domain.Because the Bluetooth signal is asequence of TDD bursts, it is necessaryto trigger properly. Triggering occurson the rising edge of the envelope to obtain a viewable signal.
Figure 12 illustrates power and timing characteristics of a standardBluetooth signal burst in the timedomain.
13
Table 5. Frequency settings for transmitting in loopback mode
Low operating frequency Mid operating frequency High operating frequencyDUT fTX DUT fRX DUT fTXDUT fRX DUT fTX DUT fRX2402 MHz 2480 MHz 2441 MHz2402 MHz 2480 MHz 2402 MHz
Table 6. Frequency settings for receiving in loopback mode
Low operating frequency Mid operating frequency High operating frequencyDUT fTX DUT fRX DUT fTXDUT fRX DUT fTX DUT fRX2480 MHz 2402 MHz 2402 MHz2441 MHz 2402 MHz 2480 MHz
Table 7. Frequency settings for Tx mode
Low operating frequency Mid operating frequency High operating frequencyDUT fTX DUT fTX DUT fTX2402 MHz 2441 MHz 2480 MHz
Figure 12. Time domain power and timing analysis
90%amplitudepoints
3 dBamplitudepoints
10%amplitudepoints
Rise time Fall time
Burst width
Average power, P
(during the burst)
Overshoot
Peak power, P

Average power and peak power measurements can be performedeither by a Bluetooth test set, a power meter, a spectrum analyzer, or a vector signal analyzer. For any of these testers, the tester records the highest power value in the burstand calculates the average powerfrom 20 to 80 percent of the durationof the burst. The duration of theburst (burst width) is the timebetween the leading and trailing 3 dB points compared to the averagepower.
Figure 13 shows an output powermeasurement performed with anN4010A test set and N4017A graphicmeasurement application (GMA.)
Using a swept-tuned spectrum analyzer, view the envelope of the signal in the time domain by settingthe span to zero. External triggeringcan be used to capture the burstmode signal. The number of periodsdisplayed is controlled by the sweeptime. Using peak detector mode, setthe trace to max hold and measurethe peak power level using peaksearch. The average power of theburst is also determined by analyzingthe trace data. The test is repeatedfor all frequency channels. Figure 14shows a display of an average andpeak power measurement on a swept-tuned spectrum analyzer.
14
Figure 13. Agilent N4017A software display showing an output power measurement recorded using an Agilent N4010A. (Device setup: Test mode, Frequency hopping ON, DH1 packet, maximum payload length, PRBS9 as payload)
Figure 14. Agilent ESA-E series spectrum analyzer display of peak and average power measurement using the Bluetooth personality (Device setup: CF=2.441 GHz, sweep time 680 µs, triggering on IF ch39)
For the second part of the measurement, the analyzer ischanged to the time domain and a 1-minute single sweep is performed.The power density is calculated as the average of the trace. This
calculation may be performed on a spectrum analyzer by analyzing the trace data and averaging theresult. A vector signal analyzer has a utility for determining the meanpower of the trace.
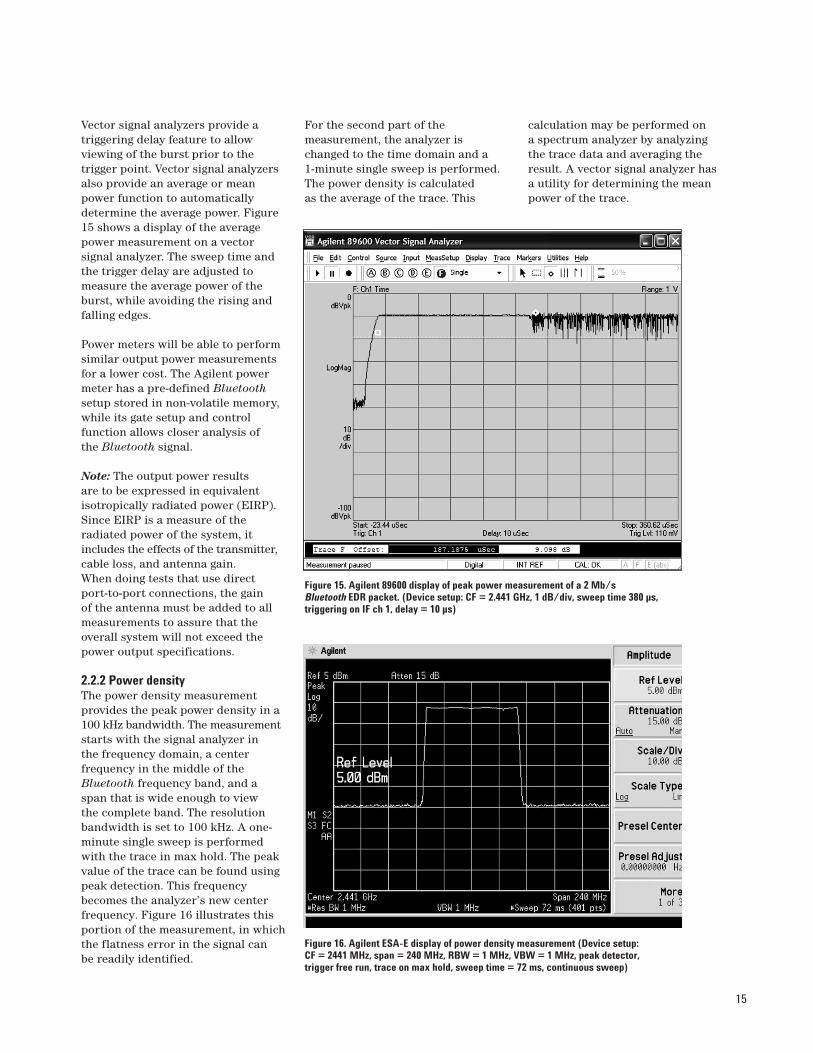
Vector signal analyzers provide a triggering delay feature to allow viewing of the burst prior to the trigger point. Vector signal analyzersalso provide an average or meanpower function to automaticallydetermine the average power. Figure15 shows a display of the averagepower measurement on a vector signal analyzer. The sweep time andthe trigger delay are adjusted tomeasure the average power of theburst, while avoiding the rising andfalling edges.
Power meters will be able to performsimilar output power measurementsfor a lower cost. The Agilent powermeter has a pre-defined Bluetoothsetup stored in non-volatile memory,while its gate setup and control function allows closer analysis of the Bluetooth signal.
Note: The output power results are to be expressed in equivalentisotropically radiated power (EIRP).Since EIRP is a measure of the radiated power of the system, itincludes the effects of the transmitter,cable loss, and antenna gain. When doing tests that use direct port-to-port connections, the gain of the antenna must be added to allmeasurements to assure that theoverall system will not exceed thepower output specifications.
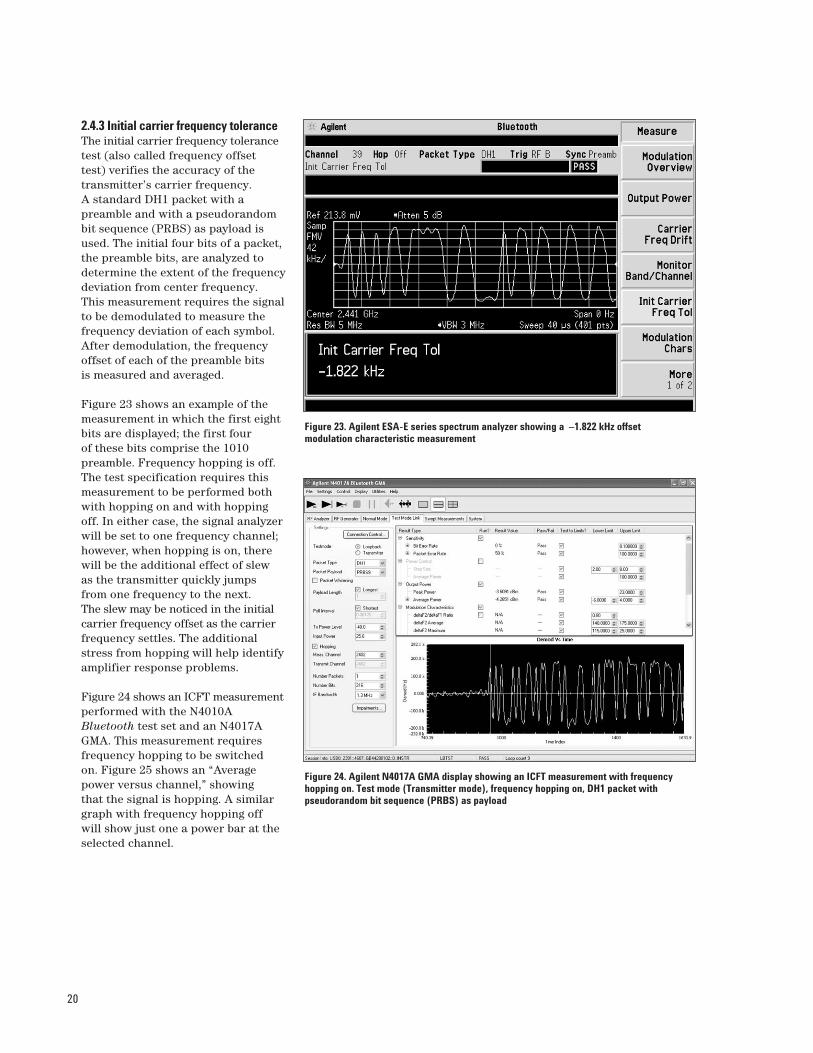
2.2.2 Power densityThe power density measurement provides the peak power density in a100 kHz bandwidth. The measurementstarts with the signal analyzer in the frequency domain, a center frequency in the middle of theBluetooth frequency band, and aspan that is wide enough to view the complete band. The resolutionbandwidth is set to 100 kHz. A one-minute single sweep is performedwith the trace in max hold. The peakvalue of the trace can be found usingpeak detection. This frequencybecomes the analyzer’s new centerfrequency. Figure 16 illustrates thisportion of the measurement, in whichthe flatness error in the signal can be readily identified.
15
Figure 15. Agilent 89600 display of peak power measurement of a 2 Mb/s Bluetooth EDR packet. (Device setup: CF = 2.441 GHz, 1 dB/div, sweep time 380 µs, triggering on IF ch 1, delay = 10 µs)
Figure 16. Agilent ESA-E display of power density measurement (Device setup: CF = 2441 MHz, span = 240 MHz, RBW = 1 MHz, VBW = 1 MHz, peak detector, trigger free run, trace on max hold, sweep time = 72 ms, continuous sweep)

The test then calculates the averagepower over at least 80 percent of the GFSK and DQPSK sections of the packet. This is then repeated atthe middle and highest operating frequencies. The whole procedure isrepeated again on the lowest powersetting of the DUT transmitter. Thistest can be performed using theAgilent N4010A and the N4017AGMA software. The test can also beperformed using a N4010A and an89600 vector signal analyzer asshown in Figure 17.
The output from the six pairs of tests is expected to comply with thefollowing measurement condition:(PGFSK – 4 dB) ≤ PDPSK ≤ (PGFSK + 1 dB)
2.3 Transmit output spectrumThe transmit output spectrum measurements analyze the power levels in the frequency domain toensure that out-of-channel emissionsare minimized. This helps reduceoverall system interference andensure regulatory compliance. Themeasurements compare the device’soutput power spectrum to a predefinedmask that has the characteristicsshown in Table 8.
As summarized in Table 4, theBluetooth specification splits the test into three parts:
1. frequency range2. –20 dB bandwidth3. adjacent channel power
The first two tests use peak detection,while adjacent channel power usesaverage detection. The last two testsuse a max hold mode, while frequencyrange uses an averaging mode.
2.3.1 Frequency rangeFor the frequency range test, the carrier is set to the upper and lowerchannels. Having sampled longenough to capture the highest RF levels, a power density check is made.The signal must be below –80 dBm/HzEIRP at 2400 MHz (or 2446.5 MHz forFrance) and at 2483.5 MHz.
2.2.3 Power controlPower control tests allow for testingor calibration to be performed on the level control circuitry. The powercontrol test is only needed for devicesthat support power control. Powercontrol is performed in the samemanner as the average power measurement, but at three discretefrequency channels (lowest, mid, andhighest operating frequency). Thepower control test verifies power levels and power control step sizes to ensure that they are within the specified range. With a link established, the Agilent N4010ABluetooth test set can adjust thepower level of the DUT and performthe test stand alone.
Points to note relating to power controlare that all Bluetooth modules needto have a properly functioning RSSIdetector, and that the signaling uses an incremental, not absolute,command.
2.2.4 EDR relative transmit powerEDR transmissions have both GFSKand DQPSK modulation within onepacket. This test allows the device to be tested to ensure that the transmission power of each modulationtype is within an acceptable range.The DUT transmits the longest supported packet type with initialsettings at maximum power transmission on the lowest Tx frequency. There is no frequency hopping and the center frequency isat the DUT transmit frequency. Thesweep time for the test is the lengthof the packet being used.
16
Figure 17. Agilent 89600 vector signal analyzer showing an EDR relative transmit power measurement
Table 8. Outline spectrum mask requirements
Frequency offset Transmit powerM ± [550 – 1450 kHz] –20 dBc|M – N| = 2 –20 dBm|M – N| ≥ 3 –40 dBm
Note: M is the integer channel number of thetransmitting channel and N is the integer channel number of the adjacent channel that is being measured.

With a proprietary algorithm, theAgilent ESA-E spectrum analyzerprovides an ACP measurement solution by pressing a single button. It makes the complex ACPmeasurement easy and provides an ideal tool for precompliance tests.
Figure 19 shows an ACP measurementperformed for channel 3 (M = 3). The condition PTX (f) ≤ –20 dBm ischecked for channel 1 and 5 (N = 1,5)and the condition PTX (f) ≤ –40 dBmis verified for the rest of the channels(N = 0,6,7,...78). The validation of thistest is notified by a flag “PASS.”
2.3.2 –20 dB bandwidthUsing narrower measurement filters, the –20 dB bandwidth test is performed at the lowest, middle,and highest frequency channels.Using a 2 MHz span, the peak RFlevel is recorded. The frequencypoints above and below this, wherethe level has dropped by 20 dB, mustbe less than 1 MHz apart. Figure 18shows the type of waveform that will be observed. When viewing theoutput spectrum, some asymmetry on the spectral display may be noticed.This is due to the non-whitened parts of the burst, such as the header.
If an EDR signal is tested using thesespecifications it will fail the test sincethe –20 dB bandwidth is wider for aDPSK than a standard FM burst. Foran EDR packet transmission the FCC has specified that the occupiedbandwidth has been relaxed to 1.5 MHz for an EDR signal.
2.3.3 Adjacent channel powerThe adjacent channel power (ACP)test is the most complex of the threemeasurements. Test transmissionsare made on the middle channel and3 MHz inside the upper and lowerband limits — for example, channels 3 and 75. Starting with RF channel 0,ten level measurements are made at offsets from the carrier of –450 to +450 kHz. The results aresummed. The measurement channelis incremented by 1 MHz and theprocess repeated until the top of theband is reached. As mentioned inTable 8, with the DUT transmittingon channel M and the adjacent power measured on channel N, thefollowing conditions must be verifiedfor compliance:
PTX (f) ≤ –20 dBm for |M-N| = 2PTX (f) ≤ –40 dBm for |M-N| ≥ 3
17
Figure 18. A –20 dB output spectrum bandwidth measurement using Agilent ESA-E with the measurement personality for Bluetooth wireless technology (Device setup: CF = 2.402 GHz, span = 2 MHz, RBW 10 kHz, VBW = 30)
Figure 19. Agilent ESA-E series spectrum analyzer showing an ACP measurement performed on channel 39. The upper window provides an ACP spectrum (measured power versus channel) and the lower window an ACP numeric summary table listing. The latter can be extended to see the complete list of channels.

The frequencies of each 8 bitsequence in the payload are measured and averaged together.Then the maximum deviation fromthe average for these bits is recordedas ∆F1max for the pattern 00001111and as ∆F2max for the pattern01010101. Finally, an average of the maximum deviation values is
computed and recorded as ∆F1avg forthe pattern 00001111 and as ∆F2avg
for the pattern 01010101. Both themaximum deviations and the averageof the maximum deviations are used in the result. This procedure isperformed over a period of at least 10 packets.
2.4 Modulation testsBluetooth modulation measurementsconsist of standard GFSK tests thatmeasure modulation characteristics,initial carrier frequency tolerance(ICFT) and carrier frequency drift.The DPSK modulation tests consist of EDR carrier frequency stabilityand modulation accuracy and EDRdifferential phase encoding.Modulation measurements reflect the performance of the modulatorcircuitry as well as the stability of thelocal oscillator. Both the modulatorand the VCO may be affected by digital noise on the power supply or by the transmit power bursts. Care is needed in the radio design toavoid frequency pulling by the powersupply. Verification of modulationrequires the ability to demodulate theBluetooth signal so that the frequencyof each bit can be determined.
2.4.1 Modulation characteristicsThe modulation characteristics test isa frequency deviation measurement.For modulation characteristics, twosets of a repeating 8-bit sequence are used in the payload. These are00001111 and 10101010. The combination of the two sequenceschecks both the modulator performance and the pre-modulationfiltering. More detail can be found in the introduction of this section(Transmitter measurements) concerning the kind of stress mechanisms provided by differenttypes of patterns.
Modulation characteristics processThis test procedure requires usingthe longest supported packets (using the longest supported payload length) and running themeasurement at the lowest, middle,and highest operating frequency. For each of these three frequencies,the following process is performedfor the 00001111 payload sequenceand repeated for the 01010101 payload sequence:
18
Figure 20a. Screen capture from N4017A of modulation characteristics measurement.
Figure 20b. Modulation characteristics measurement using N4010A Bluetooth test set and Agilent N4017 GMA software. (Setup: loopback mode, frequency hopping OFF, channel 0, DH5 packet, maximum payload length (339), payload pattern (00001111 forupper graph and 10101010 for lower graph.) A change of the type of payload can be done without breaking the connection with the Bluetooth DUT.

2.4.2 Modulation qualityVector signal analyzers have the ability to provide comprehensivemodulation quality measurements,which can detect, quantify, and helptrack down the sources of signalproblems such as intermodulationdue to transmitter interference, powersupply noise modulation, and powerand stability at antenna mismatch.Although not directly a part of the
Bluetooth Test Specification, modulation quality measurementssuch as FSK error, magnitude error,and the eye diagram are valuabletroubleshooting tools. Figure 22 provides a four-display view of ademodulation measurement on aBluetooth signal with frequency driftimpairment. The frequency drift iseasily seen in the lower left display.
Then the following measurement conditions are verified to ensure the validation of the modulationcharacteristics:
1. 140 kHz ≤ ∆f1avg ≤ 175 kHz2. ∆f2max ≥ 115 kHz3. ∆f2avg/∆f1avg ≥ 0.8
The N4010A Bluetooth test set provides the ability to perform thistest automatically. An exampleof a modulation characteristics measurement is shown in Figures 20aand 20b. The upper part displays amodulation graph for the payloadsequence 00001111 with a calculationof ∆F1max and ∆F1avg. The lower partdisplays identical results for thesequence 10101010.
Similarly, by using the Bluetoothmeasurement personality for theAgilent ESA-E spectrum analyzer,this measurement can be performedin a few keystrokes. Presented with a 10101010 [F2] payload, both themaximum deviation ∆F2max and theaverage of the maximum deviations∆F2avg are displayed on the screen.The result can then be stored and aburst with the 11110000 pattern canbe presented to the analyzer. Themeasurement process is repeatedwith this new 11110000 [F1] payloadsequence. (F1max and (F1avg are com-puted and displayed. Then the ratio∆F2avg /∆F1avg is generated using thestored ∆F2avg. If this ratio is below 80 percent, a “FAIL” flag is displayed.Figure 21 shows a display of theAgilent ESA-E spectrum analyzerperforming this modulation characteristics measurement. TheESA-E is measuring the 11110000pattern and comparing it with the(previously stored; see “Hold result”menu) 10101010 pattern.
19
Figure 21. Agilent ESA-E series spectrum analyzer display showing the modulation characteristics measurements
Figure 22. Agilent 89600 display of demodulation quality test
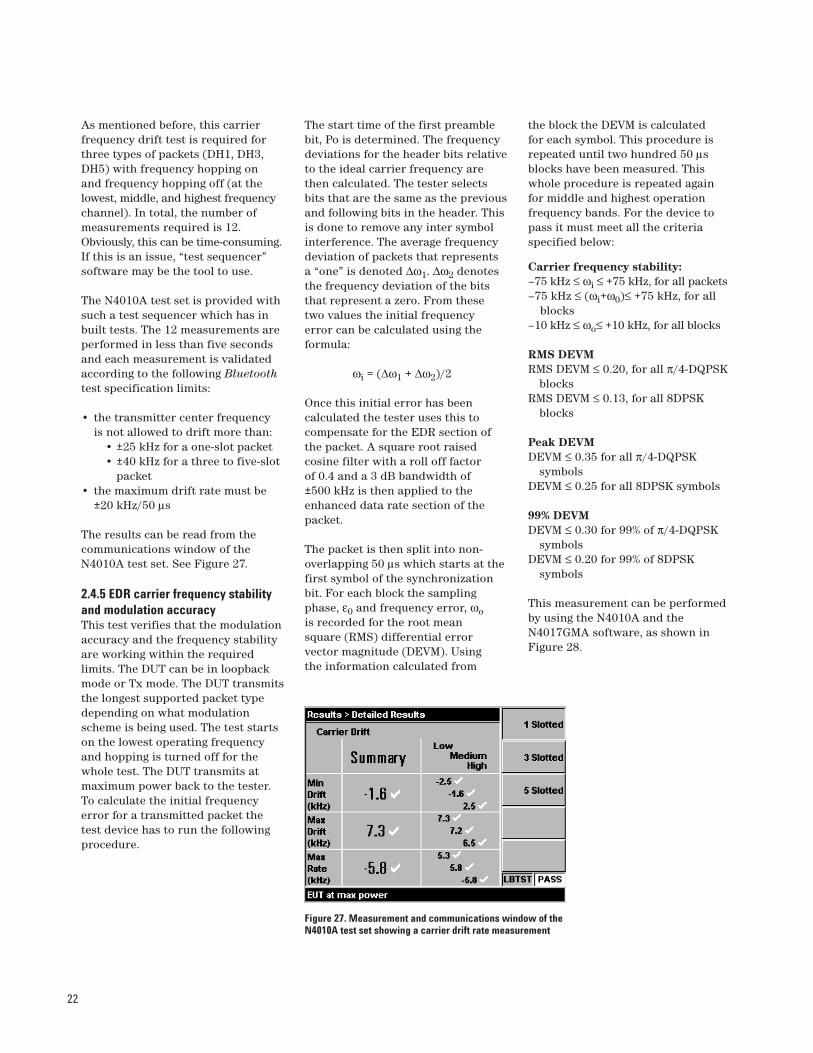
2.4.3 Initial carrier frequency toleranceThe initial carrier frequency tolerancetest (also called frequency offset test) verifies the accuracy of thetransmitter’s carrier frequency. A standard DH1 packet with a preamble and with a pseudorandombit sequence (PRBS) as payload isused. The initial four bits of a packet,the preamble bits, are analyzed todetermine the extent of the frequencydeviation from center frequency. This measurement requires the signalto be demodulated to measure thefrequency deviation of each symbol.After demodulation, the frequencyoffset of each of the preamble bits is measured and averaged.
Figure 23 shows an example of themeasurement in which the first eightbits are displayed; the first four of these bits comprise the 1010 preamble. Frequency hopping is off.The test specification requires thismeasurement to be performed bothwith hopping on and with hoppingoff. In either case, the signal analyzerwill be set to one frequency channel;however, when hopping is on, therewill be the additional effect of slew as the transmitter quickly jumps from one frequency to the next. The slew may be noticed in the initial carrier frequency offset as the carrier frequency settles. The additionalstress from hopping will help identifyamplifier response problems.
Figure 24 shows an ICFT measurementperformed with the N4010ABluetooth test set and an N4017AGMA. This measurement requires frequency hopping to be switched on. Figure 25 shows an “Averagepower versus channel,” showing that the signal is hopping. A similargraph with frequency hopping off will show just one a power bar at theselected channel.
20
Figure 23. Agilent ESA-E series spectrum analyzer showing a –1.822 kHz offset modulation characteristic measurement
Figure 24. Agilent N4017A GMA display showing an ICFT measurement with frequencyhopping on. Test mode (Transmitter mode), frequency hopping on, DH1 packet withpseudorandom bit sequence (PRBS) as payload

This measurement is repeated withthe lowest, middle, and highest operating frequencies, first with hopping off, then with hopping on. It is also repeated for varying packetlengths: one-slot packet (DH1), three-slot packet (DH3), and five-slotpacket (DH5).
Software control makes this repetitivemeasurement easier. Figure 26 provides an example of a carrier frequency drift measurement using theBluetooth measurement personality ofthe ESA-E series spectrum analyzer.
Both the N4010A Bluetooth test setand the ESA-E spectrum analyzer use the same algorithm to calculateinitial carrier frequency tolerance.The Agilent N4010A can conduct the full ICFT test standalone. Analternative method of measuringICFT to a pre-compliance level isavailable using Agilent 89400 and89600 series vector signal analyzersin demodulation mode. This is a more generic method. With theirresult length set to the minimumnumber of symbols (10), these analyzers provide the carrier offset at a glance in their symbol error display. Since this minimum numberof symbols is greater than four, theuser may notice less variation on theresult due to noise. It is importantthat the 0101 pattern is continued.The carrier offset result, which isprovided in the summary table of the display shown in Figure 22, provides an example of this initialcarrier offset measurement.
2.4.4 Carrier frequency driftCarrier frequency drift consists of verification of the transmitter center frequency drift with a packet.As the two previous tests, modulationcharacteristics and initial carrier frequency tolerance, carrier frequency drift is also measured as a demodulated signal (frequencyversus time).
The payload data consists of a repeating 4-bit 1010 sequence. To perform the measurement, theabsolute frequencies of the four preamble bits are measured and integrated; this provides the initialcarrier frequency. Then the absolutefrequencies of each successive 10-bitpart in the payload are measured and integrated. The frequency drift is the difference between the averagefrequency of the four preamble bitsand the average frequency of any ten bits in the payload field. The maximum drift rate is also checked,and is defined as the differencebetween any two adjacent 10-bitgroups within the payload field.
21
Figure 25. Agilent N4017A GMA display showing a power versus channel graph showshow the signal is hopping over 78 channels
Figure 26. Agilent ESA-E spectrum analyzer display of frequency drift showing an initial carrier frequency (ICFT) of 334.7Hz, –5.716 kHz drift across the burst and 4.287 kHzmaximum drift rate. (Device setup: CF = 2.402 GHz, triggered on p0 bit; F indicates maximum frequency drift limit exceeded)
The start time of the first preamblebit, Po is determined. The frequencydeviations for the header bits relativeto the ideal carrier frequency arethen calculated. The tester selectsbits that are the same as the previousand following bits in the header. Thisis done to remove any inter symbolinterference. The average frequencydeviation of packets that represents a “one” is denoted ∆ω1. ∆ω2 denotes the frequency deviation of the bitsthat represent a zero. From these two values the initial frequency error can be calculated using the formula:
ωi = (∆ω1 + ∆ω2)/2
Once this initial error has been calculated the tester uses this to compensate for the EDR section ofthe packet. A square root raisedcosine filter with a roll off factor of 0.4 and a 3 dB bandwidth of ±500 kHz is then applied to theenhanced data rate section of thepacket.
The packet is then split into non-overlapping 50 µs which starts at thefirst symbol of the synchronizationbit. For each block the samplingphase, ε0 and frequency error, ωois recorded for the root mean square (RMS) differential error vector magnitude (DEVM). Using the information calculated from
the block the DEVM is calculated for each symbol. This procedure isrepeated until two hundred 50 µsblocks have been measured. Thiswhole procedure is repeated againfor middle and highest operation frequency bands. For the device topass it must meet all the criteriaspecified below:
Carrier frequency stability:–75 kHz ≤ ωi ≤ +75 kHz, for all packets–75 kHz ≤ (ωi+ω0)≤ +75 kHz, for all
blocks–10 kHz ≤ ωo≤ +10 kHz, for all blocks
RMS DEVMRMS DEVM ≤ 0.20, for all π/4-DQPSK
blocksRMS DEVM ≤ 0.13, for all 8DPSK
blocks
Peak DEVMDEVM ≤ 0.35 for all π/4-DQPSK
symbolsDEVM ≤ 0.25 for all 8DPSK symbols
99% DEVMDEVM ≤ 0.30 for 99% of π/4-DQPSK
symbolsDEVM ≤ 0.20 for 99% of 8DPSK
symbols
This measurement can be performedby using the N4010A and theN4017GMA software, as shown inFigure 28.
As mentioned before, this carrier frequency drift test is required forthree types of packets (DH1, DH3,DH5) with frequency hopping on and frequency hopping off (at thelowest, middle, and highest frequencychannel). In total, the number ofmeasurements required is 12.Obviously, this can be time-consuming.If this is an issue, “test sequencer”software may be the tool to use.
The N4010A test set is provided withsuch a test sequencer which has inbuilt tests. The 12 measurements areperformed in less than five secondsand each measurement is validatedaccording to the following Bluetoothtest specification limits:
• the transmitter center frequency is not allowed to drift more than:
• ±25 kHz for a one-slot packet• ±40 kHz for a three to five-slot
packet• the maximum drift rate must be
±20 kHz/50 µs
The results can be read from the communications window of theN4010A test set. See Figure 27.
2.4.5 EDR carrier frequency stabilityand modulation accuracyThis test verifies that the modulationaccuracy and the frequency stabilityare working within the required limits. The DUT can be in loopbackmode or Tx mode. The DUT transmitsthe longest supported packet typedepending on what modulationscheme is being used. The test startson the lowest operating frequencyand hopping is turned off for thewhole test. The DUT transmits atmaximum power back to the tester.To calculate the initial frequencyerror for a transmitted packet thetest device has to run the followingprocedure.
22
Figure 27. Measurement and communications window of the N4010A test set showing a carrier drift rate measurement

2.5 Timing testsTiming tests may be performed onBluetooth signals; these tests includeanalysis of the burst profile, phaselock loop (PLL) settling time, andother timing characteristics. Thesetests, although not part of the specifications, help R&D engineersensure that their designs meet thecriteria of their specifications.
2.5.1 Burst profileBurst rise and fall time can be measured in the time domain using a signal analyzer or a power meter.No definitions for rise time and falltimes have been developed forBluetooth wireless technology,although ramp-up and settling timesare mandated in the Bluetooth RFtest specification for a referenceBluetooth signal used for test purposes.
The conventional industry definitionof rise time is the time required torise from the 10 percent (–20 dB)amplitude point to the 90 percent (–0.9 dB) amplitude point; the falltime is defined with the same amplitude points, but in reverse. Pre-triggering allows the rise time to be easily captured and measured.There is no defined mask test for the burst profile. Some devices mayexhibit considerably faster transientsthan that shown. Excessively fastswitching will cause failures in theoutput spectrum test by creatingincreased spectrum spreading due to the sharper edges of the burst.Additional burst profile characteristicsinclude on/off ratio of burst, overshoot, burst interval, and burstrepetition frequency (see Figure 12).These characteristics can be seen indetail using the Agilent power meteranalyzer software.
2.4.6 EDR differential phase encodingThis test checks that the modulatorcorrectly differential phase codes the data. The DUT is in Tx mode withhopping turned off. A X-DH1 or an X-EV31 packet is used depending onwhat modulation scheme is used. The payload of the packet is PRBS9.The EUT is set to transmit at the lowest frequency it then transmits100 packets to the tester, whichdemodulates them and compares the data with the expected data. For the device to pass this test it has to have no errors in 99 percent of all the packets tested.
This test can be performed using the N4010A and N4017A software.The software has to be configured so that it sends the required numberof packets to comply with theBluetooth RF test specification.
1. The X is substituted for a 2 or 3 depending onwhich transfer rate is being used.
23
Figure 28. Display of the N4017A GMA when testing the modulation accuracy of a Bluetooth EDR device

2.5.2 Spectrogram measurementsFigure 29 provides a spectrogram display in which a radio transmitterexhibits poor PLL settling time atturn-on. The spectrogram is useful inanalyzing these types of conditions.The spectrogram displays frequencyon the x-axis and time on the y-axis.Amplitude is displayed through colors or shades of gray with thebrighter colors or shades indicatinghigher amplitudes.
More complex spectrograms may be created by using the time-capturecapabilities of a vector signal analyzer. This allows replaying real-time data at a slower speed.Symbol timing and rate may be analyzed in this fashion. Figure 30shows a spectrogram of a Bluetoothburst. The payload data in this example is 10101010 and these alternating patterns of ones andzeros can be seen either side of thecenter frequency. Figure 31 showsthe spectrogram of an EDR burst theFM header can be seen at the startbefore the main (π/4 PSK data packetthat covers a large portion of thespectrum.
2.5.3 EDR guardband timeEDR has a guardband which startsafter the header (see Figure 7) andends at the start of the synchronizationsequence. The guardband is between4.75 and 5.25 µs. Its purpose is to act as a buffer between the differentmodulation schemes in an EDR packet. To find the start of the synchronization sequence the frequency extremes are measuredand averaged to find the time spanthat each symbol occupies. Once thetime span is known the time for thestart bit can be found. This is thensubtracted from the time that theheader finishes to give the guardbandtime. The guard band time can bemeasured using the Agilent N4010Aand the N4017A GMA software.Figure 32 shows a graph from theN4017A GMA software.
24
Figure 29. Agilent 89441A spectrogram display for PLL settling time
Figure 30. Agilent 89600 spectrogram display for symbol timing and rate of a DH1 packet with a 10101010 payload; the lines in the payload represent the ones and zeros

25
Figure 31. Agilent 89600 spectrogram display for symbol timing and rate of a EDR 2-DH1 packet;the different modulation schemes can be seen in the spectrogram
Figure 32. This shows the Agilent N4017 GMA displaying the transition between GFSK and 8DPSK modulation schemes with the guardband separating the two modulation schemes when transmitting a 3-DH5 packet

3.1 EDR in-band spurious emissionsThis is a new test specified by theBluetooth Test Specification. The test is used to verify that the level of unwanted signal produced withinthe devices frequency range is belowa limit for the modulation schemeused. A spectrum analyzer such asthe Agilent 89600 as shown in Figure 33 is used to measure the in band spurious emissions. This isdone by using the built in emissionmark test function.
The device is set to loopback or Txmode with hopping switched off. The longest supported packet istransmitted with a PRBS9 payload.The measurements are made at 100 kHz steps between ±450 kHz of a1 MHz band on and around a center
frequency, fc. The peak value of thespectrum is recorded at each 100 kHzinterval and the maximum value orthe averaged value of peak results is taken depending on how close the 1 MHz band is to the center frequency. Once these values havebeen recorded the same process isrepeated over the mid and highestfrequency points of the operating frequency. More detail on this testcan be found in the Bluetooth TestSpecification.
For the device to pass the test theaverage at 1 MHz from the center frequency must be smaller than thepeak center frequency spectrumminus 26 dbs:
fc ± 2 MHz < –20 dBfc ± 3 MHz < –40 dB
The transceiver measurements con-sist of performing some out-of-bandspurious emissions tests. These out-of-band spurious emissions tests verify that the Bluetooth radiois operating within regulatoryrequirements. There are no out ofband spurious emissions tests in theBluetooth Test Specification it is upto the manufacturer to comply withthe standard of the country wherethe device will be in use.
The two main tests that are used to measure out of band spuriousemissions are conducted emissionsand radiated emissions. Conductedemissions are a measure of the spurious emissions generated by the device under test from its antenna or output connector.Radiated emissions are a measure of the spurious emissions leakagefrom the cabinet of the DUT.
Separate standards are specified for the USA and Europe. The USA follows the Federal CommunicationsCommission (FCC) part 15.247 standard. Europe follows theEuropean Technical StandardsInstitute (ETSI) ETS 300 328 standard.
Spurious emissions tests can be performed using a spectrum analyzerto sweep through frequency rangeslooking for spurs. The ETSI standardrequires a spectrum analyzer frequency range of up to 12.75 GHz,while the FCC standard specifies a frequency range of up to 25.0 GHz.Tests requiring compliance with the International Special Committeeon Radio Interference (CISPR) publication 16 may require electromagnetic compatibility (EMC) spectrum analyzers withquasi-peak detection. These tests are not covered in this applicationnote. Contact your local Agilent salesrepresentative for more informationon Agilent EMC products.
26
3. Transceiver Measurements
Figure 33. Agilent 89600 showing a spectrum graph which can be used to measure in band spurious emissions

• sensitivity - single-slot packets• sensitivity - multi-slot packets• carrier-to-interference (C/I)
performance• blocking performance• intermodulation performance• maximum input level• EDR sensitivity• EDR BER floor performance • EDR C/I performance• EDR maximum input level
Bit error rate (BER) is the criterionused to evaluate receiver performance.BER is determined by comparingtransmitted and received payloaddata and noting the difference in bits. The ratio of the erroneous bits to the total number of bits received is the BER.
4.1 Test conditions and setup4.1.1 Test conditionsTable 9 is a summary of the test conditions under which receivermeasurements have to be performed.
In this section, the various receivermeasurements required for Bluetooth modules are discussed.These measurements are intended to ensure the integrity of theBluetooth receiver’s performancecharacteristics. Further detail regarding the conditions under which the receiver measurements are performed can be found in theBluetooth RF Test Specification. Thereceiver measurements specified forBluetooth wireless technologyinclude the following:
27
4. Receiver Measurements
Table 9. Receiver test parameters
Receiver tests Frequency hopping Test mode Packet type Payload data BER measurement
Sensitivity - Single-slot packets Off Loopback DH1 PRBS 9 < 0.1%RCV/CA/01/C On (optional)
Sensitivity - Multi-slot packets Off Loopback DH5 PRBS 9 < 0.1%RCV/CA/02/C On (optional)
C/I performance Off Loopback Longest supported PRBS 9 < 0.1%RCV/CA/03/C
Blocking performance Off Loopback DH1 PRBS 9 <0.1%RCV/CA/04/C
Intermodulation performance Off Loopback DH1 PRBS 9 < 0.1%RCV/CA/05/C
Maximum input level Off Loopback DH1 PRBS 9 < 0.1%RCV/CA/06/C
EDR receiver requirements
EDR sensitivity Off Loopback 2-DHx or 2–Evx\3-DHx or 3–Evx(1) PRBS9 < 7x10⁻⁵ (2) or < 10–4(3)
RCV/CA/07/C
EDR BER floor performance Off Loopback 2-DHx or 2–Evx\3–DHx(1) PRBS9 < 7x10⁻⁶ (4) or < 10–5 (5)
RCV/CA/08/C
EDR C/I performance Off Loopback 2-DHx or 2–Evx\3-DHx(1) PBRS9 < 10–3 less than 5 times withinTP/RCV/CA/09/C 2 Mhz from the wanted signal
EDR maximum input level Off Loopback 2-DHx or 2–Evx\3-DHx(1) PBRS9 < 10–3
RCV/CA/10/C
1. The packet to be used depends on what modulation scheme is being tested number 2 prefix for π/4 DQPSK and number 3 prefix for 8DPSK2. After 1,600,000 data bits3. After 16,000,000 data bits4. After 8,000,000 data bits5. After 160,000,000 data bits
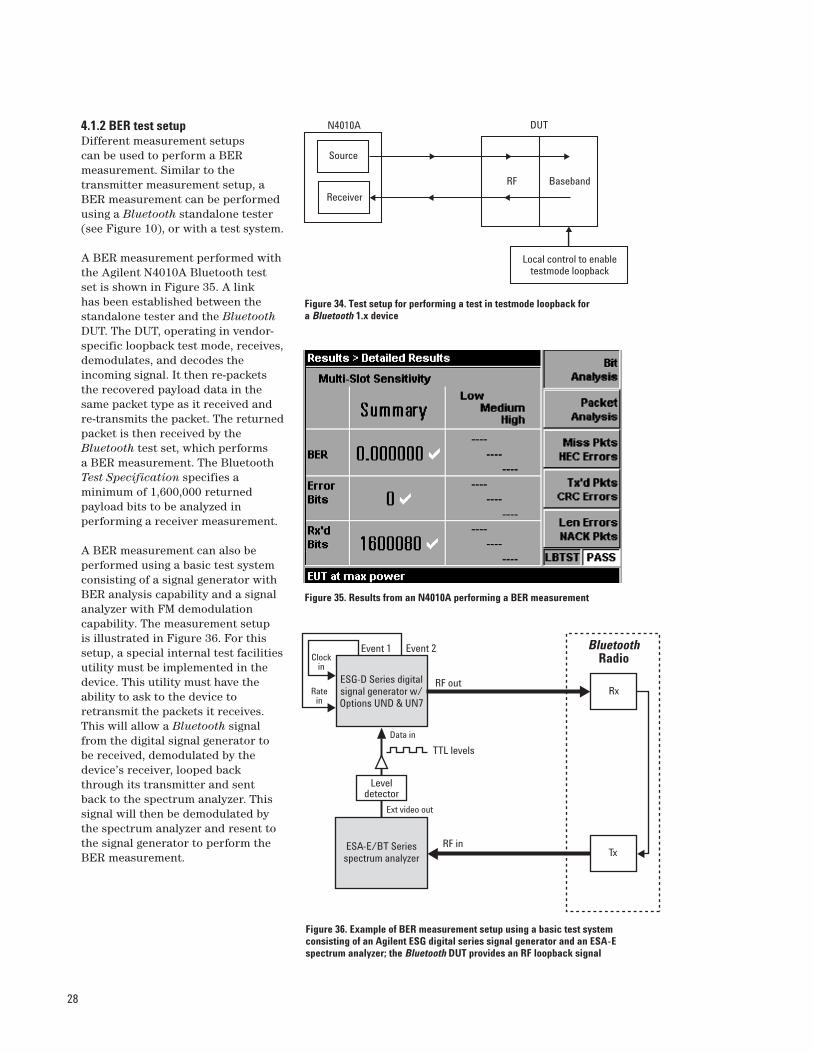
4.1.2 BER test setupDifferent measurement setups can be used to perform a BER measurement. Similar to the transmitter measurement setup, aBER measurement can be performedusing a Bluetooth standalone tester(see Figure 10), or with a test system.
A BER measurement performed withthe Agilent N4010A Bluetooth test set is shown in Figure 35. A link has been established between thestandalone tester and the BluetoothDUT. The DUT, operating in vendor-specific loopback test mode, receives,demodulates, and decodes the incoming signal. It then re-packetsthe recovered payload data in thesame packet type as it received andre-transmits the packet. The returnedpacket is then received by theBluetooth test set, which performs a BER measurement. The BluetoothTest Specification specifies a minimum of 1,600,000 returned payload bits to be analyzed in performing a receiver measurement.
A BER measurement can also be performed using a basic test systemconsisting of a signal generator withBER analysis capability and a signalanalyzer with FM demodulation capability. The measurement setup is illustrated in Figure 36. For thissetup, a special internal test facilitiesutility must be implemented in thedevice. This utility must have theability to ask to the device to retransmit the packets it receives.This will allow a Bluetooth signalfrom the digital signal generator to be received, demodulated by thedevice’s receiver, looped backthrough its transmitter and sent back to the spectrum analyzer. Thissignal will then be demodulated bythe spectrum analyzer and resent tothe signal generator to perform theBER measurement.
28
Figure 35. Results from an N4010A performing a BER measurement
Figure 34. Test setup for performing a test in testmode loopback for a Bluetooth 1.x device
N4010A DUT
BasebandRF
Source
Receiver
Local control to enabletestmode loopback
Figure 36. Example of BER measurement setup using a basic test system consisting of an Agilent ESG digital series signal generator and an ESA-Espectrum analyzer; the Bluetooth DUT provides an RF loopback signal
Event 1 Event 2
RF out
Data in
TTL levels
RF in
Ext video out
Leveldetector
ESA-E/BT Seriesspectrum analyzer
ESG-D Series digitalsignal generator w/Options UND & UN7
Ratein
Clockin
Rx
Tx
BluetoothRadio

PER measurements do not requirethe Bluetooth DUT to operate inLoopback mode, they can be performed using the Bluetooth testset operating in either Transmittertest mode or in Normal mode.Although the PER measurement is not part of the Bluetooth TestSpecification, it still provides insight into the performance of the Bluetooth receiver.
PER measurement is performed bythe Bluetooth test set as follows. In transmitter (Tx) Test mode, theBluetooth DUT is instructed by theBluetooth test set to transmit specificpacket types. This instruction is sentby the Bluetooth test set via POLLpackets. A POLL packet has no payload and therefore consists of the channel access code and packetheader only. Two situations have tobe taken into account. The first one is the DUT does not receive the POLLpacket (power level too low); in thiscase the DUT may just not transmitany Tx packet. The second situationis the DUT receives the POLL packetbut does not read it correctly. Forinstance, it does not detect the access code of the POLL packet. In this case, the DUT will send backthe corresponding Tx packet but withthe acknowledgment indication bit(ARQN bit) set to NAK (negativeacknowledge, ARQN = 0). As a result,
the Bluetooth test set will determinethe PER by comparing the number of POLL packets sent with the number of Tx packets received from the DUT, and by analyzing howmany Tx packets have a ARQN bitequal to 0 (NAK):
100 x [number of Tx packets missing + number of Tx packets with a ARQN = 0]
PER%=
(In Tx mode)number of POLL packets sent
A similar calculation can be performed in Normal mode. InNormal mode, the test set sends some POLL packets. If the DUTreceives them and reads them correctly, it will send back a NULLpacket for each good reading. ThePER calculation will be performed by the test set in Normal mode bycomparing the number of POLL packets sent with the number ofNULL packets received.
100 x [number of POLL packets sent – number of NULL packets receivedPER%
=(In Normalnumber of POLL packets sentmode)
PER measurements can be recordedusing the Agilent N4010A andN4017A GMA software in normal,test or RF analyzer mode.
In both of the previous measurementsetups, the Bluetooth device musthave the ability to retransmit therecovered data from the received signal. It must support Loopback test mode (setup used in Figure 35)or have a loopback test facility internally implemented (setup ofFigure 36). If this is not the case, a different setup must be used.
Figure 37 provides an example of aBER measurement setup in which the Bluetooth DUT is simply acting as a standard receiver. No loopback is performed between its receiver and its transmitter. The BER measurement is performed using the Agilent ESG-D signal generatorseries’ internal BER analyzer (Option UN7).
The Bluetooth DUT receives anddemodulates the signal, then providesaccess to the Bluetooth baseband signal at the baseband processor.Similar to the previous setup, theBluetooth packets at the output ofthe baseband processor are fed to thedata input of the ESG-D’s internalBER analyzer.
As an alternative, packet error rate(PER) measurements instead of BER measurements can be madewhen the Bluetooth device does notsupport Loopback mode. Because
29
Figure 37. Measurement setup showing how a BER measurement can be performed when the Bluetooth DUT receiver provides access to the Bluetoothbaseband signal at the baseband processor output
Bluetooth radioreceiver section
ESG-D Series digitalsignal generator w/Options UND & UN7
DMdemodulator
Thresholddetector
Basebandprocessor
Control
Data
Clock
Datain
Gatein
Clockin
Event 2
Event 1
The Agilent N4010A automaticallyapplies these impairments to aBluetooth signal to enable automaticsensitivity testing. (See Figure 39.) To meet the specifications, the receiver’s BER must not exceed 0.1 percent when the transmit poweris such that the signal level at thereceiver input is –70 dBm. This is
referred to as the reference sensitivitylevel and all Bluetooth receivers mustmeet this specification. The actualsensitivity of a Bluetooth receiver is the signal level required by thereceiver to produce a 0.1 percentBER. The test is performed at thelowest, middle, and highest operatingfrequencies of the DUT.
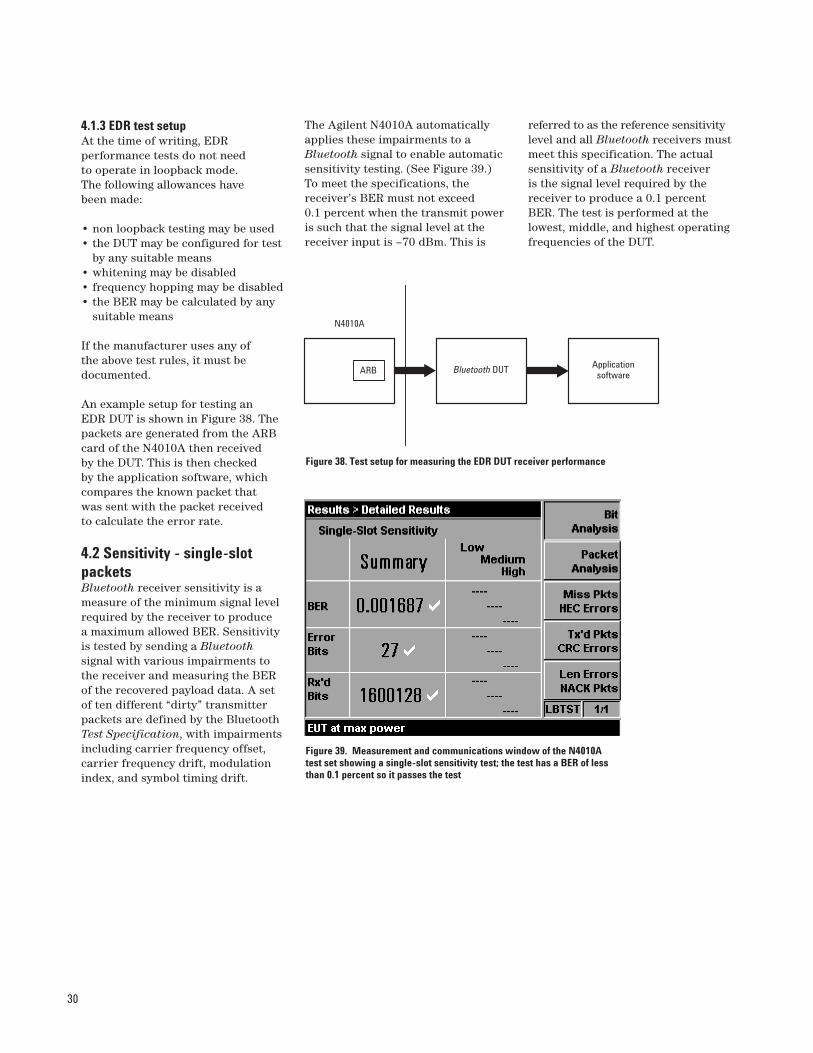
4.1.3 EDR test setupAt the time of writing, EDR performance tests do not need to operate in loopback mode. The following allowances have been made:
• non loopback testing may be used• the DUT may be configured for test
by any suitable means• whitening may be disabled• frequency hopping may be disabled• the BER may be calculated by any
suitable means
If the manufacturer uses any of the above test rules, it must be documented.
An example setup for testing an EDR DUT is shown in Figure 38. Thepackets are generated from the ARBcard of the N4010A then received by the DUT. This is then checked by the application software, whichcompares the known packet that was sent with the packet received to calculate the error rate.
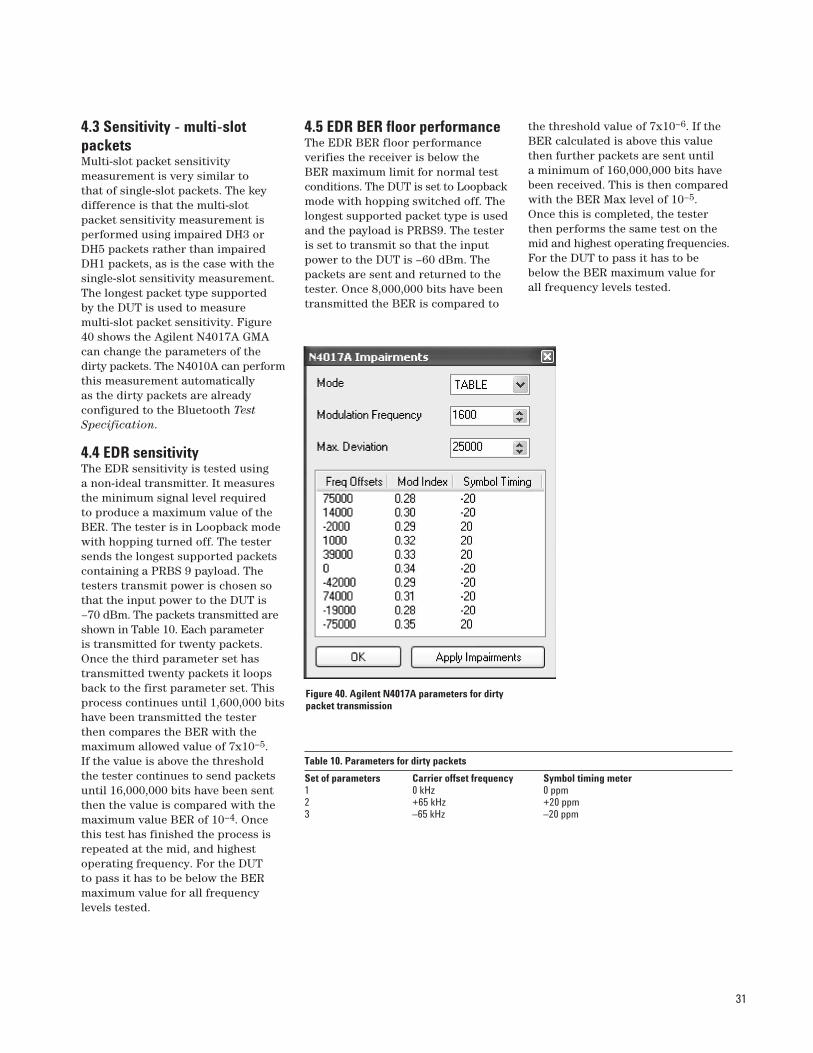
4.2 Sensitivity - single-slotpacketsBluetooth receiver sensitivity is ameasure of the minimum signal levelrequired by the receiver to produce a maximum allowed BER. Sensitivityis tested by sending a Bluetoothsignal with various impairments tothe receiver and measuring the BERof the recovered payload data. A setof ten different “dirty” transmitterpackets are defined by the BluetoothTest Specification, with impairmentsincluding carrier frequency offset,carrier frequency drift, modulationindex, and symbol timing drift.
30
Figure 38. Test setup for measuring the EDR DUT receiver performance
N4010A
ARB Bluetooth DUT Applicationsoftware
Figure 39. Measurement and communications window of the N4010A test set showing a single-slot sensitivity test; the test has a BER of less than 0.1 percent so it passes the test
4.5 EDR BER floor performanceThe EDR BER floor performance verifies the receiver is below the BER maximum limit for normal testconditions. The DUT is set to Loopbackmode with hopping switched off. Thelongest supported packet type is usedand the payload is PRBS9. The testeris set to transmit so that the inputpower to the DUT is –60 dBm. Thepackets are sent and returned to thetester. Once 8,000,000 bits have beentransmitted the BER is compared to
the threshold value of 7x10⁻⁶. If theBER calculated is above this valuethen further packets are sent until a minimum of 160,000,000 bits havebeen received. This is then comparedwith the BER Max level of 10–5. Once this is completed, the testerthen performs the same test on themid and highest operating frequencies.For the DUT to pass it has to bebelow the BER maximum value for all frequency levels tested.
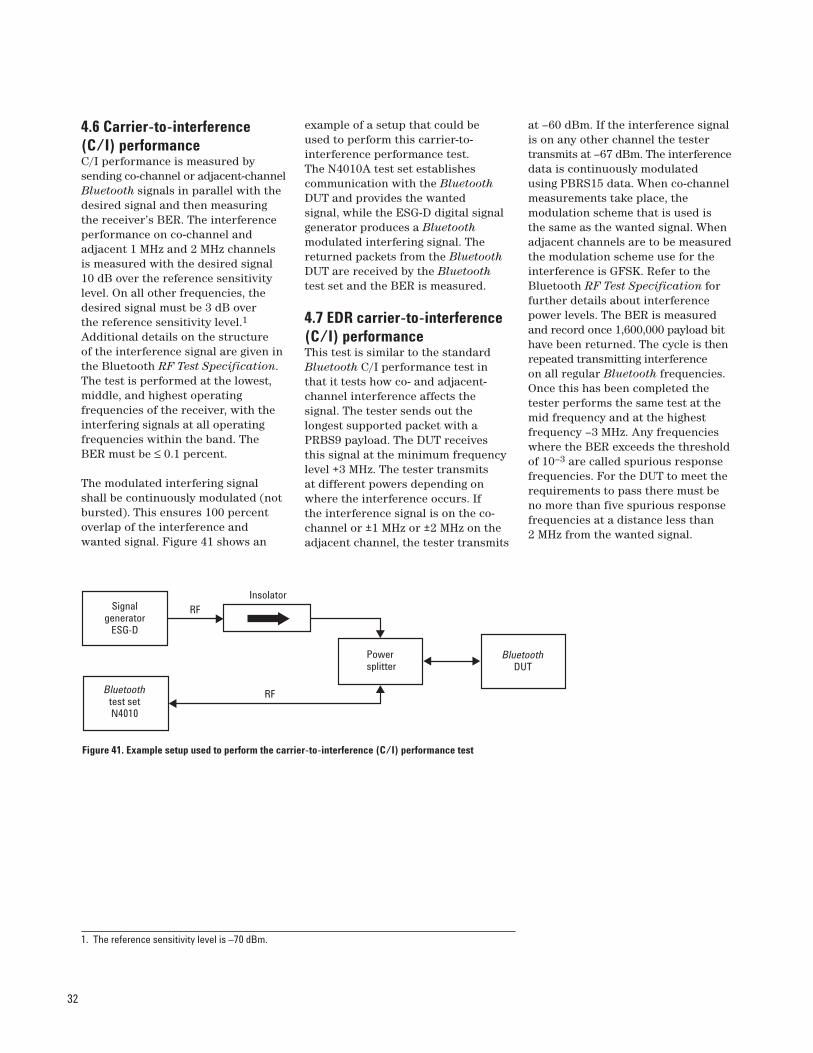
4.3 Sensitivity - multi-slotpacketsMulti-slot packet sensitivity measurement is very similar to that of single-slot packets. The keydifference is that the multi-slot packet sensitivity measurement isperformed using impaired DH3 orDH5 packets rather than impairedDH1 packets, as is the case with thesingle-slot sensitivity measurement.The longest packet type supported by the DUT is used to measure multi-slot packet sensitivity. Figure40 shows the Agilent N4017A GMAcan change the parameters of thedirty packets. The N4010A can performthis measurement automatically as the dirty packets are already configured to the Bluetooth TestSpecification.
4.4 EDR sensitivityThe EDR sensitivity is tested using a non-ideal transmitter. It measuresthe minimum signal level required to produce a maximum value of theBER. The tester is in Loopback modewith hopping turned off. The testersends the longest supported packetscontaining a PRBS 9 payload. Thetesters transmit power is chosen sothat the input power to the DUT is–70 dBm. The packets transmitted areshown in Table 10. Each parameter is transmitted for twenty packets.Once the third parameter set hastransmitted twenty packets it loopsback to the first parameter set. Thisprocess continues until 1,600,000 bitshave been transmitted the tester then compares the BER with themaximum allowed value of 7x10⁻⁵. If the value is above the threshold the tester continues to send packetsuntil 16,000,000 bits have been sentthen the value is compared with themaximum value BER of 10–4. Oncethis test has finished the process isrepeated at the mid, and highestoperating frequency. For the DUT to pass it has to be below the BERmaximum value for all frequency levels tested.
31
Figure 40. Agilent N4017A parameters for dirty packet transmission
Table 10. Parameters for dirty packets
Set of parameters Carrier offset frequency Symbol timing meter1 0 kHz 0 ppm2 +65 kHz +20 ppm3 –65 kHz –20 ppm
example of a setup that could be used to perform this carrier-to-interference performance test. The N4010A test set establishes communication with the BluetoothDUT and provides the wanted signal, while the ESG-D digital signalgenerator produces a Bluetoothmodulated interfering signal. Thereturned packets from the BluetoothDUT are received by the Bluetoothtest set and the BER is measured.
4.7 EDR carrier-to-interference(C/I) performanceThis test is similar to the standardBluetooth C/I performance test inthat it tests how co- and adjacent-channel interference affects the signal. The tester sends out thelongest supported packet with aPRBS9 payload. The DUT receivesthis signal at the minimum frequencylevel +3 MHz. The tester transmits at different powers depending onwhere the interference occurs. If the interference signal is on the co-channel or ±1 MHz or ±2 MHz on theadjacent channel, the tester transmits
at –60 dBm. If the interference signalis on any other channel the testertransmits at –67 dBm. The interferencedata is continuously modulated using PBRS15 data. When co-channelmeasurements take place, the modulation scheme that is used is the same as the wanted signal. Whenadjacent channels are to be measuredthe modulation scheme use for theinterference is GFSK. Refer to theBluetooth RF Test Specification for further details about interferencepower levels. The BER is measuredand record once 1,600,000 payload bithave been returned. The cycle is thenrepeated transmitting interferenceon all regular Bluetooth frequencies.Once this has been completed thetester performs the same test at themid frequency and at the highest frequency –3 MHz. Any frequencieswhere the BER exceeds the thresholdof 10–3 are called spurious responsefrequencies. For the DUT to meet therequirements to pass there must beno more than five spurious responsefrequencies at a distance less than 2 MHz from the wanted signal.
4.6 Carrier-to-interference(C/I) performanceC/I performance is measured bysending co-channel or adjacent-channelBluetooth signals in parallel with thedesired signal and then measuringthe receiver’s BER. The interferenceperformance on co-channel and adjacent 1 MHz and 2 MHz channelsis measured with the desired signal10 dB over the reference sensitivitylevel. On all other frequencies, thedesired signal must be 3 dB over the reference sensitivity level.1
Additional details on the structure of the interference signal are given inthe Bluetooth RF Test Specification.The test is performed at the lowest,middle, and highest operating frequencies of the receiver, with theinterfering signals at all operatingfrequencies within the band. TheBER must be ≤ 0.1 percent.
The modulated interfering signalshall be continuously modulated (notbursted). This ensures 100 percentoverlap of the interference and wanted signal. Figure 41 shows an
32
Figure 41. Example setup used to perform the carrier-to-interference (C/I) performance test
InsolatorRF
RF
Powersplitter
BluetoothDUT
Signalgenerator
ESG-D
Bluetoothtest setN4010
1. The reference sensitivity level is –70 dBm.
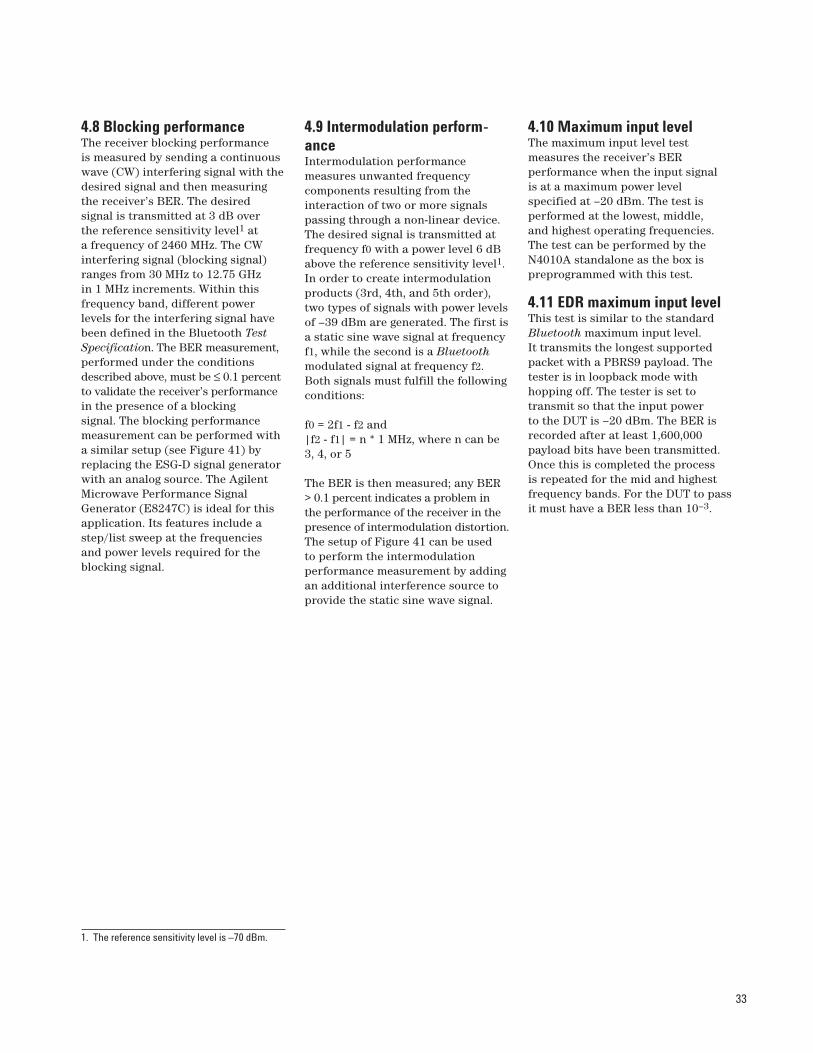
4.9 Intermodulation perform-anceIntermodulation performance measures unwanted frequency components resulting from the interaction of two or more signalspassing through a non-linear device.The desired signal is transmitted atfrequency f0 with a power level 6 dBabove the reference sensitivity level1.In order to create intermodulationproducts (3rd, 4th, and 5th order),two types of signals with power levelsof –39 dBm are generated. The first isa static sine wave signal at frequencyf1, while the second is a Bluetoothmodulated signal at frequency f2.Both signals must fulfill the followingconditions:
f0 = 2f1 - f2 and |f2 - f1| = n * 1 MHz, where n can be3, 4, or 5
The BER is then measured; any BER> 0.1 percent indicates a problem inthe performance of the receiver in thepresence of intermodulation distortion.The setup of Figure 41 can be used to perform the intermodulation performance measurement by addingan additional interference source toprovide the static sine wave signal.
4.10 Maximum input levelThe maximum input level test measures the receiver’s BER performance when the input signal is at a maximum power level specified at –20 dBm. The test is performed at the lowest, middle, and highest operating frequencies.The test can be performed by theN4010A standalone as the box is preprogrammed with this test.
4.11 EDR maximum input levelThis test is similar to the standardBluetooth maximum input level. It transmits the longest supportedpacket with a PBRS9 payload. Thetester is in loopback mode with hopping off. The tester is set to transmit so that the input power to the DUT is –20 dBm. The BER isrecorded after at least 1,600,000 payload bits have been transmitted.Once this is completed the process is repeated for the mid and highestfrequency bands. For the DUT to passit must have a BER less than 10–3.
4.8 Blocking performanceThe receiver blocking performance is measured by sending a continuouswave (CW) interfering signal with thedesired signal and then measuringthe receiver’s BER. The desired signal is transmitted at 3 dB over the reference sensitivity level1 at a frequency of 2460 MHz. The CWinterfering signal (blocking signal)ranges from 30 MHz to 12.75 GHz in 1 MHz increments. Within this frequency band, different power levels for the interfering signal havebeen defined in the Bluetooth TestSpecification. The BER measurement,performed under the conditionsdescribed above, must be ≤ 0.1 percentto validate the receiver’s performancein the presence of a blocking signal. The blocking performancemeasurement can be performed witha similar setup (see Figure 41) byreplacing the ESG-D signal generatorwith an analog source. The AgilentMicrowave Performance SignalGenerator (E8247C) is ideal for thisapplication. Its features include astep/list sweep at the frequencies and power levels required for theblocking signal.
33
1. The reference sensitivity level is –70 dBm.
The Bluetooth Test Specificationspecifies tests at power source voltages that are extreme for someBluetooth devices.1 Power supplytesting, and the Bluetooth device’srejection of spurious signals carriedon the power line, are importantparts of integration testing for manyapplications. Measurements of powerversus time during DH5 bursts andcareful monitoring of the frequencyerror measurements are good ways touncover power-line related problems.Agilent offers a complete line of DCpower supplies that are suitable forthese tests. These include generalpurpose supplies as well as suppliesspecifically designed to meet thedemands of mobile communicationsproducts. These DC voltage suppliesalso offer low-current measuringcapability, which is useful for evaluating current consumption during standby and sleep modes.
1. These tests are not required when the DUT is designed for operation as part of, and poweredby, another system or piece of equipment.
34
5. Power Supply Measurements

Park mode Power-saving mode inwhich the device is placed in an inactive state. The device is synchronized to the piconet but does not participate in the traffic.Park mode provides the highestpower efficiency.
Payload The user’s voice or datainformation, which is carried in apacket.
Piconet The piconet is the smallestBluetooth network structure. Apiconet consists of one master and up to seven actively communicatingor 200+ inactive non-communicatingslaves. The piconet is defined by itshopping sequence.
Power saving mode Three power saving modes exist: sniff mode, holdmode, and park mode. Each of thesemodes puts the slave unit in varyingstates of sleep. No data is transferredto or from a slave unit while it is in apower saving mode.
Pretriggering A feature which allowsexamination of the waveform at apoint in time prior to the definedtrigger point.
Scatternet A net formed be multipleindependent and non-synchronizedpiconets. Devices can share piconets.
Slave units All devices in a piconetthat are not the master. Slave unitsmay be in active mode, in which theyare actively communicating with themaster, or they may be in an inactivesleep mode.
Sniff mode Power-saving mode in which the device listens to thepiconet at a reduced rate to conservepower. Sniff mode is the least efficient power-saving mode.
Standby mode The state of a Bluetoothunit which is not connected to apiconet. In this mode, devices listenfor messages every 1.28 seconds.
Hold mode Power saving mode inwhich the device is placed in an inactive state, running only an internal timer to occasionally perform a status check.
Information appliances The category of information-focused devices that provide voice or data to the user.Examples are not limited to, butinclude cellular phones, personal digital assistants (PDAs), and digitalcameras.
Master unit The device in a piconetwhose clock and hopping sequenceare used to synchronize all otherdevices in a piconet.
Packet A single bundle of informationtransmitted within a piconet. A packet is transmitted on a frequencyhop and nominally covers a singletime slot, but may be extended tocover up to five slots.
35
Appendix A: Glossary
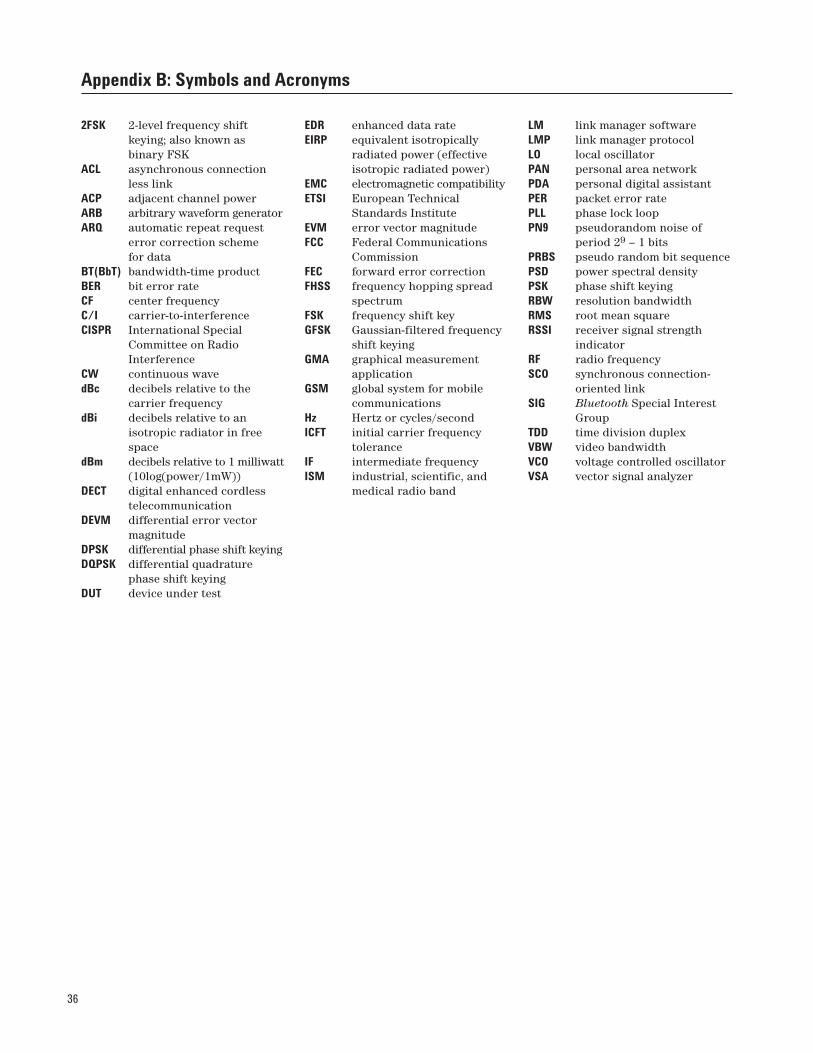
EDR enhanced data rateEIRP equivalent isotropically
radiated power (effective isotropic radiated power)
EMC electromagnetic compatibilityETSI European Technical
Standards InstituteEVM error vector magnitudeFCC Federal Communications
CommissionFEC forward error correctionFHSS frequency hopping spread
spectrumFSK frequency shift keyGFSK Gaussian-filtered frequency
shift keyingGMA graphical measurement
applicationGSM global system for mobile
communicationsHz Hertz or cycles/secondICFT initial carrier frequency
toleranceIF intermediate frequencyISM industrial, scientific, and
medical radio band
LM link manager softwareLMP link manager protocolLO local oscillatorPAN personal area networkPDA personal digital assistantPER packet error ratePLL phase lock loopPN9 pseudorandom noise of
period 29 – 1 bitsPRBS pseudo random bit sequencePSD power spectral densityPSK phase shift keyingRBW resolution bandwidthRMS root mean squareRSSI receiver signal strength
indicatorRF radio frequencySCO synchronous connection-
oriented linkSIG Bluetooth Special Interest
GroupTDD time division duplexVBW video bandwidthVCO voltage controlled oscillatorVSA vector signal analyzer
2FSK 2-level frequency shift keying; also known as binary FSK
ACL asynchronous connectionless link
ACP adjacent channel powerARB arbitrary waveform generatorARQ automatic repeat request
error correction scheme for data
BT(BbT) bandwidth-time productBER bit error rateCF center frequencyC/I carrier-to-interferenceCISPR International Special
Committee on Radio Interference
CW continuous wavedBc decibels relative to the
carrier frequencydBi decibels relative to an
isotropic radiator in free space
dBm decibels relative to 1 milliwatt(10log(power/1mW))
DECT digital enhanced cordless telecommunication
DEVM differential error vector magnitude
DPSK differential phase shift keyingDQPSK differential quadrature
phase shift keyingDUT device under test
36
Appendix B: Symbols and Acronyms

37
Appendix C: Recommended Reading for Bluetooth
The following documents are accessible via the Agilent BluetoothWeb site: www.agilent.com/find/bluetooth
Verifying Bluetooth BasebandSignals using Mixed SignalOscilloscopes, application note AN 1333-3, literature number 5988-2181EN
Agilent E4438C Signal Signal Studiofor Bluetooth, application note 1421,literature number 5988-5417EN
Agilent Wireless ConnectivityTesting, brochure, literature number5988-4438EN
Agilent N4010A WirelessConnectivity Test Set, data sheet, literature number 5989-0251EN
Agilent N4017A GraphicalMeasurement Application, productoverview, literature number 5989-2771EN
Agilent Innovative Solutions forTesting Bluetooth Enhanced DataRate Products, product overview, literature number 5989-3055EN
Agilent Bluetooth MeasurementSolution for the ESA-E SeriesSpectrum Analyzers, productoverview, literature number 5980-2786EN
Agilent ESA-E Series SpectrumAnalyzer Bluetooth MeasurementOption, Self-Guided Demo, productnote, literature number 5980-2577EN
Agilent EPM-P Series Single- andDual-Channel Power Meters DemoGuide, literature number 5988-1605EN
Agilent Vector Signal AnalysisBasics, application note 150-15, literature number 5989-1121EN
Generic RF recommended reading
8 Hints for Making BetterMeasurements Using RF SignalGenerators, application note 1306-1,literature number 5967-5661E
8 Hints for Making Better SpectrumAnalyzer Measurements, applicationnote 1286-1, literature number 5965-7009E
Cookbook for EMC PrecomplianceMeasurements, application note1290-1, literature number 5964-2151E
Measuring Bit Error Rate using theAgilent ESG-D Series RF SignalGenerators Option UN7, literaturenumber 5966-4098E
Spectrum Analysis Basics, application note 150, literature number 5952-0292
Testing and Troubleshooting DigitalRF Communications ReceiverDesigns, application note 1314, literature number 5968-3579E
Testing and Troubleshooting DigitalRF Communications TransmitterDesigns, application note 1313, literature number 5968-3578E
Fundamentals of RF and PowerMeasurement, (four parts) literaturenumbers 5988-9213EN, 5988-9214EN,5988-9215EN, 5988-9216EN
Agilent 89600 Series WideBandwidth Vector Signal Analyzers,literature number 5980-0723E
Agilent ESG Family of RF SignalGenerators, configuration guide, literature number 5965-4973E
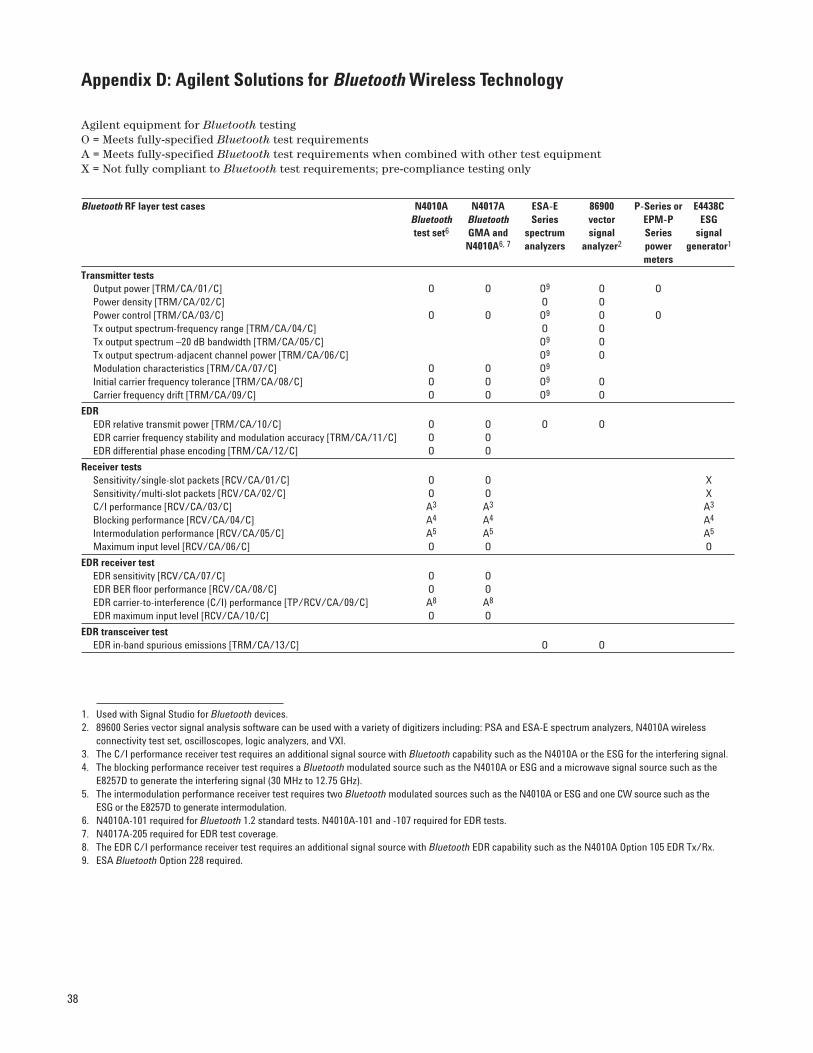
38
Appendix D: Agilent Solutions for Bluetooth Wireless Technology
1. Used with Signal Studio for Bluetooth devices.2. 89600 Series vector signal analysis software can be used with a variety of digitizers including: PSA and ESA-E spectrum analyzers, N4010A wireless
connectivity test set, oscilloscopes, logic analyzers, and VXI.3. The C/I performance receiver test requires an additional signal source with Bluetooth capability such as the N4010A or the ESG for the interfering signal.4. The blocking performance receiver test requires a Bluetooth modulated source such as the N4010A or ESG and a microwave signal source such as the
E8257D to generate the interfering signal (30 MHz to 12.75 GHz).5. The intermodulation performance receiver test requires two Bluetooth modulated sources such as the N4010A or ESG and one CW source such as the
ESG or the E8257D to generate intermodulation.6. N4010A-101 required for Bluetooth 1.2 standard tests. N4010A-101 and -107 required for EDR tests.7. N4017A-205 required for EDR test coverage.8. The EDR C/I performance receiver test requires an additional signal source with Bluetooth EDR capability such as the N4010A Option 105 EDR Tx/Rx.9. ESA Bluetooth Option 228 required.
Agilent equipment for Bluetooth testingO = Meets fully-specified Bluetooth test requirementsA = Meets fully-specified Bluetooth test requirements when combined with other test equipmentX = Not fully compliant to Bluetooth test requirements; pre-compliance testing only
Bluetooth RF layer test cases N4010A N4017A ESA-E 86900 P-Series or E4438C Bluetooth Bluetooth Series vector EPM-P ESGtest set6 GMA and spectrum signal Series signal
N4010A6, 7 analyzers analyzer2 power generator1
meters
Transmitter testsOutput power [TRM/CA/01/C] O O O9 O OPower density [TRM/CA/02/C] O OPower control [TRM/CA/03/C] O O O9 O OTx output spectrum-frequency range [TRM/CA/04/C] O OTx output spectrum –20 dB bandwidth [TRM/CA/05/C] O9 OTx output spectrum-adjacent channel power [TRM/CA/06/C] O9 OModulation characteristics [TRM/CA/07/C] O O O9
Initial carrier frequency tolerance [TRM/CA/08/C] O O O9 OCarrier frequency drift [TRM/CA/09/C] O O O9 O
EDREDR relative transmit power [TRM/CA/10/C] O O O OEDR carrier frequency stability and modulation accuracy [TRM/CA/11/C] O OEDR differential phase encoding [TRM/CA/12/C] O O
Receiver testsSensitivity/single-slot packets [RCV/CA/01/C] O O XSensitivity/multi-slot packets [RCV/CA/02/C] O O XC/I performance [RCV/CA/03/C] A3 A3 A3
Blocking performance [RCV/CA/04/C] A4 A4 A4
Intermodulation performance [RCV/CA/05/C] A5 A5 A5
Maximum input level [RCV/CA/06/C] O O O
EDR receiver testEDR sensitivity [RCV/CA/07/C] O OEDR BER floor performance [RCV/CA/08/C] O OEDR carrier-to-interference (C/I) performance [TP/RCV/CA/09/C] A8 A8
EDR maximum input level [RCV/CA/10/C] O O
EDR transceiver testEDR in-band spurious emissions [TRM/CA/13/C] O O
1. Bluetooth Test Specification - RF,Part A, For Specification 2.0,Revision 2.0, March 21, 2005 -Bluetooth SIG
2. Specification of the BluetoothSystem – Version 2.0 + EDR, Volume0, November 4, 2004 – Bluetooth SIG
3. The Official Bluetooth Web site,www.bluetooth.com. Includes infor-mation on Bluetooth history, technol-ogy, news, specifications, applica-tions, products, events, and BluetoothSpecial Interest Group (SIG). TheBluetooth SIG-Members area website, www.bluetooth.org providesaccess to the Bluetooth TestSpecification, announcements, andpre-release specifications. This Website is password protected for sometechnical documents.
39
Appendix E: References
Bluetooth is a registered trademark owned byBluetooth SIG, Inc., U.S.A. and licensed toAgilent Technologies, Inc.
Remove all doubt
Our repair and calibration services will get
your equipment back to you, performing
like new, when promised. You will get
full value out of your Agilent equipment
throughout its lifetime. Your equipment will
be serviced by Agilent-trained technicians
using the latest factory calibration proce-
dures, automated repair diagnostics and
genuine parts. You will always have the
utmost confidence in your measurements.
Agilent offers a wide range of additional
expert test and measurement services for
your equipment, including initial start-up
assistance onsite education and training,
as well as design, system integration, and
project management.
For more information on repair and
calibration services, go to
www.agilent.com/find/removealldoubt
www.agilent.com
For more information on Agilent
Technologies’ products, applications
or services, please contact your local
Agilent office. The complete list is
available at:
www.agilent.com/find/contactus
Phone or Fax
United States:(tel) 800 829 4444(fax) 800 829 4433
Canada:(tel) 877 894 4414(fax) 800 746 4866
China:(tel) 800 810 0189(fax) 800 820 2816
Europe:(tel) 31 20 547 2111
Japan:(tel) (81) 426 56 7832(fax) (81) 426 56 7840
Korea:(tel) (080) 769 0800(fax) (080) 769 0900
Latin America:(tel) (305) 269 7500
Taiwan:(tel) 0800 047 866 (fax) 0800 286 331
Other Asia Pacific Countries:(tel) (65) 6375 8100 (fax) (65) 6755 0042Email: [email protected]: 09/14/06
Product specifications and descriptions
in this document subject to change
without notice.
© Agilent Technologies, Inc. 2006, 2005,
2001
Printed in USA, October 12, 2006
5988-3760EN
www.agilent.com/find/emailupdates
Get the latest information on the products
and applications you select.
www.agilent.com/find/quick
Quickly choose and use your test
equipment solutions with confidence.
www.agilent.com/find/open
Agilent Open simplifies the process of
connecting and programming test systems
to help engineers design, validate and
manufacture electronic products. Agilent
offers open connectivity for a broad range
of system-ready instruments, open industry
software, PC-standard I/O and global sup-
port, which are combined to more easily
integrate test system development.
is the US registered trademark of
the LXI Consortium.
Agilent Email Updates
Agilent Direct
AgilentOpen