Embed Size (px)
Citation preview
THIS REPORT CONTAINS ASSESSMENTS OF COMMODITY AND TRADE ISSUES MADE BY USDA STAFF AND NOT NECESSARILY STATEMENTS OF OFFICIAL U.S. GOVERNMENT
POLICY
Date:
GAIN Report Number:
Approved By:
Prepared By:
Report Highlights:
New Zealand's imports of consumer-oriented agricultural products have trended upward over the
past several years and in 2013 reached US$364 million in comparison to US$124 million in 2006.
The United States had a market share of 14% in consumer-oriented products exported to New
Zealand. Leading imports of consumer-oriented food products from the United States include
lactose, food preparations, pet food, frozen meat, fresh grapes, dry almonds, fresh oranges,
bread/pastry products, and raisins.
Vinita Sharma, Marketing Analyst
Hugh Maginnis, Agricultural Counselor
Annual
Exporter Guide
New Zealand
NZ1419
12/31/2014
Required Report - public distribution
Post:
SECTION I: MARKET OVERVIEW
Overview
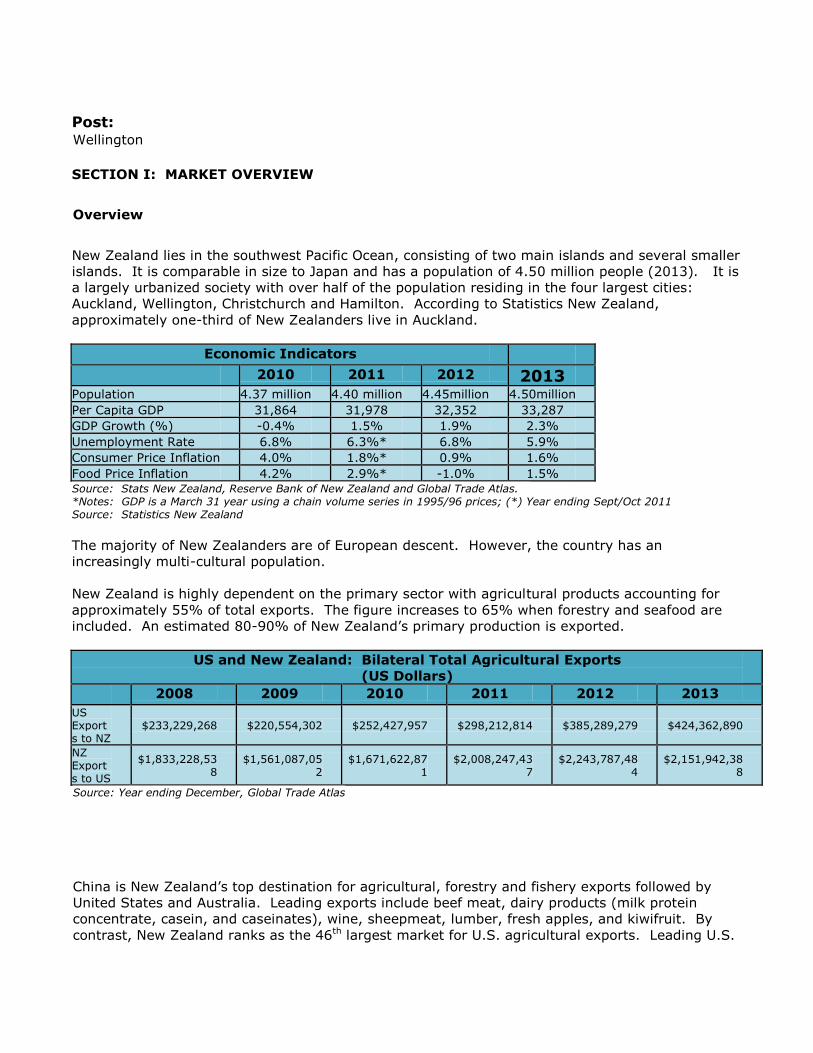
New Zealand lies in the southwest Pacific Ocean, consisting of two main islands and several smaller
islands. It is comparable in size to Japan and has a population of 4.50 million people (2013). It is
a largely urbanized society with over half of the population residing in the four largest cities:
Auckland, Wellington, Christchurch and Hamilton. According to Statistics New Zealand,
approximately one-third of New Zealanders live in Auckland.
Economic Indicators
2010 2011 2012 2013 Population 4.37 million 4.40 million 4.45million 4.50million
Per Capita GDP 31,864 31,978 32,352 33,287
GDP Growth (%) -0.4% 1.5% 1.9% 2.3%
Unemployment Rate 6.8% 6.3%* 6.8% 5.9%
Consumer Price Inflation 4.0% 1.8%* 0.9% 1.6%
Food Price Inflation 4.2% 2.9%* -1.0% 1.5% Source: Stats New Zealand, Reserve Bank of New Zealand and Global Trade Atlas. *Notes: GDP is a March 31 year using a chain volume series in 1995/96 prices; (*) Year ending Sept/Oct 2011 Source: Statistics New Zealand
The majority of New Zealanders are of European descent. However, the country has an
increasingly multi-cultural population.
New Zealand is highly dependent on the primary sector with agricultural products accounting for
approximately 55% of total exports. The figure increases to 65% when forestry and seafood are
included. An estimated 80-90% of New Zealand’s primary production is exported.
US and New Zealand: Bilateral Total Agricultural Exports (US Dollars)
2008 2009 2010 2011 2012 2013
US Exports to NZ
$233,229,268 $220,554,302 $252,427,957 $298,212,814 $385,289,279 $424,362,890
NZ Exports to US
$1,833,228,538
$1,561,087,052
$1,671,622,871
$2,008,247,437
$2,243,787,484
$2,151,942,388
Source: Year ending December, Global Trade Atlas
China is New Zealand’s top destination for agricultural, forestry and fishery exports followed by
United States and Australia. Leading exports include beef meat, dairy products (milk protein
concentrate, casein, and caseinates), wine, sheepmeat, lumber, fresh apples, and kiwifruit. By
contrast, New Zealand ranks as the 46th largest market for U.S. agricultural exports. Leading U.S.
Wellington
agricultural exports to the New Zealand market include lactose products, food preparations, pet
food, frozen pork, dry almonds, animal feed, fresh grapes, fresh oranges, whey and milk products,
nuts, citrus fruits and stone fruit.
New Zealand is the second largest market for U.S. lactose products, sixth largest market for U.S.
pet food, the seventh largest for USA fresh fruits (peaches, plums and nectarines) and the 10th
largest market for fresh oranges.
Consumer-Oriented Food Product Trade
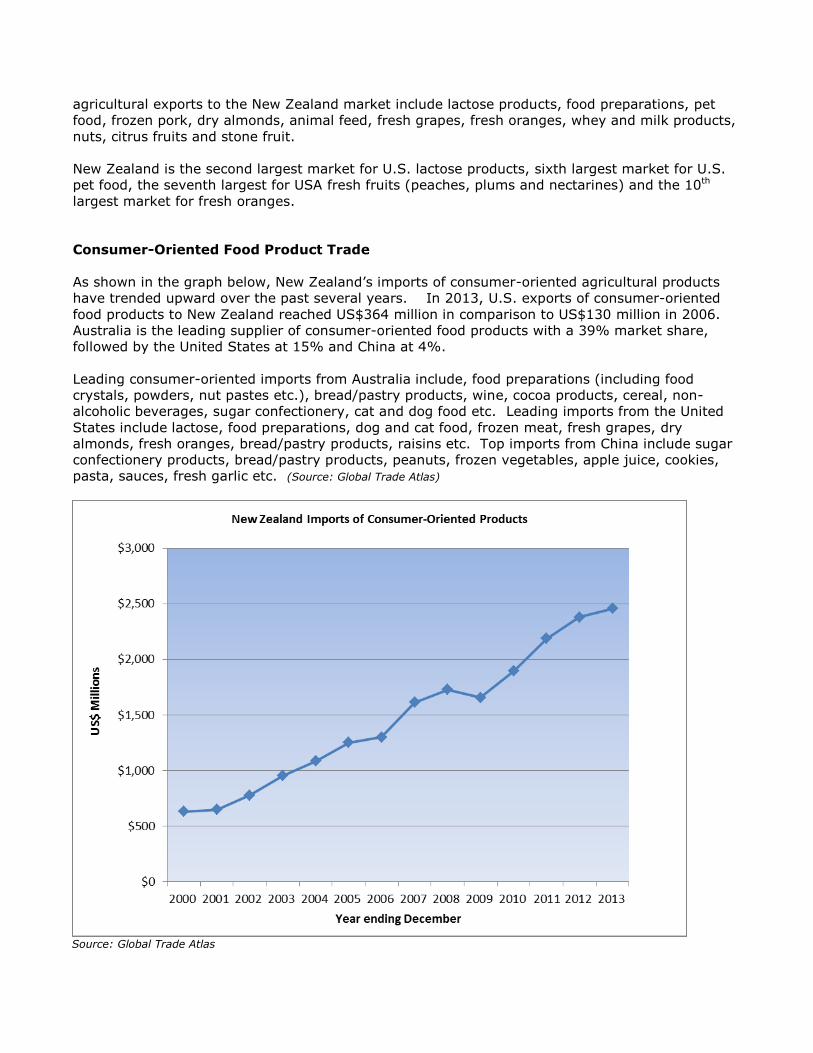
As shown in the graph below, New Zealand’s imports of consumer-oriented agricultural products
have trended upward over the past several years. In 2013, U.S. exports of consumer-oriented
food products to New Zealand reached US$364 million in comparison to US$130 million in 2006.
Australia is the leading supplier of consumer-oriented food products with a 39% market share,
followed by the United States at 15% and China at 4%.
Leading consumer-oriented imports from Australia include, food preparations (including food
crystals, powders, nut pastes etc.), bread/pastry products, wine, cocoa products, cereal, non-
alcoholic beverages, sugar confectionery, cat and dog food etc. Leading imports from the United
States include lactose, food preparations, dog and cat food, frozen meat, fresh grapes, dry
almonds, fresh oranges, bread/pastry products, raisins etc. Top imports from China include sugar
confectionery products, bread/pastry products, peanuts, frozen vegetables, apple juice, cookies,
pasta, sauces, fresh garlic etc. (Source: Global Trade Atlas)
Source: Global Trade Atlas
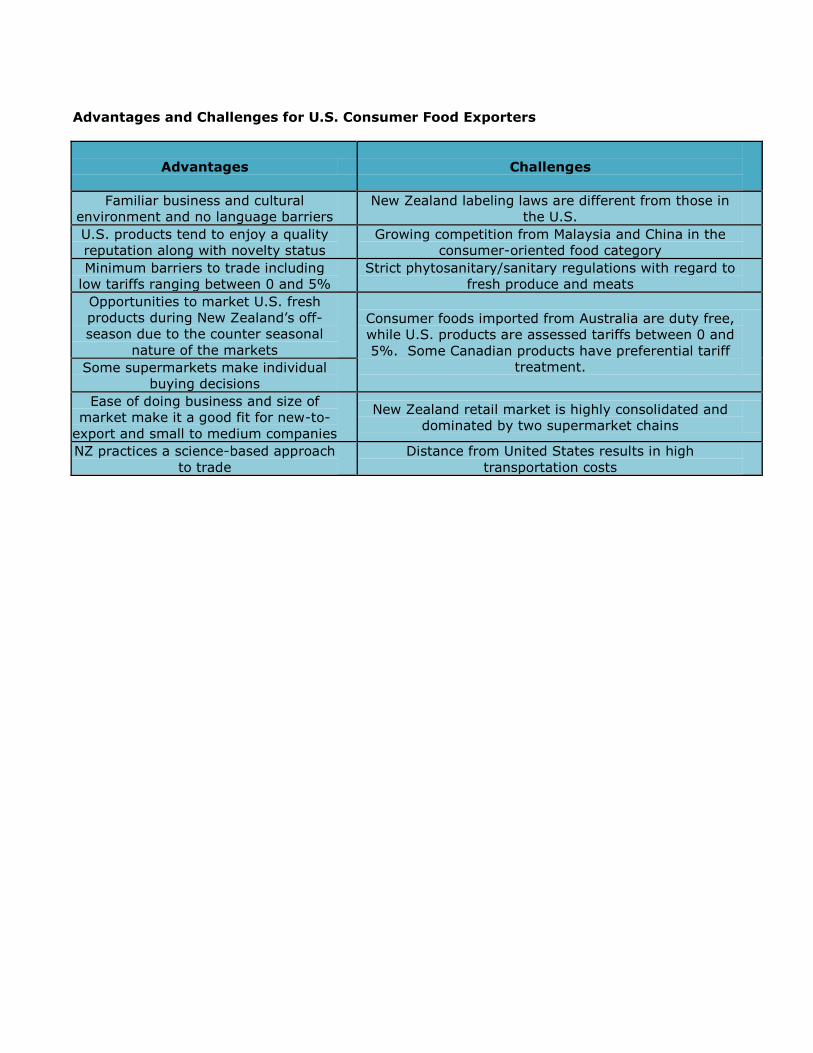
Advantages and Challenges for U.S. Consumer Food Exporters
Advantages
Challenges
Familiar business and cultural
environment and no language barriers
New Zealand labeling laws are different from those in
the U.S.
U.S. products tend to enjoy a quality
reputation along with novelty status
Growing competition from Malaysia and China in the
consumer-oriented food category
Minimum barriers to trade including
low tariffs ranging between 0 and 5%
Strict phytosanitary/sanitary regulations with regard to
fresh produce and meats
Opportunities to market U.S. fresh
products during New Zealand’s off-
season due to the counter seasonal
nature of the markets
Consumer foods imported from Australia are duty free,
while U.S. products are assessed tariffs between 0 and
5%. Some Canadian products have preferential tariff
treatment. Some supermarkets make individual
buying decisions
Ease of doing business and size of
market make it a good fit for new-to-
export and small to medium companies
New Zealand retail market is highly consolidated and
dominated by two supermarket chains
NZ practices a science-based approach
to trade
Distance from United States results in high
transportation costs
SECTION II: EXPORTER BUSINESS TIPS
New Zealand is a well-developed market. Establishing good working relationships with
importers/distributors is key to entering the New Zealand marketplace. Approximately 90%
of all imported food products are purchased and distributed within New Zealand by
importers/distributors.
New Zealand supermarkets mainly purchase imported products from importers and
distributors rather than importing directly. In the case of Foodstuffs, interested U.S.
exporters should contact each of the regional offices directly as they can make buying
decisions independently of each other. (Please see Section V for contact information.)
Tariffs assessed on U.S. food products range from zero to 5%. Tariff rates can be checked
at on the New Zealand Customs website. New Zealand Working Tariff Document
General sales tax (GST) on domestic and imported products is 15%.
The cost of international freight can be a fairly significant percentage of the final cost of a
product. U.S. exporters can contact freight forwarders in the United States to determine
transportation cost. New Zealand importers and distributors can arrange shipment with the
help of customs brokers in New Zealand.
For complete guide on import duties and charges, please check this link New Zealand
Customs duties and charges
High quality products with innovative packaging and unique features that are price
competitive tend to do well in the New Zealand market.
Fresh U.S. produce is an especially welcome addition to New Zealand retail shelves during
winter in the Southern Hemisphere.
Innovative, environmentally-friendly packaging has an advantage in retail food products.
New Zealand has strict food standards and labeling requirements that are set out in the
Australia New Zealand Food Standards Code. U.S. exporters are encouraged to review the
Food and Agriculture Import Regulations and Standards (FAIRS) report for New Zealand
which contains detailed information on New Zealand’s food standards, labeling
requirements, import regulations, etc. This report can be viewed at the following site:
http://www.fas.usda.gov/scriptsw/attacherep/default.htm
SECTION III: MARKET STRUCTURE AND TRENDS
Retail Grocery Sector
The retail grocery market in New Zealand is well-developed with supermarkets, small-scale grocery
stores, fresh food specialty stores and convenience stores in all of the major population centers.
New Zealand’s food expenditures in 2013 were valued at over NZ$25 billion (US$19.7 billion) and
include expenditures in supermarkets, convenience stores.
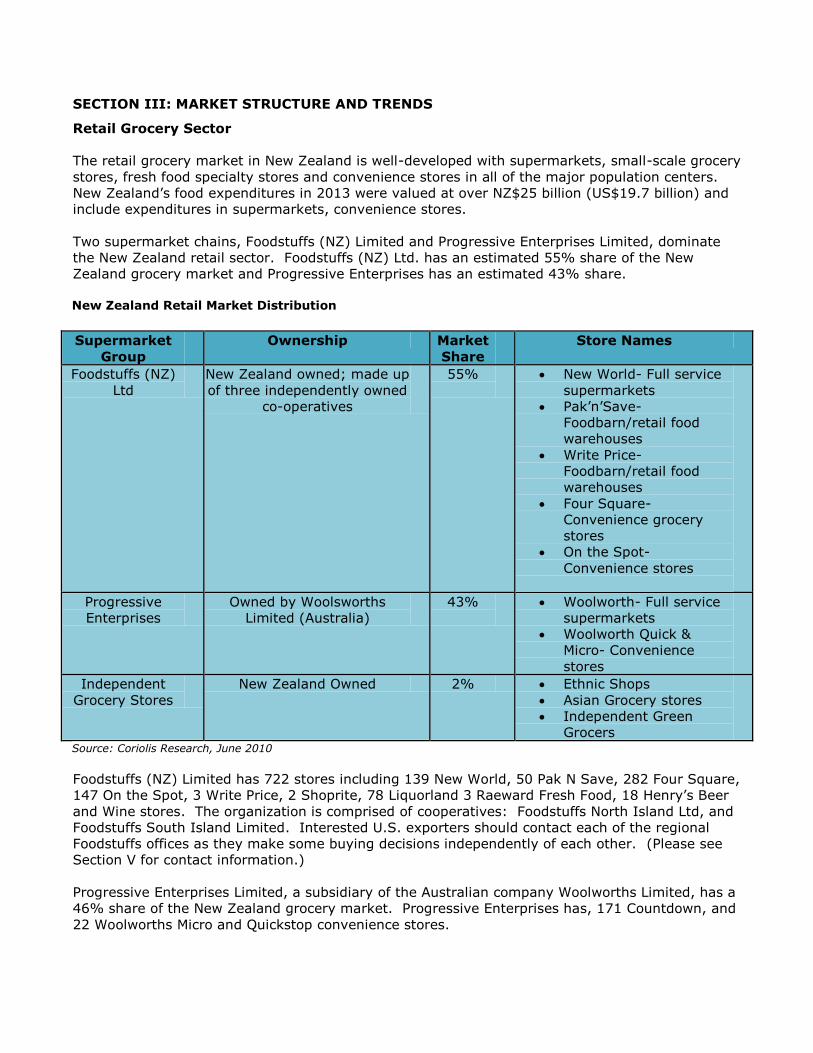
Two supermarket chains, Foodstuffs (NZ) Limited and Progressive Enterprises Limited, dominate
the New Zealand retail sector. Foodstuffs (NZ) Ltd. has an estimated 55% share of the New
Zealand grocery market and Progressive Enterprises has an estimated 43% share.
New Zealand Retail Market Distribution
Supermarket
Group
Ownership Market
Share
Store Names
Foodstuffs (NZ)
Ltd
New Zealand owned; made up
of three independently owned
co-operatives
55%
New World- Full service
supermarkets
Pak’n’Save-
Foodbarn/retail food
warehouses
Write Price-
Foodbarn/retail food
warehouses
Four Square-
Convenience grocery
stores
On the Spot-
Convenience stores
Progressive
Enterprises
Owned by Woolsworths
Limited (Australia)
43%
Woolworth- Full service
supermarkets
Woolworth Quick &
Micro- Convenience
stores
Independent
Grocery Stores
New Zealand Owned 2% Ethnic Shops
Asian Grocery stores
Independent Green
Grocers Source: Coriolis Research, June 2010
Foodstuffs (NZ) Limited has 722 stores including 139 New World, 50 Pak N Save, 282 Four Square,
147 On the Spot, 3 Write Price, 2 Shoprite, 78 Liquorland 3 Raeward Fresh Food, 18 Henry’s Beer
and Wine stores. The organization is comprised of cooperatives: Foodstuffs North Island Ltd, and
Foodstuffs South Island Limited. Interested U.S. exporters should contact each of the regional
Foodstuffs offices as they make some buying decisions independently of each other. (Please see
Section V for contact information.)
Progressive Enterprises Limited, a subsidiary of the Australian company Woolworths Limited, has a
46% share of the New Zealand grocery market. Progressive Enterprises has, 171 Countdown, and
22 Woolworths Micro and Quickstop convenience stores.
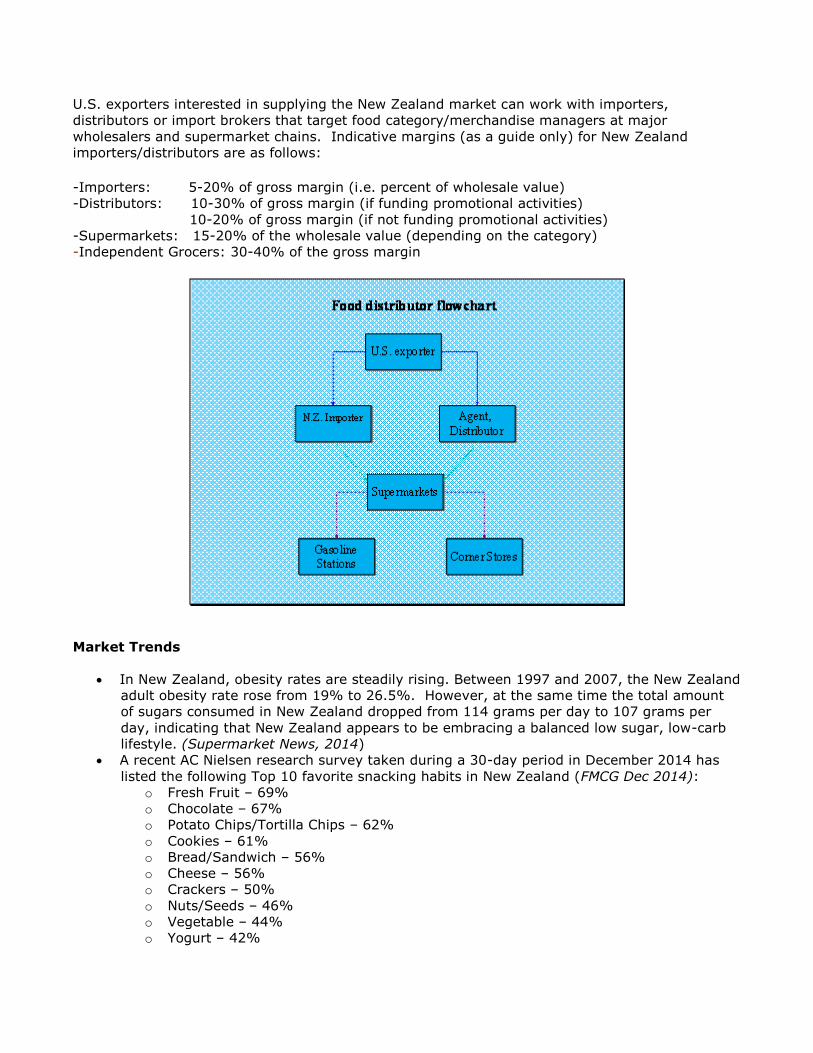
U.S. exporters interested in supplying the New Zealand market can work with importers,
distributors or import brokers that target food category/merchandise managers at major
wholesalers and supermarket chains. Indicative margins (as a guide only) for New Zealand
importers/distributors are as follows:
-Importers: 5-20% of gross margin (i.e. percent of wholesale value)
-Distributors: 10-30% of gross margin (if funding promotional activities)
10-20% of gross margin (if not funding promotional activities)
-Supermarkets: 15-20% of the wholesale value (depending on the category)
-Independent Grocers: 30-40% of the gross margin
Market Trends
In New Zealand, obesity rates are steadily rising. Between 1997 and 2007, the New Zealand
adult obesity rate rose from 19% to 26.5%. However, at the same time the total amount
of sugars consumed in New Zealand dropped from 114 grams per day to 107 grams per
day, indicating that New Zealand appears to be embracing a balanced low sugar, low-carb
lifestyle. (Supermarket News, 2014)
A recent AC Nielsen research survey taken during a 30-day period in December 2014 has
listed the following Top 10 favorite snacking habits in New Zealand (FMCG Dec 2014):
o Fresh Fruit – 69%
o Chocolate – 67%
o Potato Chips/Tortilla Chips – 62%
o Cookies – 61%
o Bread/Sandwich – 56%
o Cheese – 56%
o Crackers – 50%
o Nuts/Seeds – 46%
o Vegetable – 44%
o Yogurt – 42%
The research shows a massive untapped opportunity to gain market share in the nutritious,
ready-to-go easy-to-eat snacks and meal alternatives.
The same survey also revealed that 28% of New Zealanders prefer snack foods that are low
in sugar or are sugar-free; 26% prefer natural flavors, 26% will opt for GMO free snacks
and 25% prefer their snackfoods to be free from artificial colors and flavors (FMCG Dec
2014)
The following are food store trends that are gaining popularity in New Zealand (FMCG)
o Barn style retailing – New Zealand supermarket chains, particularly the PakN- Sav
chain, has a unique format of ‘pile them high’. Shoppers in this store are not
necessarily looking for a huge amount of choice, but rather are seeking out the
products and brands they are familiar with at lowest possible price.
o Clear retailer identities – While both New Zealand and Australian supermarkets have
a duopoly structure, there seems to be greater emphasis on differentiation in New
Zealand, in an attempt to target shopper preferences. This is illustrated by the
clear difference between retailers who target bulk supermarket shoppers (Pan N
Save stores); versus retailers such as New World Metro and Countdown, which cater
to the shopper who makes more frequent trips to the store and who tends to
purchase smaller quantities on each visit.
o Clean Store policies – Providing shoppers with an experience that appeals to the
senses through in-store theatre, use of sensory elements, etc helps to dial up the
emotional response and encourages them to become more emotionally involved in
the decision.
o Cross category merchandising – cross category merchandising and bundling (e.g.
placing displays of meat seasonings and sauces within the meat department)
encourages greater consumer purchase trials.
A Coriolis research report from November 2012, identified some emerging trends in
consumption growth and consumer food product demand in New Zealand, providing an
indicator of those U.S. food and beverage product exports which have the strongest
prospects in the New Zealand market.. These products include:
o Best – Salmon, Honey, Spirits, Cookies, Pet food, Cherries
o Better – Chocolate, Frozen French fries, Beer, Alcoholic cider, Avocados, Berries
o Good - Jams & jellies, Capsicum, Peas, frozen & dried, Sugar confectionery, Soups &
broths, Fresh onions, Prepared fish, Beef jerky
Some of these products are already exported from the U.S. to New Zealand. This report
can be seen at http://www.med.govt.nz/sectors-industries/food-beverage/pdf-docs-
library/information-project/coriolis-report-investors-guide.pdf
According to a Nielsen online retail report from late 2013, approximately 45% of the 1.8
million estimated online shoppers in New Zealand researched merchandise through their
smartphones. Of this total, 29% made actual purchases through their smartphone devices.
(FMCG, Aug 2013)
New Zealand is the sixth largest market for U.S. pet food. In 2013 total dog food sales in
New Zealand were estimated to be NZ$123 million, Dry dog food sales totaled NZ$56
million, wet dog food accounted for sales of NZ$47 million, and canned dog food sales were
NZ$17 million. The cat food market accounted for NZ$197 million, including dry cat food
sales of NZ$79 million, canned cat food sales of NZ$63 million, and pouch cat food sales of
NZ$35 million)
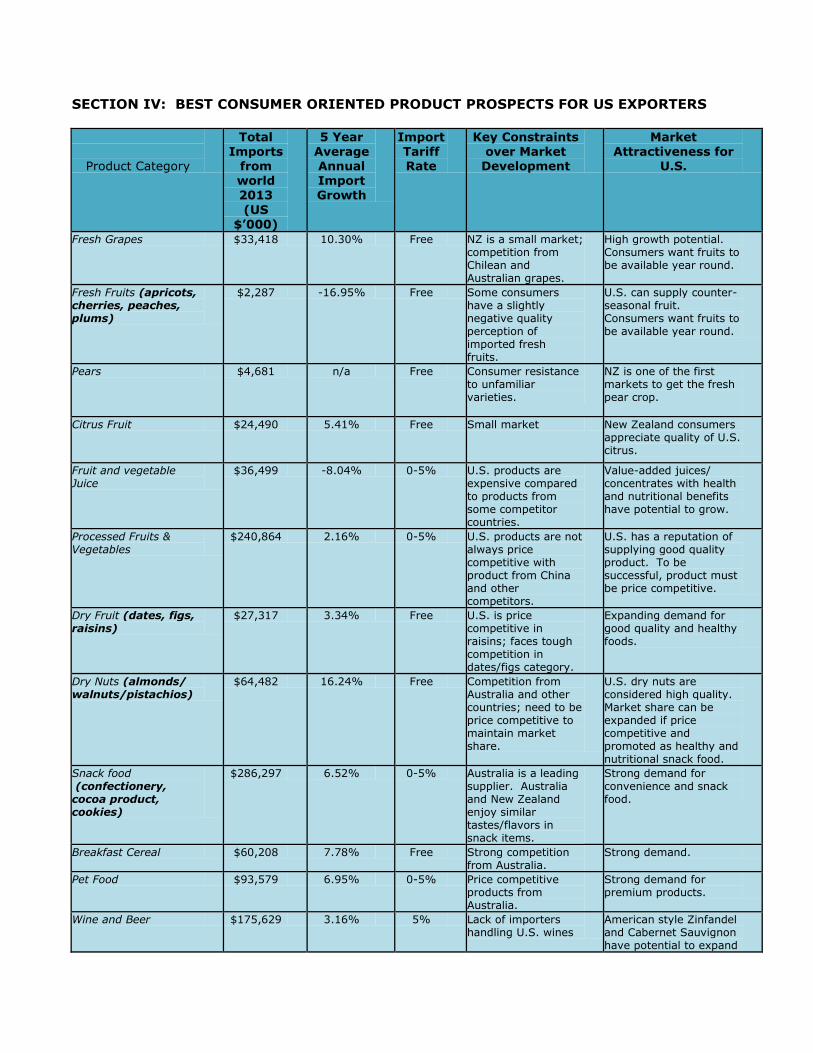
SECTION IV: BEST CONSUMER ORIENTED PRODUCT PROSPECTS FOR US EXPORTERS
Product Category
Total Imports
from world 2013
(US $’000)
5 Year Average Annual Import Growth
Import Tariff Rate
Key Constraints over Market
Development
Market Attractiveness for
U.S.
Fresh Grapes $33,418 10.30% Free NZ is a small market; competition from Chilean and Australian grapes.
High growth potential. Consumers want fruits to be available year round.
Fresh Fruits (apricots, cherries, peaches, plums)
$2,287 -16.95% Free Some consumers have a slightly negative quality perception of imported fresh fruits.
U.S. can supply counter-seasonal fruit. Consumers want fruits to be available year round.
Pears $4,681 n/a Free Consumer resistance to unfamiliar varieties.
NZ is one of the first markets to get the fresh pear crop.
Citrus Fruit $24,490 5.41% Free Small market New Zealand consumers appreciate quality of U.S. citrus.
Fruit and vegetable Juice
$36,499 -8.04% 0-5% U.S. products are expensive compared to products from some competitor countries.
Value-added juices/ concentrates with health and nutritional benefits have potential to grow.
Processed Fruits & Vegetables
$240,864 2.16% 0-5% U.S. products are not always price competitive with product from China and other competitors.
U.S. has a reputation of supplying good quality product. To be successful, product must be price competitive.
Dry Fruit (dates, figs, raisins)
$27,317 3.34% Free U.S. is price competitive in raisins; faces tough competition in dates/figs category.
Expanding demand for good quality and healthy foods.
Dry Nuts (almonds/ walnuts/pistachios)
$64,482 16.24% Free Competition from Australia and other countries; need to be price competitive to maintain market share.
U.S. dry nuts are considered high quality. Market share can be expanded if price competitive and promoted as healthy and nutritional snack food.
Snack food (confectionery, cocoa product, cookies)
$286,297 6.52% 0-5% Australia is a leading supplier. Australia and New Zealand enjoy similar tastes/flavors in snack items.
Strong demand for convenience and snack food.
Breakfast Cereal $60,208 7.78% Free Strong competition from Australia.
Strong demand.
Pet Food $93,579 6.95% 0-5% Price competitive products from Australia.
Strong demand for premium products.
Wine and Beer $175,629 3.16% 5% Lack of importers handling U.S. wines
American style Zinfandel and Cabernet Sauvignon have potential to expand
in this market.
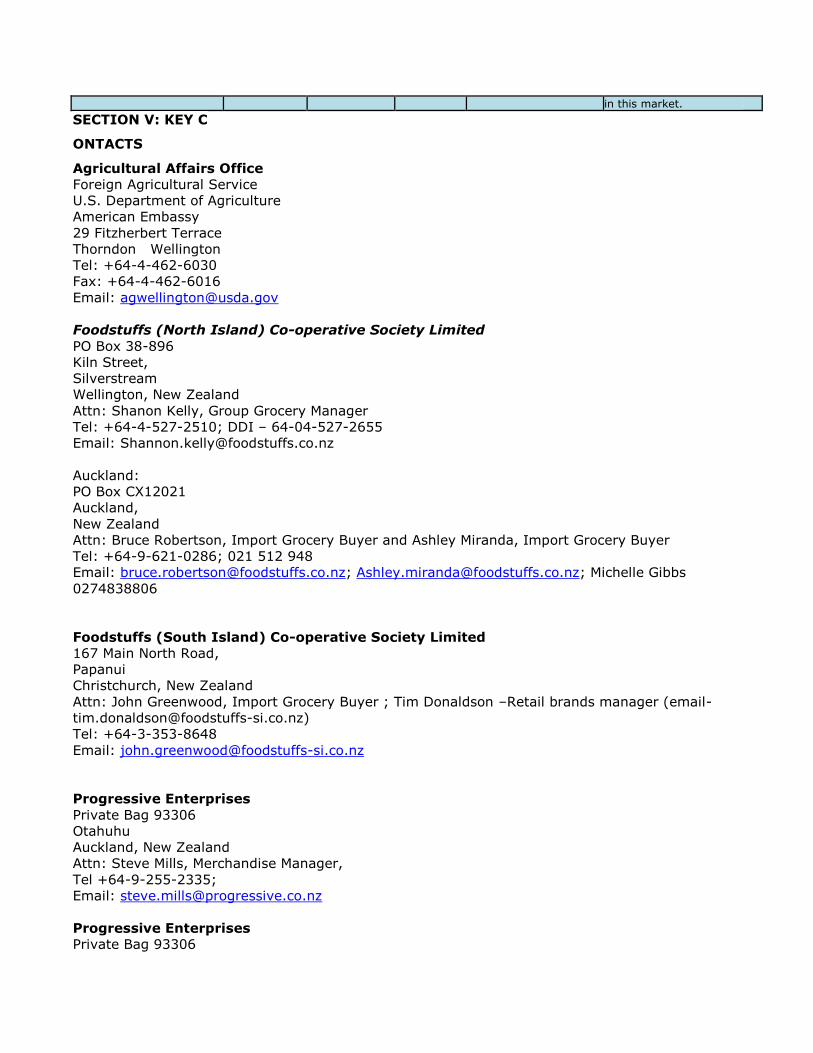
SECTION V: KEY C
ONTACTS
Agricultural Affairs Office
Foreign Agricultural Service
U.S. Department of Agriculture
American Embassy
29 Fitzherbert Terrace
Thorndon Wellington
Tel: +64-4-462-6030
Fax: +64-4-462-6016
Email: [email protected]
Foodstuffs (North Island) Co-operative Society Limited
PO Box 38-896
Kiln Street,
Silverstream
Wellington, New Zealand
Attn: Shanon Kelly, Group Grocery Manager
Tel: +64-4-527-2510; DDI – 64-04-527-2655
Email: [email protected]
Auckland:
PO Box CX12021
Auckland,
New Zealand
Attn: Bruce Robertson, Import Grocery Buyer and Ashley Miranda, Import Grocery Buyer
Tel: +64-9-621-0286; 021 512 948
Email: [email protected]; [email protected]; Michelle Gibbs
0274838806
Foodstuffs (South Island) Co-operative Society Limited
167 Main North Road,
Papanui
Christchurch, New Zealand
Attn: John Greenwood, Import Grocery Buyer ; Tim Donaldson –Retail brands manager (email-
Tel: +64-3-353-8648
Email: [email protected]
Progressive Enterprises
Private Bag 93306
Otahuhu
Auckland, New Zealand
Attn: Steve Mills, Merchandise Manager,
Tel +64-9-255-2335;
Email: [email protected]
Progressive Enterprises
Private Bag 93306
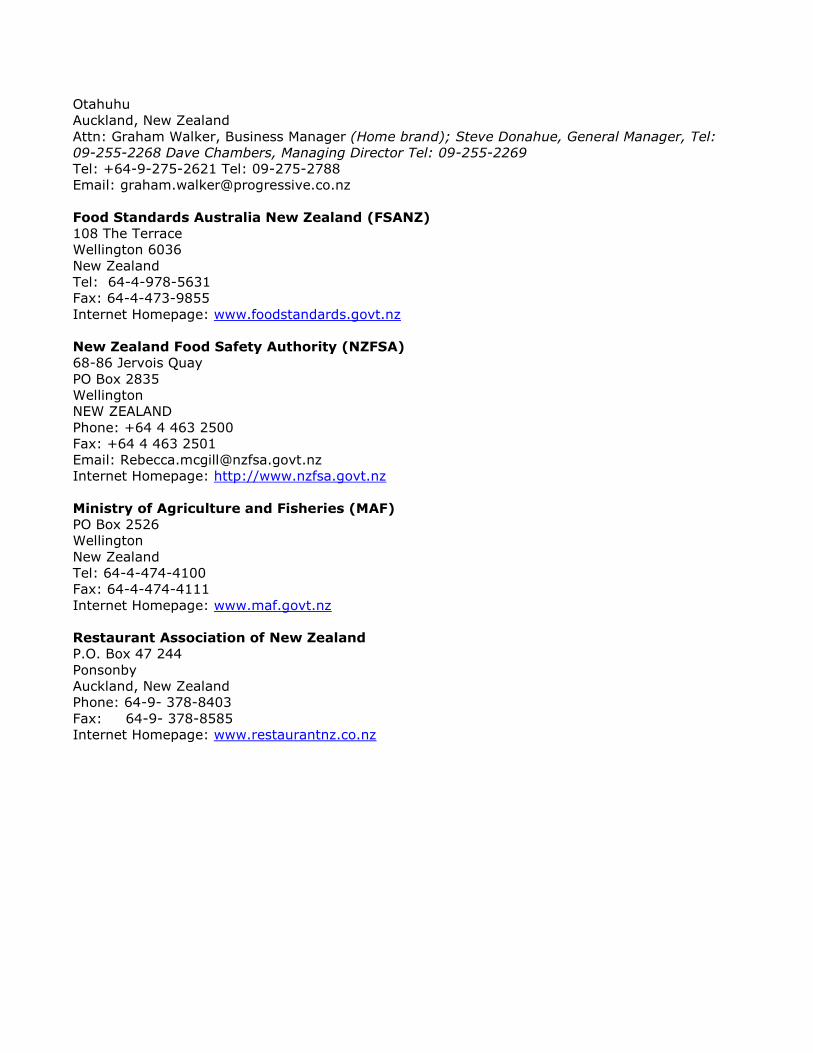
Otahuhu
Auckland, New Zealand
Attn: Graham Walker, Business Manager (Home brand); Steve Donahue, General Manager, Tel:
09-255-2268 Dave Chambers, Managing Director Tel: 09-255-2269
Tel: +64-9-275-2621 Tel: 09-275-2788
Email: [email protected]
Food Standards Australia New Zealand (FSANZ)
108 The Terrace
Wellington 6036
New Zealand
Tel: 64-4-978-5631
Fax: 64-4-473-9855
Internet Homepage: www.foodstandards.govt.nz
New Zealand Food Safety Authority (NZFSA)
68-86 Jervois Quay
PO Box 2835
Wellington
NEW ZEALAND
Phone: +64 4 463 2500
Fax: +64 4 463 2501
Email: [email protected]
Internet Homepage: http://www.nzfsa.govt.nz
Ministry of Agriculture and Fisheries (MAF)
PO Box 2526
Wellington
New Zealand
Tel: 64-4-474-4100
Fax: 64-4-474-4111
Internet Homepage: www.maf.govt.nz
Restaurant Association of New Zealand
P.O. Box 47 244
Ponsonby
Auckland, New Zealand
Phone: 64-9- 378-8403
Fax: 64-9- 378-8585
Internet Homepage: www.restaurantnz.co.nz
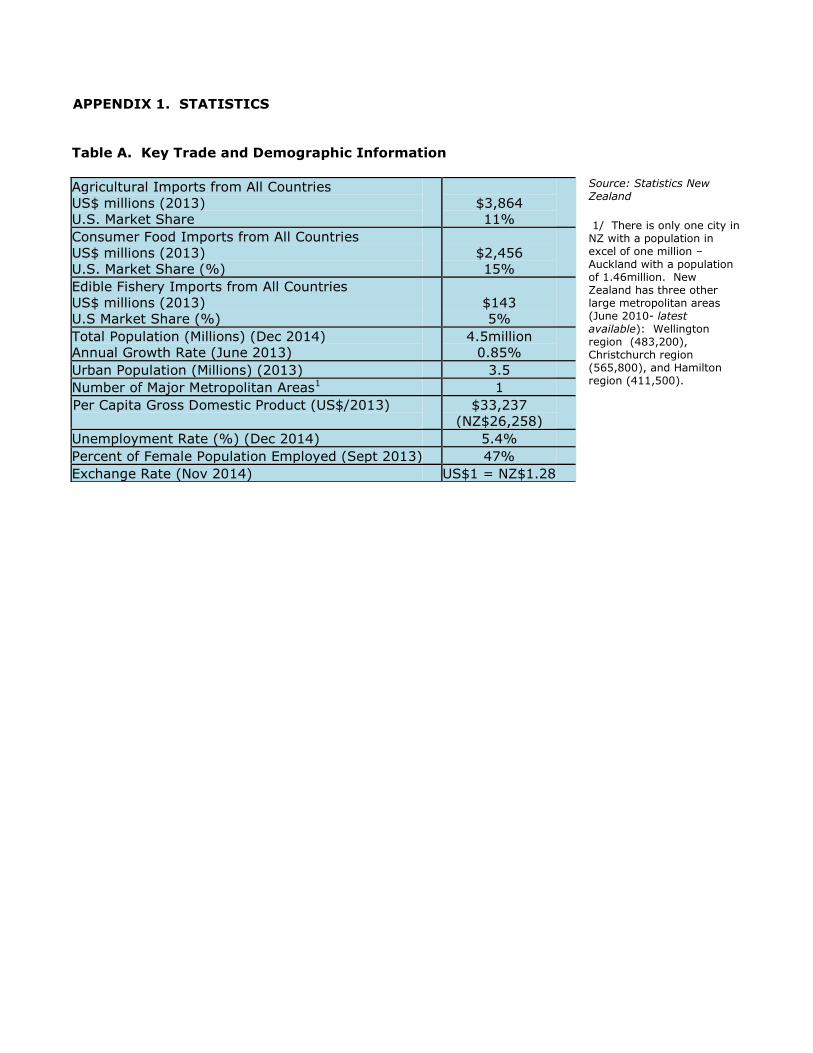
APPENDIX 1. STATISTICS
Table A. Key Trade and Demographic Information
Source: Statistics New Zealand
1/ There is only one city in NZ with a population in excel of one million – Auckland with a population of 1.46million. New Zealand has three other large metropolitan areas (June 2010- latest available): Wellington region (483,200), Christchurch region (565,800), and Hamilton region (411,500).
Agricultural Imports from All Countries
US$ millions (2013)
U.S. Market Share
$3,864
11%
Consumer Food Imports from All Countries
US$ millions (2013)
U.S. Market Share (%)
$2,456
15%
Edible Fishery Imports from All Countries
US$ millions (2013)
U.S Market Share (%)
$143
5%
Total Population (Millions) (Dec 2014)
Annual Growth Rate (June 2013)
4.5million
0.85%
Urban Population (Millions) (2013) 3.5
Number of Major Metropolitan Areas1 1
Per Capita Gross Domestic Product (US$/2013)
$33,237
(NZ$26,258)
Unemployment Rate (%) (Dec 2014) 5.4%
Percent of Female Population Employed (Sept 2013) 47%
Exchange Rate (Nov 2014) US$1 = NZ$1.28
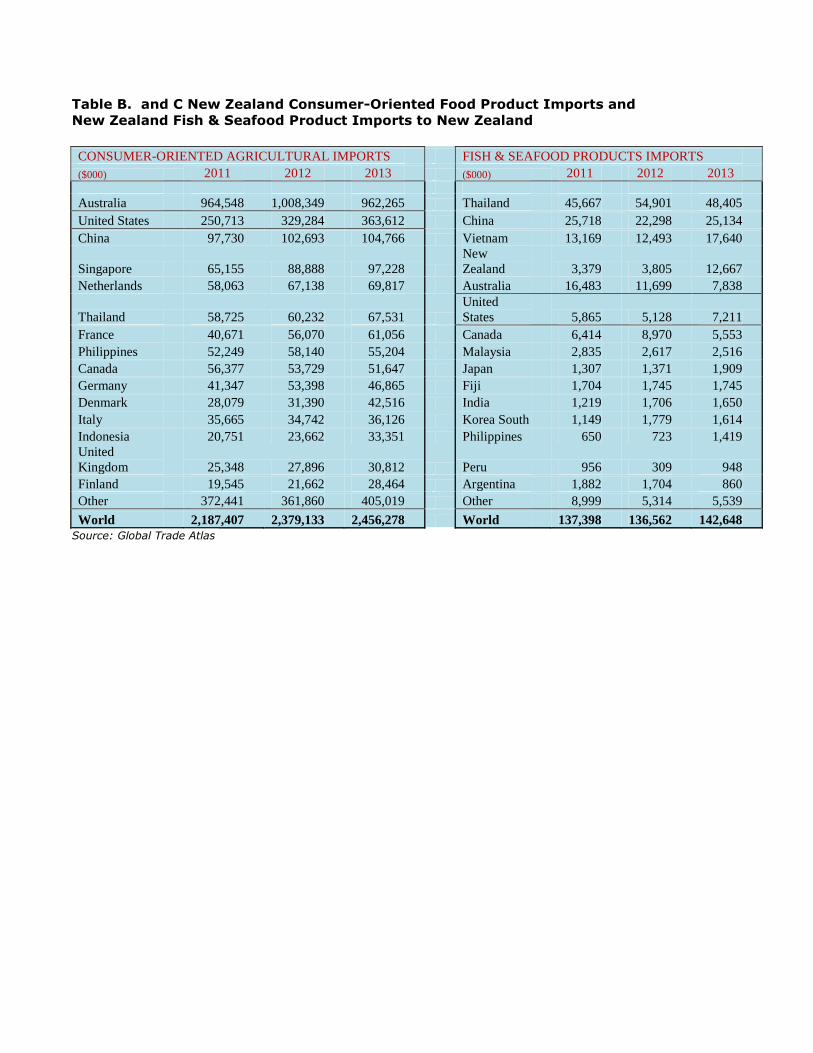
Table B. and C New Zealand Consumer-Oriented Food Product Imports and
New Zealand Fish & Seafood Product Imports to New Zealand
CONSUMER-ORIENTED AGRICULTURAL IMPORTS FISH & SEAFOOD PRODUCTS IMPORTS
($000) 2011 2012 2013 ($000) 2011 2012 2013
Australia 964,548 1,008,349 962,265 Thailand 45,667 54,901 48,405
United States 250,713 329,284 363,612 China 25,718 22,298 25,134
China 97,730 102,693 104,766 Vietnam 13,169 12,493 17,640
Singapore 65,155 88,888 97,228
New
Zealand 3,379 3,805 12,667
Netherlands 58,063 67,138 69,817 Australia 16,483 11,699 7,838
Thailand 58,725 60,232 67,531
United
States 5,865 5,128 7,211
France 40,671 56,070 61,056 Canada 6,414 8,970 5,553
Philippines 52,249 58,140 55,204 Malaysia 2,835 2,617 2,516
Canada 56,377 53,729 51,647 Japan 1,307 1,371 1,909
Germany 41,347 53,398 46,865 Fiji 1,704 1,745 1,745
Denmark 28,079 31,390 42,516 India 1,219 1,706 1,650
Italy 35,665 34,742 36,126 Korea South 1,149 1,779 1,614
Indonesia 20,751 23,662 33,351 Philippines 650 723 1,419
United
Kingdom 25,348 27,896 30,812 Peru 956 309 948
Finland 19,545 21,662 28,464 Argentina 1,882 1,704 860
Other 372,441 361,860 405,019 Other 8,999 5,314 5,539
World 2,187,407 2,379,133 2,456,278 World 137,398 136,562 142,648
Source: Global Trade Atlas
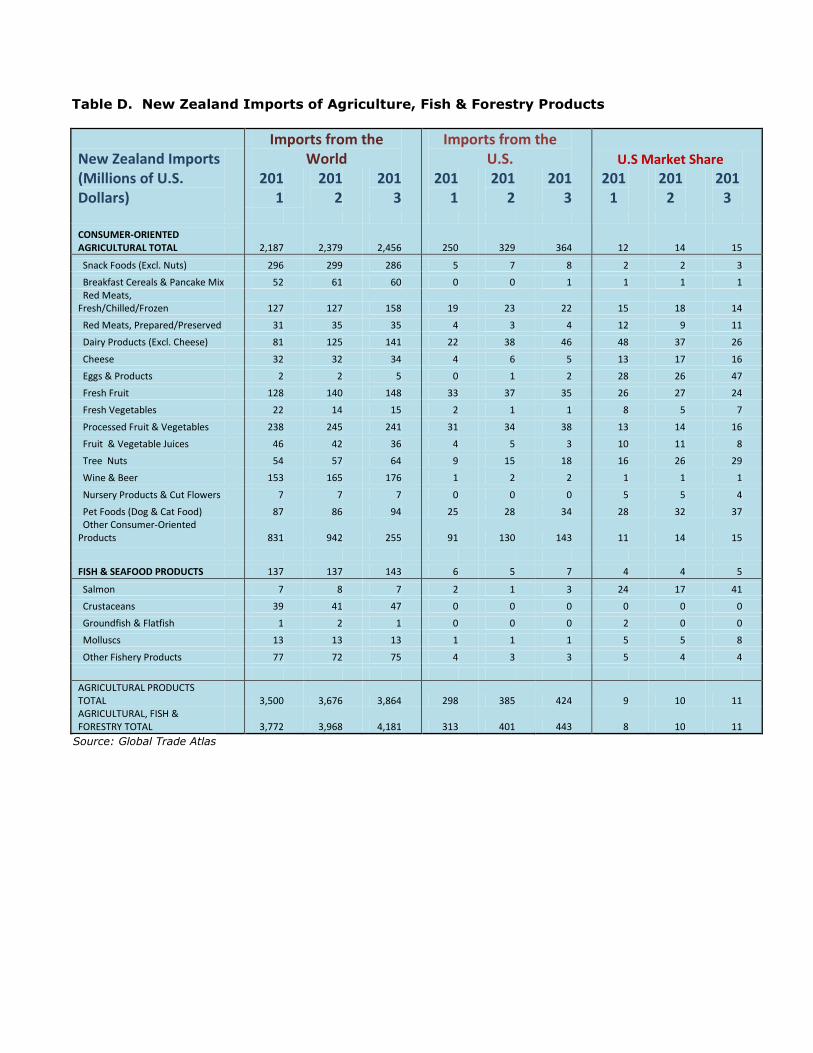
Table D. New Zealand Imports of Agriculture, Fish & Forestry Products
New Zealand Imports Imports from the
World Imports from the
U.S. U.S Market Share
(Millions of U.S. Dollars)
2011
2012
2013
2011
2012
2013
2011
2012
2013
CONSUMER-ORIENTED AGRICULTURAL TOTAL 2,187 2,379 2,456 250 329 364 12 14 15
Snack Foods (Excl. Nuts) 296 299 286 5 7 8 2 2 3
Breakfast Cereals & Pancake Mix 52 61 60 0 0 1 1 1 1 Red Meats, Fresh/Chilled/Frozen 127 127 158 19 23 22 15 18 14
Red Meats, Prepared/Preserved 31 35 35 4 3 4 12 9 11
Dairy Products (Excl. Cheese) 81 125 141 22 38 46 48 37 26
Cheese 32 32 34 4 6 5 13 17 16
Eggs & Products 2 2 5 0 1 2 28 26 47
Fresh Fruit 128 140 148 33 37 35 26 27 24
Fresh Vegetables 22 14 15 2 1 1 8 5 7
Processed Fruit & Vegetables 238 245 241 31 34 38 13 14 16
Fruit & Vegetable Juices 46 42 36 4 5 3 10 11 8
Tree Nuts 54 57 64 9 15 18 16 26 29
Wine & Beer 153 165 176 1 2 2 1 1 1
Nursery Products & Cut Flowers 7 7 7 0 0 0 5 5 4
Pet Foods (Dog & Cat Food) 87 86 94 25 28 34 28 32 37 Other Consumer-Oriented Products 831 942 255 91 130 143 11 14 15
FISH & SEAFOOD PRODUCTS 137 137 143 6 5 7 4 4 5
Salmon 7 8 7 2 1 3 24 17 41
Crustaceans 39 41 47 0 0 0 0 0 0
Groundfish & Flatfish 1 2 1 0 0 0 2 0 0
Molluscs 13 13 13 1 1 1 5 5 8
Other Fishery Products 77 72 75 4 3 3 5 4 4
AGRICULTURAL PRODUCTS TOTAL 3,500 3,676 3,864 298 385 424 9 10 11 AGRICULTURAL, FISH & FORESTRY TOTAL 3,772 3,968 4,181 313 401 443 8 10 11
Source: Global Trade Atlas
APPENDIX 2: DOMESTIC TRADE SHOWS
There are three major domestic Food Trade Shows in New Zealand: Fine Food Show (New Zealand –June 26-28, 2016, Auckland The Fine Food New Zealand show was first organized in 2010. It followed the same format as Fine Food
Australia, which has been running successfully for many years in the annually alternating locations of Sydney and Melbourne. Fine Food is an international event and attracts companies from Europe, Australia, Asia and New Zealand. This show focuses on food and beverage, as well as hospitality products. This show is a trade-only event, and all visitors from the food industry are invited to the show. For more information please contact the Foreign Agricultural Service office at the U.S. Embassy in Wellington:
Foreign Agricultural Service U.S. Embassy
29 Fitzherbert Terrace Thorndon Wellington 6011 New Zealand
Atn: Vinita Sharma Tel: +64-4-462 6030 Email: [email protected] You may also contact the show organizers directly at:
Exhibition Sales Manager
Fine Food Show New Zealand PO Box 47213, Ponsonby, Auckland Atn: Gail Lorigan
Tel: +64-9-376-4603 Email: [email protected]
Katrina Gordon Show (major metropolitan centers) This local food show takes place in 16 major cities of New Zealand, including Auckland, Wellington, Christchurch and Queenstown in different months throughout the year. For more information, contact:
Katrina Gordon Trade Shows PO Box 8647 Christchurch, New Zealand Tel: 64-3-348-2042 Fax: 64-3-348-0950 Web: www.katrinagordon.co.nz