Embed Size (px)
Citation preview

New to UBC (NUBC) New to UBC (NUBC) Student Survey, 2009Student Survey, 2009
Results for UBC-VancouverResults for UBC-Vancouver
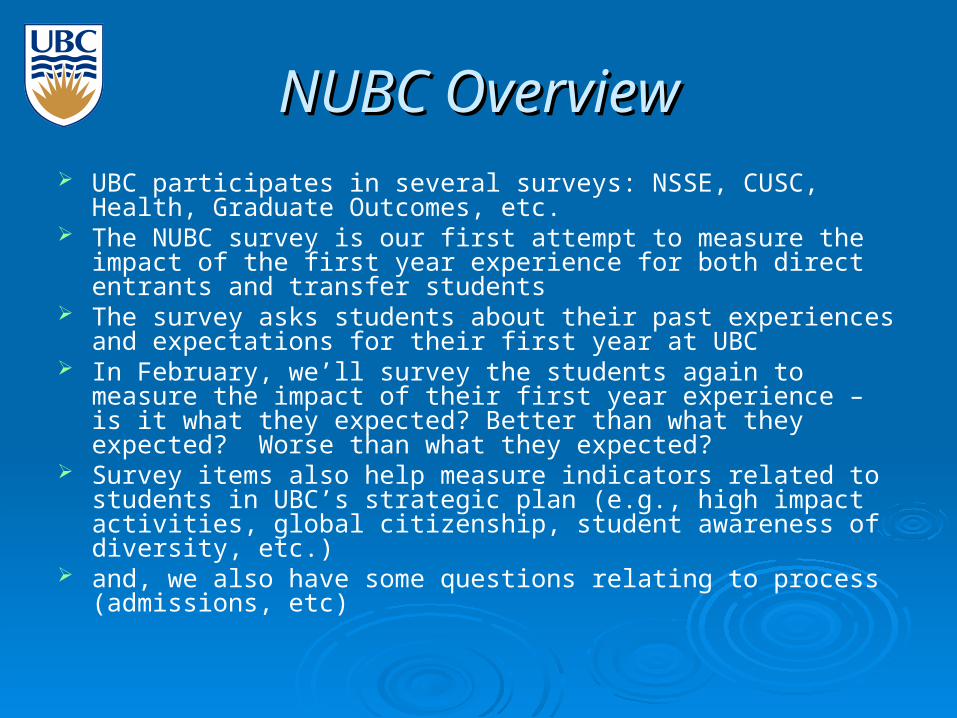
NUBC OverviewNUBC Overview UBC participates in several surveys: NSSE, CUSC, Health,
Graduate Outcomes, etc. The NUBC survey is our first attempt to measure the impact of the
first year experience for both direct entrants and transfer students The survey asks students about their past experiences and
expectations for their first year at UBC In February, we’ll survey the students again to measure the impact
of their first year experience – is it what they expected? Better than what they expected? Worse than what they expected?
Survey items also help measure indicators related to students in UBC’s strategic plan (e.g., high impact activities, global citizenship, student awareness of diversity, etc.)
and, we also have some questions relating to process (admissions, etc)
Survey DevelopmentSurvey Development
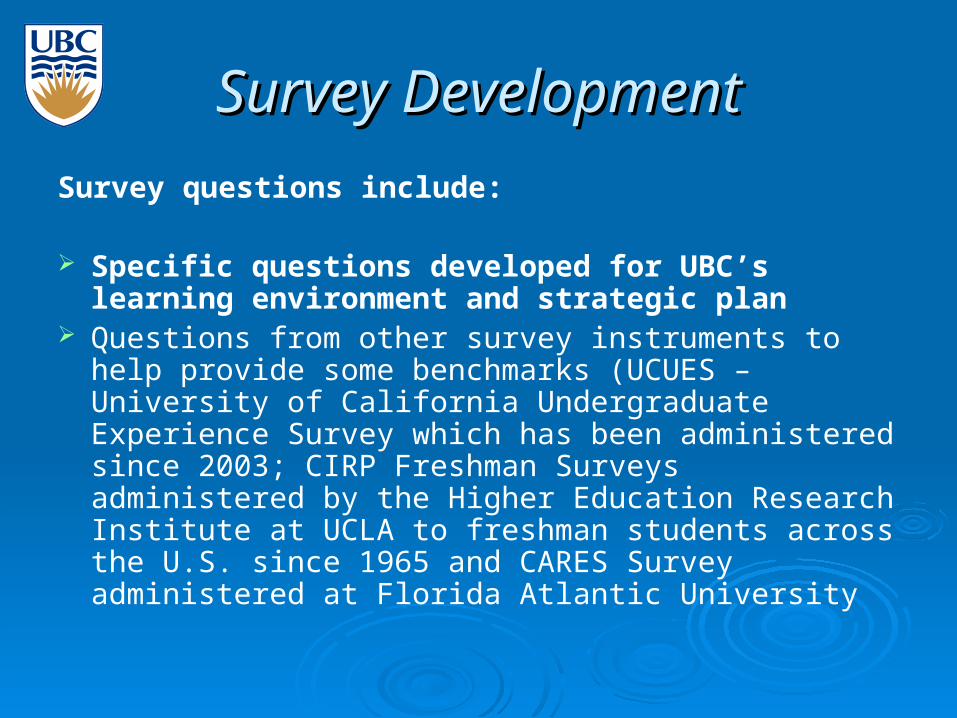
Survey questions include:
Specific questions developed for UBC’s learning environment and strategic plan
Questions from other survey instruments to help provide some benchmarks (UCUES – University of California Undergraduate Experience Survey which has been administered since 2003; CIRP Freshman Surveys administered by the Higher Education Research Institute at UCLA to freshman students across the U.S. since 1965 and CARES Survey administered at Florida Atlantic University
Survey DevelopmentSurvey Development
The survey was also developed to provide students with a mechanism to seek additional information or advice by way of pop-up questions
For example, students were asked if they planned to work for pay during the upcoming year. If they said ‘no’, they moved on to the next question. If they said ‘yes’, another question was displayed asking if they would like to be contacted with information about on-campus work opportunities.
Follow up emails and/or contact was then initiated with students where appropriate
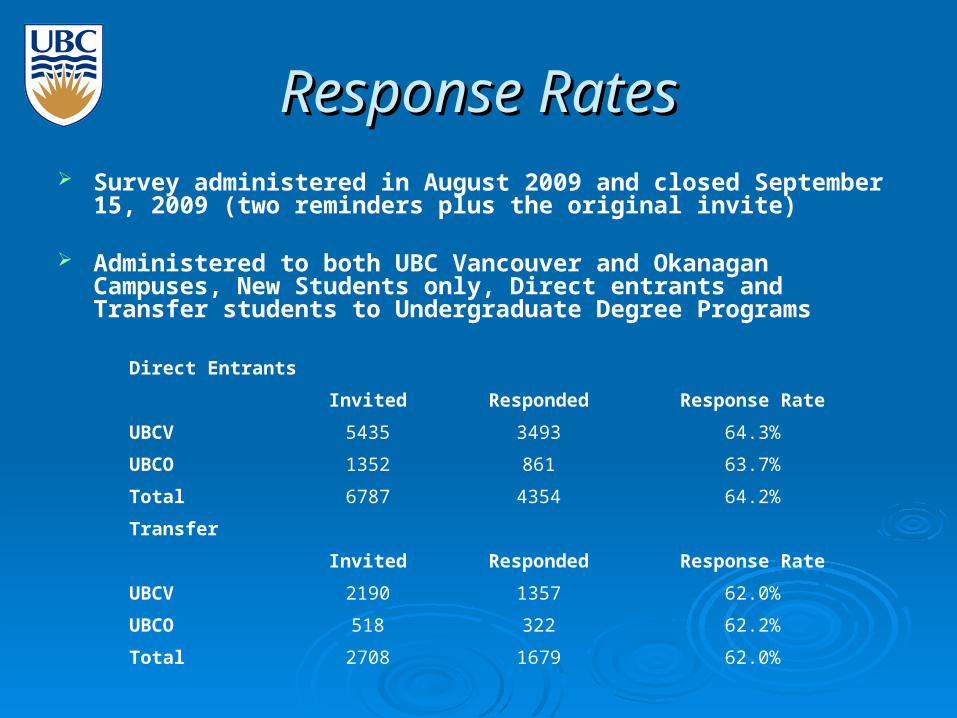
Response RatesResponse Rates Survey administered in August 2009 and closed September 15, 2009
(two reminders plus the original invite)
Administered to both UBC Vancouver and Okanagan Campuses, New Students only, Direct entrants and Transfer students to Undergraduate Degree Programs
Direct Entrants
Invited Responded Response Rate
UBCV 5435 3493 64.3%
UBCO 1352 861 63.7%
Total 6787 4354 64.2%
Transfer
Invited Responded Response Rate
UBCV 2190 1357 62.0%
UBCO 518 322 62.2%
Total 2708 1679 62.0%
How do response rates compare?How do response rates compare?
How does a response rate of 64% compare to other response rates?
In 2005, we achieved a 58% response rate on the BSSE survey
However, once students start their studies, they are overwhelmed with email communications and requests for survey participation leading to survey fatigue
In 2006 and 2008, the first year response rate for UBCV NSSE was ~29%
We need to do a better job of coordinating survey requests and managing email communications with students

Interpreting the DataInterpreting the Data Responses are reported in the form of means and frequencies.
Important differences are identified by: a) statistical significance (is the change unlikely to be simple chance
variation?) and b) effect sizes
Effect size indicates the “practical significance” of the mean difference. In practice, an effect size of .2 is often considered small, .5 moderate, and .8 large.
Summary of Findings:Summary of Findings:UBCV Direct EntrantsUBCV Direct Entrants
Summary of Findings
Connections to the strategic plan
UBC compared to U.S. Peers
UBCV compared to UBCO
Student Priorities on improving the experience for incoming students
Next Steps
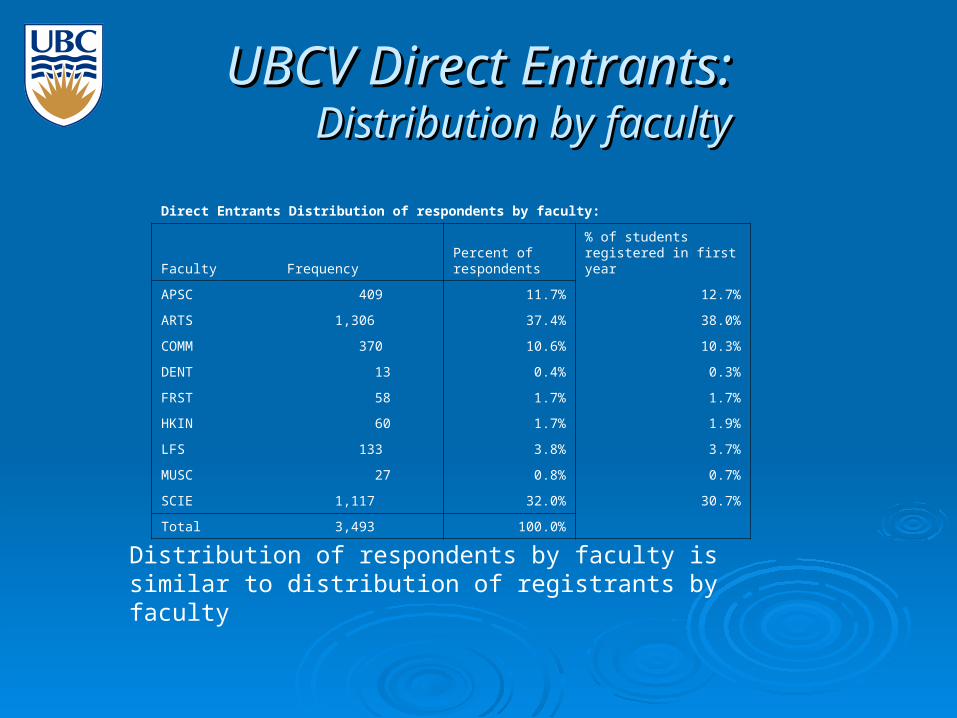
Direct Entrants Distribution of respondents by faculty:
Faculty FrequencyPercent of respondents
% of students registered in first year
APSC 409 11.7% 12.7%
ARTS 1,306 37.4% 38.0%
COMM 370 10.6% 10.3%
DENT 13 0.4% 0.3%
FRST 58 1.7% 1.7%
HKIN 60 1.7% 1.9%
LFS 133 3.8% 3.7%
MUSC 27 0.8% 0.7%
SCIE 1,117 32.0% 30.7%
Total 3,493 100.0%
UBCV Direct Entrants:UBCV Direct Entrants:Distribution by facultyDistribution by faculty
Distribution of respondents by faculty is similar to distribution of registrants by faculty
UBCV Direct Entrants:UBCV Direct Entrants:DemographicsDemographics
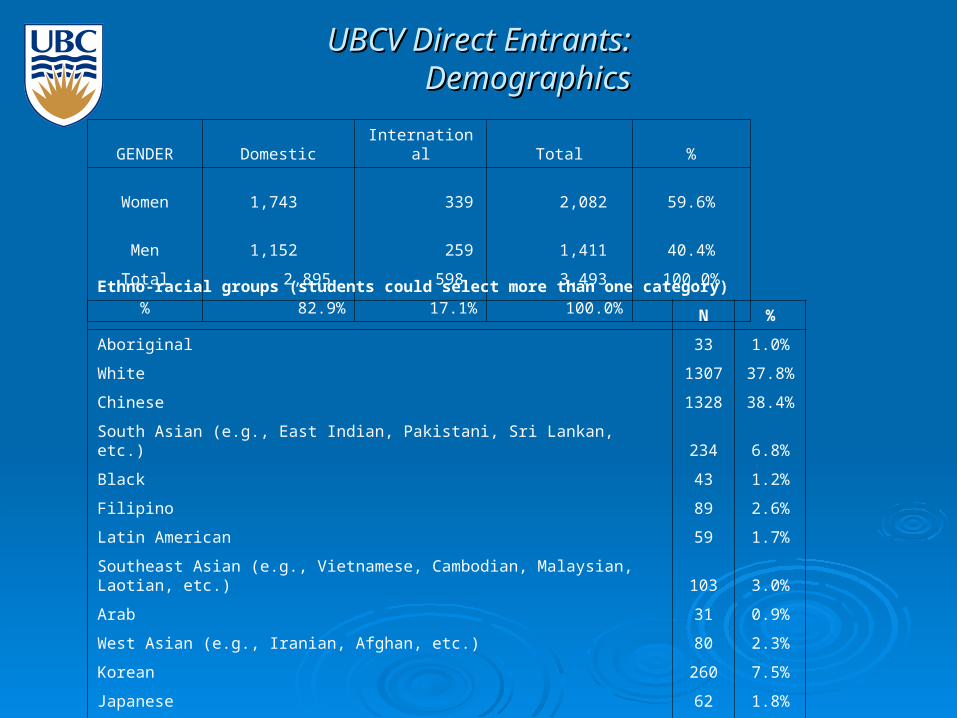
GENDER Domestic International Total %
Women 1,743 339 2,082 59.6%
Men 1,152 259 1,411 40.4%
Total 2,895 598 3,493 100.0%
% 82.9% 17.1% 100.0%
Ethno-racial groups (students could select more than one category)
N %
Aboriginal 33 1.0%
White 1307 37.8%
Chinese 1328 38.4%
South Asian (e.g., East Indian, Pakistani, Sri Lankan, etc.) 234 6.8%
Black 43 1.2%
Filipino 89 2.6%
Latin American 59 1.7%
Southeast Asian (e.g., Vietnamese, Cambodian, Malaysian, Laotian, etc.) 103 3.0%
Arab 31 0.9%
West Asian (e.g., Iranian, Afghan, etc.) 80 2.3%
Korean 260 7.5%
Japanese 62 1.8%
Other 207 6.0%
UBCV Direct Entrants:UBCV Direct Entrants:DemographicsDemographics
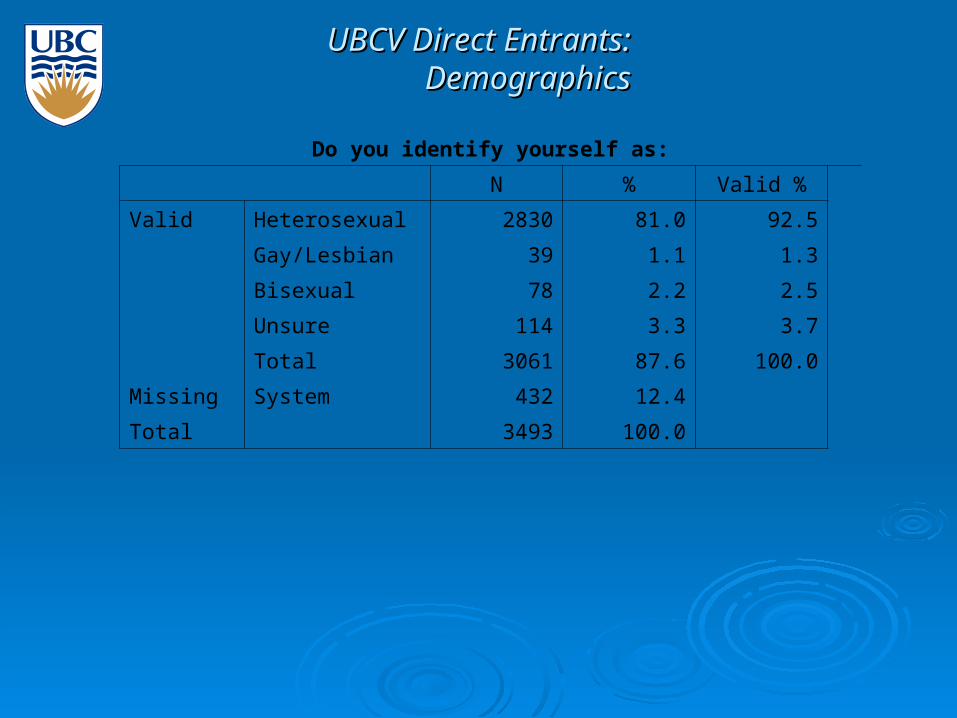
Do you identify yourself as:
N % Valid %
Valid Heterosexual 2830 81.0 92.5
Gay/Lesbian 39 1.1 1.3
Bisexual 78 2.2 2.5
Unsure 114 3.3 3.7
Total 3061 87.6 100.0
Missing System 432 12.4
Total 3493 100.0
UBCV Direct Entrants: more demographicsUBCV Direct Entrants: more demographics
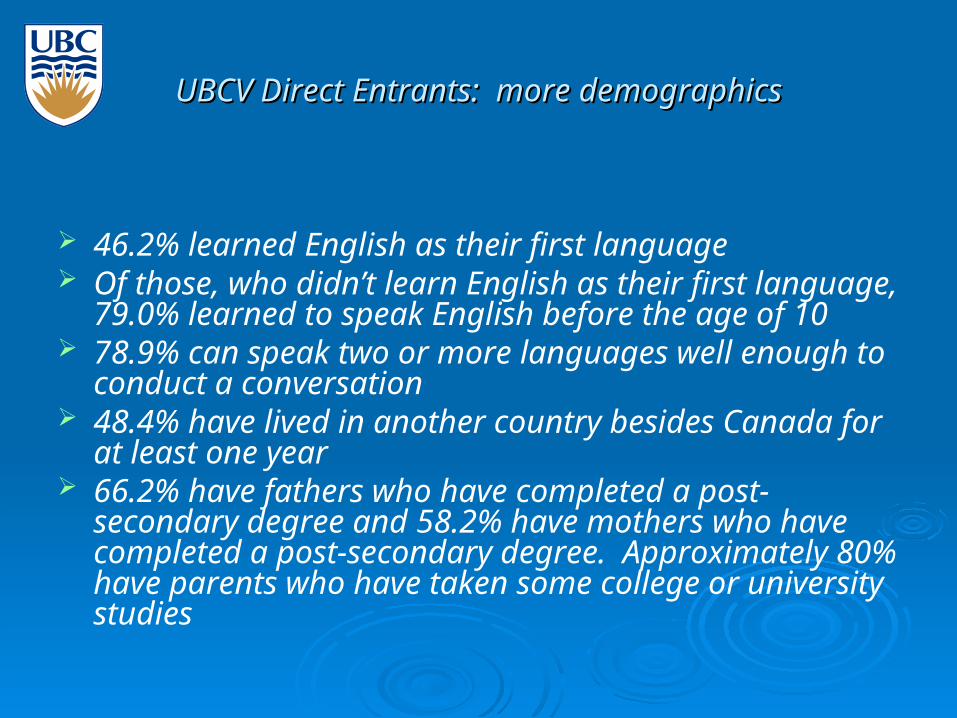
46.2% learned English as their first language Of those, who didn’t learn English as their first language,
79.0% learned to speak English before the age of 10 78.9% can speak two or more languages well enough to
conduct a conversation 48.4% have lived in another country besides Canada for
at least one year 66.2% have fathers who have completed a post-
secondary degree and 58.2% have mothers who have completed a post-secondary degree. Approximately 80% have parents who have taken some college or university studies
UBCV Direct Entrants: living and commutingUBCV Direct Entrants: living and commuting
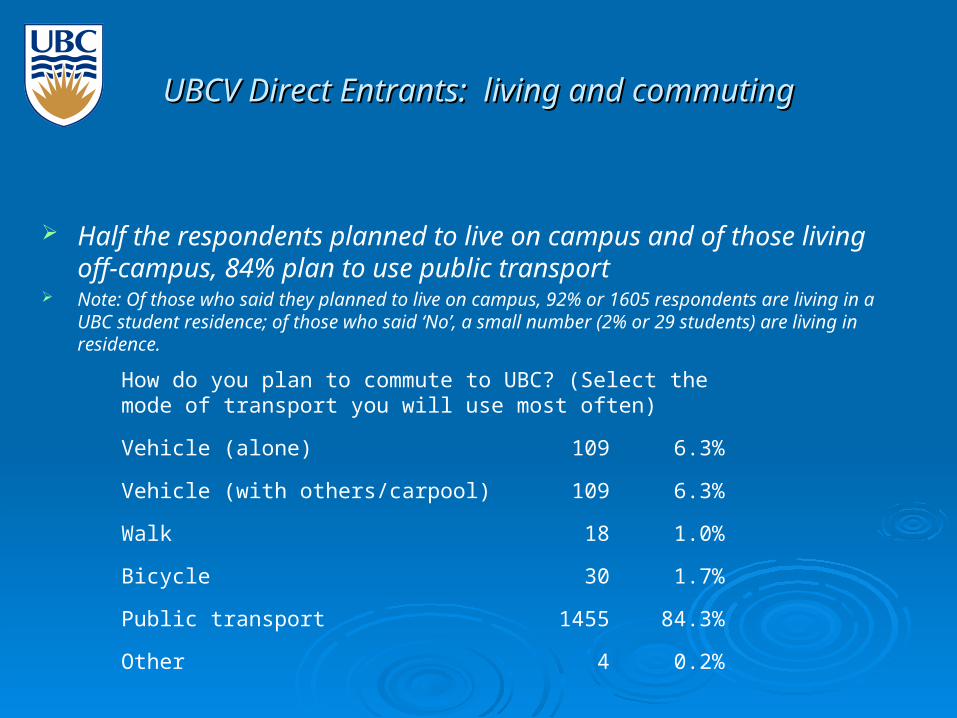
Half the respondents planned to live on campus and of those living off-campus, 84% plan to use public transport
Note: Of those who said they planned to live on campus, 92% or 1605 respondents are living in a UBC student residence; of those who said ‘No’, a small number (2% or 29 students) are living in residence.
How do you plan to commute to UBC? (Select the mode of transport you will use most often)
Vehicle (alone) 109 6.3%
Vehicle (with others/carpool) 109 6.3%
Walk 18 1.0%
Bicycle 30 1.7%
Public transport 1455 84.3%
Other 4 0.2%
UBCV Direct Entrants: finances and workUBCV Direct Entrants: finances and work
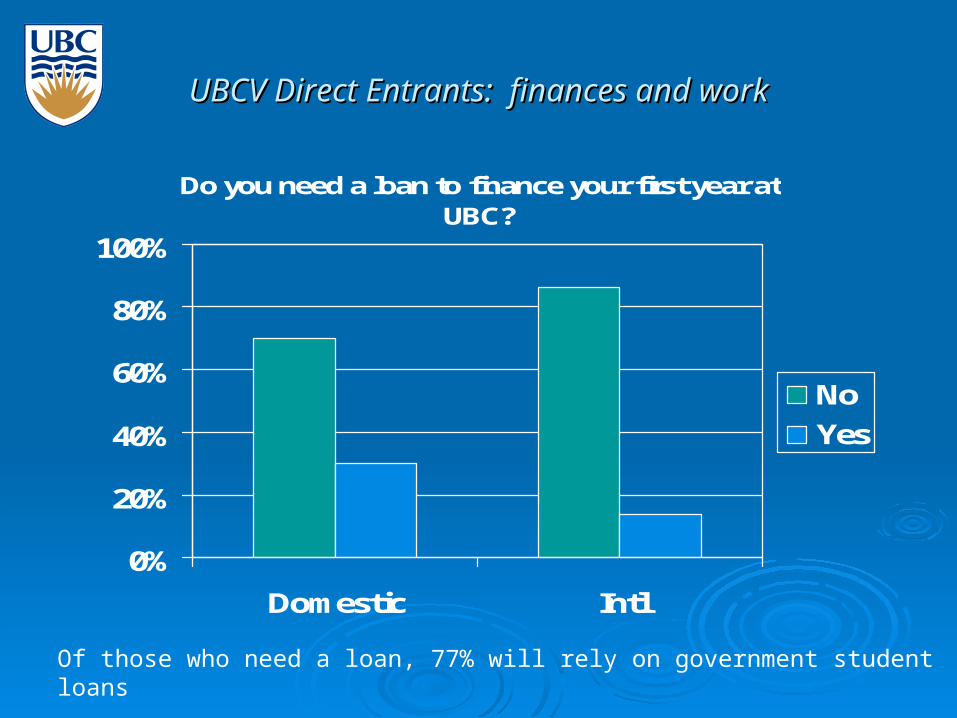
Do you need a loan to finance your first year at UBC?
0%
20%
40%
60%
80%
100%
Domestic Intl
No
Yes
Of those who need a loan, 77% will rely on government student loans
UBCV Direct Entrants: finances and workUBCV Direct Entrants: finances and work
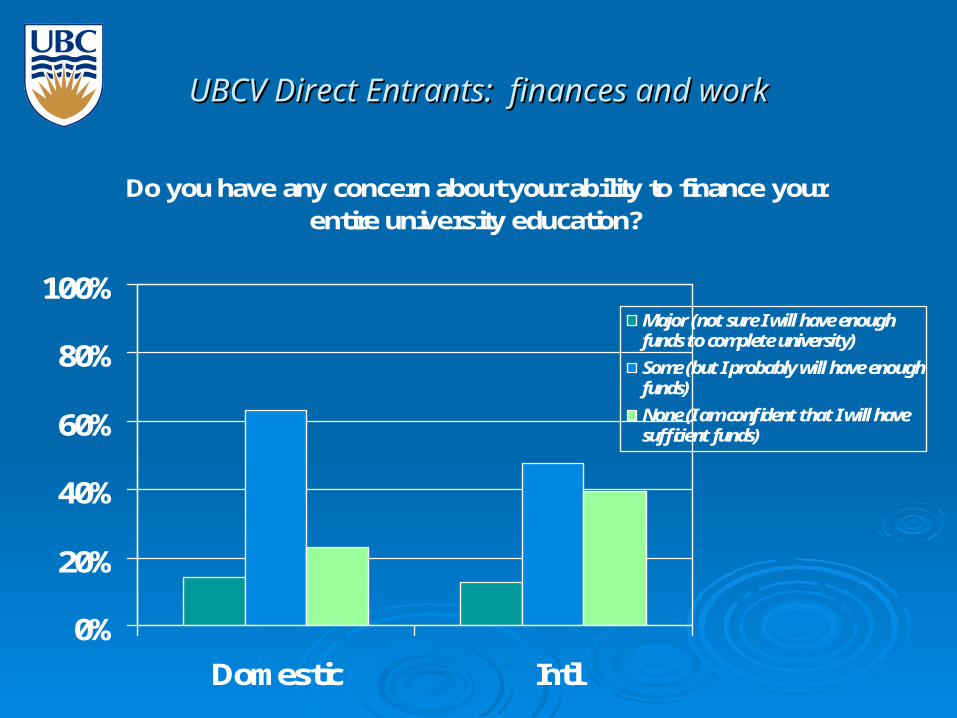
Do you have any concern about your ability to finance your entire university education?
0%
20%
40%
60%
80%
100%
Domestic Intl
Major (not sure I will have enoughfunds to complete university)
Some (but I probably will have enoughfunds)
None (I am confident that I will havesufficient funds)
UBCV Direct Entrants: finances and workUBCV Direct Entrants: finances and work
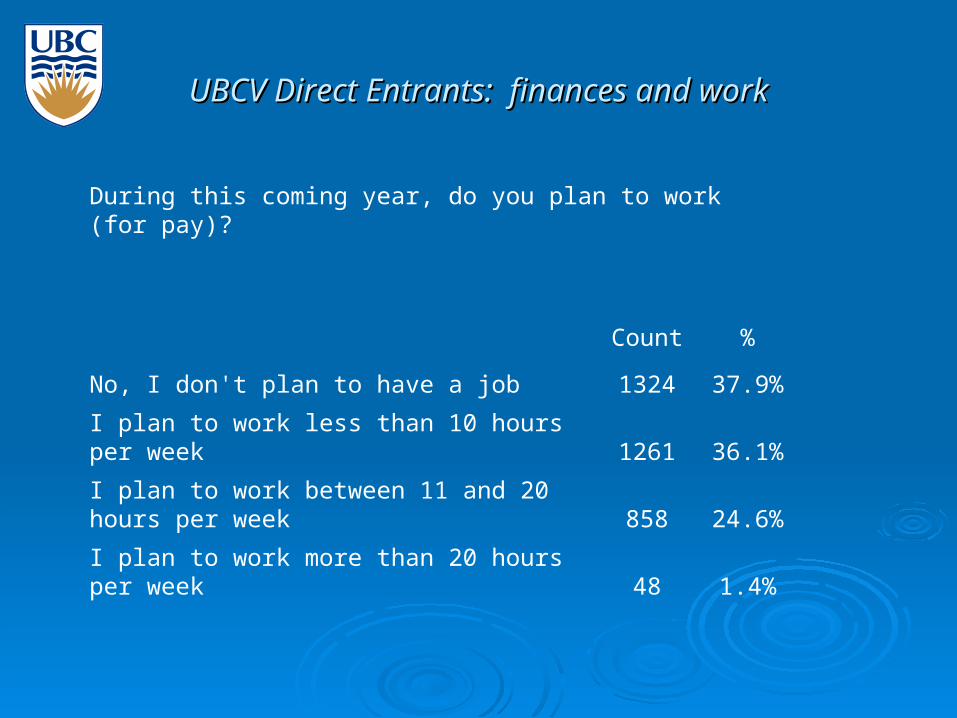
During this coming year, do you plan to work (for pay)?
Count %
No, I don't plan to have a job 1324 37.9%
I plan to work less than 10 hours per week 1261 36.1%
I plan to work between 11 and 20 hours per week 858 24.6%
I plan to work more than 20 hours per week 48 1.4%
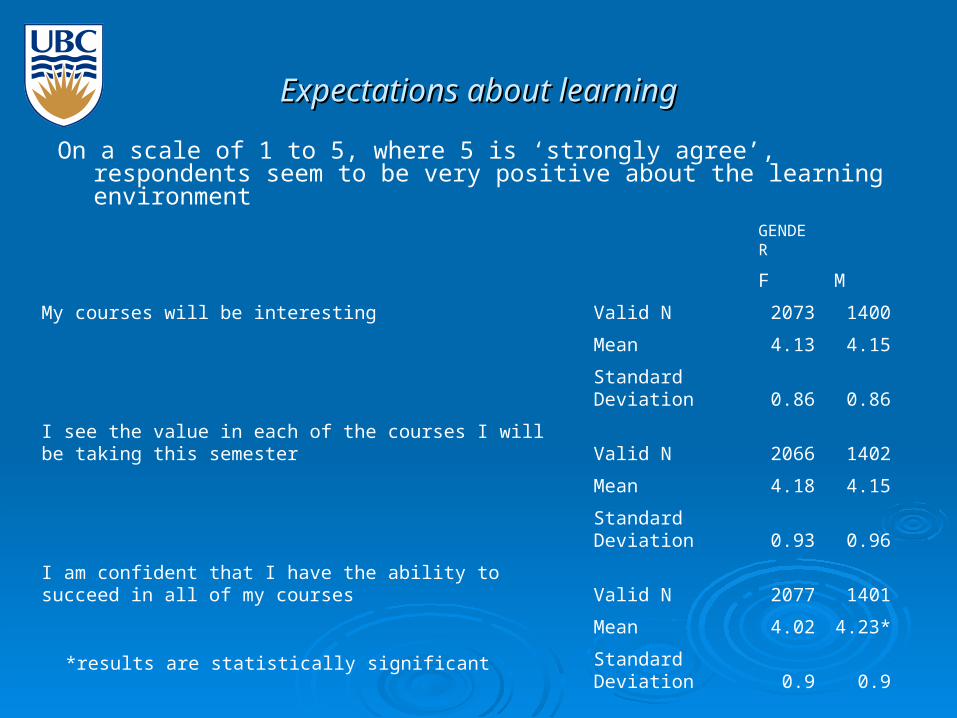
Expectations about learningExpectations about learning
On a scale of 1 to 5, where 5 is ‘strongly agree’, respondents seem to be very positive about the learning environment
GENDER
F M
My courses will be interesting Valid N 2073 1400
Mean 4.13 4.15
Standard Deviation 0.86 0.86
I see the value in each of the courses I will be taking this semester Valid N 2066 1402
Mean 4.18 4.15
Standard Deviation 0.93 0.96
I am confident that I have the ability to succeed in all of my courses Valid N 2077 1401
Mean 4.02 4.23*
Standard Deviation 0.9 0.9
*results are statistically significant
Expectations about learningExpectations about learning
….and respondents are also confident of their ability to achieve good grades.
Overall grade average that students expect to achieve during their first year at UBC
0%
10%
20%
30%
40%
50%
60%
70%
(80-100)A (68-79)B (55-67)C (50-54)D (0-49)F
Expectations about learningExpectations about learning
We know however that students are going to be very disappointed with their actual performance
Respondent expectations of first year grades compared to actual first year grades in 2008
0%
10%
20%
30%
40%
50%
60%
70%
(80-100)A (68-79)B (55-67)C (50-54)D (0-49)F
expected
actual in 2008
Actual grades in 2008 for first year only, registered in a minimum of 24 credits, undergraduate degree programs
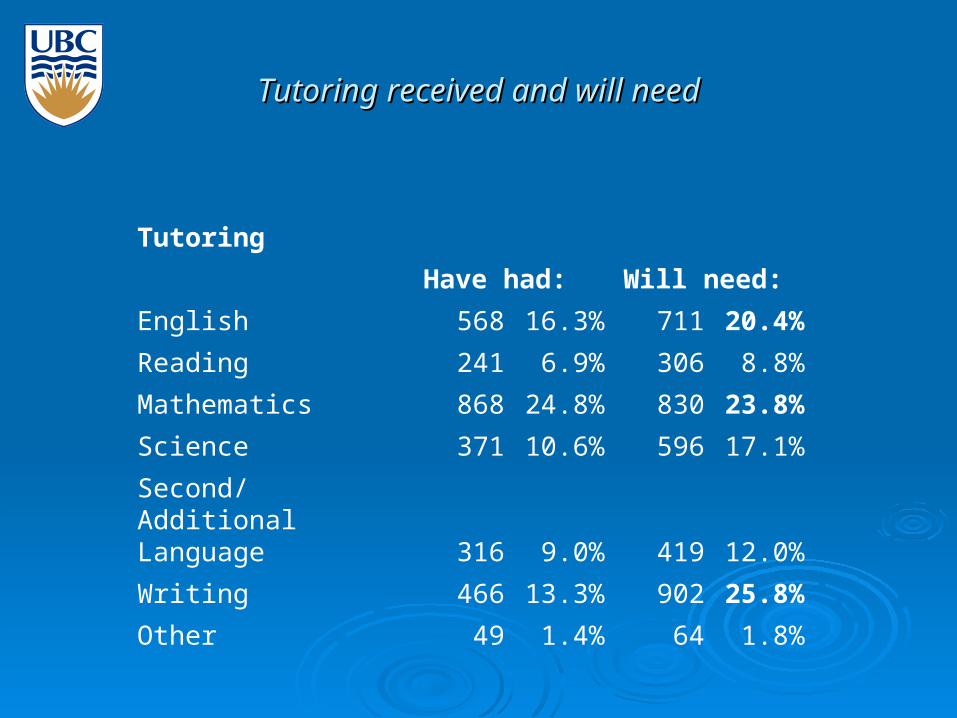
Tutoring received and will needTutoring received and will need
Tutoring
Have had: Will need:
English 568 16.3% 711 20.4%
Reading 241 6.9% 306 8.8%
Mathematics 868 24.8% 830 23.8%
Science 371 10.6% 596 17.1%
Second/Additional Language 316 9.0% 419 12.0%
Writing 466 13.3% 902 25.8%
Other 49 1.4% 64 1.8%
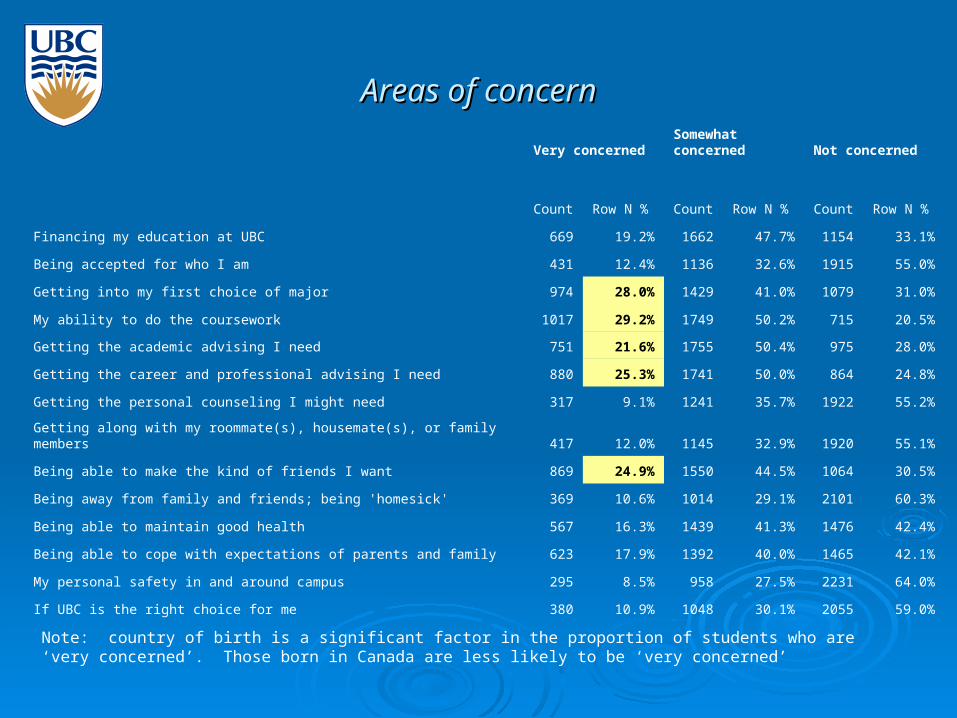
Areas of concernAreas of concern
Very concernedSomewhat concerned Not concerned
Count Row N % Count Row N % Count Row N %
Financing my education at UBC 669 19.2% 1662 47.7% 1154 33.1%
Being accepted for who I am 431 12.4% 1136 32.6% 1915 55.0%
Getting into my first choice of major 974 28.0% 1429 41.0% 1079 31.0%
My ability to do the coursework 1017 29.2% 1749 50.2% 715 20.5%
Getting the academic advising I need 751 21.6% 1755 50.4% 975 28.0%
Getting the career and professional advising I need 880 25.3% 1741 50.0% 864 24.8%
Getting the personal counseling I might need 317 9.1% 1241 35.7% 1922 55.2%
Getting along with my roommate(s), housemate(s), or family members 417 12.0% 1145 32.9% 1920 55.1%
Being able to make the kind of friends I want 869 24.9% 1550 44.5% 1064 30.5%
Being away from family and friends; being 'homesick' 369 10.6% 1014 29.1% 2101 60.3%
Being able to maintain good health 567 16.3% 1439 41.3% 1476 42.4%
Being able to cope with expectations of parents and family 623 17.9% 1392 40.0% 1465 42.1%
My personal safety in and around campus 295 8.5% 958 27.5% 2231 64.0%
If UBC is the right choice for me 380 10.9% 1048 30.1% 2055 59.0%
Note: country of birth is a significant factor in the proportion of students who are ‘very concerned’. Those born in Canada are less likely to be ‘very concerned’
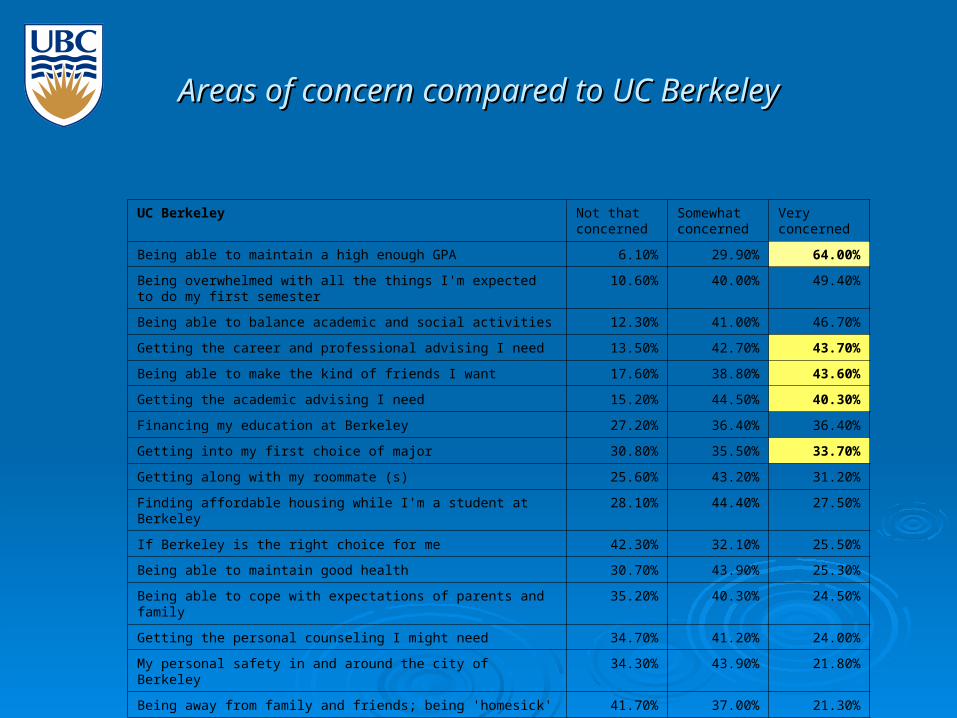
Areas of concern compared to UC BerkeleyAreas of concern compared to UC Berkeley
UC Berkeley Not that concerned
Somewhat concerned
Very concerned
Being able to maintain a high enough GPA 6.10% 29.90% 64.00%
Being overwhelmed with all the things I'm expected to do my first semester
10.60% 40.00% 49.40%
Being able to balance academic and social activities 12.30% 41.00% 46.70%
Getting the career and professional advising I need 13.50% 42.70% 43.70%
Being able to make the kind of friends I want 17.60% 38.80% 43.60%
Getting the academic advising I need 15.20% 44.50% 40.30%
Financing my education at Berkeley 27.20% 36.40% 36.40%
Getting into my first choice of major 30.80% 35.50% 33.70%
Getting along with my roommate (s) 25.60% 43.20% 31.20%
Finding affordable housing while I'm a student at Berkeley 28.10% 44.40% 27.50%
If Berkeley is the right choice for me 42.30% 32.10% 25.50%
Being able to maintain good health 30.70% 43.90% 25.30%
Being able to cope with expectations of parents and family 35.20% 40.30% 24.50%
Getting the personal counseling I might need 34.70% 41.20% 24.00%
My personal safety in and around the city of Berkeley 34.30% 43.90% 21.80%
Being away from family and friends; being 'homesick' 41.70% 37.00% 21.30%
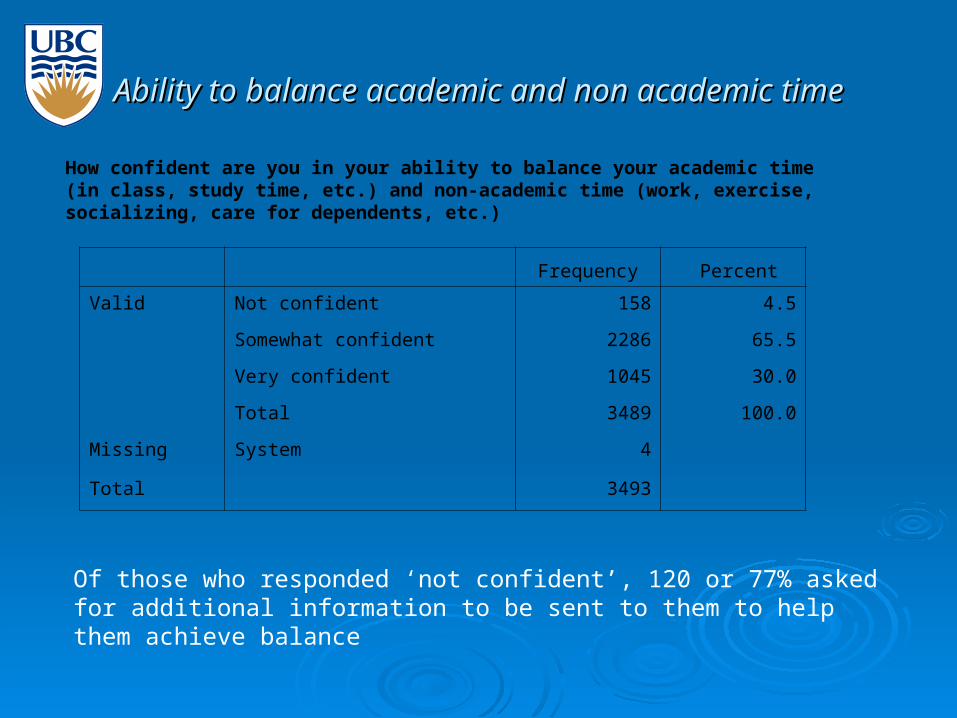
Ability to balance academic and non academic timeAbility to balance academic and non academic time
Frequency Percent
Valid Not confident 158 4.5
Somewhat confident 2286 65.5
Very confident 1045 30.0
Total 3489 100.0
Missing System 4
Total 3493
How confident are you in your ability to balance your academic time (in class, study time, etc.) and non-academic time (work, exercise, socializing, care for dependents, etc.)
Of those who responded ‘not confident’, 120 or 77% asked for additional information to be sent to them to help them achieve balance
0%
10%
20%
30%
40%
50%
60%
UBC V UC B
Self-awareness and understanding
Very poor
Poor
Fair
Good
Very Good
Excellent
0%
10%
20%
30%
40%
50%
60%
UBC V UC B
Ability to appreciate, tolerate and understand racialand ethnic diversity
Very poor
Poor
Fair
Good
Very Good
Excellent
0%
10%
20%
30%
40%
50%
60%
UBC V UC B
Ability to appreciate cultural and globaldiversity
Very poor
Poor
Fair
Good
Very Good
Excellent0%
10%
20%
30%
40%
50%
60%
UBC V UC B
Ability to speak clearly and effectively inEnglish
Very poor
Poor
Fair
Good
Very Good
Excellent
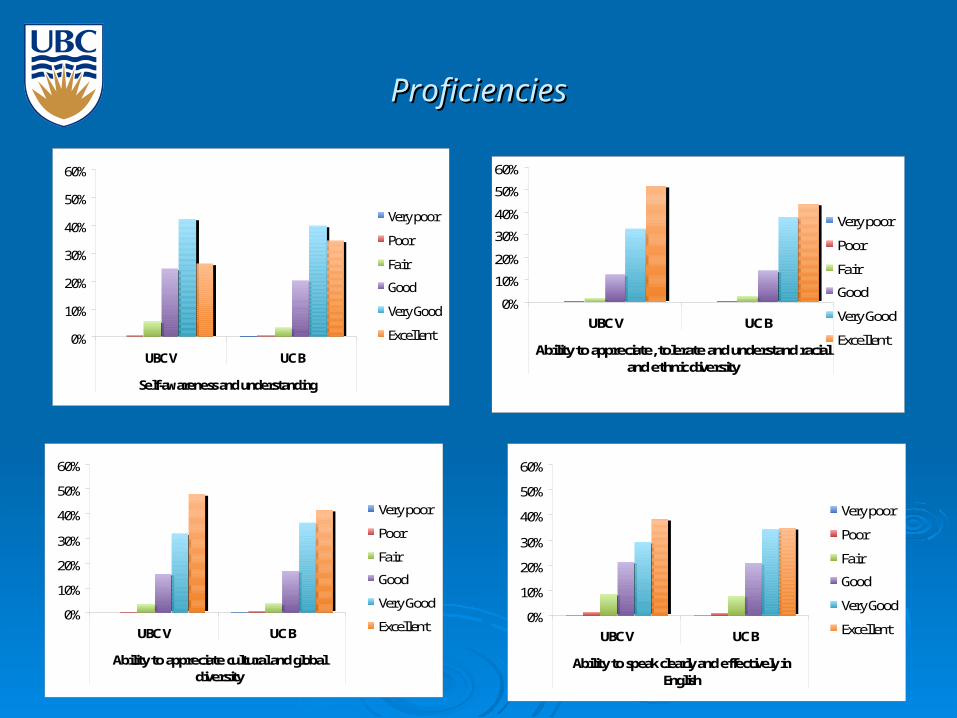
ProficienciesProficiencies
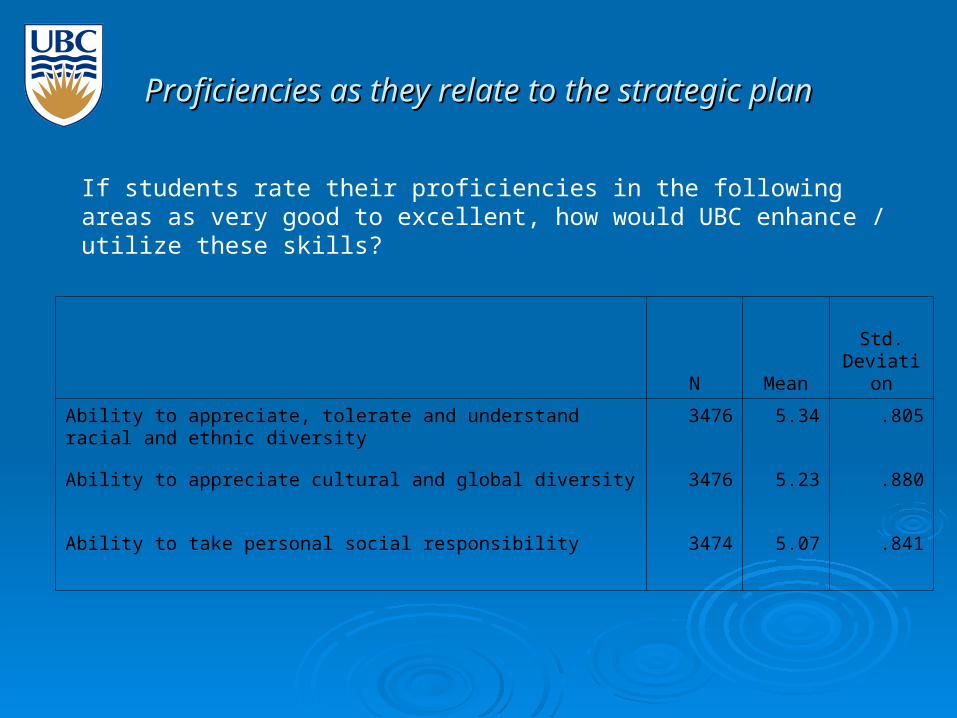
N MeanStd.
Deviation
Ability to appreciate, tolerate and understand racial and ethnic diversity
3476 5.34 .805
Ability to appreciate cultural and global diversity 3476 5.23 .880
Ability to take personal social responsibility 3474 5.07 .841
Proficiencies as they relate to the strategic planProficiencies as they relate to the strategic plan
If students rate their proficiencies in the following areas as very good to excellent, how would UBC enhance / utilize these skills?
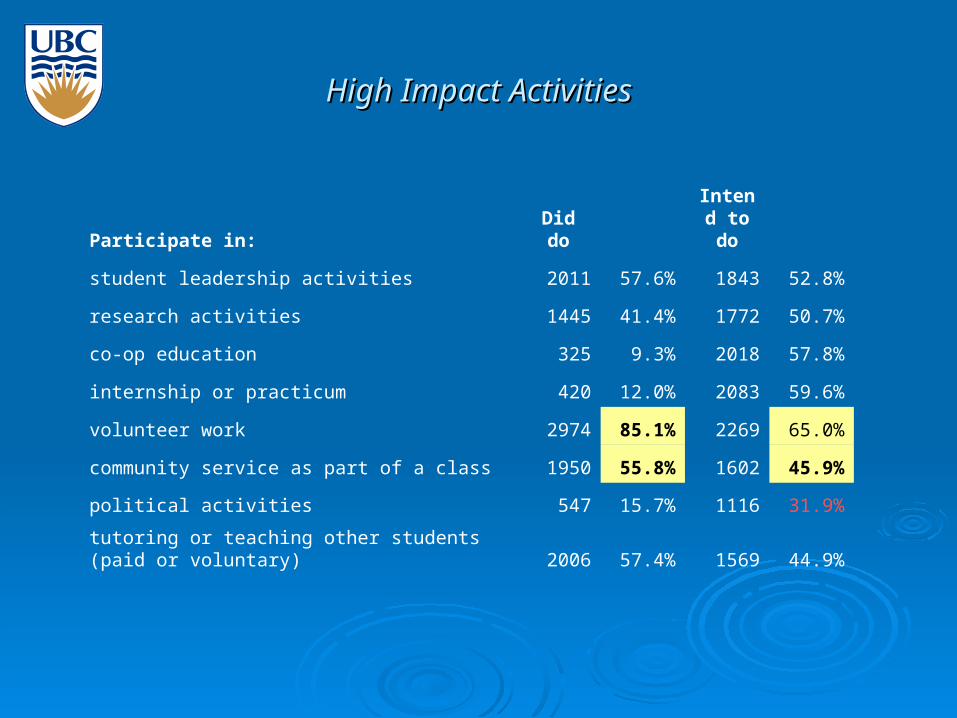
High Impact ActivitiesHigh Impact Activities
Participate in: Did doIntend to do
student leadership activities 2011 57.6% 1843 52.8%
research activities 1445 41.4% 1772 50.7%
co-op education 325 9.3% 2018 57.8%
internship or practicum 420 12.0% 2083 59.6%
volunteer work 2974 85.1% 2269 65.0%
community service as part of a class 1950 55.8% 1602 45.9%
political activities 547 15.7% 1116 31.9%
tutoring or teaching other students (paid or voluntary) 2006 57.4% 1569 44.9%
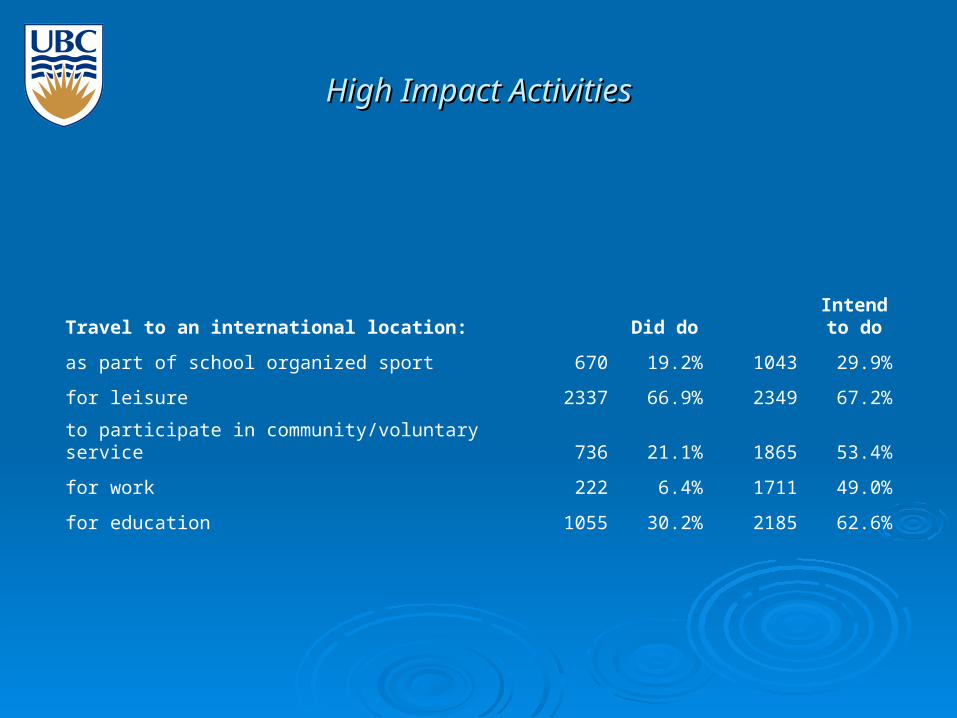
High Impact ActivitiesHigh Impact Activities
Travel to an international location: Did doIntend to do
as part of school organized sport 670 19.2% 1043 29.9%
for leisure 2337 66.9% 2349 67.2%
to participate in community/voluntary service 736 21.1% 1865 53.4%
for work 222 6.4% 1711 49.0%
for education 1055 30.2% 2185 62.6%
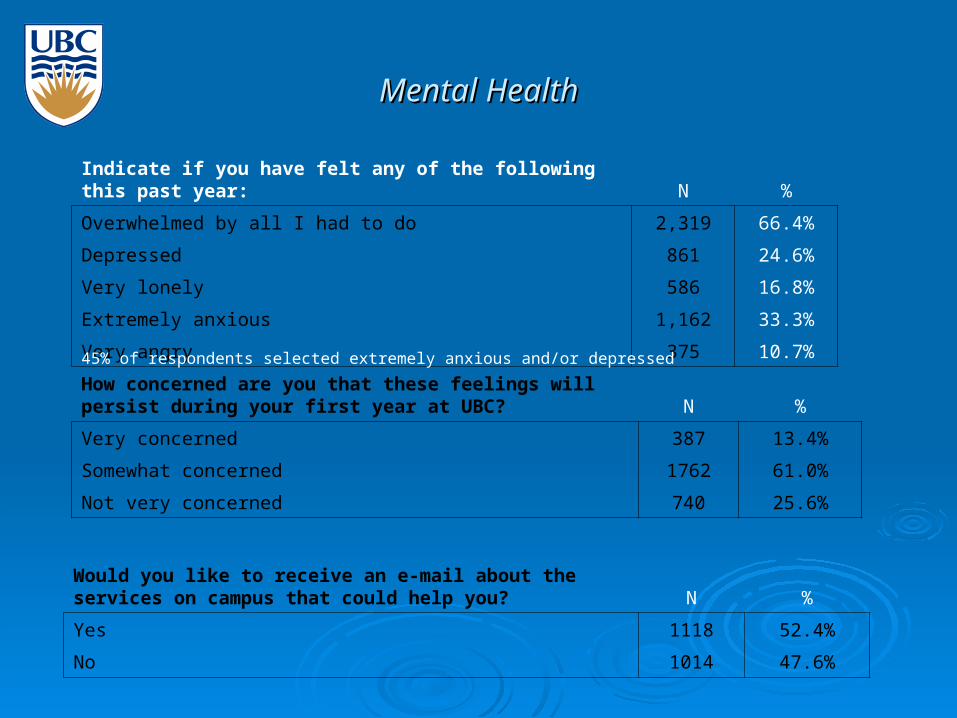
Mental HealthMental Health
Indicate if you have felt any of the following this past year: N %
Overwhelmed by all I had to do 2,319 66.4%
Depressed 861 24.6%
Very lonely 586 16.8%
Extremely anxious 1,162 33.3%
Very angry 375 10.7%
How concerned are you that these feelings will persist during your first year at UBC? N %
Very concerned 387 13.4%
Somewhat concerned 1762 61.0%
Not very concerned 740 25.6%
Would you like to receive an e-mail about the services on campus that could help you? N %
Yes 1118 52.4%
No 1014 47.6%
45% of respondents selected extremely anxious and/or depressed
Comparisons between UBCV and UBCOComparisons between UBCV and UBCO
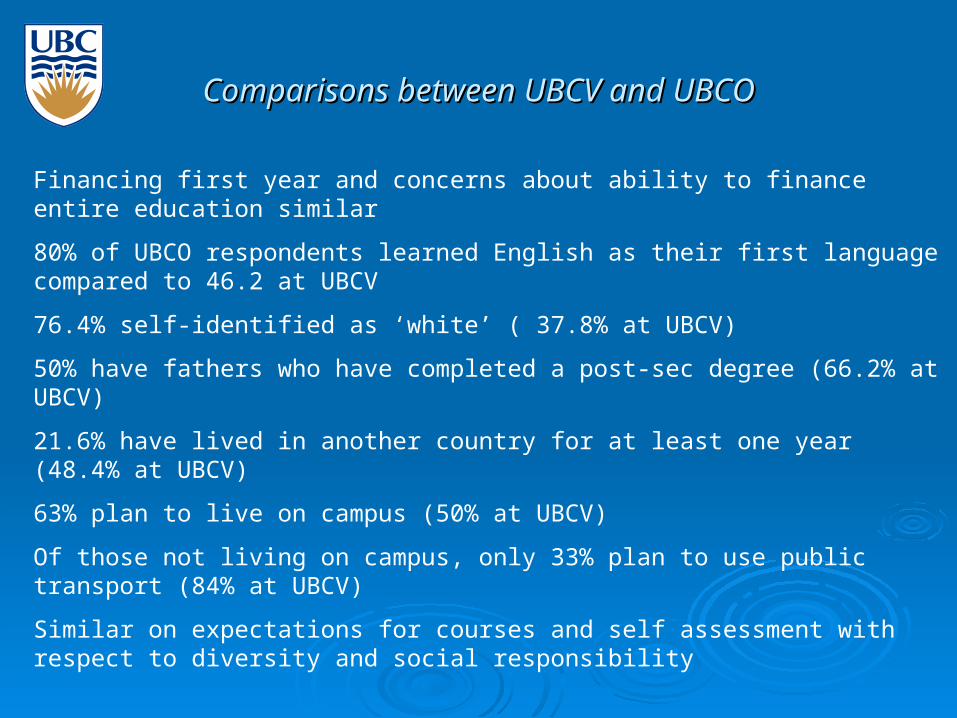
Financing first year and concerns about ability to finance entire education similar
80% of UBCO respondents learned English as their first language compared to 46.2 at UBCV
76.4% self-identified as ‘white’ ( 37.8% at UBCV)
50% have fathers who have completed a post-sec degree (66.2% at UBCV)
21.6% have lived in another country for at least one year (48.4% at UBCV)
63% plan to live on campus (50% at UBCV)
Of those not living on campus, only 33% plan to use public transport (84% at UBCV)
Similar on expectations for courses and self assessment with respect to diversity and social responsibility
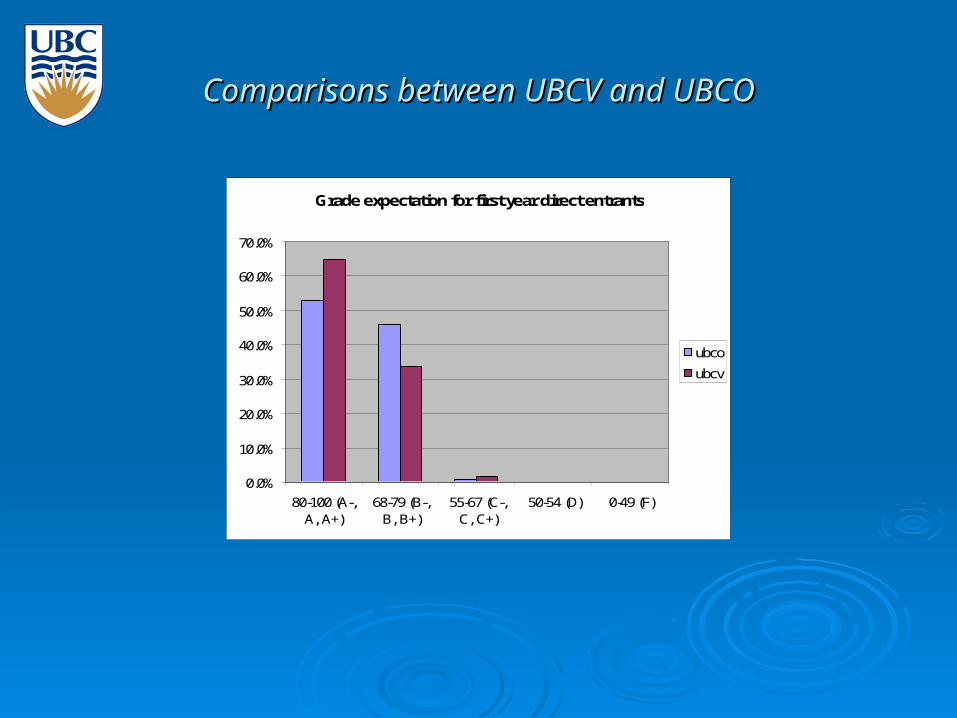
Comparisons between UBCV and UBCOComparisons between UBCV and UBCO
Grade expectation for first year direct entrants
0.0%
10.0%
20.0%
30.0%
40.0%
50.0%
60.0%
70.0%
80-100 (A-,A, A+)
68-79 (B-,B, B+)
55-67 (C-,C, C+)
50-54 (D) 0-49 (F)
ubco
ubcv
Comparisons between UBCV and UBCOComparisons between UBCV and UBCO
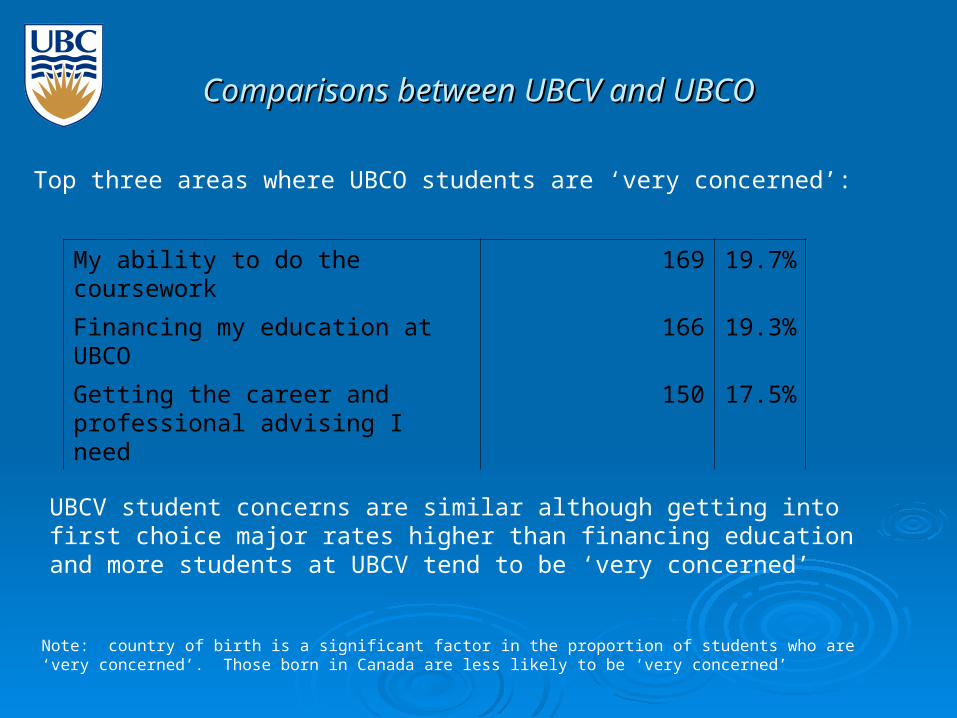
Top three areas where UBCO students are ‘very concerned’:
My ability to do the coursework 169 19.7%
Financing my education at UBCO 166 19.3%
Getting the career and professional advising I need
150 17.5%
UBCV student concerns are similar although getting into first choice major rates higher than financing education and more students at UBCV tend to be ‘very concerned’
Note: country of birth is a significant factor in the proportion of students who are ‘very concerned’. Those born in Canada are less likely to be ‘very concerned’
What are respondents looking forward to the most? What are respondents looking forward to the most?
Students were asked to identify two areas that excited them the most about the upcoming year
Meeting new people New environment Interesting classes Living alone; change of environment Clubs and new experiences
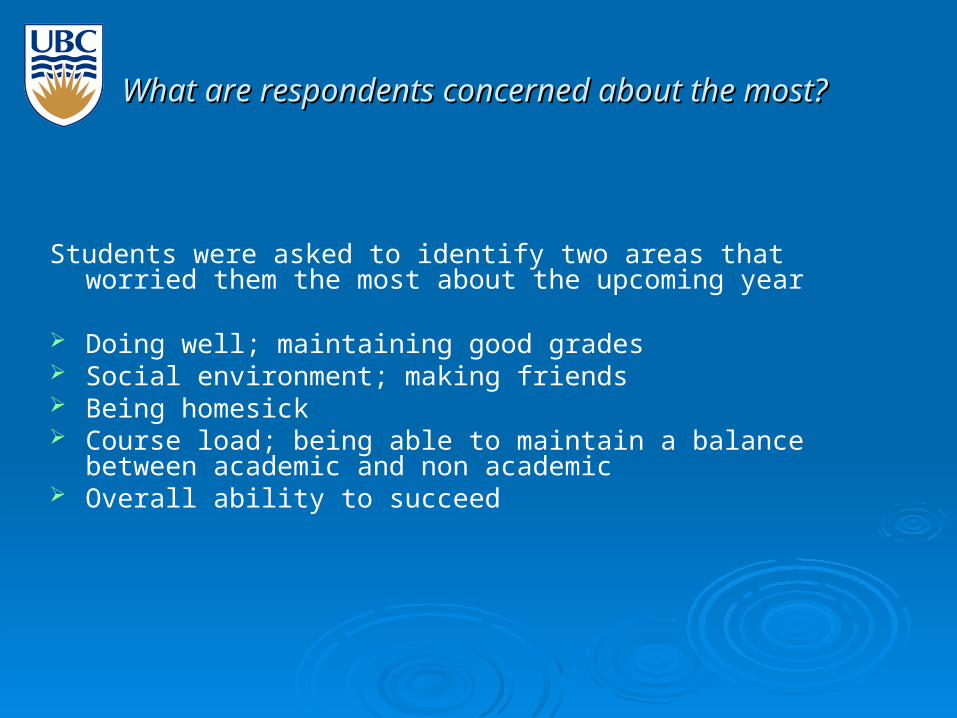
What are respondents concerned about the most? What are respondents concerned about the most?
Students were asked to identify two areas that worried them the most about the upcoming year
Doing well; maintaining good grades Social environment; making friends Being homesick Course load; being able to maintain a balance between academic
and non academic Overall ability to succeed
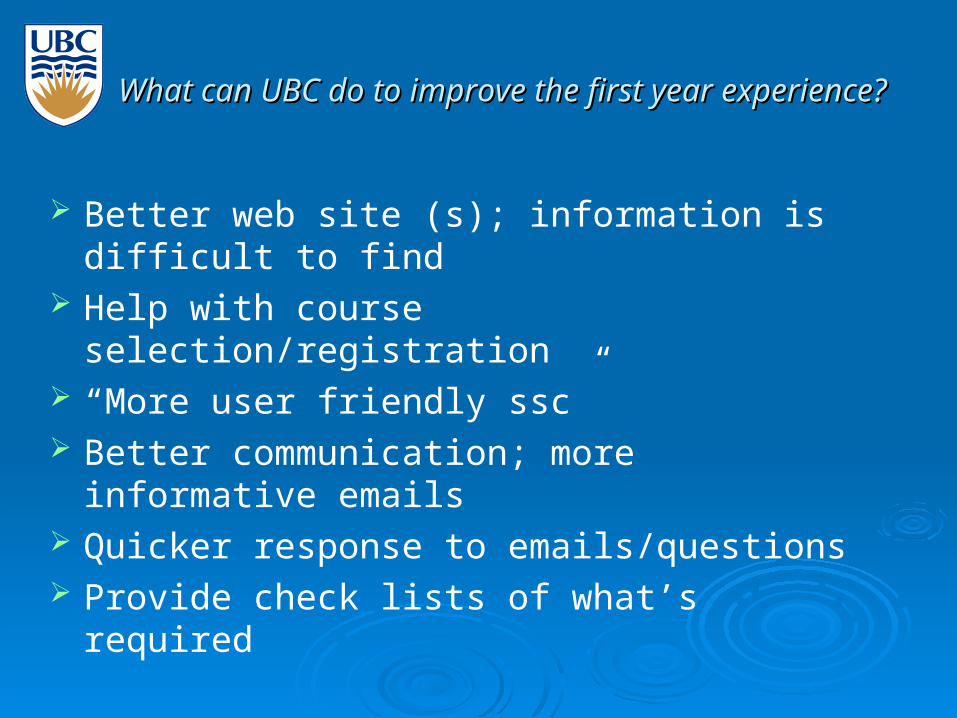
What can UBC do to improve the first year experience? What can UBC do to improve the first year experience?
Better web site (s); information is difficult to find Help with course selection/registration “More user friendly ssc” Better communication; more informative emails Quicker response to emails/questions Provide check lists of what’s required
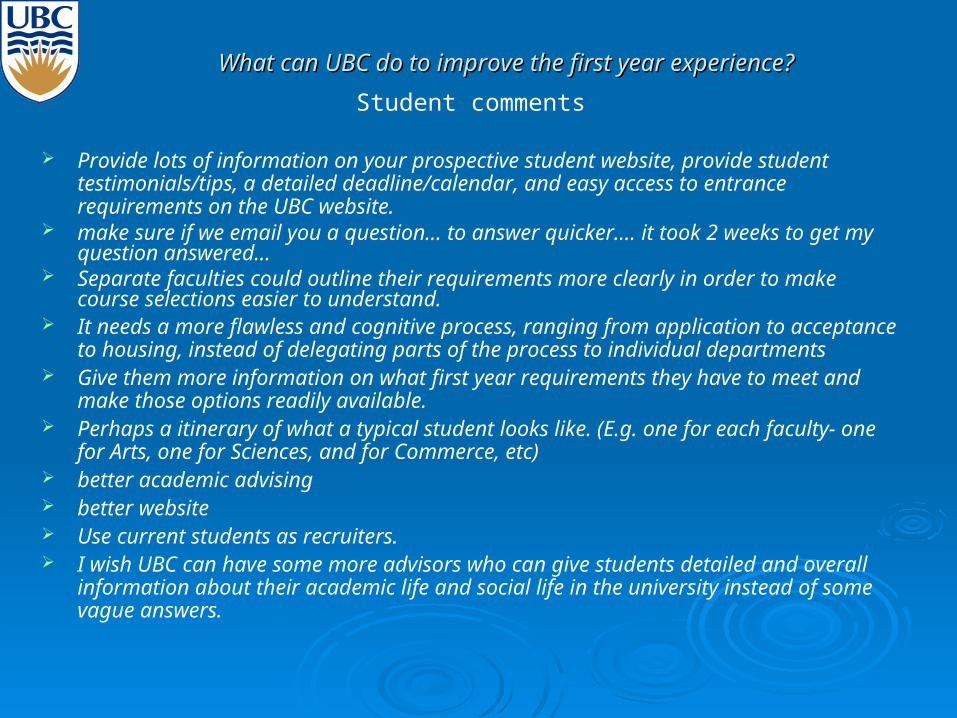
What can UBC do to improve the first year experience?What can UBC do to improve the first year experience? Student comments
Provide lots of information on your prospective student website, provide student testimonials/tips, a detailed deadline/calendar, and easy access to entrance requirements on the UBC website.
make sure if we email you a question... to answer quicker.... it took 2 weeks to get my question answered...
Separate faculties could outline their requirements more clearly in order to make course selections easier to understand.
It needs a more flawless and cognitive process, ranging from application to acceptance to housing, instead of delegating parts of the process to individual departments
Give them more information on what first year requirements they have to meet and make those options readily available.
Perhaps a itinerary of what a typical student looks like. (E.g. one for each faculty- one for Arts, one for Sciences, and for Commerce, etc)
better academic advising better website Use current students as recruiters. I wish UBC can have some more advisors who can give students detailed and overall
information about their academic life and social life in the university instead of some vague answers.
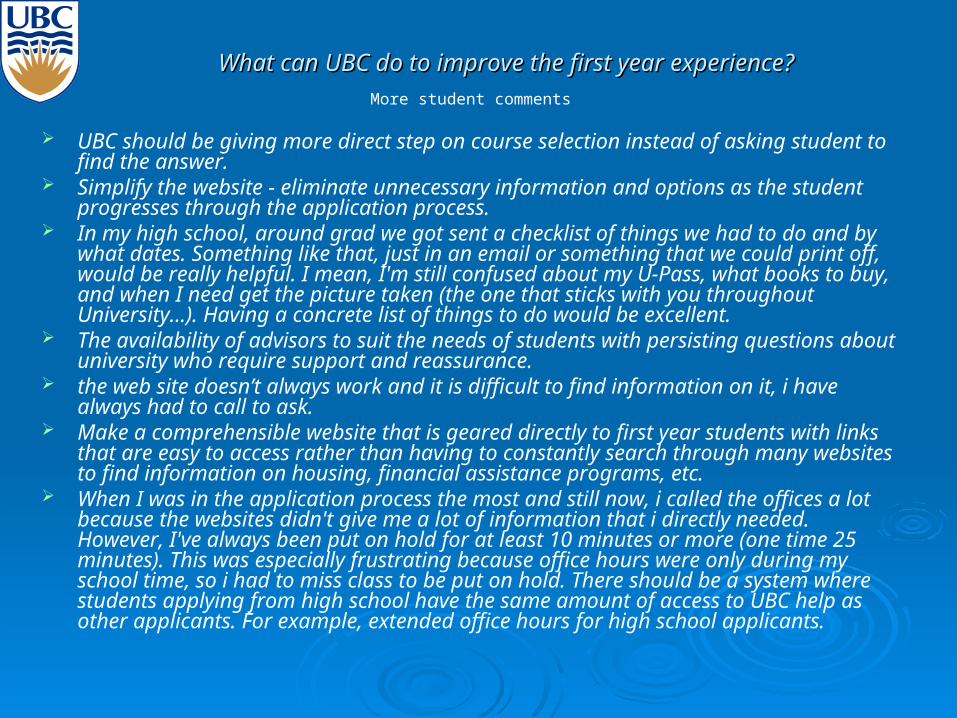
What can UBC do to improve the first year experience?What can UBC do to improve the first year experience? More student comments
UBC should be giving more direct step on course selection instead of asking student to find the answer.
Simplify the website - eliminate unnecessary information and options as the student progresses through the application process.
In my high school, around grad we got sent a checklist of things we had to do and by what dates. Something like that, just in an email or something that we could print off, would be really helpful. I mean, I'm still confused about my U-Pass, what books to buy, and when I need get the picture taken (the one that sticks with you throughout University...). Having a concrete list of things to do would be excellent.
The availability of advisors to suit the needs of students with persisting questions about university who require support and reassurance.
the web site doesn’t always work and it is difficult to find information on it, i have always had to call to ask.
Make a comprehensible website that is geared directly to first year students with links that are easy to access rather than having to constantly search through many websites to find information on housing, financial assistance programs, etc.
When I was in the application process the most and still now, i called the offices a lot because the websites didn't give me a lot of information that i directly needed. However, I've always been put on hold for at least 10 minutes or more (one time 25 minutes). This was especially frustrating because office hours were only during my school time, so i had to miss class to be put on hold. There should be a system where students applying from high school have the same amount of access to UBC help as other applicants. For example, extended office hours for high school applicants.
Next StepsNext Steps
Analyze student comments
Analyze data for transfer students
Analyze data for UBCO
Provide NUBC data to deans at faculty level
Drill down on some questions by gender, international
Use NUBC as the stimulus for improving processes
Focus NUBC discussion to align with institutional strategic goals (Trek 2010)
Design survey instrument for February follow up
Next year?