Embed Size (px)
DESCRIPTION
New NMR Approaches For Studying Battery Materials and Fast Ionic Conductors Julien Breger, Meng Jiang, Young Joo Lee, Wonsub Yoon, Namjum Kim, Francis Wang, John Palumbo and Clare P. Grey SUNY Stony Brook. Introduction. Part I: Batteries How do rechargeable batteries work? - PowerPoint PPT Presentation
Citation preview

New NMR Approaches For Studying Battery Materials and
Fast Ionic Conductors
Julien Breger, Meng Jiang, Young Joo Lee, Wonsub Yoon, Namjum Kim, Francis Wang,
John Palumbo and Clare P. Grey
SUNY Stony Brook
Introduction Part I: BatteriesHow do rechargeable batteries work? What are some of the technological requirements for 21st century devices?Where are some of the fundamental scientific breakthroughs required to
achieve these goals?What “New” approaches can be used to investigate Li-ion battery materials?Introduction to NMRApplication to spinels and layered materials
Part II: Ionic ConductorsMechanisms for ionic conduction in solids Devices that require rapid ionic conductivityStudying motion by NMRApplications to Aurivillius phases

Part I. Rechargeable Batteries: Applications and Demands
Portable (electronic) technologies have created an increasingly high demand for batteries that last considerably longer and deliver power faster are non-toxic and may be readily recycled are cheaper and much lighter..
Applications include: Electric and Hybrid Electric Vehicles (EVs and HEVs) Golf carts, wheel chairs and industrial vehicles Laptops Cell-phones digital cameras Camcorders, portable tools Artificial hearts (current battery lasts 4 hours!) memory backup, energy storage, generators, power for remote locations...

Different Applications Have Very Different Power Requirements
Portable Electronics (Cell phones, laptops, PDA, digital cameras)
Medical Devices
Portable tools
Back-up power (UPS)
EVs and HEVs
Electric bikes/scooters
“Industrial” EV, forklifts,
golf carts
Low Power
(high energy)
High Power
Power Storage for Renewable Energy
Batteries come in two types:
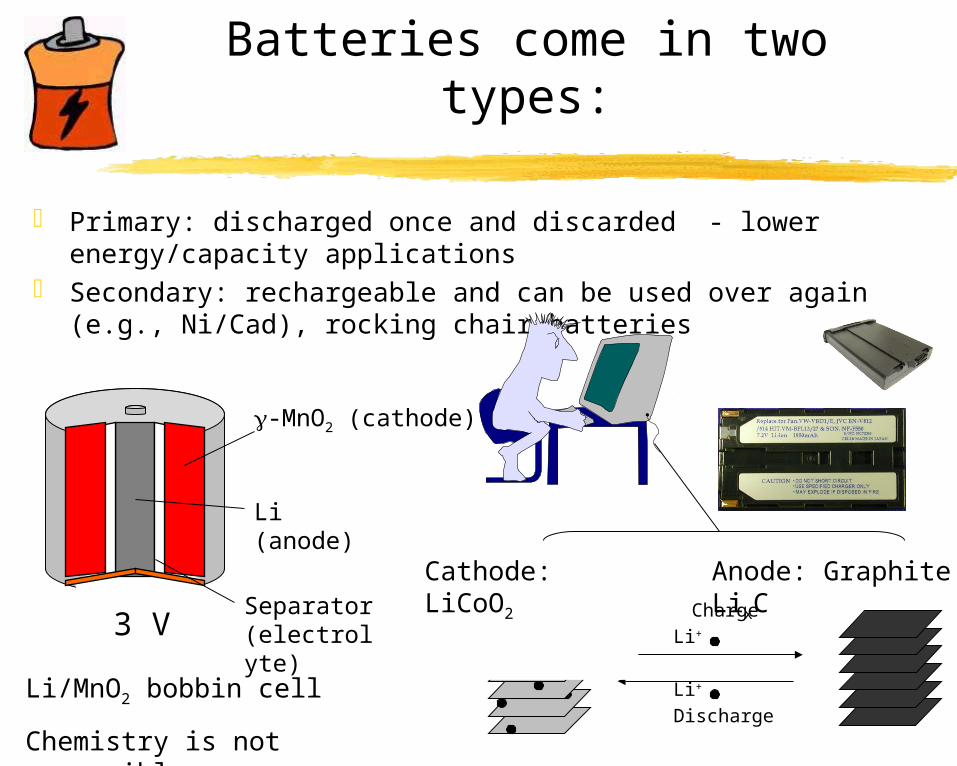
Primary: discharged once and discarded - lower energy/capacity applications
Secondary: rechargeable and can be used over again (e.g., Ni/Cad), rocking chair batteries
Li (anode)
-MnO2 (cathode)
Separator (electrolyte)
Li/MnO2 bobbin cell
Chemistry is not reversible
Charge
DischargeLi+
Li+
Anode: Graphite LixC
Cathode: LiCoO23 V

What is in a battery?
The Ni/Cd or NiCad Rechargeable Cell
Negative electrode Electrolyte Positive electrode (anode) (aqueous) (cathode)
Cd0 + 2OH- Ni3+OOH + H2O + e-
--> Cd2+(OH)2 + 2e- --> OH- + Ni2+(OH)2
OH- ions released at the
cathode travel to the anodewhere they react with the 1.35V Cell
Cd metal. I.e., electrolyte must allowionic but not electric conduction
Difference in the
couples (reduction potentials) of the two 1/2 cells determines the cell voltage
Cd NiOOH
OH-
e-

What is required to build a rechargeable battery?
Design a cell in which the chemistry is reversible over many cyclese.g., the lead acid (car) battery:
(Pb0 + Pb4+O2 + H2SO4 -> 2Pb2+SO4 + 2H2O) 2V
Requirements: large differences in the potentials of the half cells (i.e., Pb4+/Pb2+ and Pb2+/Pb0
=> High voltages Light materials => High energy densities An electrolyte that does not react with the anode or the cathode (under as
wide as possible temperature range) An electrolyte with high ionic conductivity Allows rapid discharge Conducting anodes and cathodes => (and charge)
(Allows current to be removed) I.e., high power densities Non-toxic materials Stable in charged and uncharged states H2 evolution; unstable in
discharged state

Much higher voltages may be achieved with Li-ion batteries
In theory, a more than 2V gain in voltage can be achieved with a Li+/Li anode
Li is also v. light ---> higher energy densities Some electrochemistry: E0 (V)
Li+(aq) + e- -> Li (s) -3.04PbSO4(s) + 2e- -> Pb(s) + SO4
2-(aq) -0.36
Cd(OH)2 + 2e- -> Cd(s) -0.824
[Cd2+(aq) + 2e- -> Cd(s) -0.402]2H+(aq) + 2e- -> H2
0
J. -M. TarasconNature ‘01
but….E.g., LiTiS2 ----> TiS2 + Li
Whittingham et al. ‘72

The big advance in this field came with the development of the SONY “Rocking-Chair”
battery in 1990
LiCoO2, J. Goodenough (1980) 2ndary host material, Murphy et al., and Scrosati et al. (‘78 and ‘80)
Lithium shuttles backwards between two layered compounds Very high voltage (4 V; cf Ni/Cd @ 1.35 V)
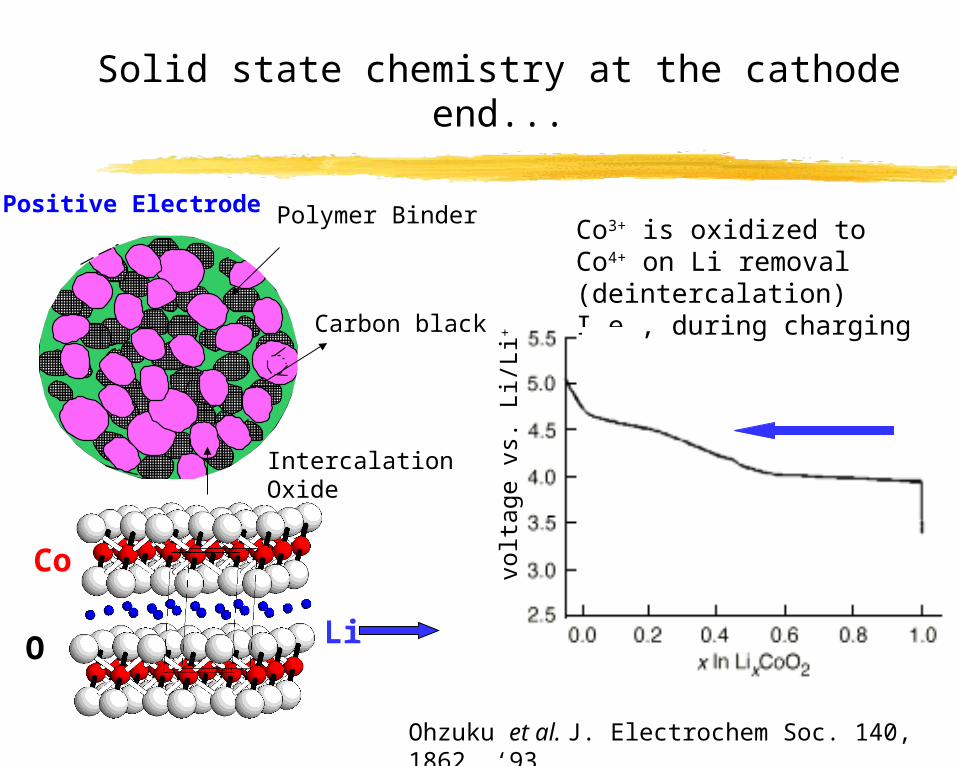
Solid state chemistry at the cathode end...
LiO
Co3+ is oxidized to Co4+ on Li removal (deintercalation) I.e., during charging
volt
age v
s. L
i/Li
+
Polymer Binder
Carbon black
Positive Electrode
Ohzuku et al. J. Electrochem Soc. 140, 1862, ‘93
Co
IntercalationOxide

And at the anode end..
Graphite anode forms an intercalation compound LixC
Charging
Energy density Cycle Life Voltage
SONY Cell 90 Wh/kg 500-1000 4V
Pb acid 30 250-500 2V
Ni/Cd 30-35 300-7001.3V
Ni metal hydride 50 300-6001.2V
Tarascon Nature, ‘01
Energy density (Whkg-1)

Co is toxic and expensive Not sufficient Co globally to meet perceived
demands for rechargeables Only 0.5 of the Li can be removed. I.e., low capacity V. slow to charge and discharge (low power) - not suitable for
E.V.s, H.E.V.s or other high power applications
Why is more research needed?Some disadvantages of the LiCoO2 cell
- Li
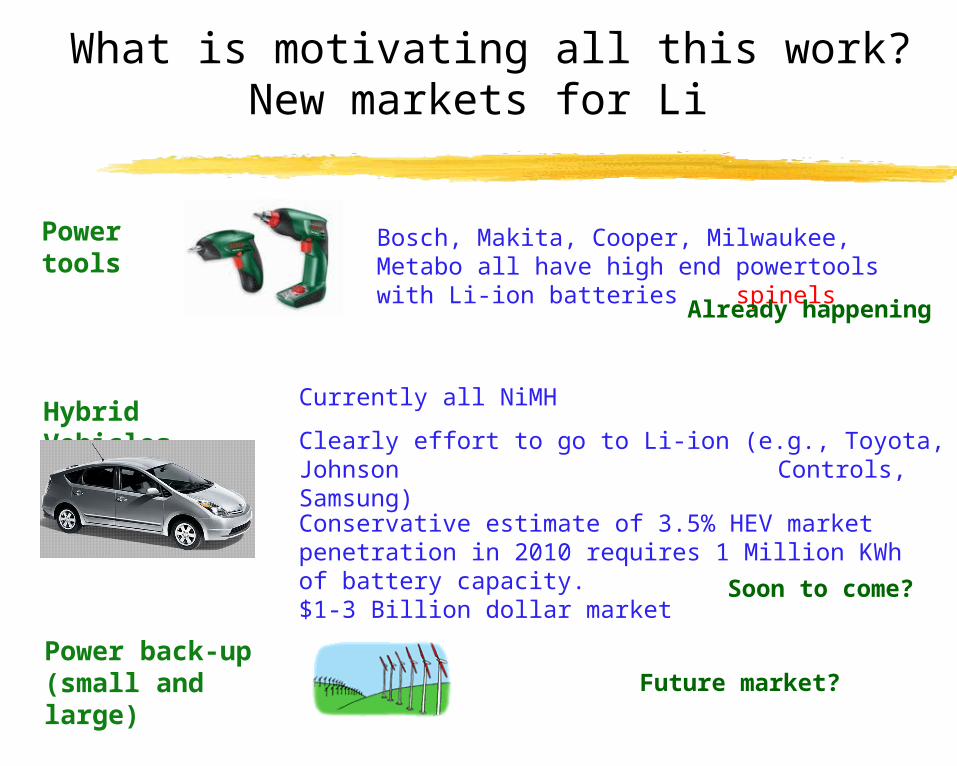
What is motivating all this work?New markets for Li
Power tools
Bosch, Makita, Cooper, Milwaukee, Metabo all have high end powertools with Li-ion batteries spinels
Hybrid VehiclesCurrently all NiMH
Clearly effort to go to Li-ion (e.g., Toyota, Johnson Controls, Samsung)
Conservative estimate of 3.5% HEV market penetration in 2010 requires 1 Million KWh of battery capacity.$1-3 Billion dollar market
Power back-up (small and large)
Already happening
Future market?
Soon to come?

A Large Growth is Predicted for the Li-ion Battery Technology - which will be driven by
improvements in performance
Ni-Cd Ni-MH Li-ion
$1 Billion $0.6 Billion $4 BillionMarket
inexpensive, high power, low energy
expensive, high power, average energy density, no
further improvement expected
Still expensive, lower power, high energy,
safety
World-wide
battery market From The Cobalt
report (2005)

Alternative LiB Materials Under Consideration: Voltage vs. CapacityCathodes
Anodes
LiCoO2
Li metal
“Issues and challenges facing rechargeable lithium batteries”, J.-M. Tarascon and M. Armand, Nature 414, 359-367 (2001)
C
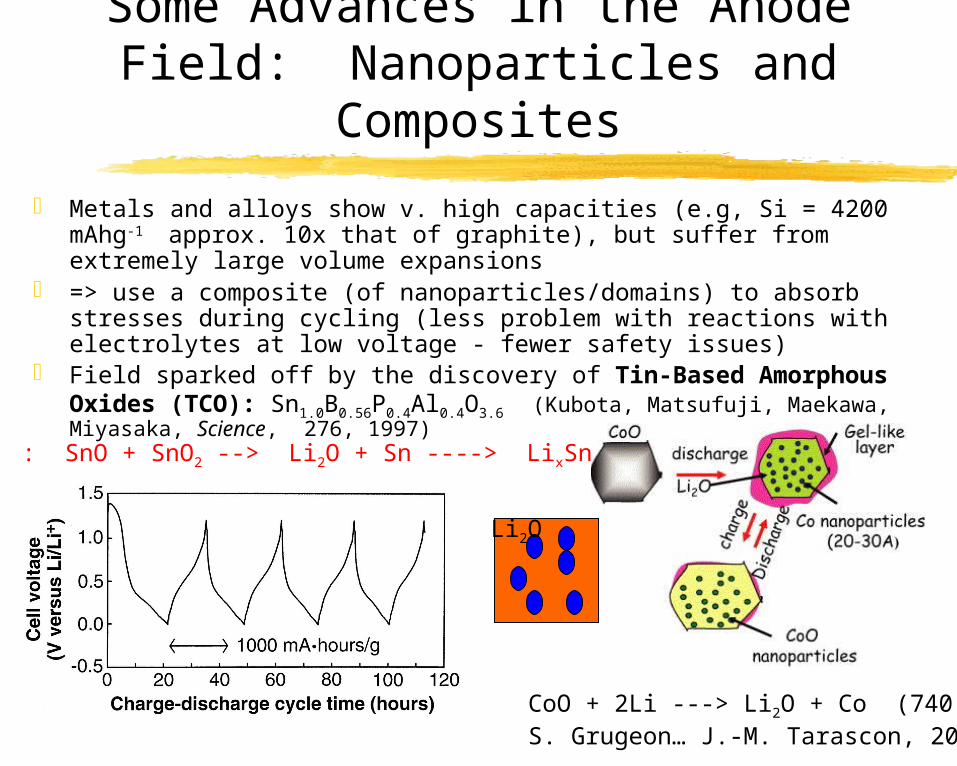
Some Advances in the Anode Field: Nanoparticles and Composites
Metals and alloys show v. high capacities (e.g, Si = 4200 mAhg-1
approx. 10x that of graphite), but suffer from extremely large volume expansions
=> use a composite (of nanoparticles/domains) to absorb stresses during cycling (less problem with reactions with electrolytes at low voltage - fewer safety issues)
Field sparked off by the discovery of Tin-Based Amorphous Oxides (TCO): Sn1.0B0.56P0.4Al0.4O3.6 (Kubota, Matsufuji, Maekawa, Miyasaka, Science, 276, 1997)
TCO : SnO + SnO2 --> Li2O + Sn ----> LixSn
CoO + 2Li ---> Li2O + Co (740 mAhg-1)S. Grugeon… J.-M. Tarascon, 2003
Li2O

Other approaches - extrusion/displacement reactions
InSb + Li ---> Li3Sb + In --> LixIn Cu2Sb + Li ---> Li3Sb + In M. M. Thackeray, J. Vaughey (1999)
J. Dahn
Cu2.33V4O11 + x Li ---->
LixCu2.33-y V4O11 + yCu
M. Morcrette, J. -M. Tarascon (2001)
Reversibility?
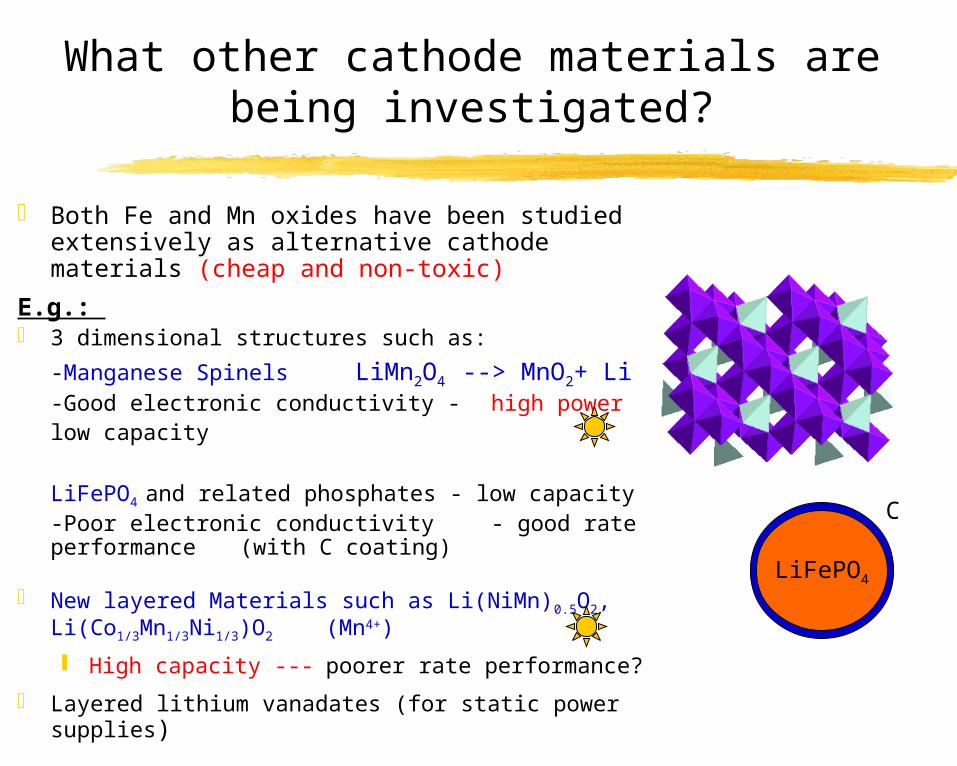
What other cathode materials are being investigated?
Both Fe and Mn oxides have been studied extensively as alternative cathode materials (cheap and non-toxic)
E.g.: 3 dimensional structures such as:
-Manganese Spinels LiMn2O4 --> MnO2+ Li-Good electronic conductivity - high power
low capacity
LiFePO4 and related phosphates - low capacity-Poor electronic conductivity - good rate performance (with C coating)
New layered Materials such as Li(NiMn)0.5O2, Li(Co1/3Mn1/3Ni1/3)O2 (Mn4+)
High capacity --- poorer rate performance?
Layered lithium vanadates (for static power supplies)
LiFePO4
C

Improving the materials performance requires a fundamental understanding of how materials function and what structural/electronic properties limit battery
performance
Structures of the materials as they are cycledWhere are the Li+ intercalated into the structure?
Electronic properties - How do they change as Li+ is removed?
Ionic conductivitiesHow do the Li+ ions move through the lattice?
Effect of structure and electronic properties on voltage (e.g., Co3+ -> Co4+; Fe2+->Fe3+)
Li+ in oct vs. tet. sites
A whole variety of experimental and theoretical methods have been used to study these systems including: Electrochemistry (voltages … infer structural changes) Diffraction methods (long range structure) XANES (local structure and oxidation state) Solid state NMR (local structure)

•In theory, we can use NMR to study these systems and determine: where the Li+ ions are, their local coordination environments, and the Mn electronic structure
...…..at each stage of charge/dischargeto obtain fundamental information about how the battery works
Mn Oxidn states?
Mn(IV) (III)
WHY NMR?Solid State NMR can be used to obtain:
Local atomic structure + Local electronic structure
LiMn2O4
…and how the battery fails
We perform lithium NMR, since the lithium is directly involved in the electrochemical process...
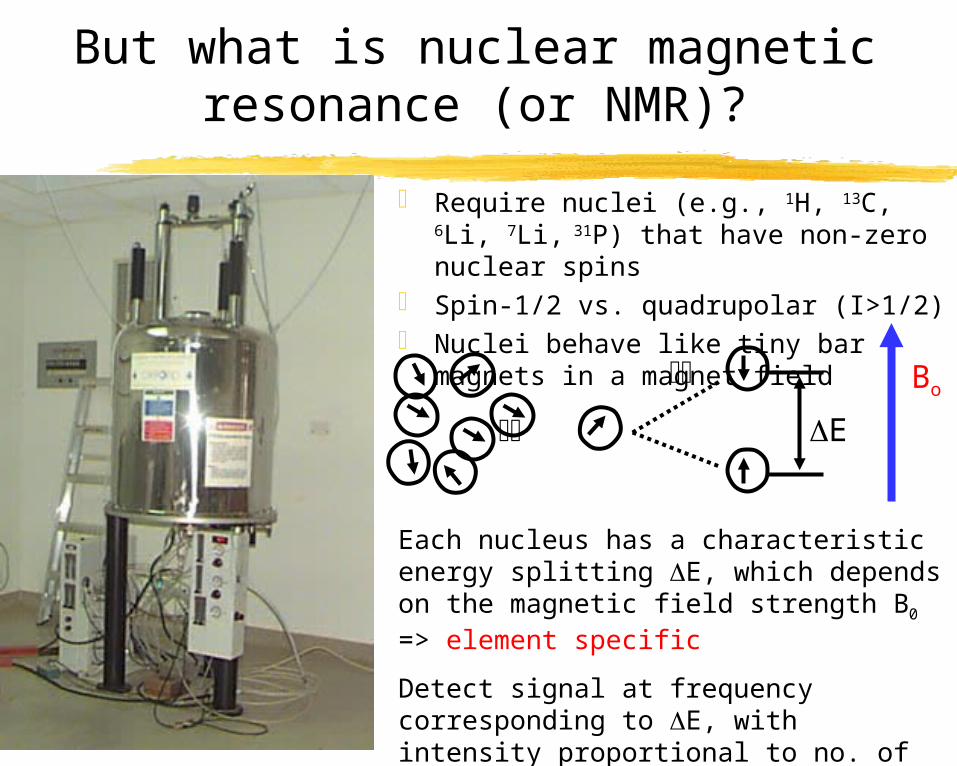
But what is nuclear magnetic resonance (or NMR)?
Require nuclei (e.g., 1H, 13C, 6Li, 7Li,
31P) that have non-zero nuclear spins Spin-1/2 vs. quadrupolar (I>1/2) Nuclei behave like tiny bar magnets
in a magnet fieldBo
E
Each nucleus has a characteristic energy splitting E, which depends on the magnetic field strength B0 => element specific
Detect signal at frequency corresponding to E, with intensity proportional to no. of spins => quantitative

B0
NMR of Solids
Solid State 1H NMR Liquid NMR, e.g., CH3CH2OH
1H
HD = -D(3cos - 1)IzSz
D = I Sh/2r3
IrIS
S
•NMR spectra of solids are broadened by the anisotropic interactions (interactions whose magnitude depends on the orientation wrt field), e.g.,:
•Chemical shift anisotropy •Dipolar coupling (Nuclei interact with each other, in the same way that two bar magnets interact)•Quadrupolar interaction•6Li (I = 1); 7Li (I = 3/2)
•Much of the chemical information can be lost
•Cf liquids NMR where the tumbling of the molecules removes these interactions
Basement @ Stony Brook

Most of the anisotropic interactions may be removed by Magic Angle Spinning: The bigger the interaction,
the faster we need to spin
Bo
rt
= 5
4o 4
4’
(3cos2 - 1) = 0 Slow MAS
Faster MAS
Freq
uen
cy,
Rotor period = 1/r
time
Axial CSAPowder pattern
r
r
r

NMR is also very sensitive to motion
E.g., Two Site Exchangekr(A-B)
A <----------------> B
Fast exchange
k >> f
Slow exchange
k << f
Intermediateregime
k same order as f
f (Hz)
NMR can be used to:• extract correlation times and activation energies for motion•determine which sublattices are mobile
Timescale
Hz kHz MHz
Lineshape changes
T1
T2
T1
Loss of satellite
transitions
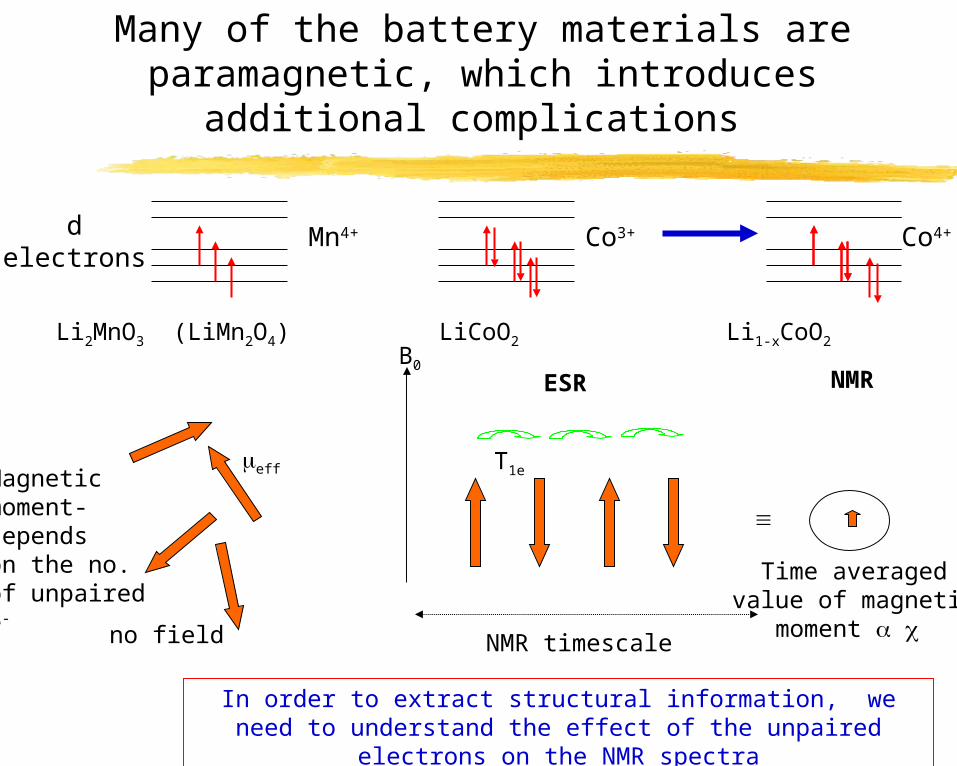
Many of the battery materials are paramagnetic, which introduces additional
complications
Mn4+ Co4+delectrons
Co3+
Li2MnO3 (LiMn2O4) LiCoO2 Li1-xCoO2B0
T1e
NMR timescale
eff
no field
Time averagedvalue of magnetic
moment
Magneticmoment-dependson the no.of unpaired e-
ESR NMR
In order to extract structural information, we need to understand the effect of the unpaired electrons on the NMR
spectra

The Fermi-contact shift results in large shifts - these shifts contain both structural and
electronic information
The Fermi Contact Shift: measure of the unpaired electron spin density transferred from the paramagnet to the NMR nucleus
Hc = IzAs<Sz> <Sz>
Mnt2g Li 5
20
1000 800 600 400 200 0
ppm
Fermi Contact Shift
Typical chemical shift for
diamagnetic compound
C.f. J-coupling and magnetic coupling
N
C
H
H
E.g., LiMn2O4 6Li MAS NMR

The dipolar interaction: through space coupling to nearby nuclear or e- spins
The sidebands are largely caused by the dipolar coupling, which contains geometric
information
B0
I rIS
<SZ>
Mn Li2MnO3
Li0.5Zn0.5[Mn1.5Li0.5]O4
Oh (4a)
Oh (2b)
Li
Mn
Zn
MnLi
•Very different sideband patterns are observed, depending on the arrangement of Mn around the central Li.
5000 4000 3000 2000 1000 0 -1000
** *********
** *
* * * * * * * * ********
755734
1461
684
2325
ppm

NMR spectra are also sensitive to electronic conductivity mechanism
Mn (16d Oh)
Li (8a Td)
52
01000 800 600 400 200 0
ppm
eg
t2g
• LiMn2O4 is a hopping semiconductor
• Li “sees” an average oxidation state=> only one local environment
C.f. metals - Knight shifts seen
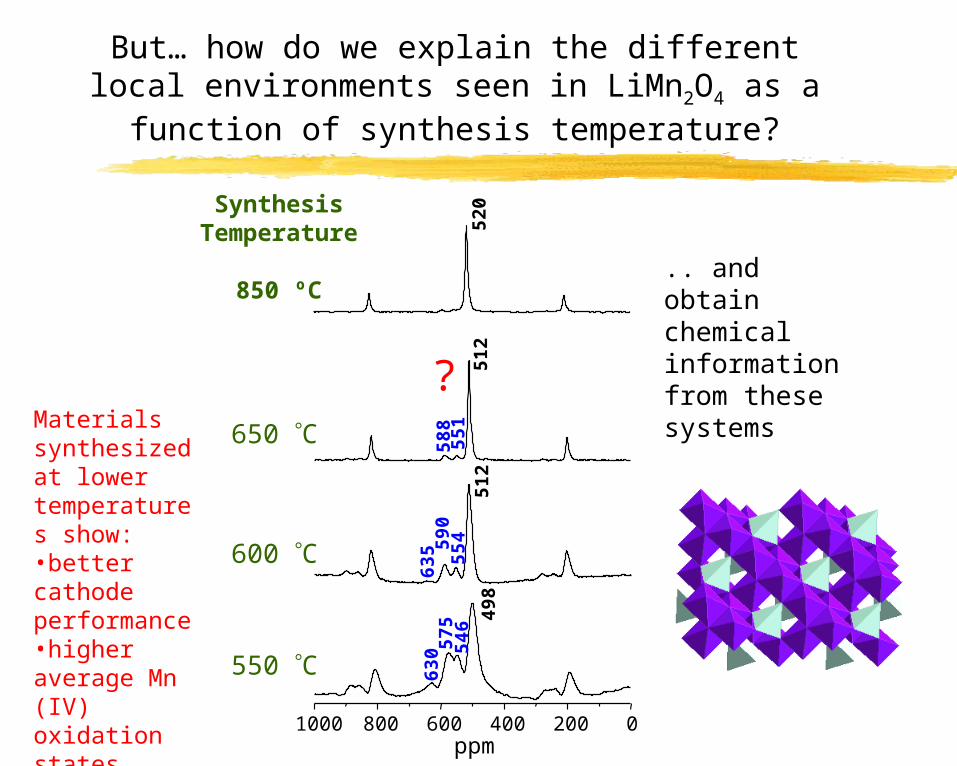
But… how do we explain the different local environments seen in LiMn2O4 as a function of
synthesis temperature?
SynthesisTemperature
850 ºC
520
?
1000 800 600 400 200 0ppm
630
575
546
512
498
635 59
055
458
855
151
2
650 C
600 C
550 C
.. and obtain chemical information from these systems
Materials synthesized at lower temperatures show:•better cathode performance•higher average Mn (IV) oxidation states

Understanding the 6Li NMR Shifts: Use of Model Mn III/IV
compounds
l
l
l
l
l
l
l
l
l
l
l
MnO
Mn3O4
Li2Mn4O9
Li4Mn5O12
Li2MnO3
Li7Mn5O12
Li5Mn4O9
LiMnO2
LiMn3O4
λ-MnO2
-Mn2O3
(Mn4+)
(Mn4+)
(Mn4+)
(Mn3+)
(Mn4+)
LiMn2O4(Mn3.5+)
l
III
InsertionExtraction

Oct Li Tet Li
Mn3+ rock salts
2500 2000 1500 1000 500 0 -500 ppm
Mn4+ spinel
Mn3.5+ spinelTet Li
Mn4+ layered materialsLi in Mn4+ layers Li in Li layers
Mn3+, Mn4+
K2NiF4 cmpds
4000 2000 0 -2000
1980
847
687
ppm
Li2Mn4O9
Litet[Li1/3Mn5/3]octO4
Lithium “Hyperfine Shift Scale”
•use shift as a “fingerprint” of different Li local environments

The Fermi contact shift depends on the coordination environment & nature of the orbital
overlap
Compound Site No. of Li-O-MBonds
BondAngle
Mn oxidnState
NMR Shift
Li4Mn5O12 8a16d
(16c)
1212(6)
(12)
121.096.2±0.
3(171.9)(89.6)
4 8471980
Li2Mn4O9 8a 12 120.7 4 687Li2MnO3 4h
2b2c
48
1248
180909018090
4 905/850
1817/1770922/875
Mn
Li
O
16c
Li4Mn5O12
Li2Mn2O9
Li2MnO3
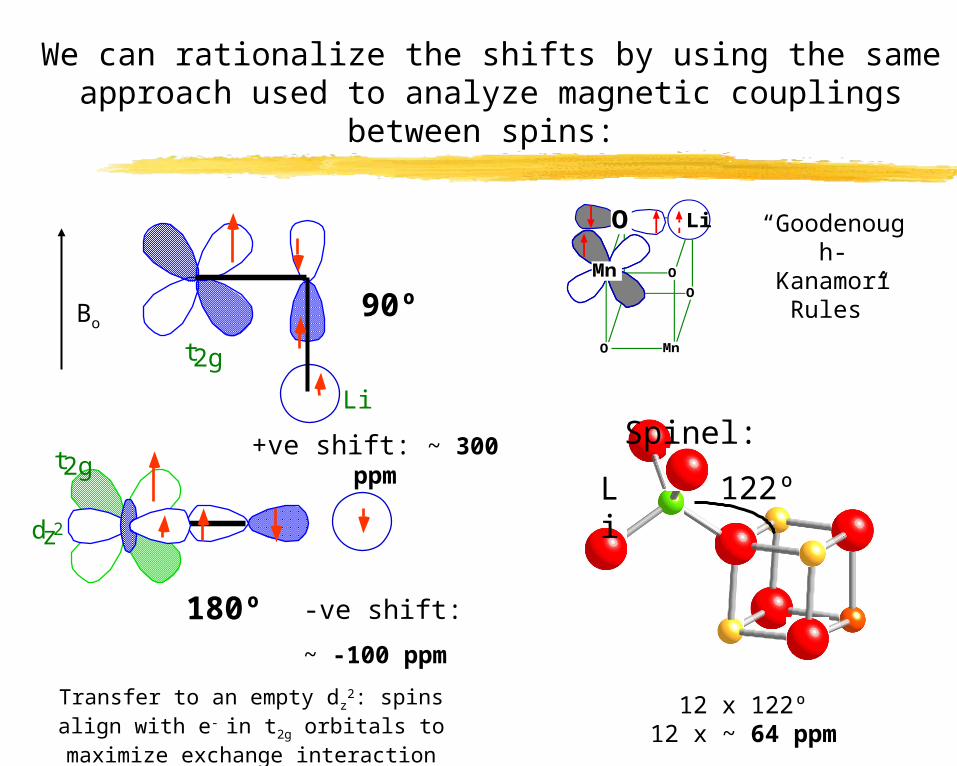
We can rationalize the shifts by using the same approach used to analyze magnetic couplings between
spins:
Transfer to an empty dz2: spins align
with e- in t2g orbitals to maximize exchange interaction
Bo
t2g
Li
t2g
dz2
+ve shift: ~ 300 ppm
-ve shift:
~ -100 ppm
90º
180º
Spinel:
122ºLi
12 x 122º12 x ~ 64 ppm
Mn
LiO
Mn
O
O
O
“Goodenough- Kanamori
Rules”

2 4 6 8 10
2
4
6
8
10
CoCr
90 deg interaction
Li180 deg interaction
LiCr1/8
Co7/8
O2
-275.0-200.0-125.0-50.00-20.00-10.00-5.00006.25025.00100.0175.0250.0325.0400.0475.0550.0
LiCoO2
90°interaction
Li
180°interaction
Cr O
Layered LiCr0.1Co1.9O2 +ve
0
-ve spin density= -ve shift
DFT calculations can be used to help understand the causes of these hyperfine shifts, by calculating
the unpaired e- spin density on Li
90°interaction
Plot spin densities of:Dany CarlierGerd CederMichel Menetrier
Co
Co
Co
Li
Li
Cr3+, d3; isoelectronic with Mn4+
I.e., unpaired e- densityt2g

EXAMPLE 1: The effect of cation doping on the Spinel Structure
E.g. I, Spinels: MnO2 (Mn4+) - + Li -> LiMn2O4 - + Li --> Li2Mn2O4 (Mn3+) One source of capacity fade comes from the Jahn Teller Distortion that occurs in the discharged state (for Mn oxidation states of 3.5 and less).
Expansion and contraction of the unit cell can cause grains to lose contact with each other and the carbon in cathode =>suggested to be responsible for severe drop in capacity
Potential solution: Cation doping is used to raise the average manganese oxidation state of Mn at the end of discharge to above 3.5
We can now use this hyperfine shift scale to investigate Li local structure in cathode
materials
Mn3+
Local Macroscopic

2500 2000 1500 1000 500 0 -500 -1000
* ***
67
4 63
95
83
55
0
23
00
ppm
Oct Li(spinel)
E.g., Li[Li0.05Mn1.95]O4 = Li[Li0.05Mn4+0.25Mn3.5
1.70]O4
5 “Mn3.5+” ions oxidized per Li+ dopant : Average oxidation state = Mn3.56+
Li - Excess Spinels
Mn3.5+
LiMn2O4
Tet Li
Increasing oxidation
state
1500 1000 500 0 -500 -1000
*** 67
4
63
95
83
55
0
y
x
Oct LiMn
(IV)
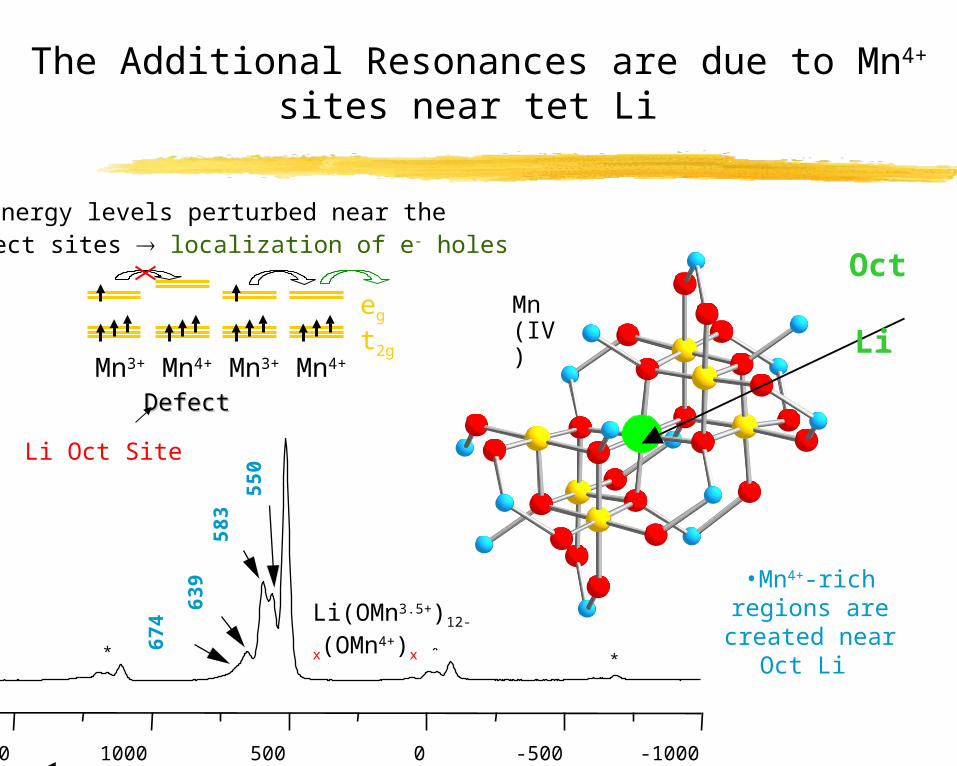
•Mn4+-rich regions are created near
Oct Li
Eg energy levels perturbed near the defect sites localization of e- holes
Mn4+ Mn4+Mn3+ Mn3+t2g
eg
DefectDefect
The Additional Resonances are due to Mn4+ sites near tet Li
Li Oct Site
Li(OMn3.5+)12-x(OMn4+)x

Lithium-excess materials are also formed at low temperatures, even for “stoichiometric”
compounds
520
850 C
1000 800 600 400 200 0ppm
630 57
554
651
249
8
635 59
055
458
855
1 650 C
600 C
550 C
7Li MAS NMR45 kHz MAS
4000 3000 2000 1000 0 PPM
2300
* **
**
513Oct. Li
Tet. Li
x406Li MAS NMR9 kHz MAS
LiMn2O4
Li1+xMn2-xO4
+ Mn2O3
Mn oxidnstate
increases

2500 2000 1500 1000 500 0 -500 -1000
**
**
**
* ***
* *
* *
* *
674639583
550504
2300
2300
718
649573
502
709
633562
499
746
501
ppm
LiCr0.1Mn1.9O4
LiNi0.1Mn1.9O4
LiZn0.1Mn1.9O4
Li1.05Mn1.95O4
Oh
Oh
283C
200015001000 500 0 -500-1000
* *
***
* *
*
* *
397
407
1390
1320
ppm
Oh
Td
Td•Helps explain why Zn2+ systems don’t work so well - Zn2+ in tet site
blocks Li+ diffusion (J. -S. Kim.. M. M. Thackeray, JES, ‘03)•Concentration of “extra” peaks related to oxidation state of dopant metal
Li NMR can be used to determine whether Li+ substitutes on the oct. or tet. site of the spinel
cathode materials LiM’xMn2-xO4

Following the Electrochemical Process
Swagelock-type Cell Li1.05Mn1.95O4 at 4V
End Bolt
Copper Plunger
Swagelock
Li AnodeFilter PaperPolypropyleneSeparatorLiMn2O4 Cathode
Battery Cycler
End Bolt
0 20 40 60 80 100 120 1403.2
3.4
3.6
3.8
4.0
4.2
4.4
4.6
Disharging
Charging
Potential (V)
Capacity (mAh/g)Capacity (mAhg-1)

Li1.05Mn1.95O4:
1st Charge
2500 2000 1500 1000 500 0 -500 -1000
635
556
627
797710
803708
2300
99 %
75 %
50 %
25 %
10 %
2100
0 %637
603
557525
616
618
592
534
485
488
ppm
Increasing Mn oxidation state
Li+ ions are removed from local environments containing progressively more Mn4+ ions as the charging proceeds
Li remains in the oct. site throughout
Li+- ion mobility increases - particularly in 1st 1/2 of charge
Oct Li

ppm
Loss of structure => Mobility
Fast exchangek >> f
Slow exchangek << f
Intermediateregime
k same order as f
f (Hz)
1000 500 0 -500
485
557
Li+ (+ e- ?) jump rates > 2 kHz
25%
10%

Lix [Li0.05Mn1.95]OhO4
Local Structure in Doped Spinels
Random cation (Li+) doping on the octahedral site will:
1. Create Mn4+ ions nearby the dopant cations
2. Prevent Li+ removal from sites near octahedral Li+
3. Create a 3D framework with a distribution of charges from 1 to 4+
All these factors help prevent the formation of a series of phases with long range lithium-ion ordering during cycling
=> Helps improve the capacity retention?
Oct. LiTet. LiPanasonic

Example II: Ni2+/Mn4+ Layered Cathodes, Li[NixMn(2-x)/3Li(1-2x)/3]O2: A Combined XAS, Diffraction,
DFT and NMR Study
These compounds may be viewed as solid solutions between Li2Mn4+O3 (Li(Li0.33Mn0.67)O2) and Li(NiMn4+)0.5O2
Li(Ni1/2Mn1/2)O2
DATA From: Z. Lu, D. D. MacNeil, J. R. Dahn, ESSL4, (2001) A191-A194.
V
LiNiO2
LiMnO2
Li[Li1/3Mn2/3]O2
x = 1/2 1/3 1/10 0
LiCoO2
Capacity: mAhg-1
Li(NiMn)0.5O2 (T. Ohzuku, J. Dahn)
Isostructural with LiCoO2
Oxidation/reduction process involves multiple electrons (Ni2+ -> Ni4+ ???)
Ni, Mn
Li

Approx. 200 mAhg-1 reversible capacity can be obtained
Similar capacities obtained by other groups for:
x = 1/2 (T. Ohzuka) Li excess materials (C. Johnson and M. M. Thackeray; Z. Lu and J. Dahn)
Is the redox active metal Ni2+? How do these systems function?
How does local structure effect electrochemical performance?
20 cycles C/20LiMn0.5Ni0.5O2
3000 2000 1000 0 -1000 PPM
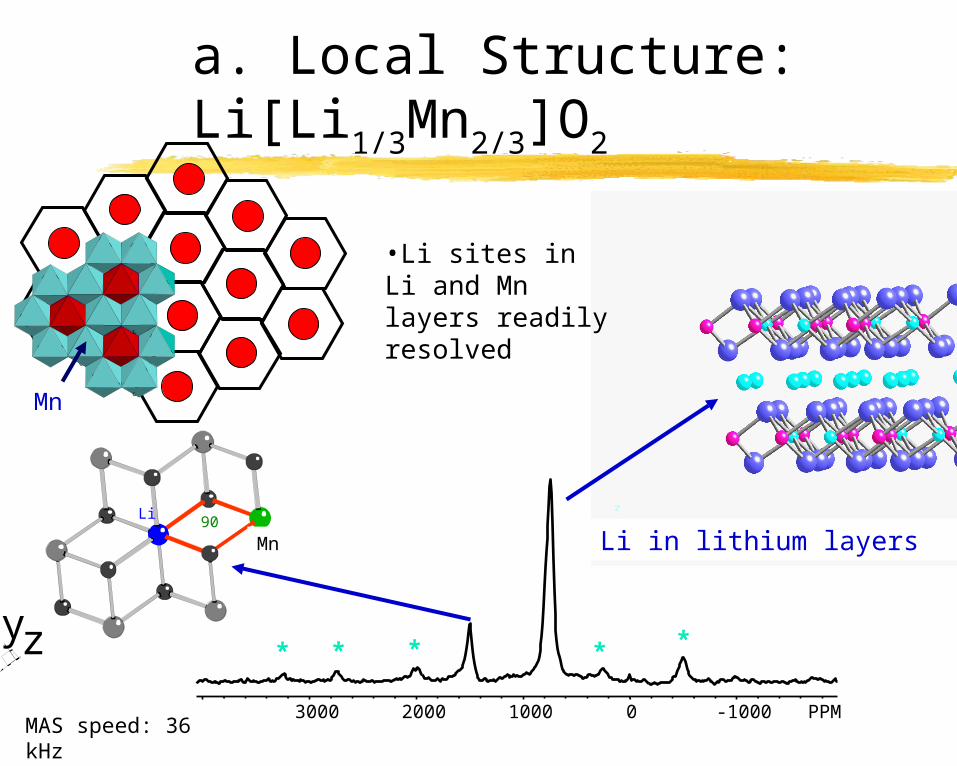
Li in lithium layers
MAS speed: 36 kHz
•Li sites in Li and Mn layers readily resolved
*** * *
a. Local Structure:Li[Li1/3Mn2/3]O2
yz
Li 90Mn/CrMn
Mn
c
c
c
4000 2000 0 -2000
ppm
yz
Li 90Mn/CrMn/Ni
Li in the Ni/Mnlayers near
Mn4+
Li2MnO3
shifts
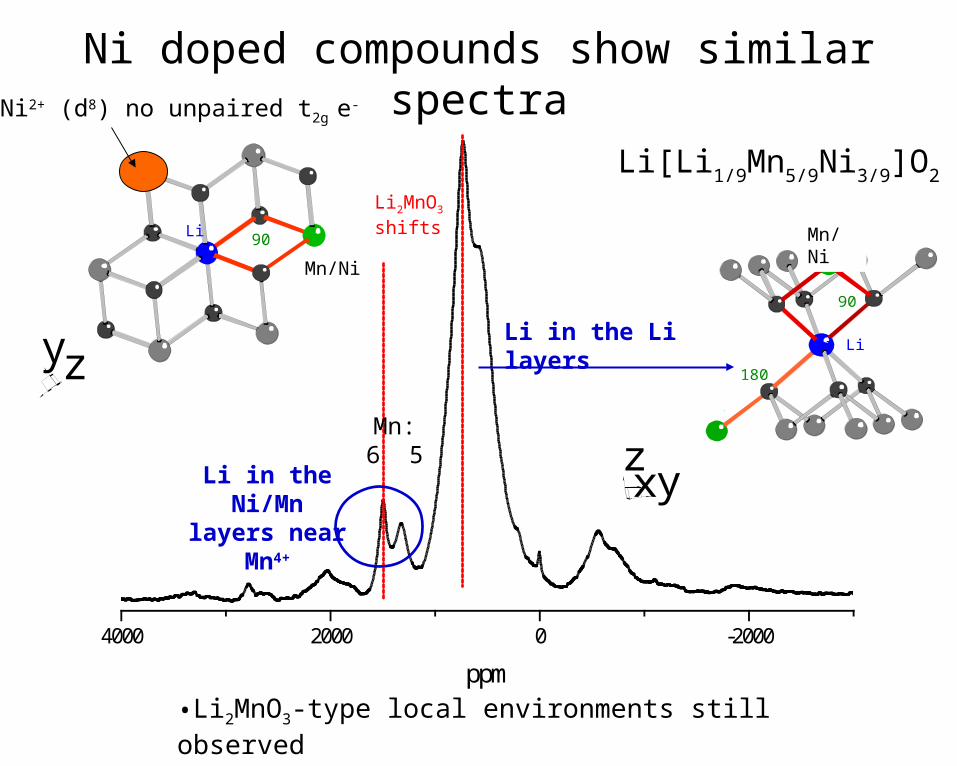
Ni doped compounds show similar spectra
•Li2MnO3-type local environments still observed
Mn:6 5
yxz
90
LiLi
Mn/Cr
Mn/Cr
180
Mn/Ni
Li in the Li layers
Li[Li1/9Mn5/9Ni3/9]O2
Ni2+ (d8) no unpaired t2g e-

4000 2000 0 -2000
ppm
“Li[Ni0.5Mn0.5]O2”
•6Li NMR shows that there are still Li ions in the Ni/Mn layers, near Mn4+ even tho’ these are not predicted based on the stoichiometry
yz
Li 90Mn/CrMn/Ni
Li in the Ni/Mnlayers near
Mn4+
Li2MnO3
shifts
•This is consistent with Ni2+ substitution in the Li layers (c.f. Dahn 2002)
ppm
Li+[Ni2+0.5Mn4+
0.5]O2 -->
Li1-xNix[Mn0.5Ni0.5-xLix]O2
Ni/Mn
Li

Neutron Diffraction (ISIS, GEM) are consistent with Ni2+/Li+ exchange model
10-2
110
101
006104
009
10-8
Bank 4
Rwp = 6.32%
7Li(Ni0.5Mn0.5)O2 Extra peaks:
superstructure peaks as seen for honey-comb ordering of Li2MnO3 (J. Solid-State Chem. August 2005)
Exchange of Ni and Li ions between the TM and Li layers: 8 ± 2 % of site exchange: consistent with NMR
Mn
Li
Li/Mn layer in Li2MnO3

4000 3000 2000 1000 0 -1000 -2000 -3000
567
776
1365
1560
x = 1/10
x = 1/3
x = 1/2
ppm
Li in the Ni/Mnlayers near Mn4+
Li2MnO3
shifts
Local structure as a function of Ni content?
Li in the Li layers
•Li in Ni/Mn layers is predominantly near Mn4+ and not Ni2+
for all compositions
•What does this tell us about the cation ordering in the Ni/Mn layers?
Li[Ni1/10Mn19/30Li8/30]O2
LiNi0.5Mn0.5O2
Li[Ni1/3Mn5/9Li1/9]O2
yz
Li 90Mn/CrMn/Ni
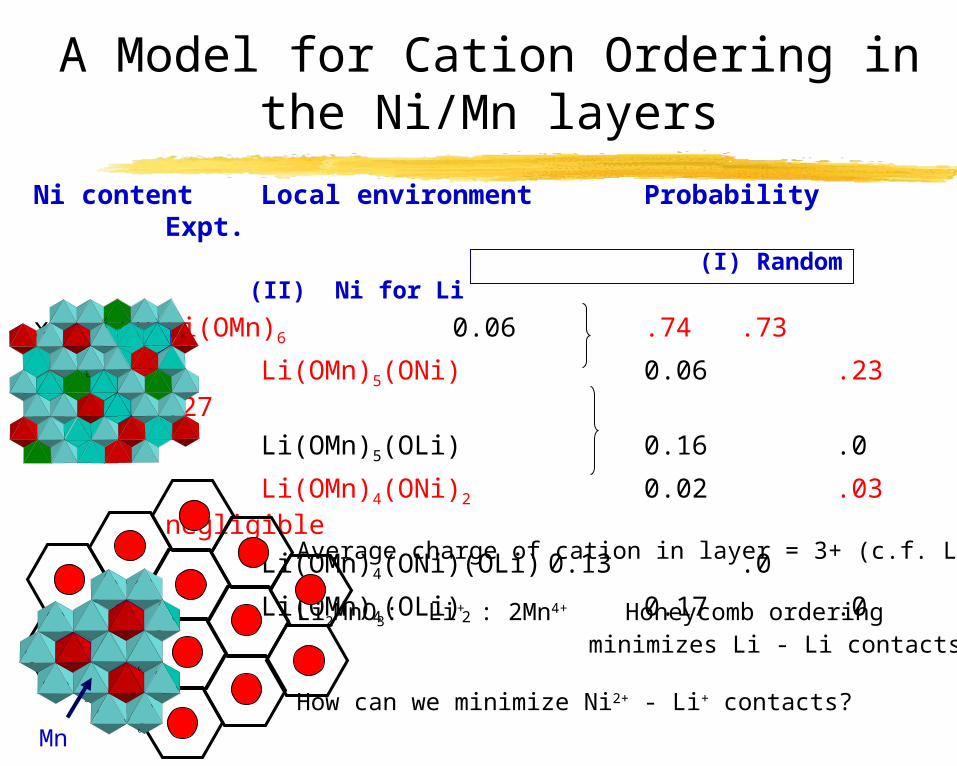
A Model for Cation Ordering in the Ni/Mn layers
Ni content Local environment ProbabilityExpt.
(I) Random (II) Ni for Li
x = 1/10 Li(OMn)6 0.06 .74 .73
Li(OMn)5(ONi) 0.06 .23 .27
Li(OMn)5(OLi) 0.16 .0
Li(OMn)4(ONi)2 0.02 .03negligible
Li(OMn)4(ONi)(OLi) 0.13 .0
Li(OMn)4(OLi)2 0.17 .0
Mn
a
c
c
c
c
Average charge of cation in layer = 3+ (c.f. LiCoO2)
Li2MnO3: Li+ : 2Mn4+ Honeycomb ordering minimizes Li - Li contacts
How can we minimize Ni2+ - Li+ contacts?

A Model for Cation Ordering in the Ni/Mn layers
Ni content Local environment ProbabilityExpt.
(I) Random (II) Ni for Li
x = 1/10 Li(OMn)6 0.06 .74 .73
Li(OMn)5(ONi) 0.06 .23 .27
Li(OMn)5(OLi) 0.16 .0
Li(OMn)4(ONi)2 0.02 .03negligible
Li(OMn)4(ONi)(OLi) 0.13 .0
Li(OMn)4(OLi)2 0.17 .0
Mn
Replace on 1 Mn4+
and 2 Li+ sites by 3 Ni2+
Ni
a
c
c
c
c
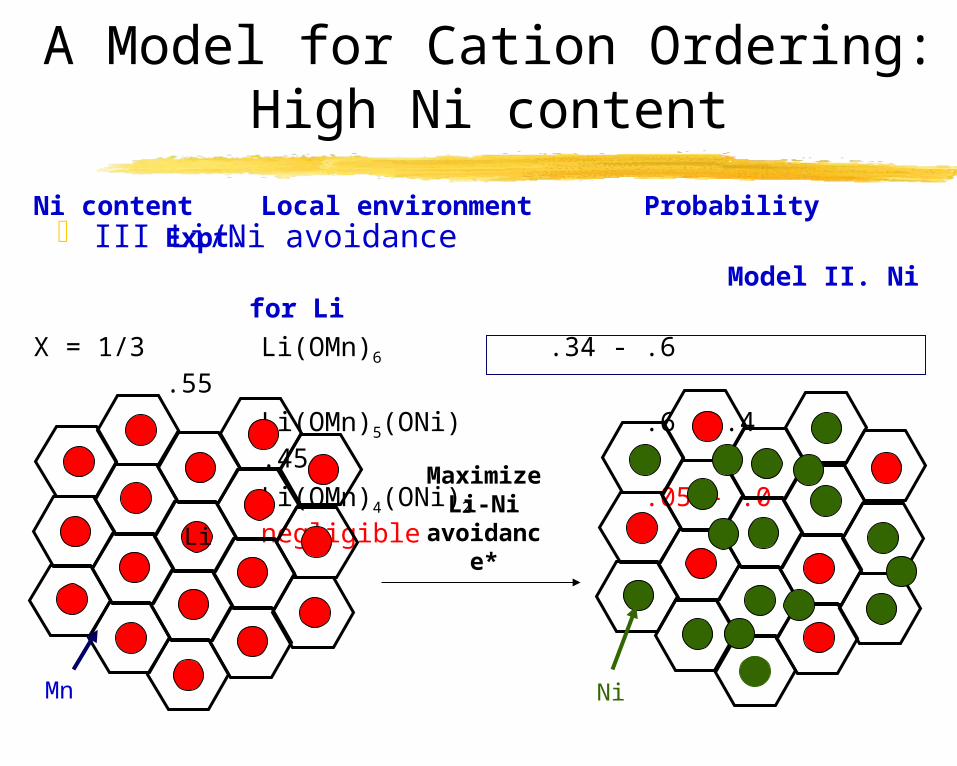
A Model for Cation Ordering:High Ni content
Ni content Local environment ProbabilityExpt.
Model II. Ni for Li
X = 1/3 Li(OMn)6 .34 - .6 .55
Li(OMn)5(ONi) .6 - .4 .45
Li(OMn)4(ONi)2 .05 - .0negligible
Mn Ni
Li
III Li/Ni avoidance
Maximize
Li-Ni avoidanc
e*

A Model for Cation Ordering:High Ni content: Ni = 1/2; 9 % Li in Ni/Mn
Layer
Ni content Local environment Probability Expt.Model II. Ni
for LiX = 1/2 Li(OMn)6 .18
.35Li(OMn)5(ONi) .36 .65
Li(OMn)4(ONi)2 .30 negligible
Li(OMn)3(ONi)3 0.13 0
III Li/Ni avoidance
Ni Ni
Li
C.f. Lu, Chen and Dahn, Chem Mat ‘03
?Ni/Mnordering
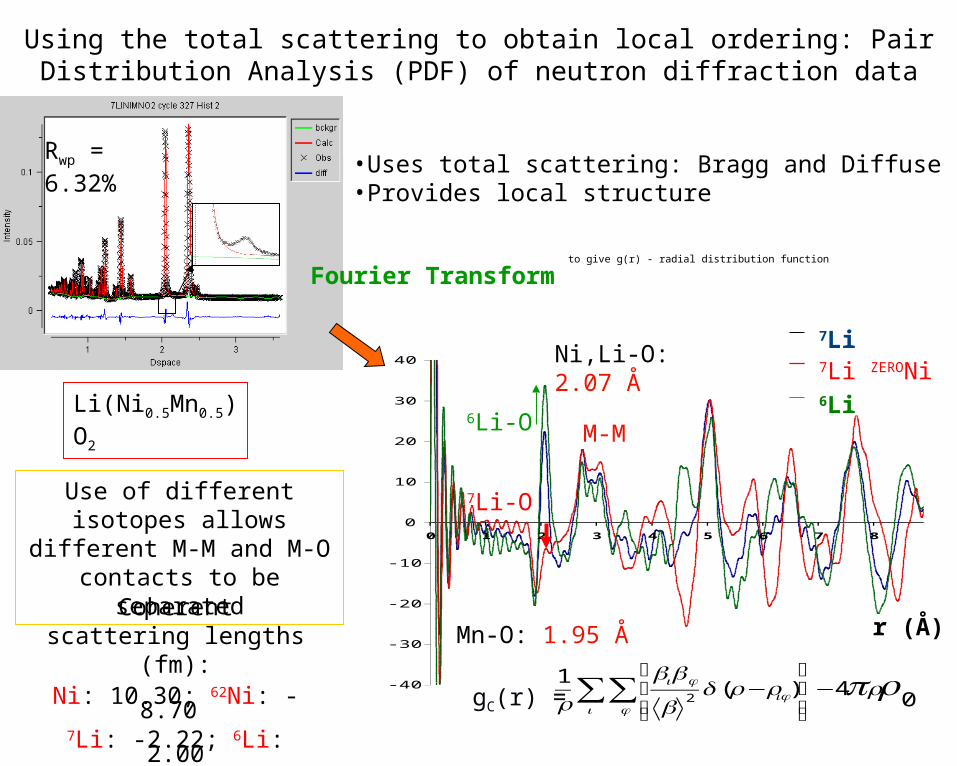
Using the total scattering to obtain local ordering: Pair Distribution Analysis (PDF) of neutron diffraction data
•Uses total scattering: Bragg and Diffuse•Provides local structure
Rwp = 6.32%
Li(Ni0.5Mn0.5)O2
to give g(r) - radial distribution function
-40
-30
-20
-10
0
10
20
30
40
0 1 2 3 4 5 6 7 8 9 10 11 12 13 14 15
7Li(NiMn)0.5O2
7LizeroNi0.5Mn0.5O2
6Li(NiMn)0.5O2
7Li7Li ZERONi6Li
Coherent scattering lengths (fm):
Ni: 10.30; 62Ni: -8.70 7Li: -2.22; 6Li: 2.00
Mn: -3.75
r (Å)
Ni,Li-O: 2.07 Å
Mn-O: 1.95 Å
M-M
7Li-O
6Li-O
04)(
12
δ rrrb
bbr i j
ijji −
⎥⎥⎦
⎤
⎢⎢⎣
⎡−∑∑gC(r) =
Use of different isotopes allows different M-M and M-O contacts to be separated
Fourier Transform

REVERSE MONTE CARLO SIMULATIONS:
•Generate giant cell•Randomly swap atoms in ab planes •If swap improves fit of PDF, swap is allowed
RMC
Random
After RMC
R-3m space group 12*12*2 cluster
Before RMC After RMC
%Ni-Ni pairs 16.1% (418 pairs) 11.8% (306 pairs)
%Ni-Mn pairs 42.4% (1099 pairs) 50.2% (1301 pairs)
%Mn-Mn pairs 24.2% (626 pairs) 20.7% (536 pairs)
%Li-Mn pairs 9.1% (235 pairs) 8.8% (227 pairs)
%Li-Ni pairs 7.8% (201 pairs) 8.1% (209 pairs)
%Li-Li pairs 0.50% (13 pairs) 0.5% (13 pairs)
Total 100% (2592 pairs) 100% (2592 pairs)
CorrelationcNiMn*
-0.04 -0.23 (± 0.04)
Correlation cLiNi* -0.09 -0.16 (± 0.1)
CorrelationcLiMn*
-0.06 -0.06 (± 0.1)

Ni/Mn Ordering ?
Li
Mn
Ni
Mn ring
Ni ring
Flower: A. van der Ven, G. Ceder, Electrochem.
Commun. 2004
Ni
Honey combNMR; Yoon et al.TEM; Meng et alESSL 2003/2004
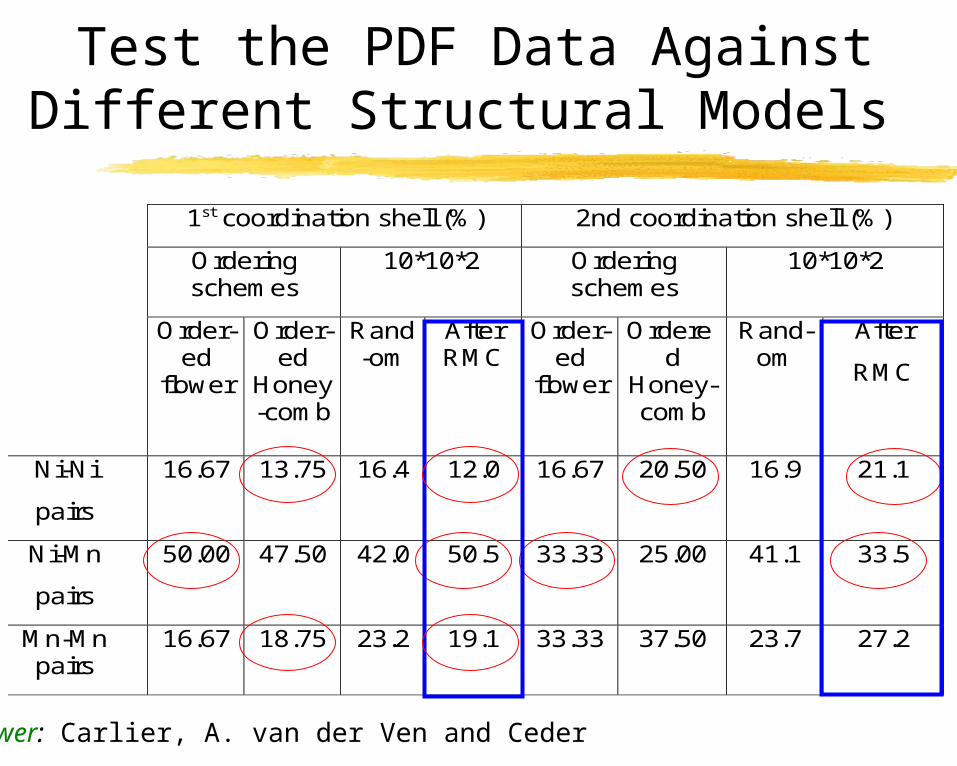
1st coordination shell (%) 2nd coordination shell (%)
Orderingschemes
10*10*2 Orderingschemes
10*10*2
Order-ed
flower
Order-ed
Honey-comb
Rand-om
AfterRMC
Order-ed
flower
Ordered
Honey-comb
Rand-om
After
RMC
Ni-Ni
pairs
16.67 13.75 16.4 12.0 16.67 20.50 16.9 21.1
Ni-Mn
pairs
50.00 47.50 42.0 50.5 33.33 25.00 41.1 33.5
Mn-Mnpairs
16.67 18.75 23.2 19.1 33.33 37.50 23.7 27.2
Test the PDF Data Against Different Structural Models
Flower: Carlier, A. van der Ven and Ceder

Can we combine all the experimental data to provide more constraints all the
on ordering?
EXAFS - Mn near 1-2 Li and 4-5 Mn/Ni (Yoon et al.)PDF - Ni near < 3 Ni; Ni near 3 Mn
Simple honey comb impliesA. Too few Li(OMn6) sitesB. Too many Li(OMn4)(ONi)2 sites
NMR
III Li/Ni avoidanceIV Constrain Ni-Ni contacts
Ni Ni
Li
Disordered flower motifs emerge..
•Large coulombic energy associated with Li+ /Mn4+ “honey-comb ordering” drives Li
substitution in Ni/Mn layer and Ni substitution in Li layer
•difficult to make a pure layered material directly
How does Li ordering and Li/Ni exchange affect electrochemical performance?
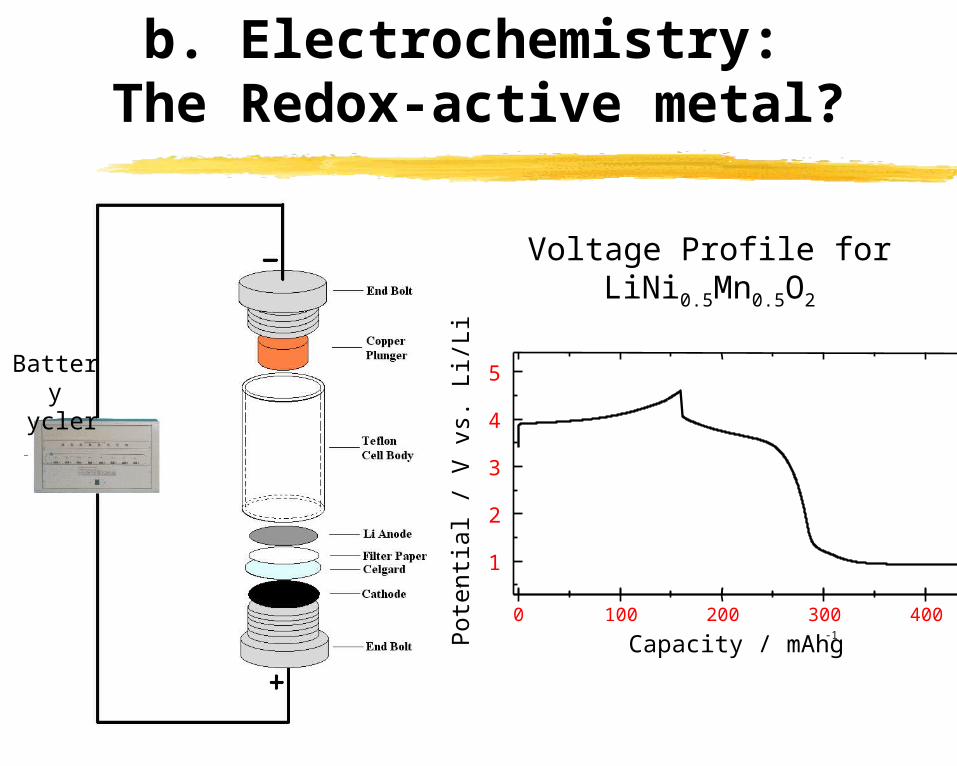
1
2
3
4
5
Pot
entia
l / V
vs.
Li/L
i+
0 100 200 300 400
Capacity / mAhg-1
Voltage Profile for LiNi0.5Mn0.5O2
Battery cycler
b. Electrochemistry: The Redox-active metal?
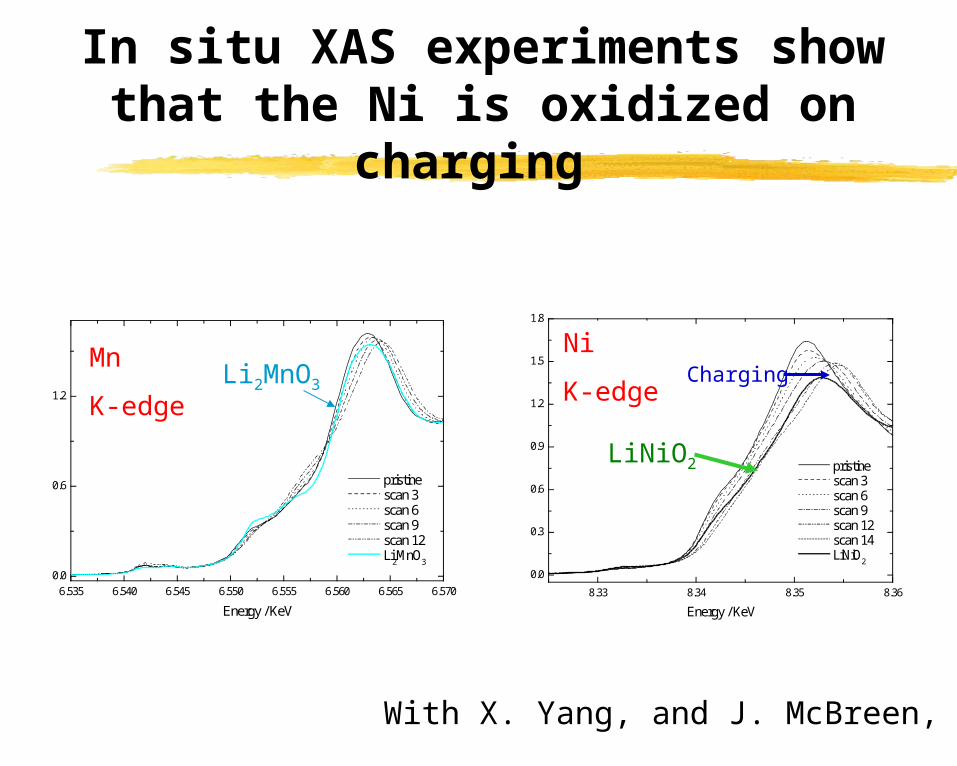
8.33 8.34 8.35 8.36
0.0
0.3
0.6
0.9
1.2
1.5
1.8
(b)
Normalized Intensity (a. u.)
Energy / KeV
pristine scan 3 scan 6 scan 9 scan 12 scan 14 LiNiO
2
In situ XAS experiments show that the Ni is oxidized on charging
Ni
K-edge
LiNiO2
Charging
6.535 6.540 6.545 6.550 6.555 6.560 6.565 6.570
0.0
0.6
1.2
(a)
Normalized Intensity (a. u.)
Energy / KeV
pristine scan 3 scan 6 scan 9 scan 12 Li
2MnO
3
Mn
K-edgeLi2MnO3
With X. Yang, and J. McBreen, BNL

yxz
90
LiLi
Mn/Cr
Mn/Cr
180
4000 2000 0 -2000 -4000
594
13701486
711
X = 0.6
X = 0.3
X = 0.1
X = 0.0
ppm
Mn/Ni
layer
•Li NMR results show that Li is removed from the Li layers and the Ni/Mn layers
Li Layer
Li0.4Ni05Mn05O2
Mn/Ni/Li
Mn/Ni
LiNi0.5Mn0.5O2
Li0.9Ni05Mn05O2
Li0.7Ni05Mn05O2
Which Li sites are involved in the electrochemical processes?
CHARGE
Sites in the transition metal layers are always thought to remain stuck in the layers
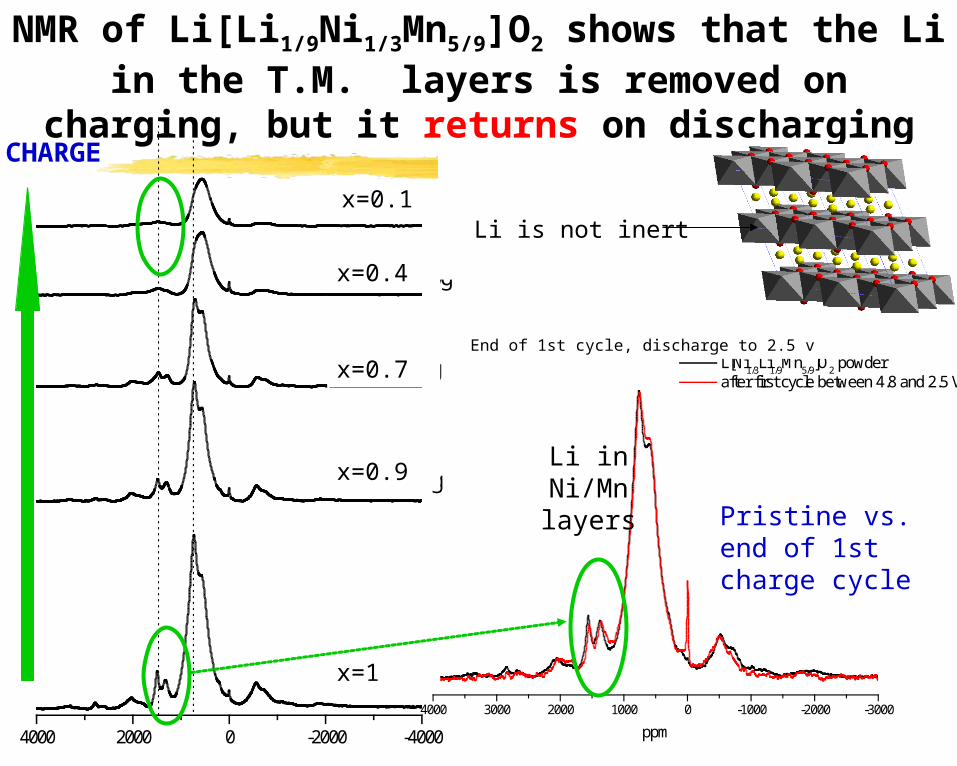
4000 3000 2000 1000 0 -1000 -2000 -3000
L[Ni1/3
Li1/9
Mn5/9
]O2 powder
after first cycle between 4.8 and 2.5 V
ppm
End of 1st cycle, discharge to 2.5 v
Li in Ni/Mn layers
4000 2000 0 -2000 -4000
590
13241498
733
231 mAh/g
154 mAh/g
77 mAh/g
24 mAh/g
pristine
ppm
Pristine vs. end of 1st charge cycle
x=1
x=0.9
x=0.7
x=0.4
x=0.1
CHARGE
NMR of Li[Li1/9Ni1/3Mn5/9]O2 shows that the Li in the T.M. layers is removed on charging, but it returns
on discharging
Li is not inert
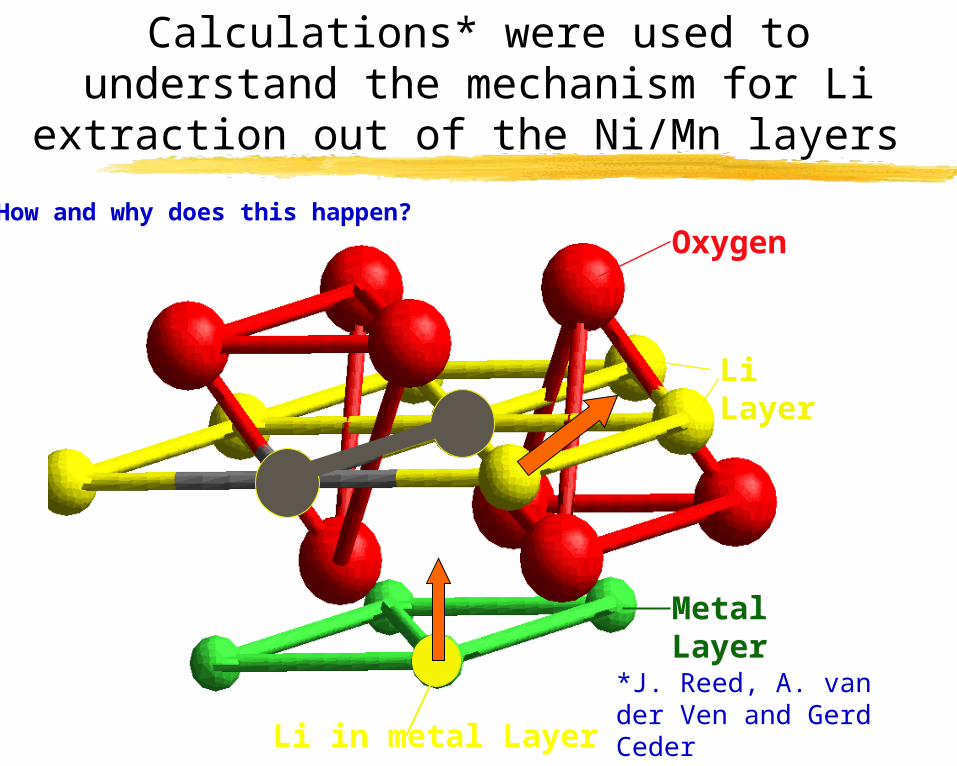
Oxygen
Li Layer
Metal Layer
Li in metal Layer
Calculations* were used to understand the mechanism for Li extraction out of the
Ni/Mn layers
How and why does this happen?
*J. Reed, A. van der Ven and Gerd Ceder

Spontaneous migration into Li layer
Oxygen
Li Layer
Metal Layer
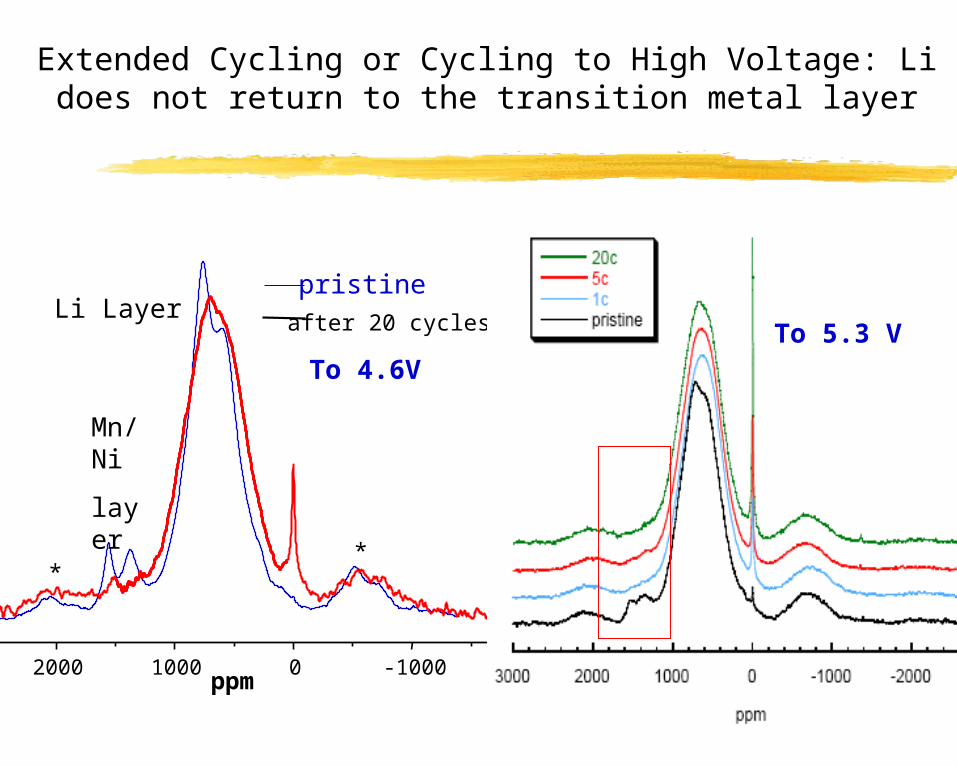
2000 1000 0 -1000
after 20 cycles
ppm
Mn/Ni
layer
Li Layer
**
Extended Cycling or Cycling to High Voltage: Li does not return to the transition metal layer
pristine
To 4.6VTo 5.3 V

pristine
5.3V4.6V Ni, Mn, Li
Li, Ni
Ni, Mn
Li
Charge to high V
What exactly is going on?

Conclusions
NMR spectra are very sensitive to local structure and electronic structure.
•The spectra can be rationalized by considering the overlap between the Li, O and Mn (paramagnet) orbitals
•This has been used to spinels to:
•Locate Li on oct vs. tet sites
•Examine effect of doping on electronic structure
•Follow the electrochemical process
• and in Li[NixLi1/3-2x/3Mn2/3-x/3]O2 to:
•Determine occupancies for Li in the transition metal layers
•Derive a model for cation ordering in the transition metal layers
•Follow the changes that occur on cycling the battery
•(The Lis in the T.M. layers can participate in the electrochemical process; --> mechanism for increasing cation disorder following multiple charge cycles)
Ni
NexelionSONY’s new LiIB:
LiCoO2 + CoNiMn layered oxide
hybrid cathode+ C/Sn hybrid
anode
33% more capacity

Part II:
NMR Studies of Oxygen Ion Motion

Why is Anionic Mobility Important?
The SOFC O2/H2 Cell
Porous anode Doped ZrO2 Porous
Electrolyte Cathode -for stationary power
O2 + 2e- -> 2O2-
H2 ->2H++2e-
H2
*Requires high temperatures (1000 oC for thick electrolytes)
O2-
H2O e- O2 (air) Fuel FlowAir Flow
Fuel electrode
electrolyte
Air electrode
Porous Support Tube
Interconnection
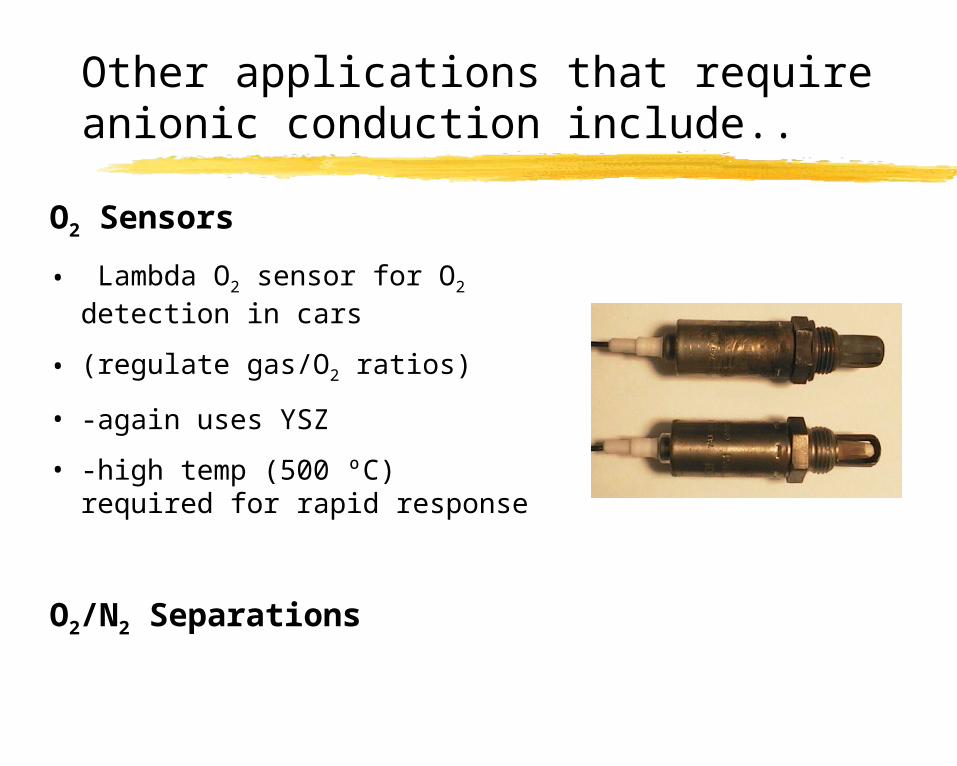
Other applications that require anionic conduction include..
O2 Sensors
• Lambda O2 sensor for O2
detection in cars
• (regulate gas/O2 ratios)
• -again uses YSZ
• -high temp (500 ºC) required for rapid response
O2/N2 Separations

Problems with SOFCs
High operating temperatures Expensive - particularly due to materials
required for high temp. operation (Ceramic vs. stainless)
Stability of materials at high temperatures Degradation of seals
Solutions ----> Improve catalyst in electrodes (particularly on cathode side)
Improve ionic conductivity of electrolyte
Increase surface area of 3-phase boundary
Use thinner electrolytes
LSM
Electrolyte (YSZ)
O2 O2
O2-
O2- O2-
<- e-
cathode
O2
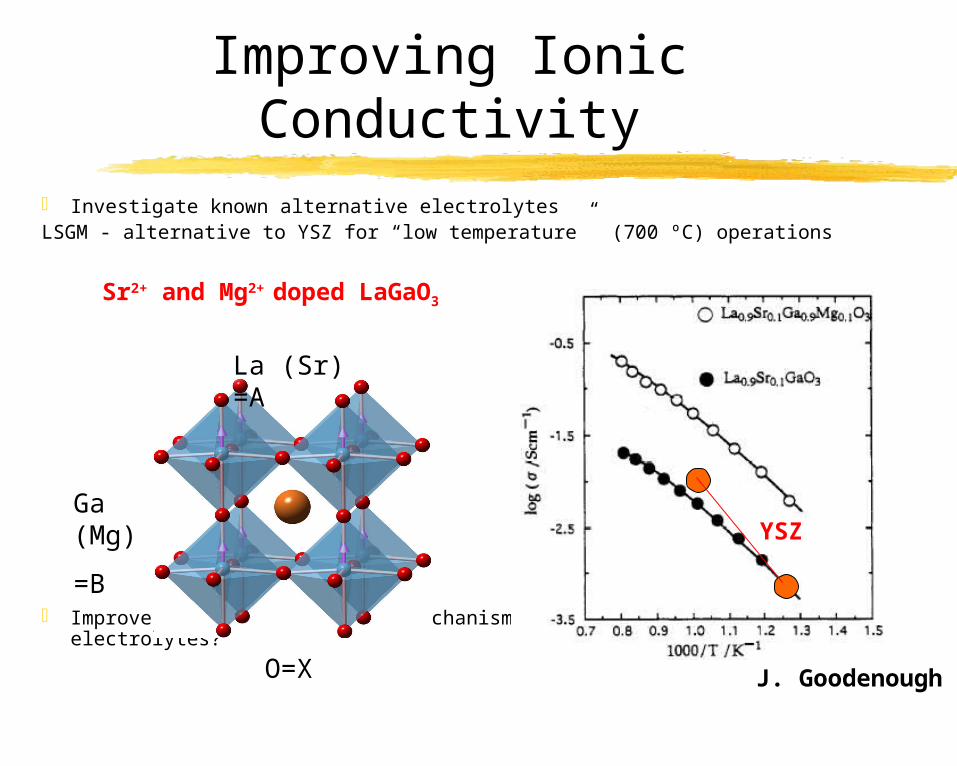
Improving Ionic Conductivity Investigate known alternative electrolytesLSGM - alternative to YSZ for “low temperature” (700 ºC) operations
Improve our understanding of mechanisms for ionic conduction - better electrolytes?
O=X
Ga (Mg)
=B
La (Sr) =A
Sr2+ and Mg2+ doped LaGaO3
YSZ
J. Goodenough

How Do Oxygen Anions Move in Solids?
Vacancy mechanism Interstitial Mechanism
Vacancies/interstitials are created in a solid by cation doping: e.g. Y3+ - doped ZrO2 YxZr1-xO2-x/2 x/2
c.f., Y3+ - doped CaF2 YxCa1-xF2+x interstitial F-
Major mech. for
O2-
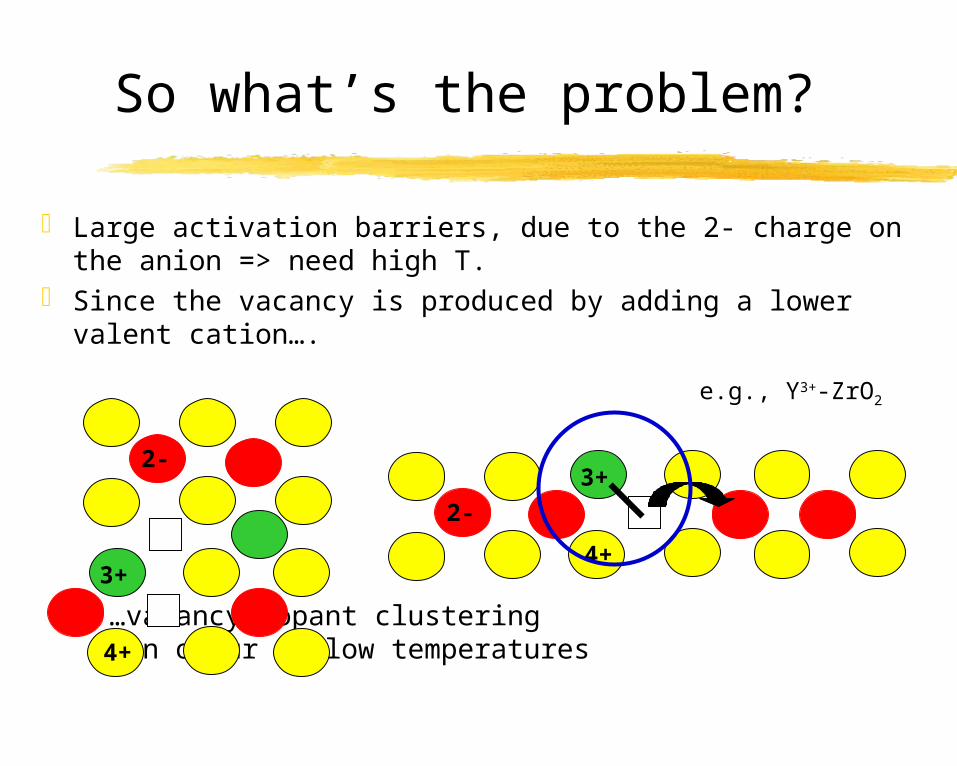
So what’s the problem?
Large activation barriers, due to the 2- charge on the anion => need high T.
Since the vacancy is produced by adding a lower valent cation….
…vacancy-dopant clustering can occur at low temperatures
3+
4+
2-
3+
4+
2-
e.g., Y3+-ZrO2

Many anionic conductors show considerable disorder on the anion sub-lattice. - diffraction studies do not necessarily provide an accurate model for the local structure.
However… the nature of the defects and local order controls the mechanisms of conduction in these materials.
If we can observe the different oxygen sites in the structure by NMR, then we can determine which oxygen anions are responsible for the anionic conductivity.
3+
4+
2-
Understanding the conduction process: Why NMR?

The BIMEVOX Family (Bi4V2-xMxO10-x/2) - some of the highest oxide conductors discovered to
date
-Bi4V1.7Ti0.3O10.85
Bi4V2O11
Conductivity of selected oxide materials, after Kendell et al. Chem Mat, ‘96, and Yan and Greenblatt, SSI ‘95.
Max. temp.
reached by
standard commercial probes
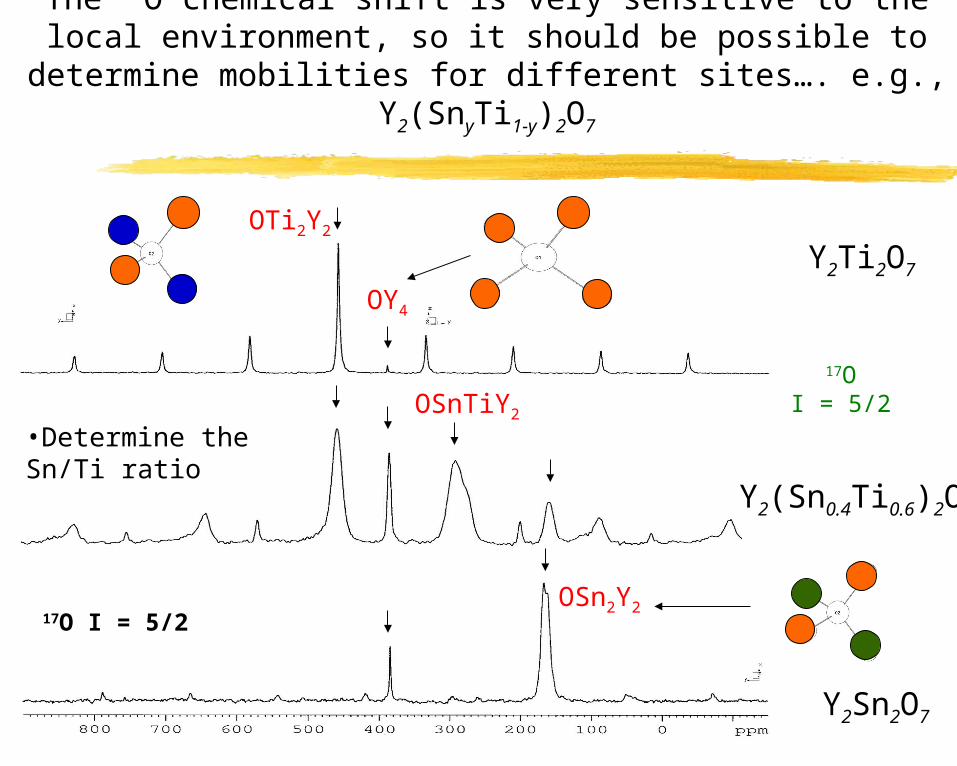
The 17O chemical shift is very sensitive to the local environment, so it should be possible to determine mobilities for different sites…. e.g., Y2(SnyTi1-y)2O7
Y2Ti2O7
Y2Sn2O7
Y2(Sn0.4Ti0.6)2O7
Y2Sn2O7
OSn2Y2
OY4
OTi2Y2
OSnTiY2
•Determine the Sn/Ti ratio
17O I = 5/2
17O I = 5/2
x yz
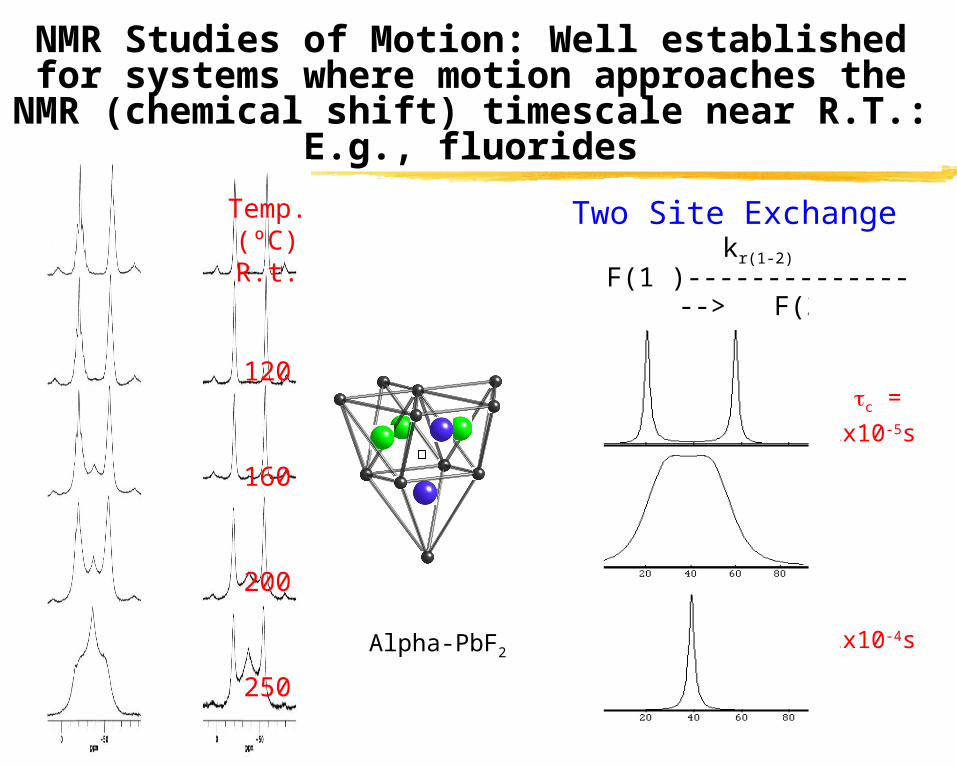
Two Site Exchangekr(1-2)
F(1 )---------------->F(2)
<--------------
kr(2-1)
c =
2x10⁻⁵s
2x10⁻⁴s
2x10⁻³s
NMR Studies of Motion: Well established for systems where motion approaches the NMR
(chemical shift) timescale near R.T.: E.g., fluorides
Temp.(ºC)R.t.
120
160
200
250
-PbF2
Alpha-PbF2

1000 500 0 -500 PPM
The conductivity may be dramatically enhanced by substituting the M6+ cations by M5+ cations, either
stoichiometrically or by doping
e.g., Bi4V2O11
= Bi2VO5.5 �0.5
Nb5+-doped Bi2WO6
830
615
Bi2O22+ layers
c.f., Bi217O3
δ = 195 ppm
(S. Yang et al. JACS 1989)
17O MAS NMR 8.4 T VO5 �0.5
“octaheda”
= 10 -5 vs. 10-3 Scm-1
at 500 °C (Nb)
Baux et al. SSI 1996
WO6
With R. -N. VannierLille

1000 800 600 400 200 0 -200 PPM
Bi2WO6
Bi2W0.9Nb0.1O5.95
•Heat in 17O2 gas at 600 °C
17O enrichment is straightforward for moderate conductors
X 5
= 10 -5 vs. 10-3 Scm-1 at 500 °C
(Nb) Baux et al. SSI 1996
Bi2O22+
layers17O MAS NMR
8.4 T
WO6
RT
150oC
225oC
250oC
200oC
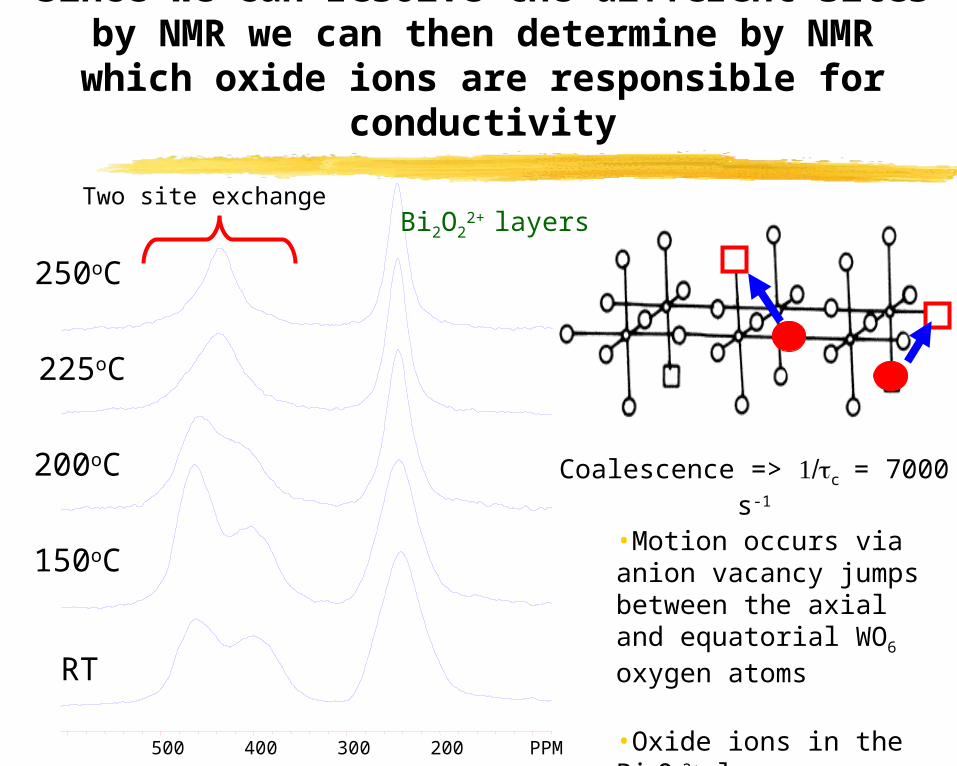
Since we can resolve the different sites by NMR we can then determine by NMR which oxide ions
are responsible for conductivity
500 400 300 200 PPM
Coalescence => c= 7000 s-
1
•Motion occurs via anion vacancy jumps between the axial and equatorial WO6 oxygen atoms
•Oxide ions in the Bi2O2
2+ layers are rigid
Bi2O22+ layers
Two site exchange

500 400 PPM
5% Nb5+
500 400 PPM
10% Nb5+
RT
100oC
150oC
250oC
200oC
T
Increasing the doping level increases the mobility, consistent with an anion vacancy
model
in contrast to earlier literature reports..
2x4s 3 x5s

o Bi2WO6
Bi2W0.95Nb0.05O6
Bi� 2W0.9Nb0.1O6
The NMR results are consistent with newconductivity data (on the same samples)
NMR measurements

Probing much slower motion:2-Dimensional NMR methods
/2 /2
Preparation
Mixing
t1
π/2t2
Detection
Evolution
F1
F2
A
B
A-B
B-A
AB• Probe motion that occurs during the “mixing time”

Room temperature tm=50ms
175oC tm=5ms
250oC tm=5ms
225oC, tm=5ms
c for W-O ax and eq exchange ~ 10 s, while c for
W-O/ Bi-O exchange ~ 10
ms
Bi2O2 layer
W-O-W
W-O-Bi
2-D NMR methods can be used to detect the slower jumps between the Bi2O2
2+ and WO6 layers

Variable Temperature 17O MAS NMR spectra of Bi4V2O11can again be used to determine directly
which sites are mobile
17O MAS NMR
2000 1000 0 -1000 PPM
30oC
100oC
140oC
180oC
220oC
250oC700
260
830615
* *
•The resonances at 615ppm and 830ppm gradually merge oxygen motion in the vanadium oxide layer increases as the temperature increased
•Both V-O oxygen sites are involved in the motion.
900 700 PPM
900 700 PPM
*
*
600 MHz data
V-O-VV-O-Bi

Now 51V MAS NMR may be used as a 2nd probe of structure (& motion) in this more complex material
Idealized Structure of the high temperature phase
Structure refinements*:
2 tet, 2 penta coord V sites 3 tet, 1 penta coord V sites
*R.N. Vannier, G. Mairesse et al.0 -200 -400 -600 -800 PPM
-430 tetsym.
-510tet V:II(distorted)
-4405-coord
51V MAS NMR
40 kHz
15 kHz
1:1
**
*
* *
Abrahams, I. J. Mat. Chem. 1998. Hardcastle, F. D. JSSC 1991. Delmaire, F. PCCP 2000

17O/51V TRAPDOR NMR of Bi4V2O11confirms that the resonances at 610 and 820 ppm are near vanadium.
Use to detect motion between the same sites
17O/51V TRAPDOR at 10kHz spinning
No irradiation
51V irradiation for 800msec(rf = 100 kHz)
Difference
2000 1000 0 -1000 PPM
610
265
820
= nR
90o 180o
17O
51V
•The TRAPDOR effect decrease substantially at 180 ºC as these sites become mobile
c ~1 ms
17O
51V
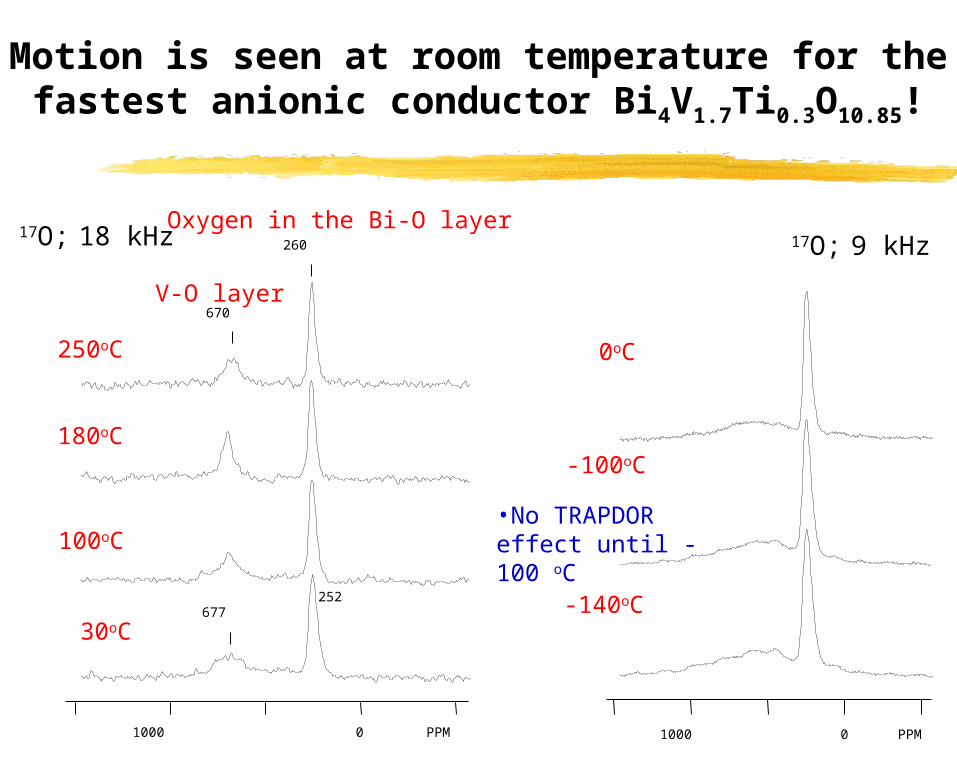
Motion is seen at room temperature for the fastest anionic conductor Bi4V1.7Ti0.3O10.85!
17O; 18 kHz Oxygen in the Bi-O layer
V-O layer
30oC
100oC
180oC
250oC
670
260
677252
1000 0 PPM
-100oC
-140oC
0oC
1000 0 PPM
17O; 9 kHz
•No TRAPDOR effect until -100 oC

80 70 60 50 40 30 20PPM
Rt
100C
150C
200C
250C
250 200 150 100
200C
RT
LaGaO3: 71Ga and 17O Can be Used to Probe Local Structure
71Ga NMR
Pnma
R3c
17O NMR: No evidence for O mobility
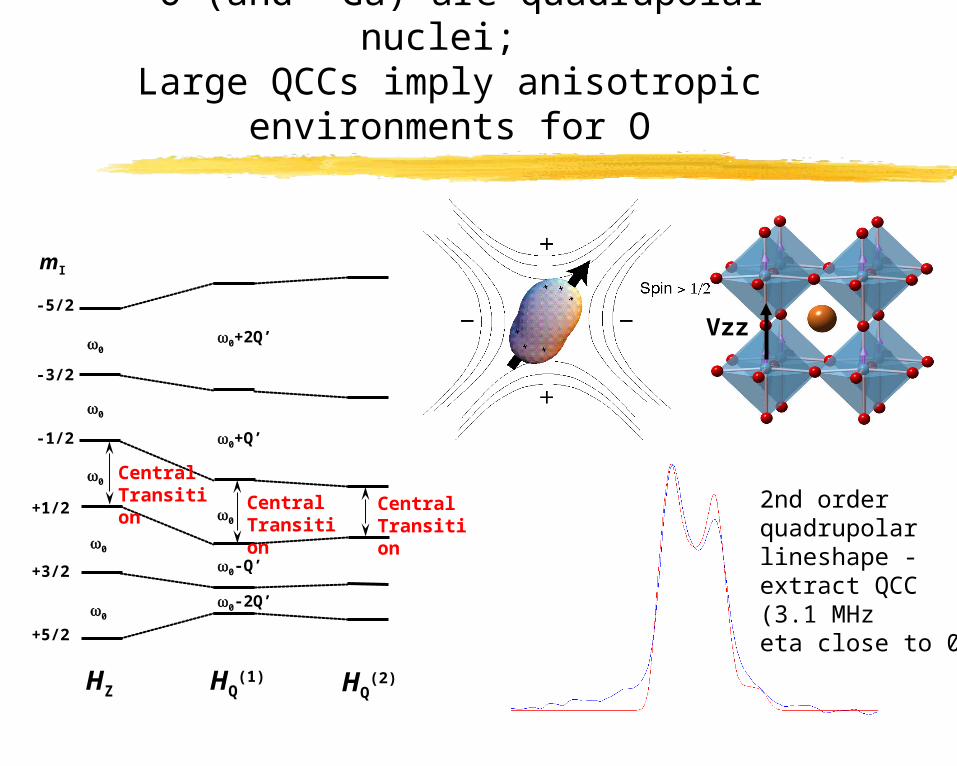
17O (and 71Ga) are quadrupolar nuclei; Large QCCs imply anisotropic
environments for O
mI
-5/2
-3/2
-1/2
+1/2
+3/2
+5/2
0
Central Transition
0-Q’
0-2Q’
0+2Q’
0
0+Q’
0
0
0
0
Central Transition
Central Transition
HQ(2)HQ
(1)HZ
2nd order quadrupolarlineshape - extract QCC(3.1 MHzeta close to 0)
Vzz

Cation Doping Increases O Mobility, as Seen by 17O NMR
350 300 250 200 150 100 50 PPM
250C
200C
150C
100C
Ambient
300 250
200 150
rt
250C
10% Sr 10%Mg2+
Mg-O-Ga
Collapse of 2nd order lineshape=> hops between sites
Vzz

Summary
•Local probes such as NMR and PDF analysis can be used to examine both local and long-range motion in perovskite-like materials
•We have now developed a number of approaches that allow us to follow oxide ion mobility in solids at moderate temperatures1. Normal VT methods (for more mobile systems), for hops between different sites2. Two dimensional NMR experiments allow us to study much slower motions
(up to correlation times of approx 100 ms)
•These methods yield detailed information concerning which and how oxide anions move in solids
This approach has been used, e.g, in Nb5+-doped Bi2WO6 to show that:•motion involves jumps between the two sites in the WO6
2- layers
•Motion in 3D occurs with a much longer correlation time
•Methods are being applied to materials with lower conductivity such as doped LaGaO3

Acknowledgements
Wonsub Yoon (BNL)
Younkee Paik
Nicolas Dupre (CNRS, Nantes)
Stony BrookYoung Joo Lee (LG
Chemicals)Namjum Kim
(Stanford)
CEMS
BNLXing Yang
James McBreenLille
Rose-Noelle Vannier
John PalumboJulien Breger
Meng Jiang
NSF, DOE (Office of FreedomCAR) and Gillette
MIT Gerd Ceder
Dany Carlier (Bordeaux); Anton van der Ven (U. Michigan); John Gorman; John
Reed; Shirley Meng; Kisuk Kang
Yang Shao-Horn


![Facile Synthesis of Reversibly Crosslinked Poly(ionic ... · nanostructured carbon-based materials,[10] as solid ionic conductors for energy storage,[11] and for catalysis as well,[3,12]](https://img.dokumen.tips/doc/110x75/5e3c14f070b40246f51bda09/facile-synthesis-of-reversibly-crosslinked-polyionic-nanostructured-carbon-based.jpg)