Embed Size (px)
Citation preview
1
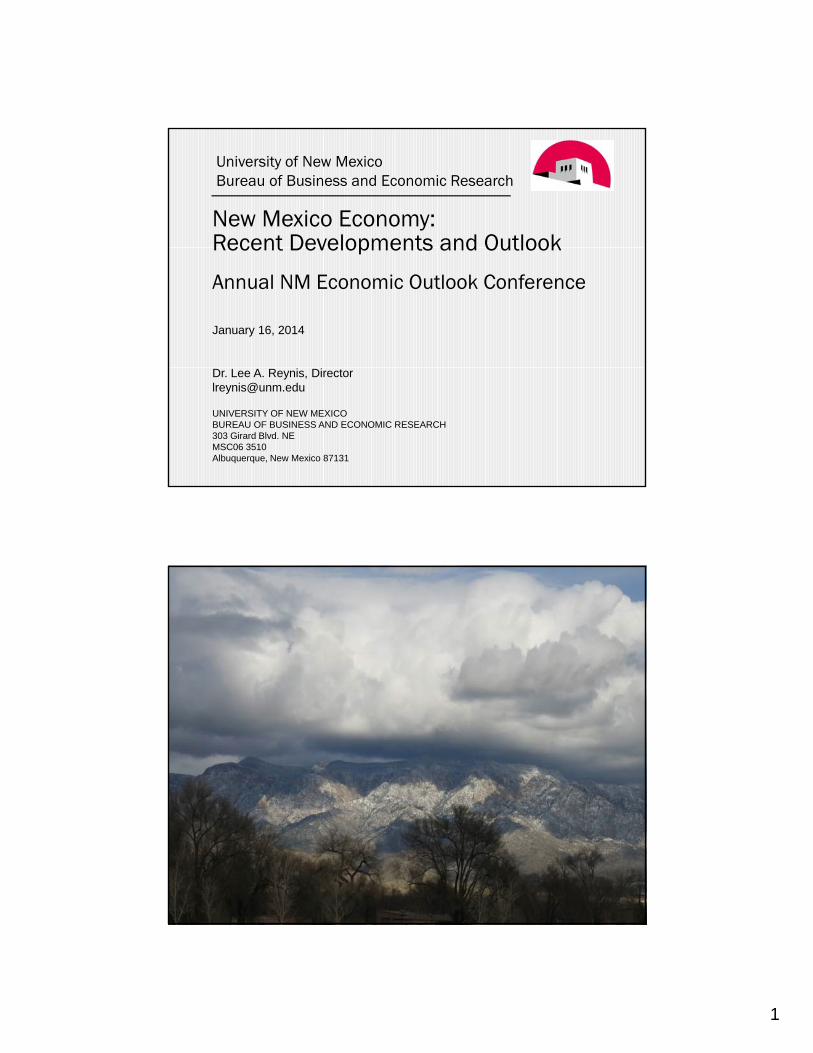
University of New MexicoBureau of Business and Economic Research
New Mexico Economy: Recent Developments and OutlookRecent Developments and Outlook
Annual NM Economic Outlook Conference
January 16, 2014
Dr. Lee A. Reynis, [email protected]
UNIVERSITY OF NEW MEXICOBUREAU OF BUSINESS AND ECONOMIC RESEARCH303 Girard Blvd. NEMSC06 3510Albuquerque, New Mexico 87131
2
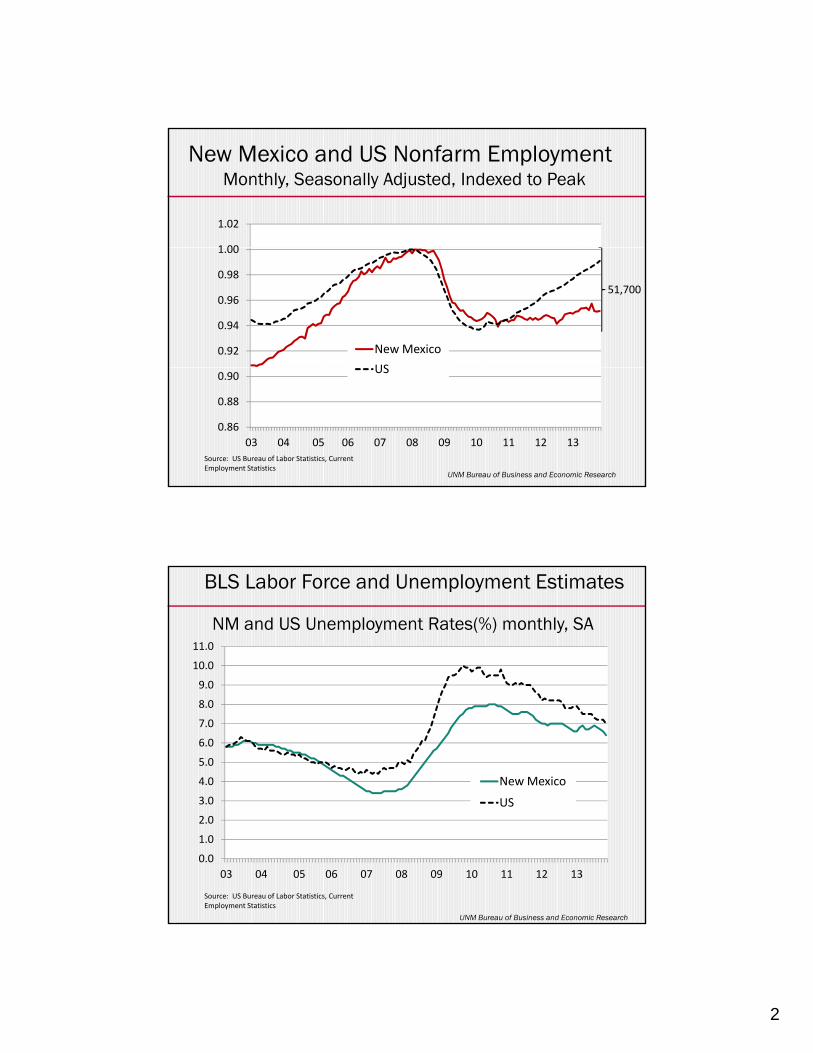
New Mexico and US Nonfarm EmploymentMonthly, Seasonally Adjusted, Indexed to Peak
1 00
1.02
51,700
0.92
0.94
0.96
0.98
1.00
New Mexico
US
Source: US Bureau of Labor Statistics, Current Employment Statistics
UNM Bureau of Business and Economic Research
0.86
0.88
0.90
03 04 05 06 07 08 09 10 11 12 13
US
NM and US Unemployment Rates(%) monthly, SA
BLS Labor Force and Unemployment Estimates
9 0
10.0
11.0
3.0
4.0
5.0
6.0
7.0
8.0
9.0
New Mexico
US
UNM Bureau of Business and Economic Research
0.0
1.0
2.0
03 04 05 06 07 08 09 10 11 12 13
US
Source: US Bureau of Labor Statistics, Current Employment Statistics
3
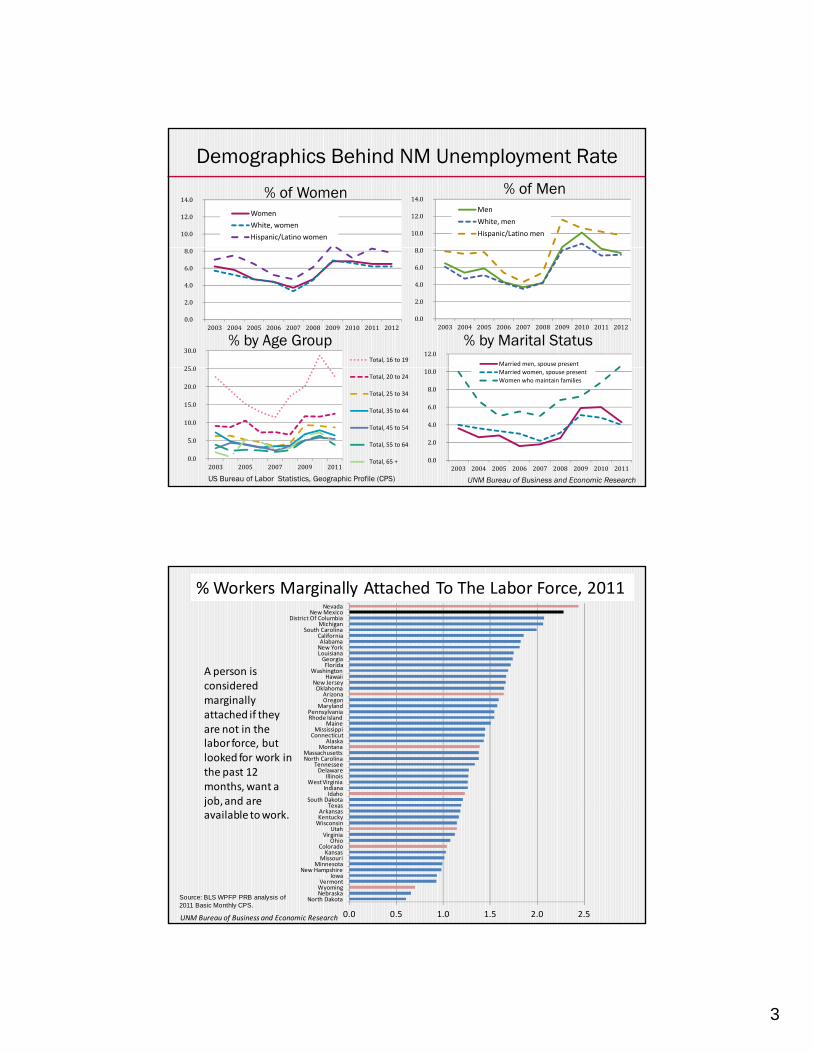
Demographics Behind NM Unemployment Rate
10.0
12.0
14.0
Men
White, men
Hispanic/Latino men10.0
12.0
14.0
Women
White, women
Hispanic/Latino women
% of Women % of Men
0.0
2.0
4.0
6.0
8.0
2003 2004 2005 2006 2007 2008 2009 2010 2011 20120.0
2.0
4.0
6.0
8.0
2003 2004 2005 2006 2007 2008 2009 2010 2011 2012
25 0
30.0Total, 16 to 19
% by Age Group12.0
Married men, spouse present
% by Marital Status
0.0
5.0
10.0
15.0
20.0
25.0
2003 2005 2007 2009 2011
Total, 20 to 24
Total, 25 to 34
Total, 35 to 44
Total, 45 to 54
Total, 55 to 64
Total, 65 + 0.0
2.0
4.0
6.0
8.0
10.0
2003 2004 2005 2006 2007 2008 2009 2010 2011
Married women, spouse present
Women who maintain families
US Bureau of Labor Statistics, Geographic Profile (CPS) UNM Bureau of Business and Economic Research
A person is considered
% Workers Marginally Attached To The Labor Force, 2011
New JerseyHawaii
WashingtonFloridaGeorgia
LouisianaNew YorkAlabamaCalifornia
South CarolinaMichigan
District Of ColumbiaNew Mexico
Nevada
considered marginally attached if they are not in the labor force, but looked for work in the past 12 months, want a job, and are Texas
South DakotaIdaho
IndianaWest Virginia
IllinoisDelaware
TennesseeNorth CarolinaMassachusetts
MontanaAlaska
ConnecticutMississippi
MaineRhode IslandPennsylvania
MarylandOregonArizona
Oklahomay
j ,available to work.
0.0 0.5 1.0 1.5 2.0 2.5
North DakotaNebraskaWyomingVermont
IowaNew Hampshire
MinnesotaMissouriKansas
ColoradoOhio
VirginiaUtah
WisconsinKentuckyArkansas
Texas
Source: BLS WPFP PRB analysis of 2011 Basic Monthly CPS.
UNM Bureau of Business and Economic Research

4
Alternative Measures of NM Unemployment indicate many more New Mexicans marginally attached or working part-time involuntarily
All counts in thousands 2007 2012
U‐3: Official Unemployment Rate1
36 68
Unemployment Rate 3.7% 7.1%
Labor Force 947 952
Unemployed
U‐4: Unemployed include discouraged workers
Discouraged Workers 1 4
36 71
Unemployment Rate 3.8% 7.5%
Labor Force 947 956
U‐5: Unemployed include all marginally attached
All Marginally Attached 8 17
43 85
Unemployment Rate 4.5% 8.8%
Unemployed
Unemployed
p y
Labor Force 954 969
U‐6: Unemployed include involuntary part‐time
Marginally + Involuntary Part time 27 51
70 137
Unemployment Rate 7.3% 14.1%
Labor Force 954 969
1
Unemployed
Unemployed, as % of the civilian labor force. Counted if able and willing to work, have actively sought
work within past 4 weeks.
Data: BLS website, Geographic Profile of Employment and Unemployment (GP)
UNM Bureau of Business and Economic Research
1.6
1.8
NM Population Growth Has Slowed Dramatically
Estimated % Annual Population Growth, 2001-2013
0.6
0.8
1.0
1.2
1.4
0.0
0.2
0.4
01 02 03 04 05 06 07 08 09 10 11 12 13
Source of data: US Census Bureau, Annual Estimates of Population, States
UNM Bureau of Business and Economic Research
5
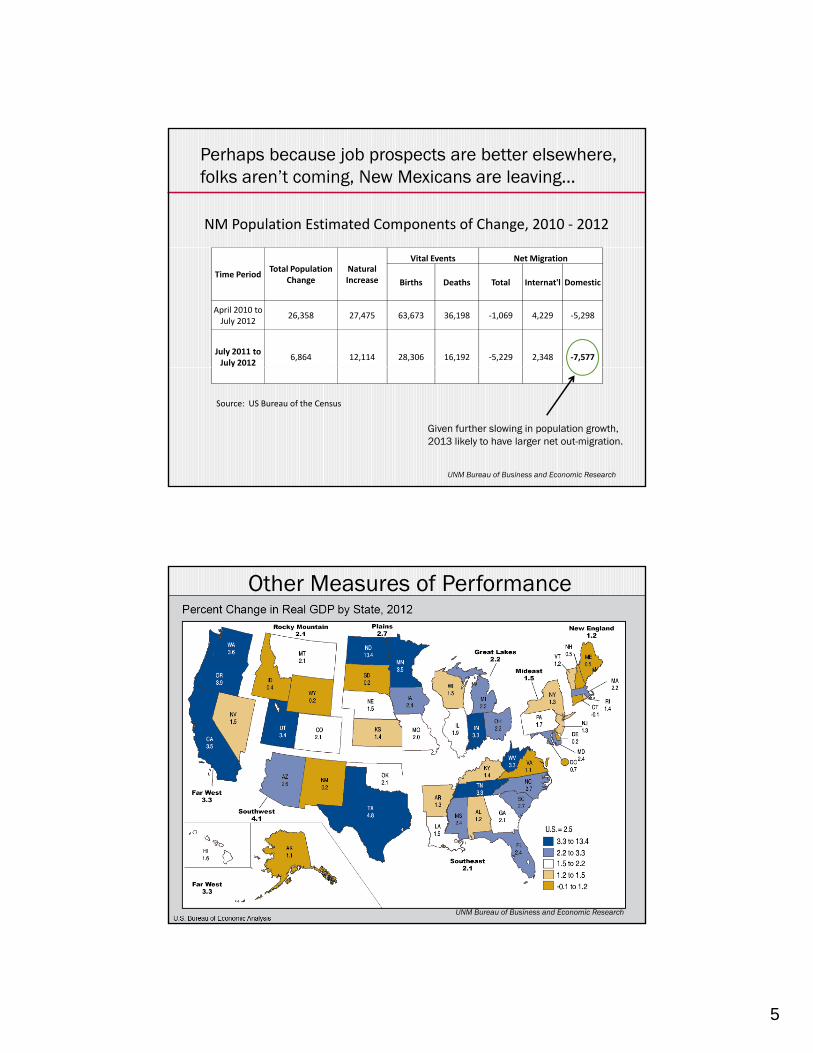
Perhaps because job prospects are better elsewhere, folks aren’t coming, New Mexicans are leaving…
NM Population Estimated Components of Change, 2010 ‐ 2012
Time PeriodTotal Population
ChangeNatural Increase
Vital Events Net Migration
Births Deaths Total Internat'l Domestic
April 2010 to July 2012
26,358 27,475 63,673 36,198 ‐1,069 4,229 ‐5,298
July 2011 to July 2012
6,864 12,114 28,306 16,192 ‐5,229 2,348 ‐7,577
Source: US Bureau of the Census
UNM Bureau of Business and Economic Research
Given further slowing in population growth, 2013 likely to have larger net out-migration.
Other Measures of Performance
UNM Bureau of Business and Economic Research

6
Evidence of Improvement in NM’s Economy
l h lMining
Accomodation & Food
Change in New Mexico Employment, 2011-2012From Quarterly Census of Employment and Wages
I f tiUtilities
Arts, Entertain, RecFinance & Insur
Real Estate, Rent, LeasWhsl Trade
Trans & WhsgState Govt
Retail TradeLocal Govt
ConstructionAdmin & Waste ServicesHealth Care & Socl Assist
UNM Bureau of Business and Economic Research
‐2000 ‐1500 ‐1000 ‐500 0 500 1000 1500 2000
Federal GovtProfessional & Technical
ManufacturingOth Services, Unclass.
Ag, For, Fish, HuntMgt Comp & Enter
Educational ServicesInformation
Total Change 8,012
Private Change 7,541
UNM Bureau of Business and Economic Research
2010 Q1 2012 Q1 2013 Q1
Evidence of Improvement in NM’s Economy
QCEW County Job Growth Over Year AgoDarker red = steeper decline; Darker Blue = more rapid growth.
Maps prepared by Michael O’Donnell UNM Bureau of Business and Economic Research
7
1.05
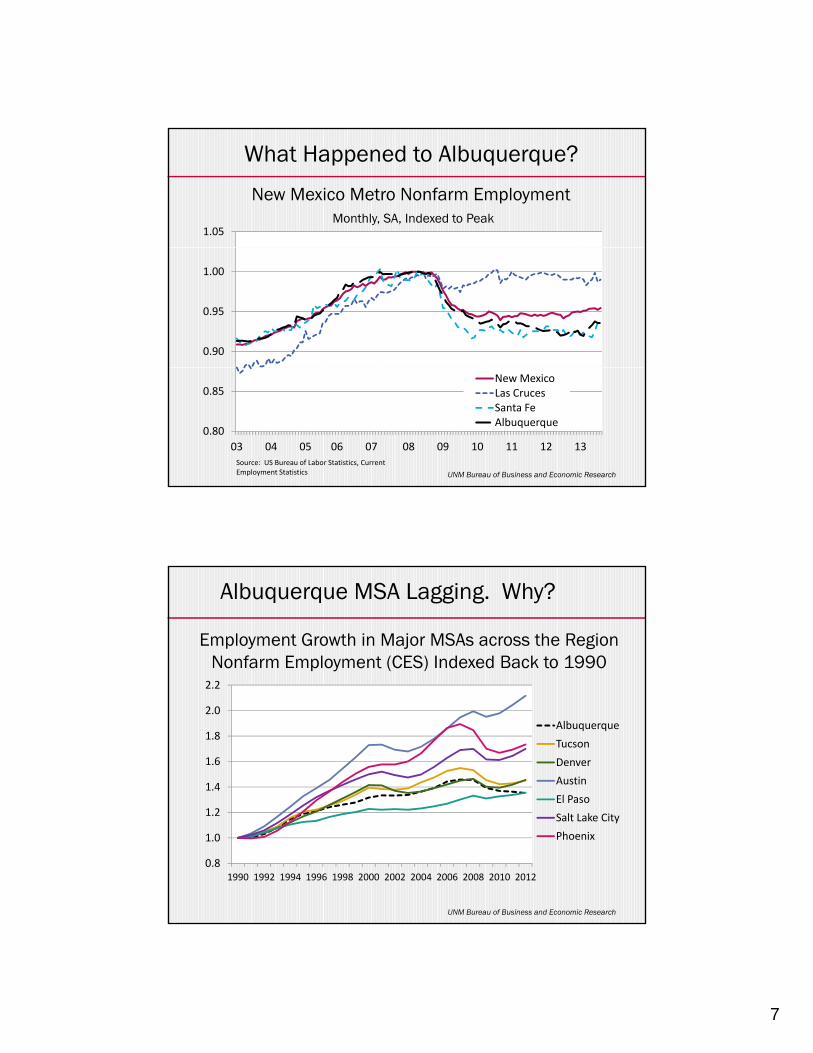
New Mexico Metro Nonfarm EmploymentMonthly, SA, Indexed to Peak
What Happened to Albuquerque?
0.90
0.95
1.00
Source: US Bureau of Labor Statistics, Current Employment Statistics
0.80
0.85
03 04 05 06 07 08 09 10 11 12 13
New MexicoLas CrucesSanta FeAlbuquerque
UNM Bureau of Business and Economic Research
2 2
Employment Growth in Major MSAs across the RegionNonfarm Employment (CES) Indexed Back to 1990
Albuquerque MSA Lagging. Why?
1.4
1.6
1.8
2.0
2.2
Albuquerque
Tucson
Denver
Austin
El Paso
0.8
1.0
1.2
1990 1992 1994 1996 1998 2000 2002 2004 2006 2008 2010 2012
Salt Lake City
Phoenix
UNM Bureau of Business and Economic Research

8
Things are different in NM this time…New Mexico among the top 15 states in terms of job growth in each of the past 4 decades. In Nov. 2013, NM ranked 48th among the states. Albq MSA, which has out-g qperformed NM & US for decades, seriously lagging.
The employment to population ratio, after slowly climbing from 54.9% in 1976 to 61.0% in 08Q2, has been almost in freefall since then and is now 53.8%.
I h d i l k d
UNM Bureau of Business and Economic Research
In the good years growing employment masked many serious problems: NM’s extremely high poverty rate, low per capita income & wages,the racial and ethnic disparities in employment and income…
NM did not face up to challenges…
Persistent Low Per Capita Income & Wages
95%
100%
70%
75%
80%
85%
90%
Average Wage
60%
65%
70%
1990
1991
1992
1993
1994
1995
1996
1997
1998
1999
2000
2001
2002
2003
2004
2005
2006
2007
2008
2009
2010
2011
2012
Per Capita Income
UNM Bureau of Business and Economic Research

9
Dependence on Government
UNM Bureau of Business and Economic Research
Thin Labor Markets; Underprepared Workforce
MiNew York
New HampshireVermontVirginia
ColoradoMaryland
New JerseyConnecticut
MassachusettsDistrict of Columbia
Percent of Population with a Bachelors or More, 2012
South DakotaAlaska
MissouriMaineIowa
North CarolinaWisconsinGeorgia
MontanaPennsylvania
OregonDelaware
UtahNorth Dakota
HawaiiCaliforniaNebraska
WashingtonKansas
Rhode IslandIllinois
Minnesota
0% 10% 20% 30% 40% 50% 60%
ArkansasLouisianaKentuckyAlabama
OklahomaIndiana
WyomingNew MexicoTennessee
IdahoSouth Carolina
OhioTexas
ArizonaMichiganFlorida
South Dakota
Source: American Community Survey, 2012
Yet #4 in PhDs
UNM Bureau of Business and Economic Research

10
Inequality, Disappearing Middle Class
Pulling Apart: A State-by-State Analysis of Income Trends, Center on Budget and Policy Priorities & Economic Policy Institute, p. 11
The importance of Critical Mass
Challenges of distance & low population densitity in NM -- the 5th largest state in the US
The importance of Critical Mass
The difficulties of Raising capital now that many NM banks
have disappeared The critical roles of Angel Investors
Incubators
have disappeared. The critical roles of Angel Investors
and VENTURE CAPITAL,…
The crucial roles of ENTREPRENEURS
11
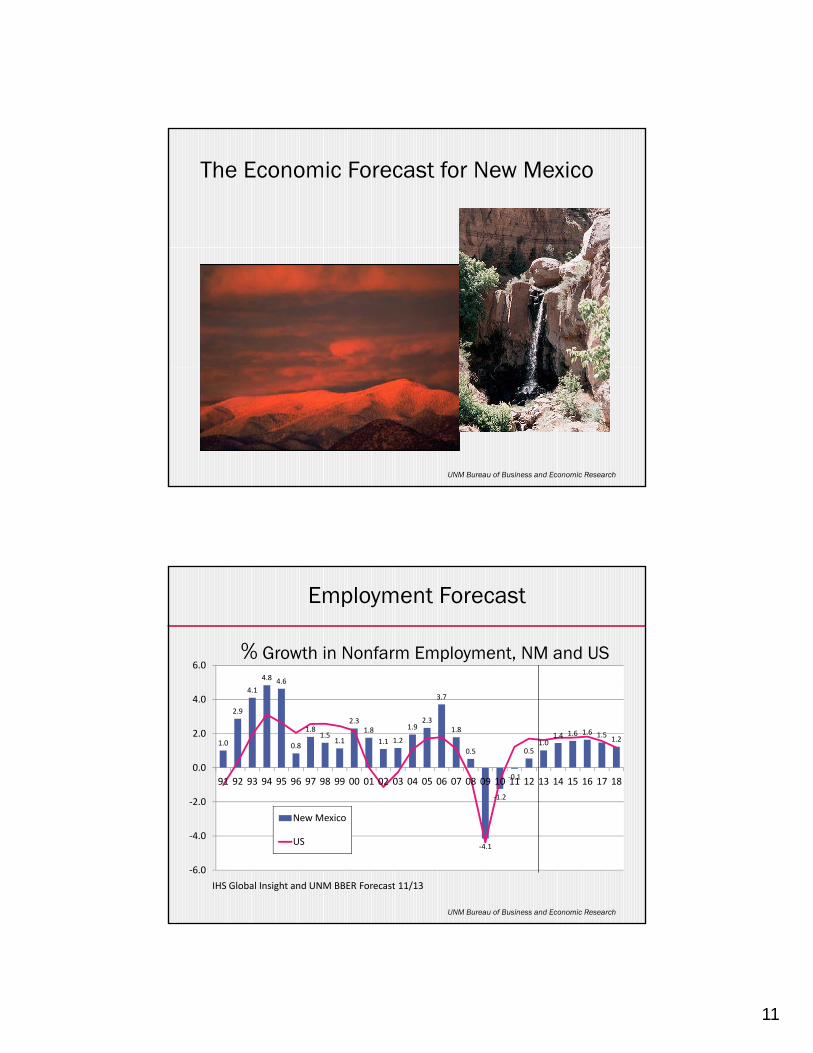
The Economic Forecast for New Mexico
UNM Bureau of Business and Economic Research
% Growth in Nonfarm Employment, NM and US4.8 4.6
6.0
Employment Forecast
1.0
2.9
4.1
0.8
1.81.5
1.1
2.31.8
1.1 1.2
1.92.3
3.7
1.8
0.5
‐1.2
‐0.1
0.51.0
1.4 1.6 1.6 1.51.2
‐2.0
0.0
2.0
4.0
91 92 93 94 95 96 97 98 99 00 01 02 03 04 05 06 07 08 09 10 11 12 13 14 15 16 17 18
IHS Global Insight and UNM BBER Forecast 11/13
‐4.1
‐6.0
‐4.0
2.0
New Mexico
US
UNM Bureau of Business and Economic Research

12
8Alb MSA
% Growth in Nonfarm Employment, AnnualAlbuquerque, NM and US
What about Albuquerque?
0
2
4
6
91 93 95 97 99 01 03 05 07 09 11 13 15 17
Albuquerque MSA
New Mexico
US
‐6
‐4
‐291 93 95 97 99 01 03 05 07 09 11 13 15 17
IHS Global Insight and UNM BBER Forecast 11/13
UNM Bureau of Business and Economic Research
Personal Income Forecast
7.0
% Growth in Personal Income, NM and US
5.95.6
3.5
5.6
2.9
1.8
4.34.7
5.1 5.1 4.9
0.0
1.0
2.0
3.0
4.0
5.0
6.0
‐1.5
‐4.0
‐3.0
‐2.0
‐1.0 07 08 09 10 11 12 13 14 15 16 17 18
New Mexico
US
IHS Global Insight and UNM BBER Forecast 11/13
UNM Bureau of Business and Economic Research
13
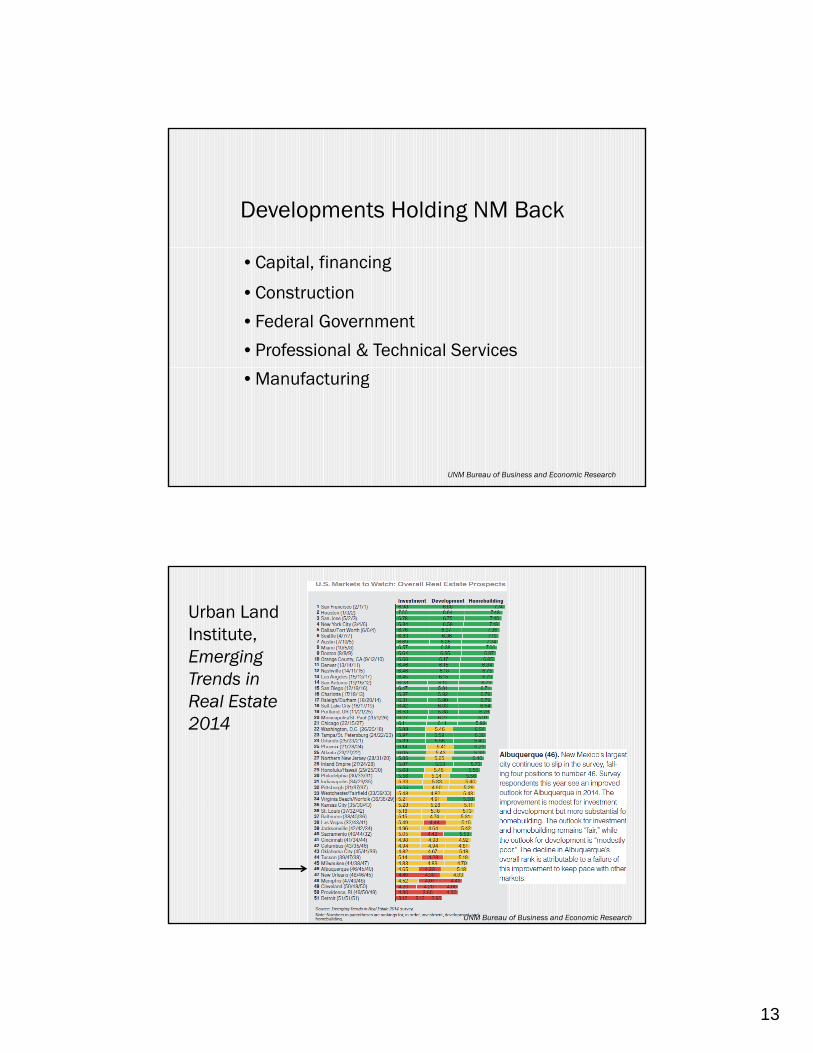
Developments Holding NM Back
• Capital, financing
• Construction
• Federal Government
• Professional & Technical Services
• Manufacturing
UNM Bureau of Business and Economic Research
Urban Land Institute,Emerging Trends in e dReal Estate 2014
UNM Bureau of Business and Economic Research

14
A lackluster construction recoveryNew Mexico Construction Employment
Forecast
50 000
55,000
60,000
65,000
% Growth, Construction EmployAlbuquerque, NM, US
UNM BBER Forecast 11/13
25,000
30,000
35,000
40,000
45,000
50,000
90 92 94 96 98 00 02 04 06 08 10 12 14 16 18
10
15
‐20
‐15
‐10
‐5
0
5
03 04 05 06 07 08 09 10 11 12 13 14 15 16 17 18
New Mexico
Albuquerque MSA
US
UNM Bureau of Business and Economic Research
5,000
5,500
6,000
New Mexico $ Value of Construction Awards
Residential & non-residential have slowed
1 500
2,000
2,500
3,000
3,500
4,000
4,500 Non-Building
Non-Residential
Residential
0
500
1,000
1,500
818283848586878889909192939495969798990001020304 050607080910 11 12139SOURCE: FW DODGE 9mos
UNM Bureau of Business and Economic Research

15
Four‐Quarter % Change in FHFA Housing Price Indexes (Purchase only), 2013 Q2)
Housing Prices are Crawling Back Up
30
40
‐10
0
10
20
30
04 05 06 07 08 09 10 11 12 13
New Mexico
Source: Federal Housing Finance Agency
‐30
‐20 Colorado
Arizona
UNM Bureau of Business and Economic Research
6 000
7.000
Multi Family
City of Albuquerque Housing Units Permitted
City of Albuquerque HousingExtreme vulnerability to housing collapse, but so did many major MSAs
2 000
3.000
4.000
5.000
6.000Single Family
0.000
1.000
2.000
90 92 94 96 98 00 02 04 06 08 10 12 14 16 18
Rio Rancho units peaked at 3,247 in 2005 and were 421 in 2012UNM Bureau of Business and Economic Research

16
Government Employment in New MexicoAll Levels Indexed to 1990
Dependence on Goverment
1.80
1.00
1.20
1.40
1.60
Local
State
Federal
Military
UNM BBER Forecast 11/13
0.60
0.80
90 92 94 96 98 00 02 04 06 08 10 12 14 16 18
UNM Bureau of Business and Economic Research
New Mexico Human Services Dept Caseloads
17
6
8
10
12
14
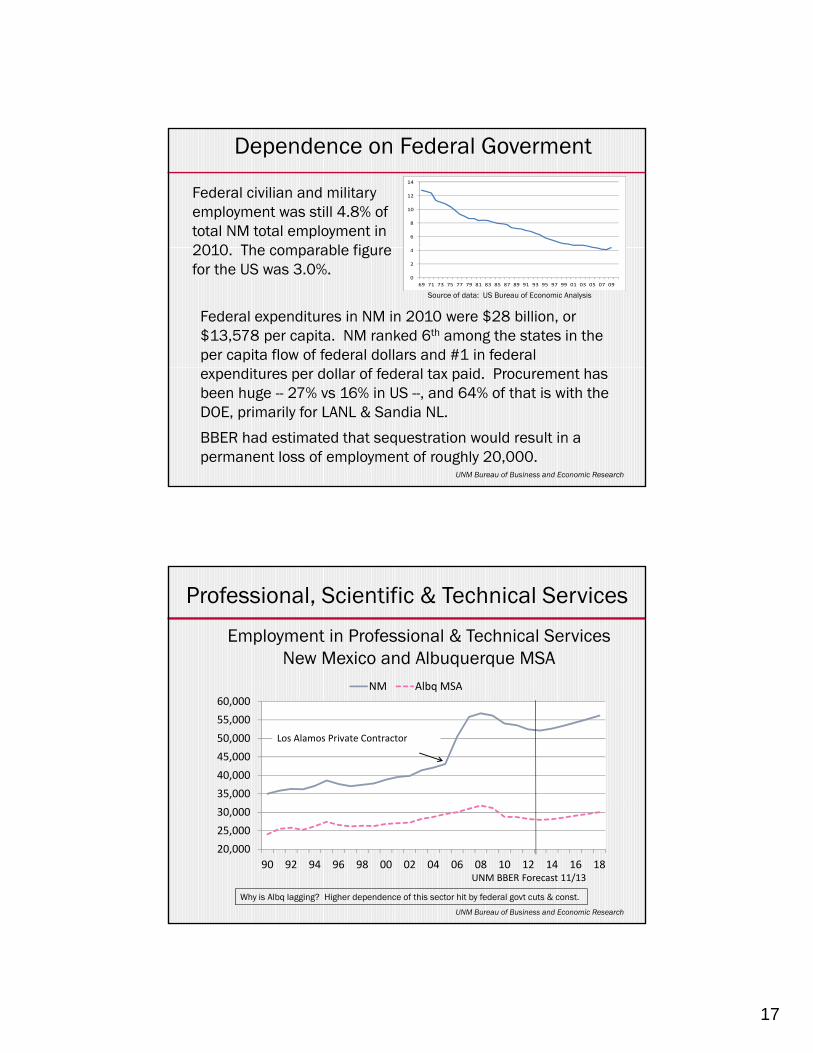
Federal civilian and military employment was still 4.8% of total NM total employment in 2010 The comparable figure
Dependence on Federal Goverment
0
2
4
69 71 73 75 77 79 81 83 85 87 89 91 93 95 97 99 01 03 05 07 09
2010. The comparable figure for the US was 3.0%.
Source of data: US Bureau of Economic Analysis
Federal expenditures in NM in 2010 were $28 billion, or $13,578 per capita. NM ranked 6th among the states in the per capita flow of federal dollars and #1 in federal expenditures per dollar of federal tax paid. Procurement has been huge -- 27% vs 16% in US --, and 64% of that is with the DOE, primarily for LANL & Sandia NL.
BBER had estimated that sequestration would result in a permanent loss of employment of roughly 20,000.
UNM Bureau of Business and Economic Research
Employment in Professional & Technical ServicesNew Mexico and Albuquerque MSA
Professional, Scientific & Technical Services
NM Albq MSA
35,000
40,000
45,000
50,000
55,000
60,000
NM Albq MSA
Los Alamos Private Contractor
UNM BBER Forecast 11/13
Why is Albq lagging? Higher dependence of this sector hit by federal govt cuts & const.
20,000
25,000
30,000
90 92 94 96 98 00 02 04 06 08 10 12 14 16 18
UNM Bureau of Business and Economic Research

18
50,000
60,000Other
QCEW Employment in NM Prof, Scientific & Technical Services: Behind the aggregates…
20 000
30,000
40,000
,Scientific R&D
Mgt & Techl Consulting
Computer Systems
Specialized Design
0
10,000
20,000
01 02 03 04 05 06 07 08 09 10 11 12
p g
Architects & engineers
Lawyers & accountants& PR
UNM Bureau of Business and Economic ResearchSource of data: US Bureau of Labor Statistics, QCEW
Manufacturing, an important sector…
Albuquerque & NM Manufacturing Employment
10 00015,00020,00025,00030,00035,00040,00045,000
Why is Albuquerque lagging?Albuquerque has lost some key
l lik Philli M t ll
But an industry subject to
% Change in Manufacturing EmploymentAlbuquerque, NM, US
5.0
10.0
‐5,00010,000
90 92 94 96 98 00 02 04 06 08 10 12 14 16
players, like Phillips, Motorolla, Eclipse (until reborn), GE, Schott, and Intel has been cutting.
subject to considerablevolatility – and Albq has been losing share since 01
UNM Bureau of Business and Economic Research
‐20.0
‐15.0
‐10.0
‐5.0
0.0
96 97 98 99 00 01 02 03 04 05 06 07 08 09 10 11 12 13 14 15 16 17
New Mexico
Albuquerque
US
Source: BLS QCEW, FOR-UNM, IHS Global Insight
19
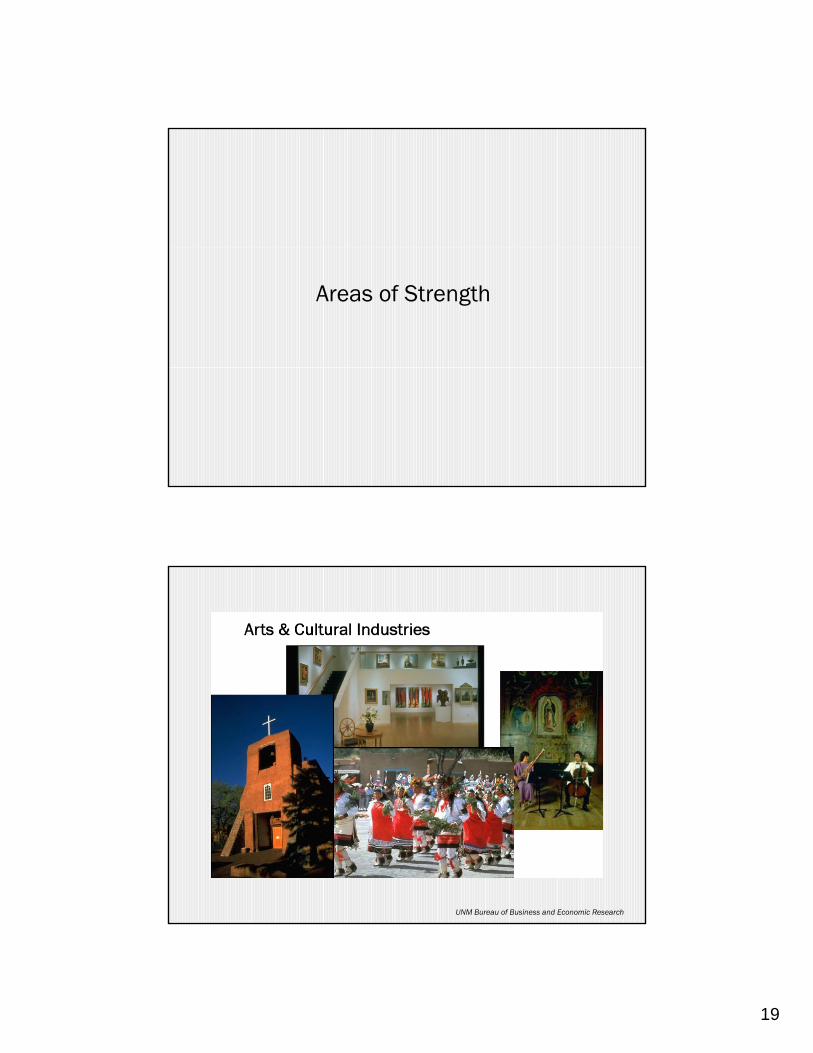
Areas of Strength
UNM Bureau of Business and Economic Research
20
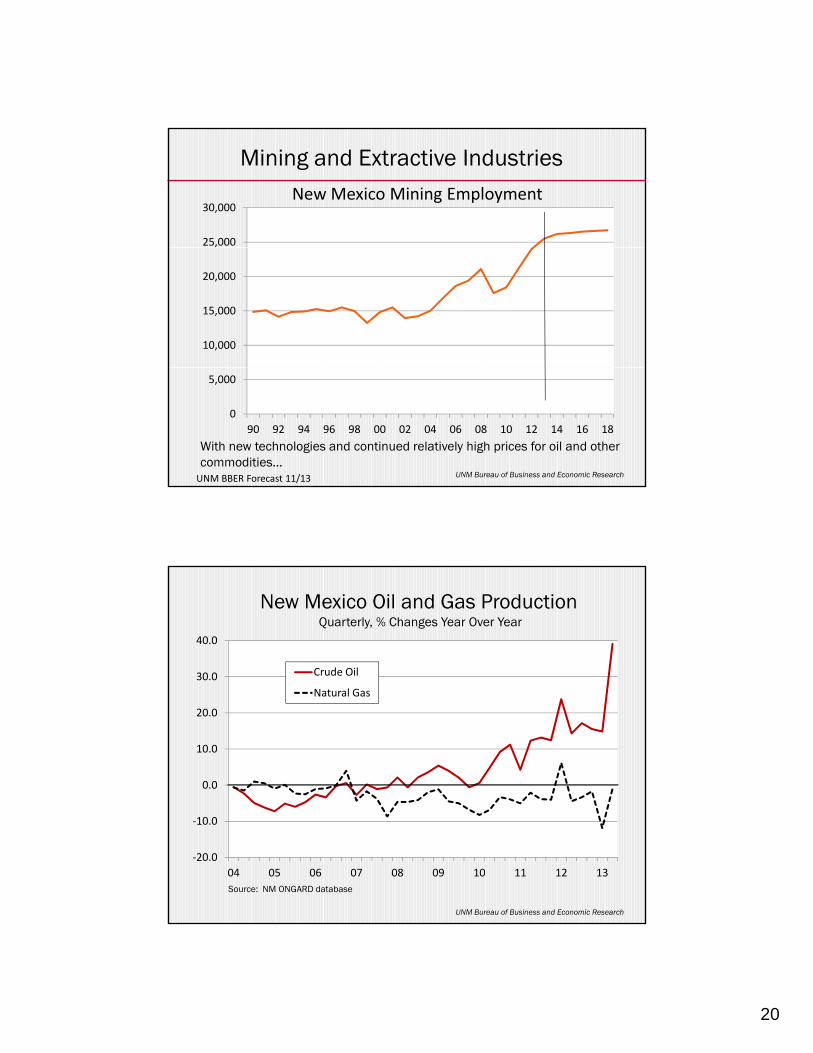
New Mexico Mining EmploymentForecast
25,000
30,000
Mining and Extractive Industries
10,000
15,000
20,000
With new technologies and continued relatively high prices for oil and other commodities…UNM BBER Forecast 11/13
0
5,000
90 92 94 96 98 00 02 04 06 08 10 12 14 16 18
UNM Bureau of Business and Economic Research
New Mexico Oil and Gas ProductionQuarterly, % Changes Year Over Year
30.0
40.0
Crude Oil
0.0
10.0
20.0
Natural Gas
Source: NM ONGARD database
‐20.0
‐10.0
04 05 06 07 08 09 10 11 12 13
UNM Bureau of Business and Economic Research

21
Shale oil is the game now, but…
Source: Department of Energy, Energy Information Agency, Annual Energy Outlook, 2013, p. 82 UNM Bureau of Business and Economic Research
Health Care & Social Assistance in NM NM Private Employment in Health Care & Social Assistance, % Growth
8
9
10
100 000
110,000
120,000
1
2
3
4
5
6
7
40,000
50,000
60,000
70,000
80,000
90,000
100,000
Percent Growth
0
1
30,000
40,000
91 93 95 97 99 01 03 05 07 09 11 13 15 17
New Mexico will participate in the Medicaid expansion and has an exchange for small businesses up and running. Major issue will be access, particularly in rural areas which are underserved. Albq as a medical center should be helped by ACA.
UNM Bureau of Business and Economic Research

22
Technology Because of the labs, universities and existing industry, & drawn by amenities. But what can NM continue to attract and keep those businesses? Big positive here is Innovate Albuquerque.
Other Positives – the 3 T’s
TourismA growth area. Tourists are returning, helping to boost hospitality industry employment and earnings as well as retail trade…
Transportation• Union Pacific’s new terminal at Santa Theresa – 800 new jobs
• Expansion of the Port at Santa Teresa
• Burlington Northern’s track investments, vision for Belen
Also renewables are making strides: Solar and wind energy, algae and other biofuels, Mesa del Sol smart grid, Tres Amigas Super Station with Albq headqtrs… UNM Bureau of Business and Economic Research
Transportation: Union Pacific Project
UNM Bureau of Business and Economic Research

23
Renewable Energy and Energy TransmissionWestern Governor’s Assoc identified 27 gigawatts ofrenewable generating capacity (solar, wind, geothermal & biomass) in NM – the largest capacity among the included states and western Canada. And, with Renewable Portfolio Standard and incentives,
capacity is being developed‐ capacity is being developed‐ investments are being madein transmission infrastructure
Photos: NM RETAUNM Bureau of Business and Economic Research
Jobs for construction, limited operating jobs, nevertheless…
UNM Bureau of Business and Economic Research
State Government Finances
Consensus Revenue Estimates, Dec. 2013 UNM Bureau of Business and Economic Research
24
The New Mexico Economy:
Finally Recoveringfrom the Great Recession in NM style…
UNM Bureau of Business and Economic Research
New Mexico and lagging Albuquerque MSA continue to pull out of the deepest and longest recession since the 1930’s. The expansion has broadened and deepened, but there is a growing list of casualties – businesses that failed because they couldn’t hang on any longer, families who have left the state, businesses that have pulled up stakes to try their fortune elsewhere. NM is not attracting the interest nor the investment that it once did.
B i h h b i i i i d i Bright spots have been toursim, transportation, mining and extractive industries, and renewables. NM stands to be a big winner from the Medicaid expansion and ACA. Our technology is attracting interest with initiatives like Innovate Albuquerque holding great promise. However,…
• Sectors which have traditionally cushioned the impacts of national recessions on NM – federal, state and local government, professional services – have been less able to play a stabilizing role this time around.
• The NM economy is feeling the pain from federal government cut-backs and stands vulnerable to future cuts.
• NM needs to protect its water resources, to deal with income inequality and deep and persistent poverty, to address the inadequacy of its public education system…NM needs to create a compelling vision for the future that will excite and that can attract, grow & retain businesses while encouraging New Mexicans to realize their full potential.
UNM Bureau of Business and Economic Research