Embed Size (px)
Citation preview
New Hampshire Health Insurance
Market Analysis
REPORT PREPARED FOR
NEW HAMPSHIRE INSURANCE DEPARTMENT
BY JULIA LERCHE, FSA, MAAA, MSPH
CHIA YI CHIN BRITTNEY PHILLIPS
AUGUST 18, 2014

Wakely Consulting Group
TABLE OF CONTENTS
1. Executive Summary .................................................................................................................................. 3 1.1 Overall Enrollment .............................................................................................................................. 3
1.2 Individual Market ................................................................................................................................ 4 1.3 Employer Group Markets .................................................................................................................... 4
2. Methodology, Assumptions, and Limitations of Analysis ......................................................................... 5 2.1 Methodology and Assumptions .......................................................................................................... 5
2.2 Limitations of Analysis ........................................................................................................................ 6
3. 2014 Enrollment by Market ..................................................................................................................... 6 4. Individual Market Analysis ....................................................................................................................... 8
4.1 Enrollment by Plan Type ..................................................................................................................... 8 4.2 Enrollment by Age ............................................................................................................................... 9
4.3 Migration of 2013 Individual Market Enrollees into 2014 Plans ...................................................... 10 4.4 Actuarial Value and Subsidy Enrollment Metrics .............................................................................. 11
4.5 Actual Compared to Expected Enrollment........................................................................................ 14
4.6 Actual Compared to Expected Premium ........................................................................................... 15 5. Uninsured Analysis .................................................................................................................................. 16
6. Small Group Market Analysis .................................................................................................................. 16 7. 2014 Enrollment by Issuer ...................................................................................................................... 18
8. Conclusion ............................................................................................................................................... 19 9. Actuarial Certification ............................................................................................................................. 19
Page 2
Wakely Consulting Group 1. EXECUTIVE SUMMARY
The implementation of the major health insurance reforms under the Affordable Care Act (ACA) were effective on January 1, 2014. These reforms included the introduction of Health Insurance Exchanges, subsidies for certain low- to middle-income families, penalties for individuals without health insurance coverage, prohibitions against denying health insurance to individuals based on health status, prohibitions against setting health insurance premiums based on health status, and other market reforms.
Wakely Consulting Group (Wakely) was retained by the New Hampshire Insurance Department (NHID) to analyze and report on the actual health insurance market enrollment and premium changes resulting from the reforms that were effective in January 2014, and to compare these impacts to initial projections provided to the NHID by Gorman Actuarial LLC in 2012.
To perform the analyses in this report, Wakely relied on enrollment, claims and premium data collected from New Hampshire insurers, third party administrators (TPAs) who administer self-funded health insurance plans for employer groups, and three public programs (Medicaid and the federal and state high risk pools). The analysis focuses on individuals who are under age 65, since most of those age 65 and older are covered by Medicare. Data were not collected for all New Hampshire residents, but rather only those covered by the issuers and markets included in the analysis. Excluded populations include individuals and employer groups covered by insurers with small market share (fewer than 500 covered lives) and New Hampshire residents covered under policies that are not originated in New Hampshire. In Wakely’s review of the data compared to other available sources, some differences were identified but could not be resolved. See the Methodology, Assumptions, and Limitations of Analysis section for additional details.
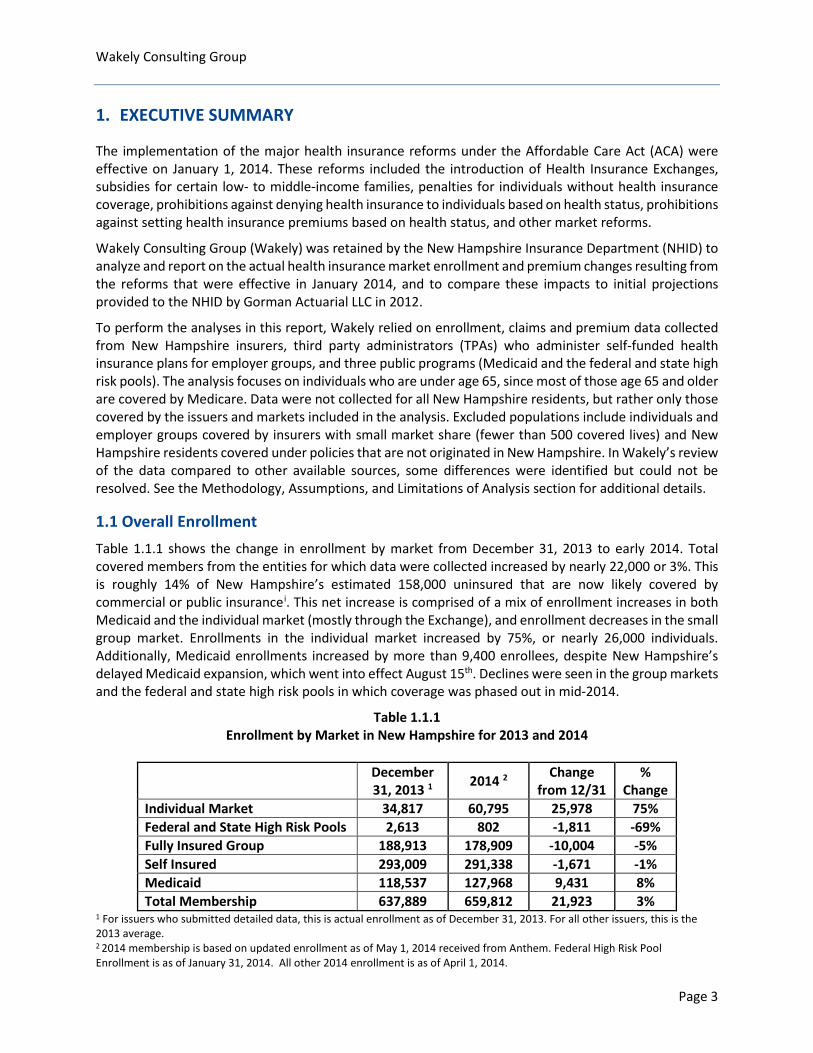
1.1 Overall Enrollment Table 1.1.1 shows the change in enrollment by market from December 31, 2013 to early 2014. Total covered members from the entities for which data were collected increased by nearly 22,000 or 3%. This is roughly 14% of New Hampshire’s estimated 158,000 uninsured that are now likely covered by commercial or public insurancei. This net increase is comprised of a mix of enrollment increases in both Medicaid and the individual market (mostly through the Exchange), and enrollment decreases in the small group market. Enrollments in the individual market increased by 75%, or nearly 26,000 individuals. Additionally, Medicaid enrollments increased by more than 9,400 enrollees, despite New Hampshire’s delayed Medicaid expansion, which went into effect August 15th. Declines were seen in the group markets and the federal and state high risk pools in which coverage was phased out in mid-2014.
Table 1.1.1 Enrollment by Market in New Hampshire for 2013 and 2014
December 31, 2013 1 2014 2 Change
from 12/31 %
Change Individual Market 34,817 60,795 25,978 75% Federal and State High Risk Pools 2,613 802 -1,811 -69% Fully Insured Group 188,913 178,909 -10,004 -5% Self Insured 293,009 291,338 -1,671 -1% Medicaid 118,537 127,968 9,431 8% Total Membership 637,889 659,812 21,923 3%
1 For issuers who submitted detailed data, this is actual enrollment as of December 31, 2013. For all other issuers, this is the 2013 average. 2 2014 membership is based on updated enrollment as of May 1, 2014 received from Anthem. Federal High Risk Pool Enrollment is as of January 31, 2014. All other 2014 enrollment is as of April 1, 2014.
Page 3
Wakely Consulting Group 1.2 Individual Market The ACA had the most significant impact on the individual market. Some of the key changes included guaranteed issue, minimum coverage standards, premium and cost sharing subsidies, and penalties for individuals without health insurance. Many of these provisions encourage insurance coverage for those currently without coverage or who are underinsured.
As noted in Table 1.1.1, enrollment in the individual market increased by 75% from 2013 to 2014. As of May 2014, roughly 34,600 of the 60,800 enrollees in the individual market (57%) are enrolled in policies through the new Exchange, which is administered by the federal government for New Hampshire. The U.S. Department of Health and Human Services (HHS) reported approximately 40,000 enrollees in the individual Exchange as of April 19, 2014. The Exchange enrollment reported to Wakely includes only those who paid their premium and are enrolled in coverage, whereas the number reported by HHS also include individuals and families who selected a plan but did not pay their premium to start coverage. Of those enrolled in coverage through the Exchange, 27,300 individuals, or 79%, are receiving premium subsidies that reduce their premiums by 74% on average. Additionally, 16,400 are eligible for and enrolled in plans that provide for reduced cost sharing, in the form of lower copayments, deductibles, and/or coinsurance, when care is accessed.
Based on the data collected, roughly 36% of individual market enrollees in April/May 2014 continued to be enrolled in policies that did not yet fall under the provisions of the ACA, either because they were grandfathered (i.e., sold before the passage of ACA in March 2010), or they were sold or renewed in 2013 and still covered under the policy, or were allowed to continue based on a federal transitional policy announced in late 2013 to reduce the number of consumers experiencing plan terminations.
The average age of covered members increased by more than three years from 2013 to 2014. This is driven by a significantly higher age in the Exchange plans, which is due to a lower proportion of children enrolled in the Exchange plans compared to non-Exchange plans (both ACA and non-ACA compliant). Children presumably enrolled at a lower rate than adults because many children in families eligible for subsidized coverage through the Exchange are actually eligible for New Hampshire’s Children’s Health Insurance Program (CHIP), which makes them ineligible for subsidized Exchange coverage.
ACA compliant plans are categorized by metal tier. For the Exchange, 60% of the enrollment is in a silver plan while 52% of enrollment off-Exchange is in a bronze plan. For members eligible for cost sharing subsidies, enrollment in an Exchange silver plan is required.
The original Gorman model did not include some changes to the markets that were not anticipated at the time they made their projections (for example, the later start date for Medicaid expansion in New Hampshire). After adjusting the model for these additional changes, the Gorman individual market enrollment projections exceeded actual enrollments through April/May 2014 by approximately 5,000 members, or 9%. This may be a result of healthcare.gov website issues, lack of consumer awareness of the benefits and penalties associated with the ACA, or differences between actual and assumed consumer behavior.
1.3 Employer Group Markets The ACA also had an impact on the small group market (under 51 employees in New Hampshire). Though insurers were prohibited from denying coverage to small groups in New Hampshire prior to the ACA, and there were already some limitations with respect to how small group premiums were developed, the ACA did impose additional rating restrictions on insurers covering small groups and requirements related to covered benefits and cost sharing of plans sold beginning in 2014.
Page 4
Wakely Consulting Group Though it may not be fully attributable to ACA, the data collected indicated a decrease of 11,700 individuals covered by employers of all sizes in New Hampshire (5% decrease among insured groups and 1% decrease among self-funded groups). The largest decline was in the small group market with a decrease of more than 7,000 covered lives, or 9%.
As of April/May 2014, of the 79,000 enrollees in the small group market, only 16% of members were reported to be in plans that met all of the new ACA rules, 1% were in Grandfathered plans (sold before the passage of ACA), and the remaining 83% were in plans sold or renewed in 2013 that were either still in the middle of the policy year, or were allowed to continue based on the federal transitional policy described above. For small groups in ACA compliant plans, 48% of members are in a gold plan. On average the small groups are enrolling in richer plans than individual market enrollees (ignoring cost sharing subsidies). Premiums for the small group and 51-100 market were stable from 2013 to 2014.
2. METHODOLOGY, ASSUMPTIONS, AND LIMITATIONS OF ANALYSIS
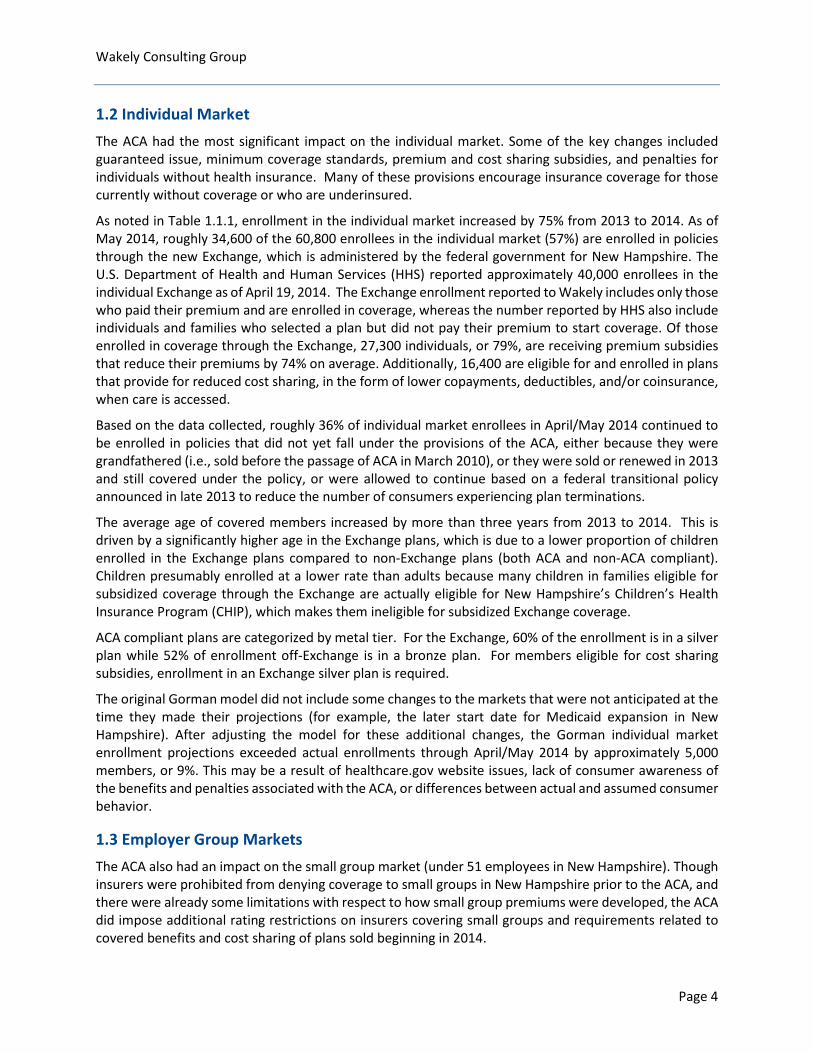
2.1 Methodology and Assumptions Wakely requested and collected data from all active issuers and TPAs in the state of New Hampshire to get basic 2013 and 2014 enrollment statistics to use for baseline calculations. A more robust and detailed data request was sent to the larger issuers in NH for the individual and small group markets only. The detailed data request varied based on the market (individual and small group including groups of 51 – 100). The detailed data request focused on calendar year 2013 membership, claims experience, and premiums by demographic categories, and 2014 membership and premiums. Below is a summary of the issuers from which Wakely collected data, and the type of data received from each issuer:
Issuer Individual Market Small Group Market
Aetna Summary Detailed
Anthem Detailed Detailed
Assurant Detailed N/A
Celtic Summary N/A
Chesapeake Life Summary N/A
Cigna N/A Detailed
Harvard Pilgrim N/A Detailed
Health Plans, Inc. N/A Summary
MVP N/A Detailed
After receiving the data, it was checked for reasonableness and questions were sent back to the issuers with requested revised submissions in some cases. Wakely also requested updated enrollment information from Anthem as of May 1, 2014 in order to capture the most recent exchange enrollment in the analysis. Outstanding issues include low total enrollment counts relative to other data sources,
Page 5
Wakely Consulting Group including enrollments used in the Gorman model and enrollments reported in NHID’s 2012 Supplemental Report.
We used the detailed data for issuers where it was available and the summary data for issuers that did not submit detailed data in our analysis. The summary data received contained total member months for 2013. To obtain the 2013 average number of members we took total member months divided by twelve.
There have been several changes in the regulatory environment since Gorman Actuarial, LLC performed their analysis. Therefore, underlying assumptions in their model and report were not consistent with the current ACA regulatory environment. Wakely made the following changes to the Gorman model to better estimate the expected enrollment in individual market as of 2014, while maintaining the other baseline assumptions:
• Updating the model’s assumption to reflect that there was no Medicaid expansion in the state of New Hampshire as of January 1, 2014 (New Hampshire’s Medicaid program will be expanded on August 15, 2014).
• Redefining small group as groups with 2-50 members. The Gorman model had previously assumed that small groups of 1 (sole proprietors) would be allowed to stay in the small group market.
It is important to note that the 2014 expected enrollment values obtained from the Gorman model are as of December 31, 2014, whereas the actual enrollment values we received are as of April/May 2014. The values have not been adjusted to account for this difference in timing.
2.2 Limitations of Analysis This report is intended for use by NHID to understand actual changes to the New Hampshire markets due to ACA and compare the actual results to initial projections by Gorman Actuarial. The report may not be appropriate for other purposes. Wakely does not intend to benefit third parties and assumes no duty or liability to other parties who receive this work. The report should only be reviewed in its entirety and then only by qualified individuals.
As noted above, this analysis is dependent on data provided to Wakely by NH’s insurers and TPAs. We have not audited or verified these data and other information. If the underlying data or information is inaccurate or incomplete, the results of our analysis may likewise be inaccurate or incomplete. The analysis for 2014 is based on enrollment data at a point in time and is likely to change over time, for example, as enrollees in non-ACA compliant plans move into ACA-compliant plans, and more individuals learn about the provisions of the law.
3. 2014 ENROLLMENT BY MARKET
Wakely collected enrollment data for calendar year 2013 and a snapshot of April or May 2014 enrollment from all active issuers and third party administrators (TPAs) in the state of New Hampshire, as well as Medicaid and the federal and state high risk pools. This enrollment data are summarized in Table 3.1.1 below.
Page 6
Wakely Consulting Group
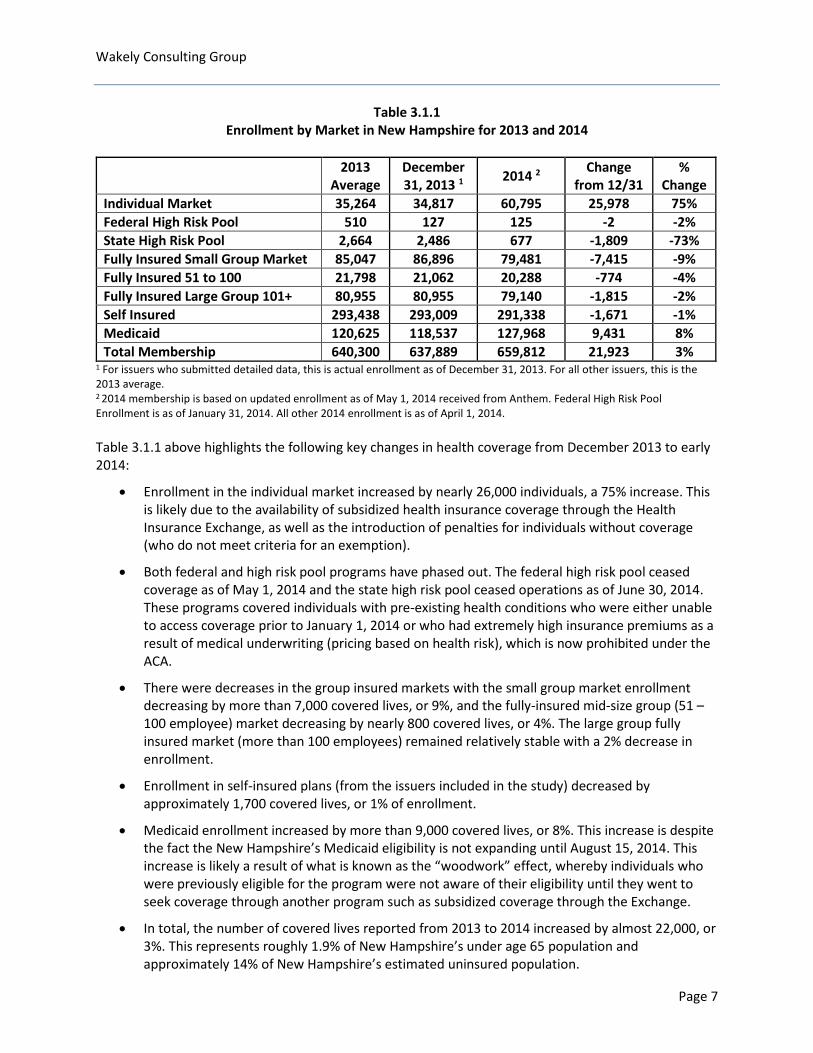
Table 3.1.1 Enrollment by Market in New Hampshire for 2013 and 2014
2013 Average
December 31, 2013 1 2014 2 Change
from 12/31 %
Change Individual Market 35,264 34,817 60,795 25,978 75% Federal High Risk Pool 510 127 125 -2 -2% State High Risk Pool 2,664 2,486 677 -1,809 -73% Fully Insured Small Group Market 85,047 86,896 79,481 -7,415 -9% Fully Insured 51 to 100 21,798 21,062 20,288 -774 -4% Fully Insured Large Group 101+ 80,955 80,955 79,140 -1,815 -2% Self Insured 293,438 293,009 291,338 -1,671 -1% Medicaid 120,625 118,537 127,968 9,431 8% Total Membership 640,300 637,889 659,812 21,923 3%
1 For issuers who submitted detailed data, this is actual enrollment as of December 31, 2013. For all other issuers, this is the 2013 average. 2 2014 membership is based on updated enrollment as of May 1, 2014 received from Anthem. Federal High Risk Pool Enrollment is as of January 31, 2014. All other 2014 enrollment is as of April 1, 2014. Table 3.1.1 above highlights the following key changes in health coverage from December 2013 to early 2014:
• Enrollment in the individual market increased by nearly 26,000 individuals, a 75% increase. This is likely due to the availability of subsidized health insurance coverage through the Health Insurance Exchange, as well as the introduction of penalties for individuals without coverage (who do not meet criteria for an exemption).
• Both federal and high risk pool programs have phased out. The federal high risk pool ceased coverage as of May 1, 2014 and the state high risk pool ceased operations as of June 30, 2014. These programs covered individuals with pre-existing health conditions who were either unable to access coverage prior to January 1, 2014 or who had extremely high insurance premiums as a result of medical underwriting (pricing based on health risk), which is now prohibited under the ACA.
• There were decreases in the group insured markets with the small group market enrollment decreasing by more than 7,000 covered lives, or 9%, and the fully-insured mid-size group (51 – 100 employee) market decreasing by nearly 800 covered lives, or 4%. The large group fully insured market (more than 100 employees) remained relatively stable with a 2% decrease in enrollment.
• Enrollment in self-insured plans (from the issuers included in the study) decreased by approximately 1,700 covered lives, or 1% of enrollment.
• Medicaid enrollment increased by more than 9,000 covered lives, or 8%. This increase is despite the fact the New Hampshire’s Medicaid eligibility is not expanding until August 15, 2014. This increase is likely a result of what is known as the “woodwork” effect, whereby individuals who were previously eligible for the program were not aware of their eligibility until they went to seek coverage through another program such as subsidized coverage through the Exchange.
• In total, the number of covered lives reported from 2013 to 2014 increased by almost 22,000, or 3%. This represents roughly 1.9% of New Hampshire’s under age 65 population and approximately 14% of New Hampshire’s estimated uninsured population.
Page 7
Wakely Consulting Group 4. INDIVIDUAL MARKET ANALYSIS The ACA had the greatest impact on the individual health insurance market in New Hampshire. The most significant changes to the individual market between 2013 and 2014 are described below:
• Prior to 2014, insurers were allowed to deny coverage or charge higher rates to individuals with health conditions. This practice is no longer allowed by the Affordable Care Act.
• The ACA limits the extent to which insurers can charge higher premiums for older enrollees to no more than three times that of younger adults.
• The ACA provides subsidized coverage to low and middle-income individuals and families who do not have access to employer coverage or another government program such as Medicare or Medicaid.
• The ACA requires that a minimum set of benefits are covered by insurers in the individual market, including hospitalization, doctor’s visits, maternity, prescription drugs, and other common services that were regularly covered in group plans, but not always covered by plans in the individual market.
• The ACA introduces penalties for individuals who do not have insurance. This is intended to encourage healthier individuals to purchase insurance and improve the risk pool.
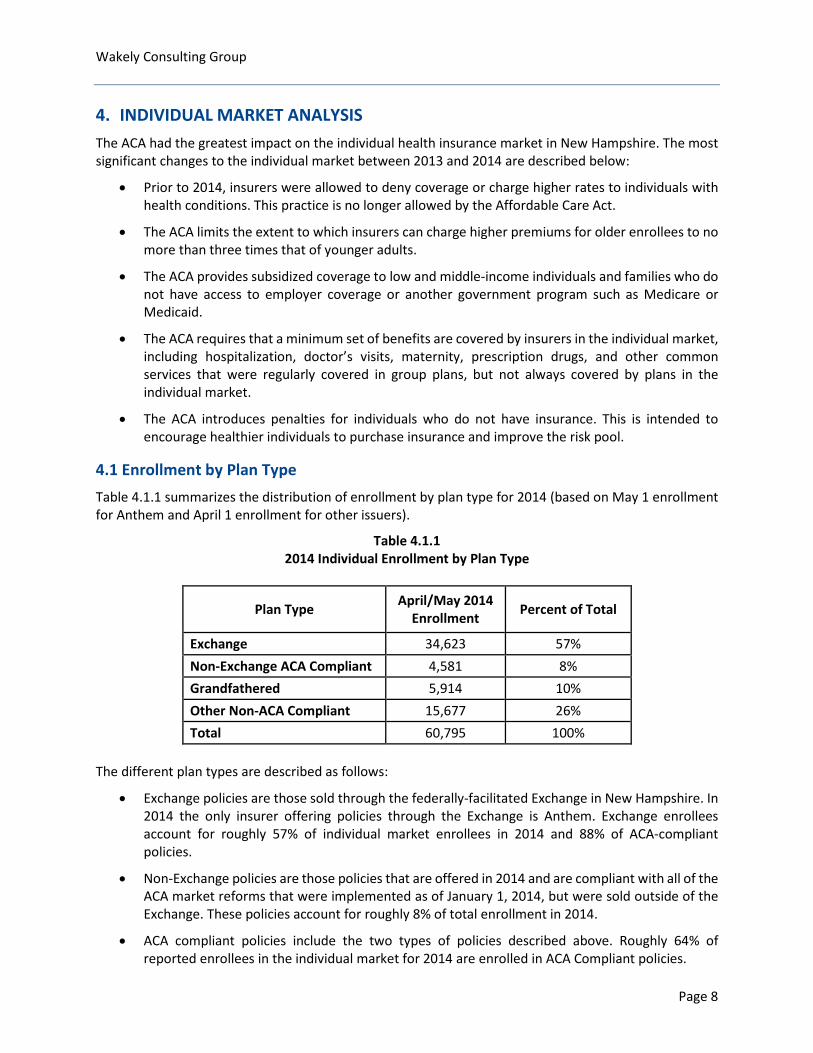
4.1 Enrollment by Plan Type Table 4.1.1 summarizes the distribution of enrollment by plan type for 2014 (based on May 1 enrollment for Anthem and April 1 enrollment for other issuers).
Table 4.1.1 2014 Individual Enrollment by Plan Type
Plan Type April/May 2014 Enrollment Percent of Total
Exchange 34,623 57% Non-Exchange ACA Compliant 4,581 8% Grandfathered 5,914 10% Other Non-ACA Compliant 15,677 26% Total 60,795 100%
The different plan types are described as follows:
• Exchange policies are those sold through the federally-facilitated Exchange in New Hampshire. In 2014 the only insurer offering policies through the Exchange is Anthem. Exchange enrollees account for roughly 57% of individual market enrollees in 2014 and 88% of ACA-compliant policies.
• Non-Exchange policies are those policies that are offered in 2014 and are compliant with all of the ACA market reforms that were implemented as of January 1, 2014, but were sold outside of the Exchange. These policies account for roughly 8% of total enrollment in 2014.
• ACA compliant policies include the two types of policies described above. Roughly 64% of reported enrollees in the individual market for 2014 are enrolled in ACA Compliant policies.
Page 8
Wakely Consulting Group
• Grandfathered policies are those policies that were in place prior to the passage of the ACA in 2010 that were allowed to continue without being required to comply with all of the requirements of the ACA. Roughly 10% of individual market enrollees were reported to be enrolled in Grandfathered plans in 2014.
• Other Non-ACA Compliant policies are those that either have a plan year that began in 2013 and runs past April/May 2014 or that were allowed to continue without complying with all of the 2014 ACA market reforms as a result of a transitional policy that was implemented in November 2013 and extended in March 2014. This policy allowed some individuals/groups to continue in their 2013 plans into 2016 if allowed by the state and issuer. New Hampshire is allowing these continued policies. Other non-ACA compliant plans account for 26% of enrollment in the individual market as of the spring of 2014.
It is important to note that the Exchange enrollment of 34,623 which was reported by Anthem as of May 1, 2014 is less than the 40,262 reported in the May 1, 2014 report released by the U.S. Department of Health and Human Services Office of The Assistant Secretary for Planning and Evaluation (ASPE).ii The ASPE report provides enrollments through the end of the open enrollment and special enrollment periods (April 19, 2014) and indicates that the number reported includes individuals who have paid a premium as well as those who had not paid a premium. The ASPE report indicates that roughly 80 to 90 percent of the individuals reported were expected to pay the premium to effectuate their enrollments. The enrollments reported by Anthem as of May 1, 2014 are roughly 86% of the number reported by ASPE, consistent with the range of individuals expected to effectuate their coverage.
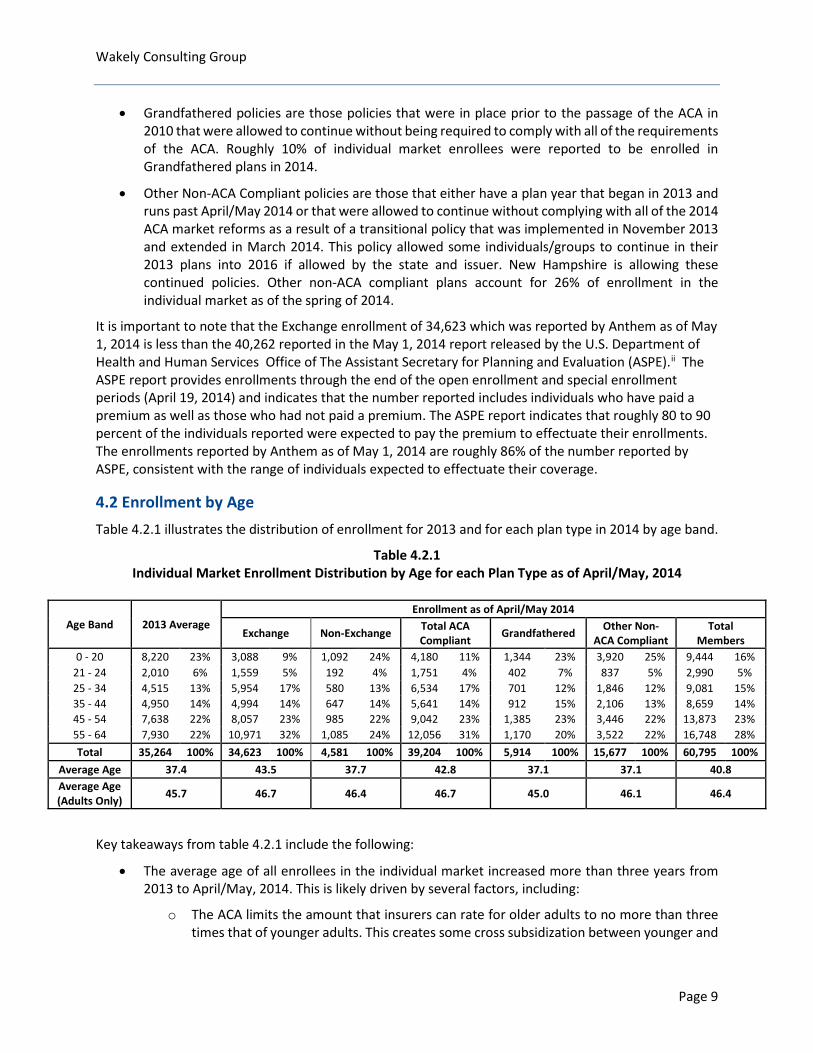
4.2 Enrollment by Age Table 4.2.1 illustrates the distribution of enrollment for 2013 and for each plan type in 2014 by age band.
Table 4.2.1 Individual Market Enrollment Distribution by Age for each Plan Type as of April/May, 2014
Age Band 2013 Average Enrollment as of April/May 2014
Exchange Non-Exchange Total ACA Compliant Grandfathered Other Non-
ACA Compliant Total
Members 0 - 20 8,220 23% 3,088 9% 1,092 24% 4,180 11% 1,344 23% 3,920 25% 9,444 16%
21 - 24 2,010 6% 1,559 5% 192 4% 1,751 4% 402 7% 837 5% 2,990 5% 25 - 34 4,515 13% 5,954 17% 580 13% 6,534 17% 701 12% 1,846 12% 9,081 15% 35 - 44 4,950 14% 4,994 14% 647 14% 5,641 14% 912 15% 2,106 13% 8,659 14% 45 - 54 7,638 22% 8,057 23% 985 22% 9,042 23% 1,385 23% 3,446 22% 13,873 23% 55 - 64 7,930 22% 10,971 32% 1,085 24% 12,056 31% 1,170 20% 3,522 22% 16,748 28% Total 35,264 100% 34,623 100% 4,581 100% 39,204 100% 5,914 100% 15,677 100% 60,795 100%
Average Age 37.4 43.5 37.7 42.8 37.1 37.1 40.8 Average Age (Adults Only) 45.7 46.7 46.4 46.7 45.0 46.1 46.4
Key takeaways from table 4.2.1 include the following:
• The average age of all enrollees in the individual market increased more than three years from 2013 to April/May, 2014. This is likely driven by several factors, including:
o The ACA limits the amount that insurers can rate for older adults to no more than three times that of younger adults. This creates some cross subsidization between younger and
Page 9
Wakely Consulting Group
older adults which makes the rates more attractive to older adults compared to pre-ACA rates.
o Premium subsidies that are available to eligible individuals and families who purchase coverage through the Exchange are based on income, so when comparing two individuals with the same income but different ages, the older individual will receive a higher subsidy for coverage, because the premium is higher.
o Older individuals tend to have more health needs than younger individuals and may place more value on having insurance. The small amount of the penalty for not having coverage in 2014 may not have provided enough incentive for younger individuals to enroll.
• Exchange enrollees are significantly older on average than enrollees in the individual market in 2014. This is likely due to the subsidy dynamics and other factors described above. Additionally, the proportion of children enrolled in the Exchange is significantly lower than child enrollment in other plan types. This may be a result of the fact that New Hampshire’s Children’s Health Insurance Plan (CHIP) covers children up to 323% of the federal poverty level (FPL), and children eligible for CHIP are not eligible for subsidized coverage through the Exchange. The average age of adults is only slightly higher for Exchange enrollees compared to other plan types.
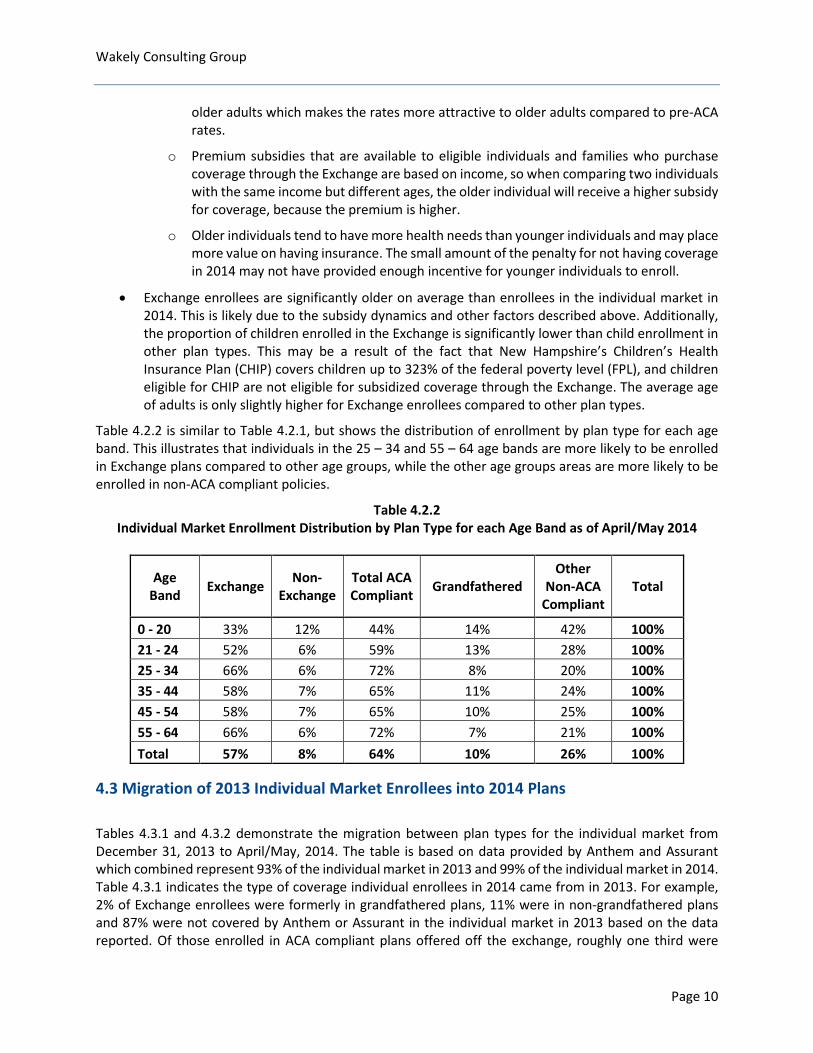
Table 4.2.2 is similar to Table 4.2.1, but shows the distribution of enrollment by plan type for each age band. This illustrates that individuals in the 25 – 34 and 55 – 64 age bands are more likely to be enrolled in Exchange plans compared to other age groups, while the other age groups areas are more likely to be enrolled in non-ACA compliant policies.
Table 4.2.2 Individual Market Enrollment Distribution by Plan Type for each Age Band as of April/May 2014
Age Band Exchange Non-
Exchange Total ACA Compliant Grandfathered
Other Non-ACA
Compliant Total
0 - 20 33% 12% 44% 14% 42% 100% 21 - 24 52% 6% 59% 13% 28% 100% 25 - 34 66% 6% 72% 8% 20% 100% 35 - 44 58% 7% 65% 11% 24% 100% 45 - 54 58% 7% 65% 10% 25% 100% 55 - 64 66% 6% 72% 7% 21% 100% Total 57% 8% 64% 10% 26% 100%
4.3 Migration of 2013 Individual Market Enrollees into 2014 Plans Tables 4.3.1 and 4.3.2 demonstrate the migration between plan types for the individual market from December 31, 2013 to April/May, 2014. The table is based on data provided by Anthem and Assurant which combined represent 93% of the individual market in 2013 and 99% of the individual market in 2014. Table 4.3.1 indicates the type of coverage individual enrollees in 2014 came from in 2013. For example, 2% of Exchange enrollees were formerly in grandfathered plans, 11% were in non-grandfathered plans and 87% were not covered by Anthem or Assurant in the individual market in 2013 based on the data reported. Of those enrolled in ACA compliant plans offered off the exchange, roughly one third were
Page 10
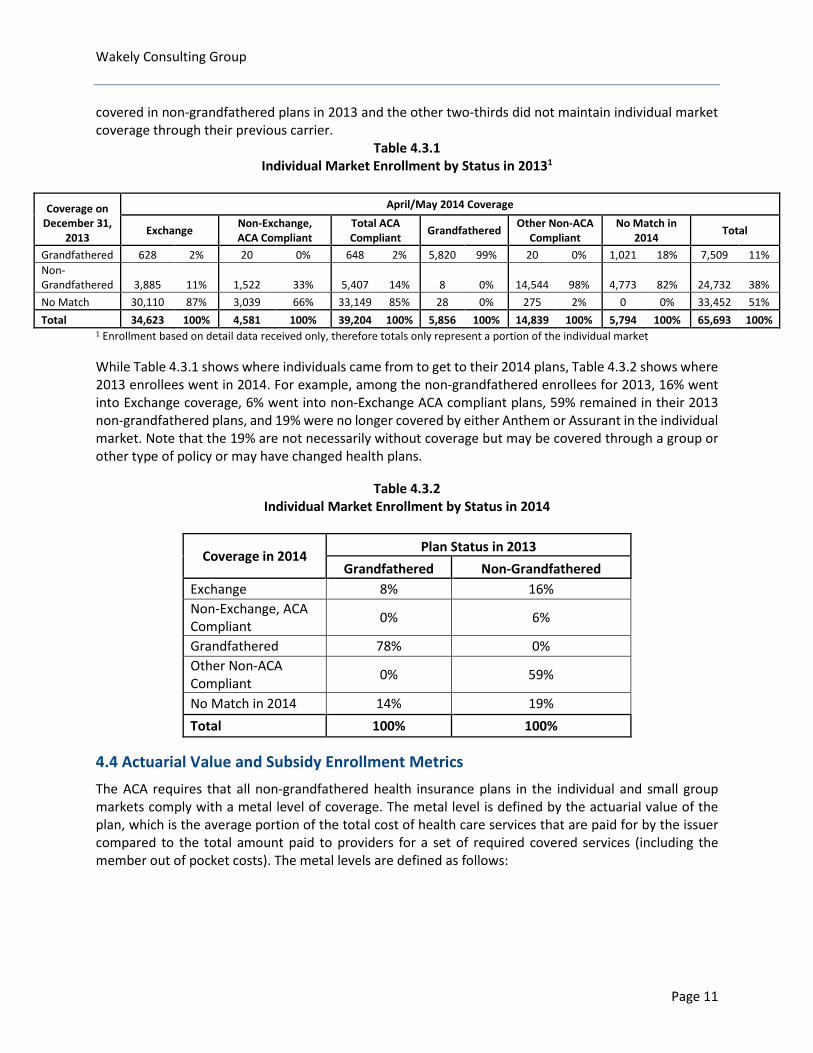
Wakely Consulting Group covered in non-grandfathered plans in 2013 and the other two-thirds did not maintain individual market coverage through their previous carrier.
Table 4.3.1 Individual Market Enrollment by Status in 20131
Coverage on December 31,
2013
April/May 2014 Coverage
Exchange Non-Exchange, ACA Compliant
Total ACA Compliant Grandfathered Other Non-ACA
Compliant No Match in
2014 Total
Grandfathered 628 2% 20 0% 648 2% 5,820 99% 20 0% 1,021 18% 7,509 11% Non-Grandfathered 3,885 11% 1,522 33% 5,407 14% 8 0% 14,544 98% 4,773 82% 24,732 38% No Match 30,110 87% 3,039 66% 33,149 85% 28 0% 275 2% 0 0% 33,452 51% Total 34,623 100% 4,581 100% 39,204 100% 5,856 100% 14,839 100% 5,794 100% 65,693 100%
1 Enrollment based on detail data received only, therefore totals only represent a portion of the individual market While Table 4.3.1 shows where individuals came from to get to their 2014 plans, Table 4.3.2 shows where 2013 enrollees went in 2014. For example, among the non-grandfathered enrollees for 2013, 16% went into Exchange coverage, 6% went into non-Exchange ACA compliant plans, 59% remained in their 2013 non-grandfathered plans, and 19% were no longer covered by either Anthem or Assurant in the individual market. Note that the 19% are not necessarily without coverage but may be covered through a group or other type of policy or may have changed health plans.
Table 4.3.2 Individual Market Enrollment by Status in 2014
Coverage in 2014 Plan Status in 2013
Grandfathered Non-Grandfathered Exchange 8% 16% Non-Exchange, ACA Compliant 0% 6%
Grandfathered 78% 0% Other Non-ACA Compliant 0% 59%
No Match in 2014 14% 19% Total 100% 100%
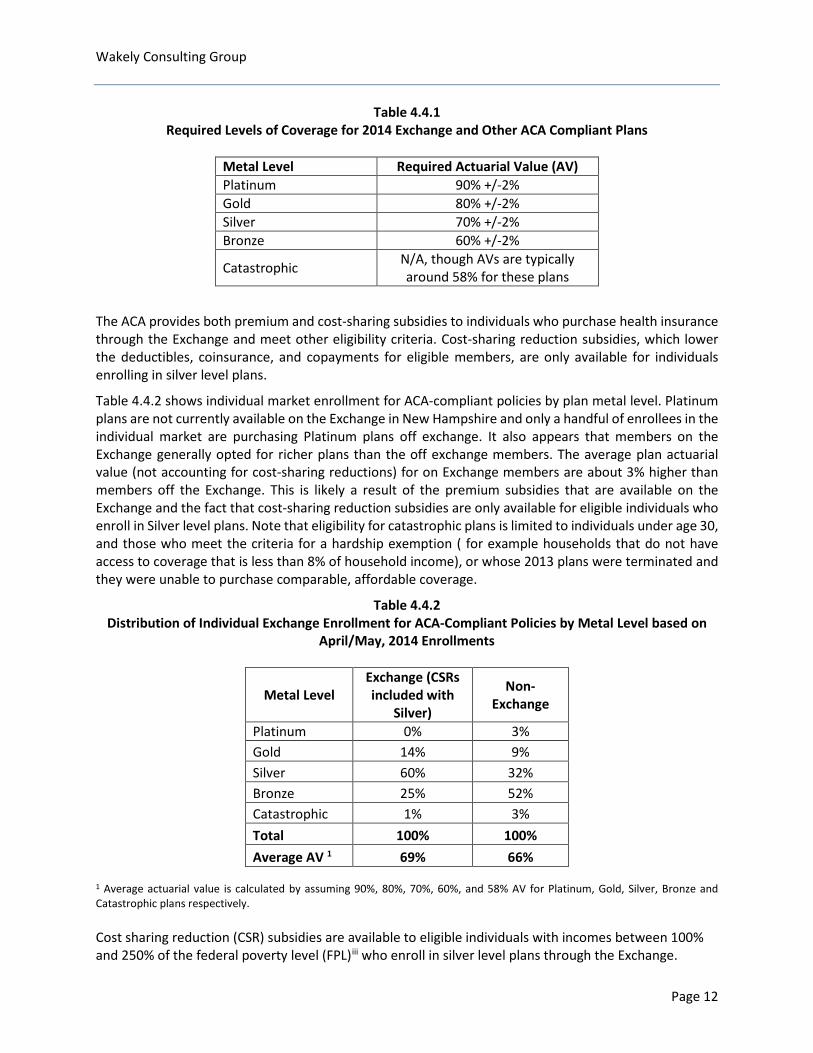
4.4 Actuarial Value and Subsidy Enrollment Metrics The ACA requires that all non-grandfathered health insurance plans in the individual and small group markets comply with a metal level of coverage. The metal level is defined by the actuarial value of the plan, which is the average portion of the total cost of health care services that are paid for by the issuer compared to the total amount paid to providers for a set of required covered services (including the member out of pocket costs). The metal levels are defined as follows:
Page 11
Wakely Consulting Group
Table 4.4.1 Required Levels of Coverage for 2014 Exchange and Other ACA Compliant Plans
Metal Level Required Actuarial Value (AV) Platinum 90% +/-2% Gold 80% +/-2% Silver 70% +/-2% Bronze 60% +/-2%
Catastrophic N/A, though AVs are typically around 58% for these plans
The ACA provides both premium and cost-sharing subsidies to individuals who purchase health insurance through the Exchange and meet other eligibility criteria. Cost-sharing reduction subsidies, which lower the deductibles, coinsurance, and copayments for eligible members, are only available for individuals enrolling in silver level plans.
Table 4.4.2 shows individual market enrollment for ACA-compliant policies by plan metal level. Platinum plans are not currently available on the Exchange in New Hampshire and only a handful of enrollees in the individual market are purchasing Platinum plans off exchange. It also appears that members on the Exchange generally opted for richer plans than the off exchange members. The average plan actuarial value (not accounting for cost-sharing reductions) for on Exchange members are about 3% higher than members off the Exchange. This is likely a result of the premium subsidies that are available on the Exchange and the fact that cost-sharing reduction subsidies are only available for eligible individuals who enroll in Silver level plans. Note that eligibility for catastrophic plans is limited to individuals under age 30, and those who meet the criteria for a hardship exemption ( for example households that do not have access to coverage that is less than 8% of household income), or whose 2013 plans were terminated and they were unable to purchase comparable, affordable coverage.
Table 4.4.2 Distribution of Individual Exchange Enrollment for ACA-Compliant Policies by Metal Level based on
April/May, 2014 Enrollments
Metal Level Exchange (CSRs included with
Silver)
Non-Exchange
Platinum 0% 3% Gold 14% 9% Silver 60% 32% Bronze 25% 52% Catastrophic 1% 3% Total 100% 100% Average AV 1 69% 66%
1 Average actuarial value is calculated by assuming 90%, 80%, 70%, 60%, and 58% AV for Platinum, Gold, Silver, Bronze and Catastrophic plans respectively. Cost sharing reduction (CSR) subsidies are available to eligible individuals with incomes between 100% and 250% of the federal poverty level (FPL)iii who enroll in silver level plans through the Exchange.
Page 12
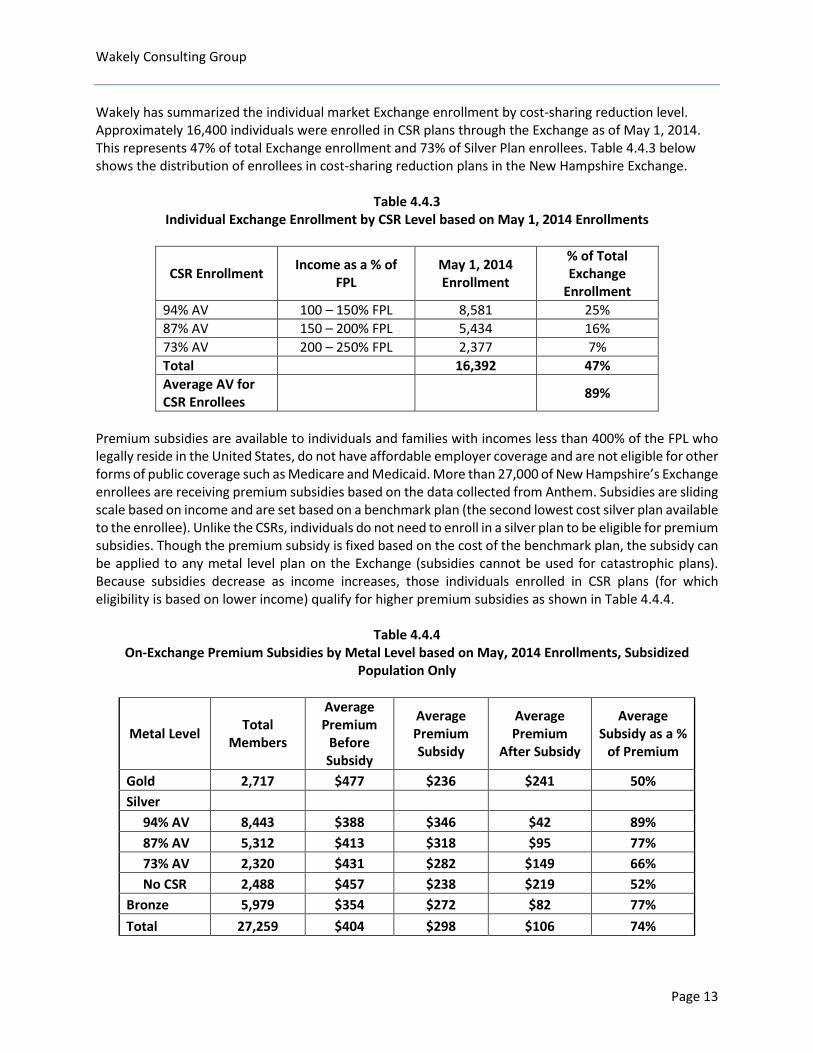
Wakely Consulting Group Wakely has summarized the individual market Exchange enrollment by cost-sharing reduction level. Approximately 16,400 individuals were enrolled in CSR plans through the Exchange as of May 1, 2014. This represents 47% of total Exchange enrollment and 73% of Silver Plan enrollees. Table 4.4.3 below shows the distribution of enrollees in cost-sharing reduction plans in the New Hampshire Exchange.
Table 4.4.3 Individual Exchange Enrollment by CSR Level based on May 1, 2014 Enrollments
CSR Enrollment Income as a % of FPL
May 1, 2014 Enrollment
% of Total Exchange
Enrollment 94% AV 100 – 150% FPL 8,581 25% 87% AV 150 – 200% FPL 5,434 16% 73% AV 200 – 250% FPL 2,377 7% Total 16,392 47% Average AV for CSR Enrollees 89%
Premium subsidies are available to individuals and families with incomes less than 400% of the FPL who legally reside in the United States, do not have affordable employer coverage and are not eligible for other forms of public coverage such as Medicare and Medicaid. More than 27,000 of New Hampshire’s Exchange enrollees are receiving premium subsidies based on the data collected from Anthem. Subsidies are sliding scale based on income and are set based on a benchmark plan (the second lowest cost silver plan available to the enrollee). Unlike the CSRs, individuals do not need to enroll in a silver plan to be eligible for premium subsidies. Though the premium subsidy is fixed based on the cost of the benchmark plan, the subsidy can be applied to any metal level plan on the Exchange (subsidies cannot be used for catastrophic plans). Because subsidies decrease as income increases, those individuals enrolled in CSR plans (for which eligibility is based on lower income) qualify for higher premium subsidies as shown in Table 4.4.4.
Table 4.4.4
On-Exchange Premium Subsidies by Metal Level based on May, 2014 Enrollments, Subsidized Population Only
Metal Level Total Members
Average Premium
Before Subsidy
Average Premium Subsidy
Average Premium
After Subsidy
Average Subsidy as a %
of Premium
Gold 2,717 $477 $236 $241 50% Silver 94% AV 8,443 $388 $346 $42 89% 87% AV 5,312 $413 $318 $95 77% 73% AV 2,320 $431 $282 $149 66% No CSR 2,488 $457 $238 $219 52% Bronze 5,979 $354 $272 $82 77% Total 27,259 $404 $298 $106 74%
Page 13
Wakely Consulting Group 4.5 Actual Compared to Expected Enrollment The Gorman model (as communicated in their report dated September 2012) estimated a total of 50,170 enrollees in the New Hampshire individual market in 2014. However, their underlying assumptions were not consistent with the 2014 ACA regulatory environment in New Hampshire. Wakely made the following changes to the Gorman model to better estimate the expected enrollment in individual market as of 2014 using other underlying assumptions consistent with the baseline Gorman model:
• Updating the model’s assumption to reflect that there was no Medicaid expansion in the state of New Hampshire as of January 1, 2014 (New Hampshire’s Medicaid program is expanding on August 15, 2014).
• Redefining small group as groups with 2-50 members. The Gorman model had previously assumed that small groups of 1 (sole proprietors) would be allowed to stay in the small group market.
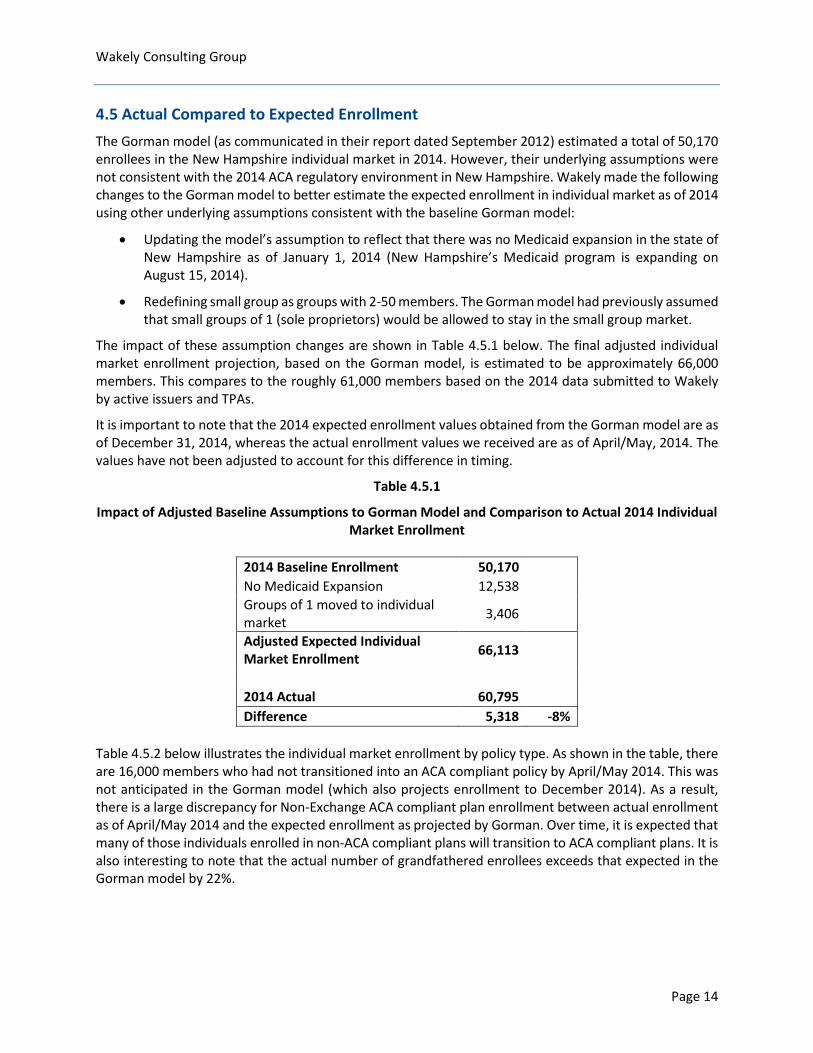
The impact of these assumption changes are shown in Table 4.5.1 below. The final adjusted individual market enrollment projection, based on the Gorman model, is estimated to be approximately 66,000 members. This compares to the roughly 61,000 members based on the 2014 data submitted to Wakely by active issuers and TPAs.
It is important to note that the 2014 expected enrollment values obtained from the Gorman model are as of December 31, 2014, whereas the actual enrollment values we received are as of April/May, 2014. The values have not been adjusted to account for this difference in timing.
Table 4.5.1
Impact of Adjusted Baseline Assumptions to Gorman Model and Comparison to Actual 2014 Individual Market Enrollment
2014 Baseline Enrollment 50,170 No Medicaid Expansion 12,538 Groups of 1 moved to individual market 3,406
Adjusted Expected Individual Market Enrollment 66,113
2014 Actual 60,795 Difference 5,318 -8%
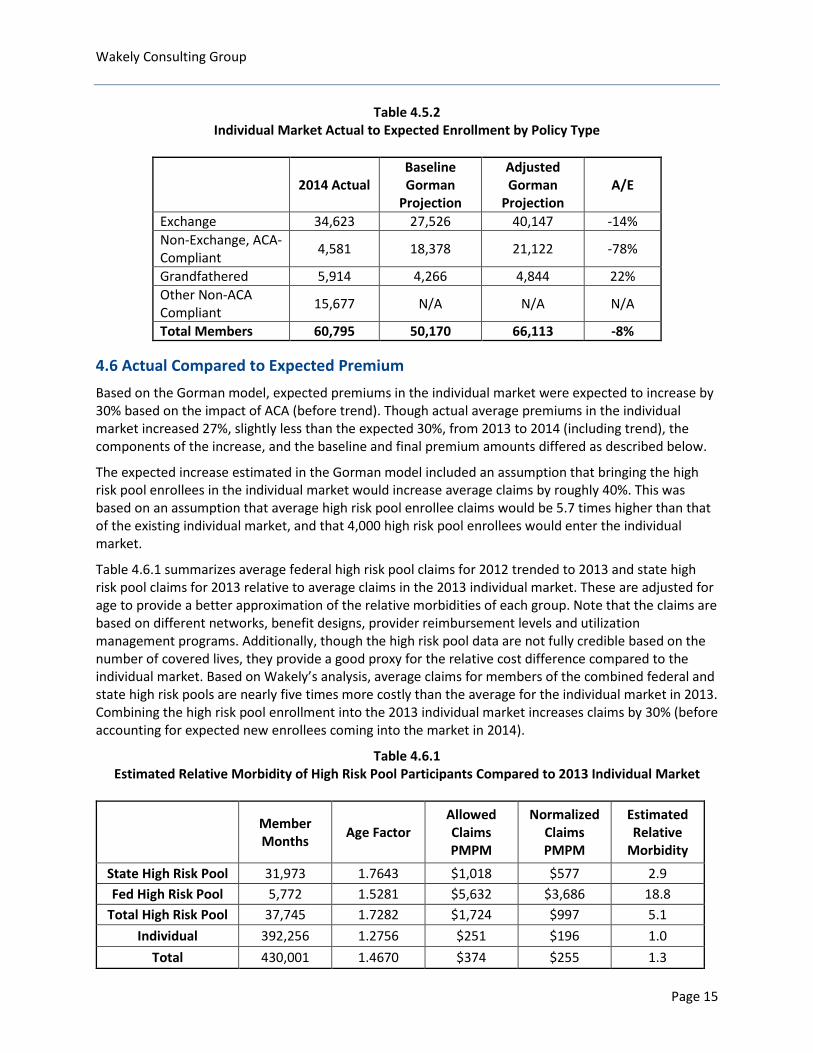
Table 4.5.2 below illustrates the individual market enrollment by policy type. As shown in the table, there are 16,000 members who had not transitioned into an ACA compliant policy by April/May 2014. This was not anticipated in the Gorman model (which also projects enrollment to December 2014). As a result, there is a large discrepancy for Non-Exchange ACA compliant plan enrollment between actual enrollment as of April/May 2014 and the expected enrollment as projected by Gorman. Over time, it is expected that many of those individuals enrolled in non-ACA compliant plans will transition to ACA compliant plans. It is also interesting to note that the actual number of grandfathered enrollees exceeds that expected in the Gorman model by 22%.
Page 14
Wakely Consulting Group
Table 4.5.2 Individual Market Actual to Expected Enrollment by Policy Type
2014 Actual Baseline Gorman
Projection
Adjusted Gorman
Projection A/E
Exchange 34,623 27,526 40,147 -14% Non-Exchange, ACA-Compliant 4,581 18,378 21,122 -78%
Grandfathered 5,914 4,266 4,844 22% Other Non-ACA Compliant 15,677 N/A N/A N/A
Total Members 60,795 50,170 66,113 -8%
4.6 Actual Compared to Expected Premium Based on the Gorman model, expected premiums in the individual market were expected to increase by 30% based on the impact of ACA (before trend). Though actual average premiums in the individual market increased 27%, slightly less than the expected 30%, from 2013 to 2014 (including trend), the components of the increase, and the baseline and final premium amounts differed as described below.
The expected increase estimated in the Gorman model included an assumption that bringing the high risk pool enrollees in the individual market would increase average claims by roughly 40%. This was based on an assumption that average high risk pool enrollee claims would be 5.7 times higher than that of the existing individual market, and that 4,000 high risk pool enrollees would enter the individual market.
Table 4.6.1 summarizes average federal high risk pool claims for 2012 trended to 2013 and state high risk pool claims for 2013 relative to average claims in the 2013 individual market. These are adjusted for age to provide a better approximation of the relative morbidities of each group. Note that the claims are based on different networks, benefit designs, provider reimbursement levels and utilization management programs. Additionally, though the high risk pool data are not fully credible based on the number of covered lives, they provide a good proxy for the relative cost difference compared to the individual market. Based on Wakely’s analysis, average claims for members of the combined federal and state high risk pools are nearly five times more costly than the average for the individual market in 2013. Combining the high risk pool enrollment into the 2013 individual market increases claims by 30% (before accounting for expected new enrollees coming into the market in 2014).
Table 4.6.1 Estimated Relative Morbidity of High Risk Pool Participants Compared to 2013 Individual Market
Member Months Age Factor
Allowed Claims PMPM
Normalized Claims PMPM
Estimated Relative
Morbidity
State High Risk Pool 31,973 1.7643 $1,018 $577 2.9 Fed High Risk Pool 5,772 1.5281 $5,632 $3,686 18.8
Total High Risk Pool 37,745 1.7282 $1,724 $997 5.1 Individual 392,256 1.2756 $251 $196 1.0
Total 430,001 1.4670 $374 $255 1.3
Page 15
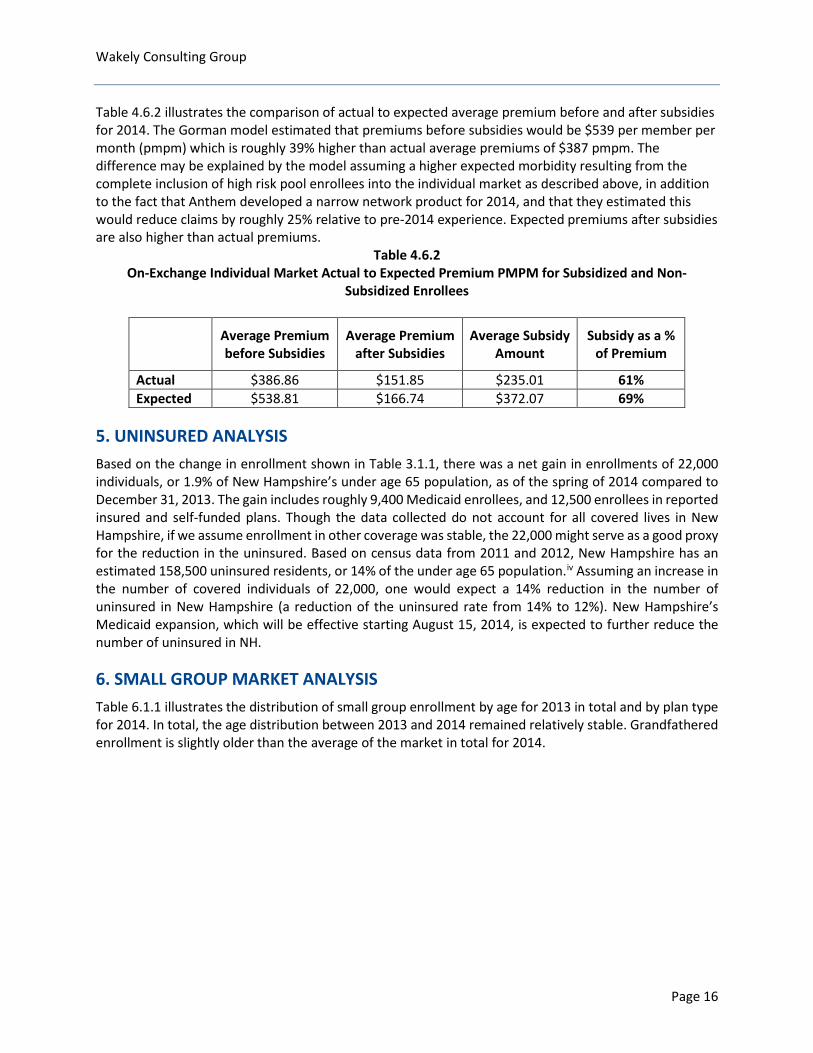
Wakely Consulting Group Table 4.6.2 illustrates the comparison of actual to expected average premium before and after subsidies for 2014. The Gorman model estimated that premiums before subsidies would be $539 per member per month (pmpm) which is roughly 39% higher than actual average premiums of $387 pmpm. The difference may be explained by the model assuming a higher expected morbidity resulting from the complete inclusion of high risk pool enrollees into the individual market as described above, in addition to the fact that Anthem developed a narrow network product for 2014, and that they estimated this would reduce claims by roughly 25% relative to pre-2014 experience. Expected premiums after subsidies are also higher than actual premiums.
Table 4.6.2 On-Exchange Individual Market Actual to Expected Premium PMPM for Subsidized and Non-
Subsidized Enrollees
Average Premium before Subsidies
Average Premium after Subsidies
Average Subsidy Amount
Subsidy as a % of Premium
Actual $386.86 $151.85 $235.01 61% Expected $538.81 $166.74 $372.07 69%
5. UNINSURED ANALYSIS Based on the change in enrollment shown in Table 3.1.1, there was a net gain in enrollments of 22,000 individuals, or 1.9% of New Hampshire’s under age 65 population, as of the spring of 2014 compared to December 31, 2013. The gain includes roughly 9,400 Medicaid enrollees, and 12,500 enrollees in reported insured and self-funded plans. Though the data collected do not account for all covered lives in New Hampshire, if we assume enrollment in other coverage was stable, the 22,000 might serve as a good proxy for the reduction in the uninsured. Based on census data from 2011 and 2012, New Hampshire has an estimated 158,500 uninsured residents, or 14% of the under age 65 population.iv Assuming an increase in the number of covered individuals of 22,000, one would expect a 14% reduction in the number of uninsured in New Hampshire (a reduction of the uninsured rate from 14% to 12%). New Hampshire’s Medicaid expansion, which will be effective starting August 15, 2014, is expected to further reduce the number of uninsured in NH.
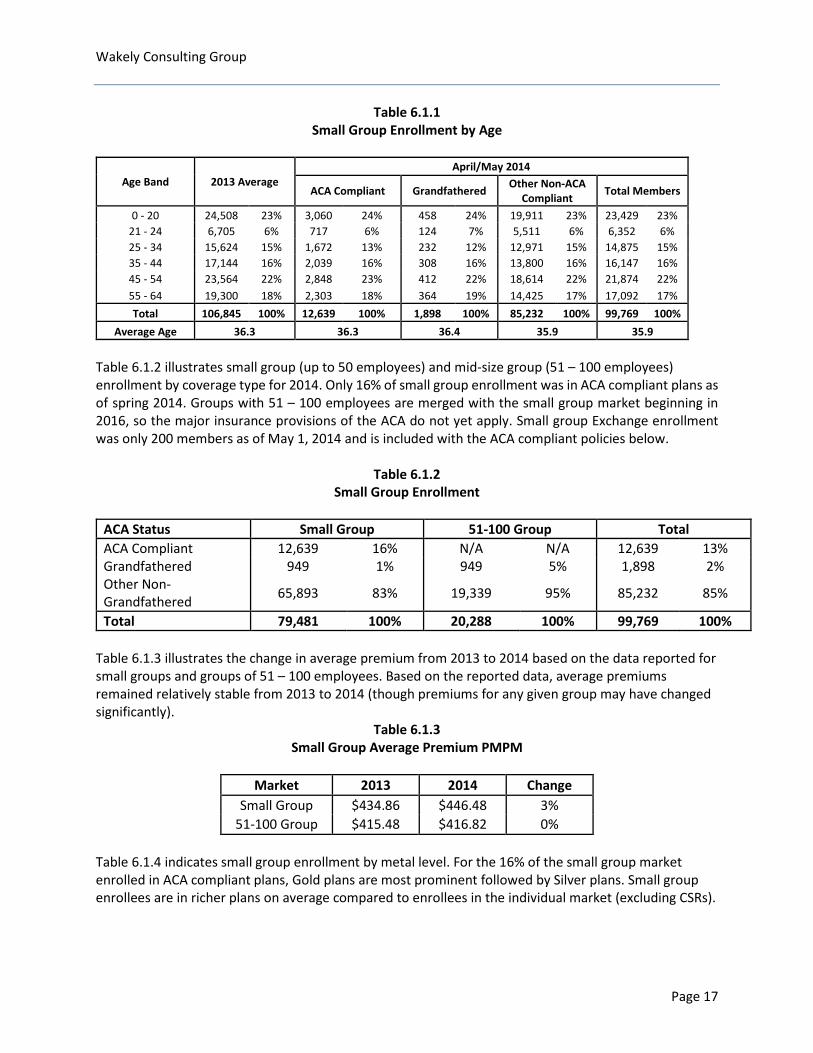
6. SMALL GROUP MARKET ANALYSIS Table 6.1.1 illustrates the distribution of small group enrollment by age for 2013 in total and by plan type for 2014. In total, the age distribution between 2013 and 2014 remained relatively stable. Grandfathered enrollment is slightly older than the average of the market in total for 2014.
Page 16
Wakely Consulting Group
Table 6.1.1 Small Group Enrollment by Age
Age Band 2013 Average April/May 2014
ACA Compliant Grandfathered Other Non-ACA Compliant Total Members
0 - 20 24,508 23% 3,060 24% 458 24% 19,911 23% 23,429 23% 21 - 24 6,705 6% 717 6% 124 7% 5,511 6% 6,352 6% 25 - 34 15,624 15% 1,672 13% 232 12% 12,971 15% 14,875 15% 35 - 44 17,144 16% 2,039 16% 308 16% 13,800 16% 16,147 16% 45 - 54 23,564 22% 2,848 23% 412 22% 18,614 22% 21,874 22% 55 - 64 19,300 18% 2,303 18% 364 19% 14,425 17% 17,092 17% Total 106,845 100% 12,639 100% 1,898 100% 85,232 100% 99,769 100%
Average Age 36.3 36.3 36.4 35.9 35.9 Table 6.1.2 illustrates small group (up to 50 employees) and mid-size group (51 – 100 employees) enrollment by coverage type for 2014. Only 16% of small group enrollment was in ACA compliant plans as of spring 2014. Groups with 51 – 100 employees are merged with the small group market beginning in 2016, so the major insurance provisions of the ACA do not yet apply. Small group Exchange enrollment was only 200 members as of May 1, 2014 and is included with the ACA compliant policies below.
Table 6.1.2 Small Group Enrollment
ACA Status Small Group 51-100 Group Total ACA Compliant 12,639 16% N/A N/A 12,639 13% Grandfathered 949 1% 949 5% 1,898 2% Other Non-Grandfathered 65,893 83% 19,339 95% 85,232 85%
Total 79,481 100% 20,288 100% 99,769 100%
Table 6.1.3 illustrates the change in average premium from 2013 to 2014 based on the data reported for small groups and groups of 51 – 100 employees. Based on the reported data, average premiums remained relatively stable from 2013 to 2014 (though premiums for any given group may have changed significantly).
Table 6.1.3 Small Group Average Premium PMPM
Market 2013 2014 Change
Small Group $434.86 $446.48 3% 51-100 Group $415.48 $416.82 0%
Table 6.1.4 indicates small group enrollment by metal level. For the 16% of the small group market enrolled in ACA compliant plans, Gold plans are most prominent followed by Silver plans. Small group enrollees are in richer plans on average compared to enrollees in the individual market (excluding CSRs).
Page 17

Wakely Consulting Group
Table 6.1.4 Small Group Enrollment in ACA-Compliant Plans by Metal Level Based on April/May 2014 Enrollment
Metal Level Small Group Platinum 1,126 9% Gold 6,051 48% Silver 3,973 31% Bronze 731 6% Unknown 758 6% Total 12,639 100% Average AV 76%
7. 2014 ENROLLMENT BY ISSUER
Table 7.1.1 provides a comparison of the average 2013 to 2014 enrollment by market share for each issuer by market. Key takeaways include:
• In the individual market, Anthem’s market share increased from 84% to 92% as a result of Anthem being the only participating issuer in the New Hampshire Exchange in 2014.
• Anthem and MVP both lost market share in the group markets to Harvard Pilgrim.
• Aetna increased its market share in the 51 – 100 employee group market share and CIGNA lost some of its market share in the large group (over 100 employee group) market.
Table 7.1.1 2013 vs. 2014 Enrollment by Insurer and Market (Fully Insured Only)
Issuer Aetna Anthem Assurant Celtic Chesapeake Life Cigna Harvard
Pilgrim
Health Plans,
Inc MVP Total
Individual
2013 Average
75 29,557 3,131 687 1,814 0 0 0 0 35,264 0% 84% 9% 2% 5% 0% 0% 0% 0% 100%
2014 58 55,798 4,101 260 578 0 0 0 0 60,795 0% 92% 7% 0% 1% 0% 0% 0% 0% 100%
Small Group
2013 Average
471 56,936 0 0 0 21 24,013 0 3,606 85,047 1% 67% 0% 0% 0% 0% 28% 0% 4% 100%
2014 529 51,019 0 0 0 0 26,216 0 1,717 79,481 1% 64% 0% 0% 0% 0% 33% 0% 2% 100%
51-100 Group
2013 Average
498 9,018 0 0 0 566 10,096 0 1,621 21,798 2% 41% 0% 0% 0% 3% 46% 0% 7% 100%
2014 797 8,443 0 0 0 587 9,621 0 840 20,288 4% 42% 0% 0% 0% 3% 47% 0% 4% 100%
Large Group
2013 Average
4,112 27,057 0 0 0 12,394 33,512 0 3,880 80,955 5% 33% 0% 0% 0% 15% 41% 0% 5% 100%
2014 4,337 25,188 0 0 0 10,711 37,801 0 1,103 79,140
5% 32% 0% 0% 0% 14% 48% 0% 1% 100%
Total
2013 Average
5,156 122,568 3,131 687 1,814 12,981 67,621 0 9,106 223,063 2% 55% 1% 0% 1% 6% 30% 0% 4% 100%
2014 5,721 140,448 4,101 260 578 11,298 73,638 0 3,660 239,704
2% 59% 2% 0% 0% 5% 31% 0% 2% 100%
Page 18
Wakely Consulting Group 8. CONCLUSION
As expected, the ACA market reforms had the biggest impact on the individual market. There was a significant increase in enrollment in the individual market, and a decrease in small group enrollments. Based on the data collected, there was a net gain in enrollments of more than 22,000 individuals, or 1.9% of New Hampshire’s under 65 population. While this report provides a view of preliminary enrollment following the changes implemented under the ACA, New Hampshire should continue to monitor changes in the insurance market that might result from the forthcoming Medicaid expansion, the expected increased awareness of the benefits and penalties resulting from the ACA, the expansion of the small group market in 2016 and other changes in the health insurance market.
9. ACTUARIAL CERTIFICATION
I, Julia Lerche, am a Fellow in the Society of Actuaries (FSA) and a member of the American Academy of Actuaries (MAAA). I meet the qualification standards for performing the actuarial analyses included in this report. Wakely Consulting Group, Inc. relied on information provided by NHID, active issuers and TPAs in New Hampshire and publicly available information to develop the analysis in this report. This information includes, but is not limited to the following: • Enrollment, claims and premium data as submitted by active issuers and third party administrators
• Gorman Actuarial LLC Market Study Report and Gorman New Hampshire Market Model dated September 2012
• Publicly available ASPE Issue Brief “Addendum to the Health Insurance Marketplace Summary Enrollment Report for the Initial Annual Open Enrollment Period” http://aspe.hhs.gov/health/reports/2014/MarketPlaceEnrollment/Apr2014/ib_2014Apr_enrollAddendum.pdf
• Publicly available ASPE Research Brief “Premium Affordability, Competition, and Choice in the Health Insurance Marketplace, 2014” http://aspe.hhs.gov/health/reports/2014/Premiums/2014MktPlacePremBrf.pdf
iKaiser Family Foundation State Health Facts. http://kff.org/other/state-indicator/nonelderly-0-64/, accessed 08.11.2014. ii http://aspe.hhs.gov/health/reports/2014/MarketPlaceEnrollment/Apr2014/ib_2014apr_enrollment.pdf iii The federal poverty level used for 2014 subsidy eligibility is $11,490 for a single household and $23,550 for a family of four. iv Kaiser Family Foundation State Health Facts. http://kff.org/other/state-indicator/nonelderly-0-64/, accessed 08.11.2014.
Page 19
August 29, 2014 Contact: Danielle Barrick, director of communications, (603) 271-7973, ext. 336, [email protected]
NH Insurance Department: State’s Individual Market Grew by 75 percent as Health Care Reforms Took Effect
New Report Examines Changes to Health Insurance Markets in 2014
Concord, NH – The New Hampshire Insurance Department today issued a report analyzing changes to health insurance markets in the state since most federal health care reforms took full effect on Jan. 1, 2014. The analysis, performed by Wakely Consulting Group, looks at enrollment and premium changes in New Hampshire health insurance markets between 2013 and 2014. It uses data collected from New Hampshire insurers, third-party administrators (TPAs) that administer self-funded health insurance plans for employer groups, Medicaid, and the federal and state high-risk pools. The report also contrasts current findings with projections made in 2012 for the New Hampshire Insurance Department by another actuarial consulting group, Gorman Actuarial. Wakely’s analysis indicates that the number of insured people in New Hampshire grew by 22,000 – and the state’s uninsured population was reduced by about 14 percent – between Dec. 31 and May 1. This number includes both those who signed up for health insurance coverage on New Hampshire’s federally facilitated Health Insurance Marketplace and those who signed up for coverage through Medicaid. The analysis shows that the federal Affordable Care Act (ACA) had the most significant impact on the individual market, which grew by 75 percent, or 26,000 members. On April 30, 2014, the U.S. Department of Health and Human Services reported that more than 40,000 New Hampshire residents had signed up for coverage through the Marketplace, regardless of whether premiums were paid. The data analyzed in the Wakely report, which includes only those residents who paid their premiums by May 1, indicates that 34,600 of the 60,800 enrollees in the individual market received coverage through the federally facilitated Marketplace. Some enrollees may have paid their premiums after May 1; updated enrollment numbers will be available when the U.S. Department of Health and Human Services issues its next enrollment report. “We are closely monitoring the effects of health care reform on our insurance markets,” said New Hampshire Insurance Commissioner Roger Sevigny. “As today’s report indicates, New Hampshire experienced a substantial increase in individual market coverage. We expect that growth to continue in 2015, now that four additional insurance companies have applied to offer plans through the federally facilitated Health Insurance Marketplace.” According to the analysis, overall declines were seen in the group markets, including a decrease of 11,700 individuals covered by employers of all sizes in the state. These changes include some people who shifted between different types of coverage; they do not necessarily indicate that those individuals lost coverage. The largest decline was in the small-employer market, which decreased in size by 9 percent, or 7,000 covered lives. Declines also were seen in the federal and state high-risk pools, which
provided insurance for those who had been denied coverage elsewhere or faced prohibitively high premiums because of pre-existing health problems. The high-risk pools were phased out of existence in mid-summer because federal law now mandates that an individual cannot be denied coverage when seeking commercial insurance because of pre-existing conditions. As of May 1, even before the New Hampshire Health Protection Program (the state’s Medicaid expansion) took effect, 9,000 New Hampshire residents had newly signed up for Medicaid coverage. The Wakely analysis found premium changes were consistent with earlier predictions. Premiums remained stable in the small-employer market, where the New Hampshire insurance rules prior to 2014 were similar to those imposed under the ACA. In the individual market as a whole, premium increases were lower than predicted by the 2012 modeling, possibly because of Anthem Blue Cross and Blue Shield’s use of a narrow provider network for its offerings on the Marketplace. Both the modeling and actual experience showed an increase in individual market premiums due to insuring people with substantial health-care needs, many from the state’s high-risk pool. However, for the nearly 80 percent of Marketplace purchasers who qualified for federal subsidies, the amount actually paid in premiums was substantially less, with subsidies representing an average reduction in premium of 74 percent. Some public policy changes made after the 2012 Gorman model influenced an outcome different from what Gorman predicted. For example, as of May, only about 64 percent of 2014 individual market enrollees were covered by plans that reflected all of the reforms required under the ACA for 2014 policies. A quarter of individual market members were covered by policies that, while not “grandfathered,” were temporarily allowed to be renewed. In the small-employer market, only 16 percent of members were enrolled in policies that reflected all 2014 ACA requirements. Because New Hampshire’s pre-2014 small-group standards were similar to those under the ACA, there were not significant differences between these policies and the 2014 ACA-compliant small-group policies. The 2012 Gorman projections also may be found on the Department’s website: http://www.nh.gov/insurance/reports/documents/gorman_nh_mktstdy_kf.pdf. The New Hampshire Insurance Department’s mission is to promote and protect the public good by ensuring the existence of a safe and competitive insurance marketplace through the development and enforcement of the insurance laws of the State of New Hampshire. For more information, visit www.nh.gov/insurance.
###