Embed Size (px)
Citation preview

Accepted Manuscript
Title: New constraints on the evolution of the Gibraltar Arcfrom palaeomagneticdata of the Ceuta and Beni Bouseraperidotites (Rif, northern Africa)
Author: Thomas Berndt Vicente Carlos Ruız MartınezAhmed Chalouan
PII: S0264-3707(14)00138-0DOI: http://dx.doi.org/doi:10.1016/j.jog.2014.09.014Reference: GEOD 1336
To appear in: Journal of Geodynamics
Received date: 25-2-2014Revised date: 29-9-2014Accepted date: 30-9-2014
Please cite this article as: Thomas Berndt, Vicente Carlos Ruiz Martinez,Ahmed Chalouan, New constraints on the evolution of the Gibraltar Arc frompalaeomagneticdata of the Ceuta and Beni Bousera peridotites (Rif, northern Africa),Journal of Geodynamics (2014), http://dx.doi.org/10.1016/j.jog.2014.09.014
This is a PDF file of an unedited manuscript that has been accepted for publication.As a service to our customers we are providing this early version of the manuscript.The manuscript will undergo copyediting, typesetting, and review of the resulting proofbefore it is published in its final form. Please note that during the production processerrors may be discovered which could affect the content, and all legal disclaimers thatapply to the journal pertain.

Page 1 of 37
Accep
ted
Man
uscr
ipt
Highlights: - Peridotites from Ceuta and Beni Bousera (Rif) have been demagnetized. - Ceuta peridotites show a different palaeomagnetic behaviour to Beni Bousera and Ronda. - Ceuta peridotites tilted at the time when Beni Bousera rotated anticlockwise. - Subsequently, the Ceuta peridotites rotated anticlockwise. - The block rotations may be younger than previously assumed.
Highlights (for review)

Page 2 of 37
Accep
ted
Man
uscr
ipt
New constraints on the evolution of the Gibraltar Arc from palaeomagnetic data of theCeuta and Beni Bousera peridotites (Rif, northern Africa)
Thomas Berndta,1,∗, Vicente Carlos Ruíz Martíneza, Ahmed Chalouanb
aDepartamento de Física de la Tierra, Astronomía y Astrofísica I, Facultad de Ciencias Físicas, Universidad Complutense de Madrid,Avda. Complutense, s/n, 28040, Madrid, Spain
bDépartement de Géologie, Faculté des Sciences, BP 1014, Rabat 10000, Morocco
Abstract
The Betic Cordillera and the Moroccan Rif together form one of the smallest and tightest orogenic arcs on Earth and
almost completely close the Mediterranean to the west. For the explanation of the geodynamic evolution of the mountain
belt, palaeomagnetic data that generally found clockwise block rotations in the Iberian and anticlockwise rotations in
the Moroccan part of the mountain belt, have played a key role in recent works. This palaeomagnetic study has found
new constraints on the rotations and timing of the peridotitic bodies outcropping in the key position at the westernmost
margin of the mountain belt, in Ceuta and Beni Bousera (Rif, northern Africa).
Detailed thermal demagnetization of 115 individually oriented samples from 14 sites was combined with rock magnetic
and scanning electron microscopic experiments to analyze the magnetic mineralogy responsible for the remanences and
the mechanisms and relative times of their acquisition. In Ceuta, up to three magnetic components, and in Beni Bousera,
up to two magnetic components have been found, that are all to be interpreted as chemical remanent magnetizations
(CRM). The data suggests the following succession of geodynamic events aecting the peridotites until recent times: (1)
after their exhumation and subsequent cooling about 20 Ma ago, they recorded a characteristic remanent magnetization
of both normal and reversed polarities, carried by (pseudo-)single-domain magnetite grains; (2) after their dismembering,
the Ceuta peridotites were tilted southward by 22 − 34° about a horizontal or tilted axis (up to plunge 50°) with an
azimuth of 72°− 145 and the Beni Bousera peridotites were rotated anticlockwise by 72.3 ± 12.1° about a vertical axis
and (3) both recorded another magnetic signal of normal polarity only, carried by multi-domain magnetite grains; and
nally (4) the Ceuta peridotites rotated anticlockwise by 19.7 ± 5.9° about a vertical axis.
This study provides the rst palaeomagnetic data for the Ceuta peridotites that, with their tilt and recent small net
rotation, had a distinct geodynamic evolution from the large net rotations about vertical axes in Beni Bousera and
Ronda (Betic Cordillera). Moreover, earlier palaemagnetic data for Beni Bousera is improved, as mixed polarities have
been found in the older of the remanences for the rst time, and its interpretation as a CRM changes the rotation timing
that was proposed previously. The sequence of events exposed in this work are important constraints that need to be
incorporated in any geodynamic model of the evolution of the Betic-Rifean mountain belt.
Keywords: Palaeomagnetism; Beni Bousera peridotites; Ceuta peridotites; Block rotations; Rif
∗Corresponding author. Tel.: +447930903913Email addresses: [email protected] (Thomas
Berndt), [email protected] (Vicente Carlos Ruíz Martínez),
[email protected] (Ahmed Chalouan)1Now at: Department of Earth Science and Engineering, Royal
School of Mines, Imperial College London, Prince Consort Road,
SW7 2BP, London, United Kingdom
Preprint submitted to Journal of Geodynamics September 29, 2014
*Manuscript

Page 3 of 37
Accep
ted
Man
uscr
ipt
1. Introduction1
The Betic Cordillera in southern Iberia and the Moroc-2
can Rif together form the northern and southern limbs of3
the Gibraltar Arc, an arc-shaped mountain belt closing4
almost completely the Mediterranean to the west. It is5
one of the tightest orogenic arcs worldwide, and is an ex-6
ample of two opposite processes: mountain building and7
subsequent collapse. The latter process formed the Albo-8
ran Sea in the core of the system while thrusts and folds9
propagated towards the external zones. The Gibraltar Arc10
was formed from a geodynamic process which resulted in11
the consumption of the Ligurian-Maghrebian Tethys and12
opening of the West Mediterranean Sea (Chalouan et al.,13
2008; Platt et al., 2013). This evolution started from the14
Late Eocene and lasted for about 30 million years while15
the Africa-Europe convergence was going on. In order to16
explain the evolution of the Betic-Rifean mountain belt,17
both structural analysis (e.g. Balanyá and García-Dueñas,18
1987; Frizon de Lamotte et al., 1991) and palaeomagnetic19
studies have been undertaken (e.g. Platzman, 1992; Platz-20
man et al., 1993).21
Most palaeomagnetic works (see below) indicated large22
clockwise rotations in the western part of the Betics and23
anticlockwise rotations in the the western Rif that are24
probably of early Miocene age (Fig. 1b shows some of the25
rotations found). The timing and the exact magnitude26
of the rotations, however, remains poorly constrained in27
much of the available data (see section 1.2).28
Various models have been proposed to explain the evo-29
lution of the Betic-Rif mountain belt. Amongst them are:30
Models of a collisional orogeny unrelated to any subduc-31
tion zone (e.g. Platt and Vissers, 1989); models involv-32
ing a single, NW-dipping subduction zone (e.g. Lonergan33
and White, 1997); and models involving two subductions34
zones, one Cretaceous-Eocene, E-dipping followed by an35
Oligocene-Neogene, NW-dipping subduction zone with a36
so-called Alkapeca" microplate inbetween (e.g. Andrieux37
et al., 1971; Michard et al., 2002; Chalouan and Michard,38
2004). Large block clockwise and anticlockwise rotations39
in the Betics and the Rif, respectively, favour an interpre-40
tation involving a westward slab rollback (Lonergan and41
White, 1997; Chalouan and Michard, 2004), whilst they42
do not oer an adequate explantion for deviations from43
this rotation pattern, such as the clockwise rotations in44
the Tetuan area in the Rif (Platzman et al., 1993). In45
any case, any proposed model should explain the observed46
palaeomagnetic rotations.47
In the following, we will present new palaeomagnetic48
data from the Ceuta peridotites (Sarchal clis) in the west-49
ernmost part of the Rif and for the Beni Bousera peri-50
dotites some 100 km further southeast in the Rif. The51
Ceuta peridotites have a key position just at the border52
between the Betics and the Rif and have not been studied53
palaeomagnetically before. The comparison between the54
Ceuta and the Beni Bousera peridotites facilitated the in-55
terpretation of the palaeomagnetic data from Ceuta which56
turned out to have had a more complex history than Beni57
Bousera. By using the same experimental methodology58
and putting special emphasis on the analysis of the mag-59
netic mineralogy of the two sites, parallels could be drawn60
that helped constraining the timing of acquisition of the61
NRM. Moreover, the reliability and accuracy of the palaeo-62
magnetic data of Beni Bousera that was already available63
(Saddiqi et al., 1995) could be improved by this study, in64
particular, as both normal and reversed polarity rotated65
components have been found for the rst time.66
The obtained experimental data is then used to develop67
a coherent model that explains successive tectonic stages68
of the Beni Bousera and Ceuta peridotites during the last69
20 Ma.70
1.1. Geological setting71
The Rif consists of three major domains, as indicated72
in Fig. 1a: the External Zones, the Maghrebian Flysch73
Nappes, and the Internal Zones (Chalouan and Michard,74
2004). The Internal Zones consist of three nappe com-75
2

Page 4 of 37
Accep
ted
Man
uscr
iptAlboran Sea
Betic Cordillera
Rif
Ceuta
Beni
Bousera
0 500 km
Iberia
AfricaInternal Zones
Maghrebian Flysch
External Zones
Atlantic
Ocean
(a) Geological map of the Alboran domain. After Gysi
et al. (2011).
CeutaBeni Mezala
(b) Palaeomagnetic rotations in the Betic-Rif mountain belt
after Chalouan and Michard (2004) and Feinberg et al. (1996).
Grey line indicates cross-section in Fig. 1e.
N Beni
Bousera MterFilali
Bou Ahmed
Souk-el-Had
0 5 km
BB1
BB2
BB4
BB3
BB5
BB7BB8
Ultrabasites
Kinzigites
Filali gneiss
Filali schists
Federico units
Ghomarides
(c) Geological map of Beni Bousera with sampling
sites indicated. After Saddiqi et al. (1995); Michard
et al. (1997); Chalouan and Michard (2004).
0 2 km
Ultrabasites
C. Maláguide
Gneisses
Schists
Leucogranite
Pliocene and quarternary deposits
NCeuta
El Hacho
Cala del Sarchal
(d) Geological map of Ceuta. After Sánchez-Gómez et al. (1995).
(e) Cross-section of the Beni Bousera anticline as indicated by the grey line in Fig. 1b (Chalouan and
Michard, 2004).
Figure 1: Geological setting
3

Page 5 of 37
Accep
ted
Man
uscr
ipt
plexes, at the bottom and in the SW the Dorsale Calcaire,76
then the Ghomaride nappes and at the top and in the NE,77
the Sebtide nappes (which corresponds to the Alpujarride78
nappes in the Betics). The Sebtide complex consist of a79
number of metamorphic units that are deformed by the80
Beni Bousera and the Beni Mezala antiforms (Michard81
et al., 1997). From top to bottom theses units are the82
Federico units, the Filali schists and gneisses, the Beni83
Bousera kinzigites and peridotites and nally the Sebta84
gneisses (see Fig. 1c and 1e).85
The Beni Bousera peridotites crop out 60 km SE of86
Tetouan, over an area of about 75 km2. It is an antiform87
with NW-SE oriented fold axis and the peridotites are88
mainly spinel lherzolites and harzburgites (Fig. 1e). More-89
over, minor amounts of dunite are present, and bands of90
pyroxenite constitute up to 510% of the massif (Korn-91
probst, 1969).92
In the Sarchal clis in Ceuta, peridotites crop out over93
an area of a few hectares (see Fig. 1d). It is situated be-94
tween granulitic gneisses and a pordic gneissic granitoid.95
The Ceuta peridotites form part of a more or less con-96
tinuous thin peridotitic layer that also crops out in Beni97
Bousera (Sánchez-Gómez et al., 1995).98
1.2. Former palaeomagnetic studies of the Betic-Rif99
Various palaeomagnetic studies have investigated the100
Betic-Rifean mountain chain and generally found a pattern101
of clockwise block rotations in the Betics and anticlockwise102
rotations in the Rif. Early palaeomagnetic studies involved103
mainly Jurassic and Cretaceous sedimentary rocks in the104
External Betics (Platzman, 1992; Platzman and Lowrie,105
1992; Osete et al., 1988, 1989; Allerton et al., 1993), where106
generally clockwise block rotations in the range of 40°107
70° where found, and in the Internal Rif (Platzman, 1992;108
Platzman et al., 1993), where generally anticlockwise ro-109
tations in the range of 60°100° where found. One notable110
exception were a few sites near Tetuan (Morocco), where111
Platzman et al. (1993) found signicant clockwise rota-112
tions, although the reliability of this result can be ques-113
tioned, due to its large error and/or strong tilt of the bed-114
ding. These studies interpreted the magnetic components115
they found to be primary natural remanent magnetizations116
(NRM) and hence of Mesozoic age.117
Villalaín et al. (1996), however, suggested that some118
of these components may indeed be younger remagneti-119
zations, possibly of Neogene age. Misinterpreting a re-120
magnetization as a primary NRM would not only change121
the timing constraints of these rotations, but also decrease122
(increase) the amounts of clockwise (anticlockwise) block123
rotations by as much as 35°, as the Mesozoic expected di-124
rection for stable Iberia and stable Northwest Africa was125
rotated westward compared to the Neogene expected direc-126
tion. Other studies (Villalaín et al., 1994; Saddiqi et al.,127
1995; Villalaín et al., 1996; Feinberg et al., 1996; Calvo128
et al., 2001; Villasante-Marcos et al., 2003; Mattei et al.,129
2006; Cifelli et al., 2008) found direct evidence of Neogene130
block rotations of the same pattern (clockwise in the Bet-131
ics, anticlockwise in the Rif).132
On the other hand, some studies show evidence that ro-133
tations were already completed by Neogene times, such as134
Osete et al. (2004) who found a rotated (clockwise, 35°135
140°) primary NRM on Mesozoic rocks from the Betics and136
an almost non-rotated Neogene remagnetization. Also,137
some studies on Neogene rocks (Calvo et al., 1997; Krijgs-138
man and Garces, 2004) showed no rotations. Various stud-139
ies conclude that there are no signicant block rotations140
further East of the Betic-Rifean mountain chain (Calvo141
et al., 1994, 1997; Najid et al., 1981) since the Miocene.142
1.3. Former studies of the Beni Bousera/Ronda peri-143
dotites144
1.3.1. Thermal evolution145
Various studies have investigated the exhumation of the146
Betics (for example Monié et al. (1991); Zeck et al. (1992);147
Sánchez-Rodríguez and Gebauer (2000)) and the Rif (Beni148
Bousera, for example Loomis (1975); Seidemann (1976);149
4

Page 6 of 37
Accep
ted
Man
uscr
ipt
Michard et al. (1983); Ari et al. (2011)). They all gave150
similar ages in the range 1924 Ma for the last high tem-151
perature metamorphism in the crustal rocks surrounding152
the peridotites and granitoid dykes.153
Sánchez-Rodríguez and Gebauer (2000), in particular,154
investigated zircons of eclogite-bearing magmatites over-155
lying the Ronda peridotites in southern Spain and ana-156
tectic granites crosscutting both the peridotites and the157
country rocks. They established a peak temperature of158
790 ± 15°C of high pressure/high-temperature metamor-159
phism of the country rocks that is dated at 19.9 ± 1.7Ma,160
followed by a rapid exhumation of >31 mm/y with a de-161
compression from 17±1 kbar to less than 8 kbar and then a162
rapid cooling of 200340°C/Ma. The granites crystallised163
at 18.9± 3.0Ma which represents an estimate for the time164
of emplacement of the peridotites into the middle crust.165
According to Villasante-Marcos et al. (2003, and ref-166
erences therein), the post-metamorphic cooling gave rise167
to the serpentinization and the generation of a rst pop-168
ulation of sub-microscopic magnetite, until about 17-169
18 Ma ago (rst serpentinization phase). Later, up to170
millimetre-sized magnetite grains formed, mainly along171
fractures and joints. This posterior serpentinization172
phase started with the extensional dismembering of the173
peridotite slab. For oceanic peridotites, Maone et al.174
(2014) also found a sequence of serpentinization forming175
smaller magnetite grains in the early stages, and larger176
grains along fractures at later stages.177
The thermal evolution of the Gibraltar Arc is critical178
for our paleomagnetic study, as magnetic minerals can-179
not retain any magnetization above a critical temperature180
(TC or Curie temperature; e.g., 580ºC for pure, ne mag-181
netite grains; Dunlop and Özdemir, 2009). Although ex-182
humation of the Beni Bousera peridotites took place dur-183
ing the Oligocene-Miocene, P -T data shows that deforma-184
tion (folded pyroxenite layers, development of the main185
foliation) occurred during decompression from 1050ºC to186
800ºC (Ari et al., 2011), dated at 25-20 Ma. Therefore,187
peridotite rocks from the Gibraltar Arc cannot have pre-188
served any information of the geomagnetic eld before the189
above mentioned high temperature event 1924 Ma ago,190
but only after they cooled below their Curie temperatures.191
This implies that the time of any acquisition remanences192
is younger than the age of formation of their observed de-193
formation pattern.194
1.3.2. Palaeomagnetic studies in the Rifean peridotites195
Saddiqi et al. (1995) studied 224 oriented samples (11196
sites) from the Beni Bousera peridotites and found two sta-197
ble components carried by magnetite and some hematite.198
A low-temperature (LT) component with unblocking tem-199
peratures between 450°C and 550°C had a northward di-200
rection (D = 1.2°, I = 57.4°, α95 = 5.4°, without tec-201
tonic correction). A second, high-temperature (HT) com-202
ponent with unblocking temperatures between 580°C and203
650°C was found in 6 sites (38 samples) and had an east-204
ward mean direction and reversed polarity (D = 103.8°,205
I = −58.6°, α95 = 10.3°, k = 43, without tectonic cor-206
rection) that is due to the high temperature conditions207
22 Ma ago. Saddiqi et al. (1995) interpret the northward208
LT component as a post-metamorphic TRM that was ac-209
quired during the same thermal event and reject the possi-210
bility of a chemical remanent magnetization (CRM) for the211
high unblocking temperature and the results of their ARM212
experiments that indicated a single size of the magnetic213
grains. They therefore conclude that an anti-clockwise ro-214
tation of the Beni Bousera peridotites of 76±13° took place215
during the post-metamorphic cooling and was completed216
by 16 Ma.217
1.3.3. Palaeomagnetic studies in the Betic peridotites218
Feinberg et al. (1996) studied 11 sites in the Ronda219
peridotites (Sierra Bermeja and Sierra Alpujata) in the220
Betic Cordillera, and four granitic dykes intruding them.221
They performed various rock magnetic experiments and222
conclude that the main magnetic carrier is coarse-grained223
magnetite and in a few samples a small quantity of224
5

Page 7 of 37
Accep
ted
Man
uscr
ipt
hematite. About 62 % of the samples had a NE normal225
polarity magnetic component that was either stable up to226
600°C or stable up to 550°C and then reversed at higher227
temperatures to a SW reversed polarity direction. In some228
cases only a reversed polarity component was observed229
that corresponded in direction to the SW high temperature230
component. After taking antipodes of the reversed polar-231
ity directions, they obtained a mean direction of D = 46°,232
I = 47.5°, α95 = 6.6°, N = 19 (without tectonic correc-233
tion). They also found a present-day eld direction that234
was stable up to 250°C in some samples. Hence, they235
conclude that the Ronda massifs acquired their charac-236
teristic remanent magnetization (ChRM) during the post-237
metamorphic cooling, then registered a magnetic eld re-238
versal and then rotated 46±8° clockwise before the cooling239
had completely ended. They hence interpret, like Saddiqi240
et al. (1995) in Beni Bousera, the components as pure ther-241
moremanent magnetizations and they pinpoint the time of242
acquisition to the 2019 Ma period of dominantly normal243
polarity magnetic eld.244
Villasante-Marcos et al. (2003) demagnetized 253 ori-245
ented samples from the Ronda peridotites (Ronda, Ojén246
and Carratraca massifs), mainly by thermal demagneti-247
zation and in part by AF. They generally cleaned the248
samples of a magnetic component with a blocking tem-249
perature below 200°C that they interpret as a viscous re-250
manent magnetization (VRM). After cleaning the VRM,251
samples showed either only a present-day eld direction252
(20% of the samples), or single rotated direction of either253
polarity (45%), or a low-temperature northward direction254
followed by a distinct high-temperature component (20%),255
or had an anomalous behaviour (15%). The rotated com-256
ponent has a mean direction of D = 45.3°, I = 45.8°,257
α95 = 7.6°, k = 20.4 (without tectonic correction), which258
amounts to a 41 ± 12° clockwise rotation when compared259
to expected palaeodirection for stable Iberia after Barberá260
et al. (1996).261
Although the directions they found, are similar to those262
Site Latitude Longitude
BB1 35° 18.150' -4° 53.200'
BB2 35° 18.099' -4° 53.098'
BB3 35° 17.237' -4° 53.550'
BB4 35° 18.177' -4° 54.609'
BB5 35° 15.869' -4° 55.180'
BB7 35° 18.409' -4° 54.519'
BB8 35° 18.888' -4° 55.489'
SA 35° 53.373' 5° 17.750'
Table 1: Coordinates of sampling sites. Note that in the Sarchal clis
(SA) the sites were only seperated by a few tens of meters, therefore
only one position if given.
obtained by Feinberg et al. (1996), they disagree with them263
in terms of the mechanism and timing of the acquisition of264
the NRM: (1) They interpret the northward direction as265
a post-rotation VRM associated with multi-domain (MD)266
magnetite grains, as opposed to a TRM and (2) they con-267
sider the rotated directions a thermo-chemical remanent268
magnetization due to the formation of single-domain (SD)269
or pseudo-single-domain (PSD) magnetite grains. These270
SD/PSD grains formed during the post-metamorphic cool-271
ing when the massif cooled from 350400°C to ambient272
temperatures, between 20 and 1718 Ma ago. This hy-273
pothesis is supported by the observation that serpentinites274
carried mostly present-day eld directions, whereas peri-275
dotites more frequently showed rotated components, and276
in cases where both components were visible, the north-277
ward component was more predominant in the serpen-278
tinized samples (assuming that the degree of serpentiniza-279
tion is mainly due to the posterior serpentinization phase).280
2. Sampling strategy281
Sampling has been performed following standard prac-282
tices in palaeomagnetim. In total 60 oriented samples have283
been obtained from Beni Bousera (BB) and 55 from Ceuta284
(SA, Sarchal clis, southeast edge of Monte Hacho). Seven285
6

Page 8 of 37
Accep
ted
Man
uscr
ipt
sites per locality (BB and SA, positions are indicated in286
Fig. 1c and listed in Tab. 1) have been used to average out287
adequately the secular variation of the terrestrial magnetic288
eld, which makes an average of ca. 9 (BB) and 8 (SA)289
samples per site, respectively. In the case of Ceuta, it290
must be noted that the outcrop was very small, only a few291
hundreds of meters in length along the clis of the Sarchal292
beach. Sampling sites in SA have been seperated as far as293
possible (i.e. a few tens of metres), using the whole width294
of the outcrop available. Three of them were above sea295
level during low tide only, the others were always above296
sea level. In Beni Bousera, the seven sites were further297
apart, on average separated a few hundreds of meters to298
about 2 km.299
All the three previous paleomagnetic studies in Ronda300
and BB (Saddiqi et al., 1995; Feinberg et al., 1996;301
Villasante-Marcos et al., 2003) used only in situ direc-302
tions (i.e. without tectonic correction), because for all the303
observed directional components, the fold tests were neg-304
ative (i.e. tectonically corrected paleomagnetic directions305
were more scattered than in situ directions), thus indi-306
cating that remanence acquisition postdate the deforma-307
tion. These negative fold tests were performed in BB using308
the widespread antiformal foliation (Saddiqi et al., 1995)309
or in Ronda using foliation planes and the compositional310
layering (Villasante-Marcos et al., 2003). In BB, the re-311
sults by Saddiqi et al. (1995) results imply that the age of312
the older remanence is younger than the formation of the313
NW-SE trending anticline. Taking into account these pre-314
vious results, foliation/compositional layering planes were315
measured only at 4 sites from BB and SA in this study.316
Measured dip direction/dip mean values of foliation planes317
were: 345/42 (SA1), 323/43 (SA2), 327/53 (BB5), 63/66318
(BB8).319
In Beni Bousera (BB), sampled peridotites correspond320
mostly to the spinel lherzolite facies that crop out321
in the core of the massif, generally foliated and vari-322
ably serpentinized, which grade to garnet/spinel lherzo-323
lite/harzburgite in the rim of the massif (BB8 in Fig. 1c),324
where it is generally more foliated (e.g. Reuber et al.,325
1982; Ari et al., 2011). The serpentinized peridotites from326
Ceuta (SA) are foliated and highly tectonized (Sánchez-327
Gómez et al., 1995).328
Palaeomagnetic sampling strategy avoided drilling329
highly serpentinized bands when detectable at a centi-330
metric scale. Despite of this, we observed a high vari-331
ability of the degree of serpentinization between individu-332
ally oriented samples, in fact sometimes between dierent333
specimens (~10 cm3 each). The degree of serpentiniza-334
tion was measured in representative samples for each site335
(Martin-Hernandez et al., 2009), obtaining mean values of336
68.0% (SA) and 62.8% (BB) and a high variability both337
between and within sites. Samples for those sites with338
minimum/maximum values of the degree of serpentiniza-339
tion in each locality were selected for SEM analysis (see340
section 4).341
3. Experimental methods342
3.1. Thermal demagnetization343
One to two samples of most sites have been taken as344
pilot samples and thermally demagnetized with a Schon-345
stedt TSD-1 furnace with 18 temperature steps from 100°C346
to 675°C. The remaining (non-pilot) samples have been347
thermally demagnetized using a Magnetic Measurements348
MMTD-80 furnace with much smaller temperature steps.349
All samples have been demagnetized with temperature350
steps of 40°C from 100°C to 460°C. After that, samller351
temperature steps between 10°C and 30°C were used, up352
to a temperature of 620°C (SA) and 680°C (BB) when the353
samples were completely demagnetized. As both furnaces354
are known to have a temperature gradient, the samples355
have always been placed at the same positions, so that356
relative temperature steps are accurate.357
The remanent magnetization has been measured with358
an Agico JR5-A spinner magnetometer inside a Helmholtz359
7

Page 9 of 37
Accep
ted
Man
uscr
ipt
coil cage. Samples were kept in a magnetic shield most of360
the time when no measurement was being done with them.361
All samples have been measured in four positions.362
Before beginning the thermal demagnetization, and af-363
ter every second demagnetization step, the bulk magnetic364
susceptibility of each sample was measured using an Agico365
Kappabridge KLY-4S.366
3.2. Alternating eld demagnetization367
A total of 14 specimens of BB and 15 specimens of SA368
have been demagnetized by alternating elds (AF) using369
a 2G superconducting magnetometer in steps of 3 mT up370
to 15 mT and then with steps of 5 mT. Due to instru-371
mental biases at higher elds, measurements above 30 mT372
had to be discarded. Specimens of four samples have been373
demagnetized by alternating eld demagnetization using374
a Schonstedt GSD-5 demagnetizer. The sample BB7-6A375
has rst been partially thermally demagnetized up to a376
temperature of 340°C and then further AF demagnetized.377
The other three specimens have been completely AF de-378
magnetized.379
3.3. Scanning Electron Microscope380
A few selected samples have been investigated in a JSM-381
6400 Scanning Electron Microscope (SEM) in the Cen-382
tro de Apoyo en Investigación (CAI) for Microscopy in383
the Chemistry Faculty of the UCM. Samples have been384
coated with graphite or gold in order to improve conduc-385
tance. Moreover, the elementary compositions of dierent386
grains of these samples have been measured using energy-387
dispersive X-ray spectroscopy (EDX).388
3.4. Rock magnetic experiments389
Isothermal remanent magnetization (IRM) acquisition390
curves, backeld curves, hysteresis cycles and thermomag-391
netic (Curie) curves have been obtained from selected sam-392
ples using a Magnetic Measurements Variable Field Trans-393
lation Balance (VFTB) in the CAI for Palaeomagnetism394
in the Physics Faculty of the UCM. On some additional395
samples, hysteresis loops have been obtained using a co-396
ercivity meter (Jasonov et al., 1998). Specimens of the397
same samples investigated in the SEM/EDX have been398
used to obtain low-temperature thermomagnetic curves us-399
ing a Quantum Design MPMS-XL SQUID magnetometer400
in the CAI Técnicas Físicas at the Physics Faculty of the401
UCM.402
4. Rock magnetic and SEM results403
4.1. Scanning Electron Microscope results404
Fig. 2 shows a representative image obtained by scan-405
ning electron micrsoscopy (SEM). Two samples from BB406
and two from SA have been investigated in a SEM. On407
these samples, 30 grains have been analyzed using energy-408
dispersive x-ray (EDX) to obtain their chemical composi-409
tions. Tab. 8 in the appendix lists the atomic percent-410
ages of the elements detected by the EDX for the dierent411
grains, along with a very rough estimate of the size of the412
respective grain and a possible interpretation in terms of413
minerals. This way, the following minerals have been iden-414
tied: olivine (fayalite/forsterite), pyroxene, pentlandite,415
iron-oxides (magnetite/hematite/wüstite), chromites and416
some grains containing copper-oxides. These identica-417
tions are listed in Tab. 9 in the appendix. The palaeomag-418
netically relevant minerals are then the iron-oxides, the419
chromites and the pentlandite for its common association420
with the ferromagnetic pyrrhotite. The iron-oxide grains421
investigated were about 10µm in size. In order to be able422
to distinguish better between magnetite and pyrrhotite in423
case of its presence, we have chosen to demagnetize the424
vast majority of the samples thermally as opposed to AF.425
426
4.2. IRM, backeld and hysteresis427
The IRM acquisition curves (Fig. 3 shows a represen-428
tative example) show in most cases a saturation around429
200 mT, both in BB and in SA. The back-eld curves show430
a coercivity of remanence Hcr of about 34 mT, with very431
8

Page 10 of 37
Accep
ted
Man
uscr
ipt
1516
1921
20
17
18
Figure 2: Representative scanning electron microscope image of sam-
ple SA2-3A. Arrows indicate positions used for EDX-analyses (see
Tab. 8 and 9 in the appendix).
little variation between samples. The saturation magneti-432
sation lied between 0.017Am2/kg and 1.0Am2/kg, with433
an average of 0.44Am2/kg.434
The hysteresis curves have been corrected for their para-435
magnetic components and then been used to calculate436
the saturation magnetization Ms, the remanent satura-437
tion magnetization Mrs, the coercivity Hc and the coer-438
civity of remanence Hcr. The ratio Mrs/Ms is plotted439
againstHcr/Hc in the Day plot (Day et al., 1977) in Fig. 4,440
along with theoretical curves for mixtures of SD and MD441
grains of magnetite with dierent grain size end members442
after Dunlop (2002a). Dunlop (2002b) tested his theo-443
retical curves against data from serpentinized peridotites444
and found that his peridotites fell on a novel region below445
the theoretical SD+MD mixing curves. Villasante-Marcos446
et al. (2003) plotted `fresh' peridotites and a serpentinized447
peridotite from Ronda on a Day plot and found that the448
serpentinized sample fell on Dunlop's (2002b) `novel' re-449
gion, whereas the `fresh' peridotites followed the SD+MD450
mixing curve. Similarly, the Beni Bousera and Ceuta peri-451
dotites fall very closely on the SD+MD mixing curves for452
magnetite, with the SA samples generally being closer to453
the SD region and the BB samples being closer to the454
-0.06
-0.04
-0.02
0
0.02
0.04
0.06
0.08
0.1
0.12
0.14
0.16
-100 0 100 200 300 400 500
IRM
M [m
A m
2 /kg]
Magnetizing Field H [mT]
Figure 3: Representative isothermal remanent magnetization acqui-
sition and backeld curve (sample BB1-6).
0
0.1
0.2
0.3
0.4
0.5
0.6
1 1.5 2 2.5 3 3.5 4 4.5 5 5.5
Mrs
/Ms
Hcr/Hc
SD
MD
Dunlop (2002)BBSA
Figure 4: Day plot of BB and SA samples and theoretical curves for
SD+MD mixtures after Dunlop (2002a).
MD region. This kind of (grain size dependent) variability455
of the remanence ratios closely following the theoretical456
SD+MD mixing curves has also been observed in oceanic457
serpentinized peridotites (Maone et al., 2014).458
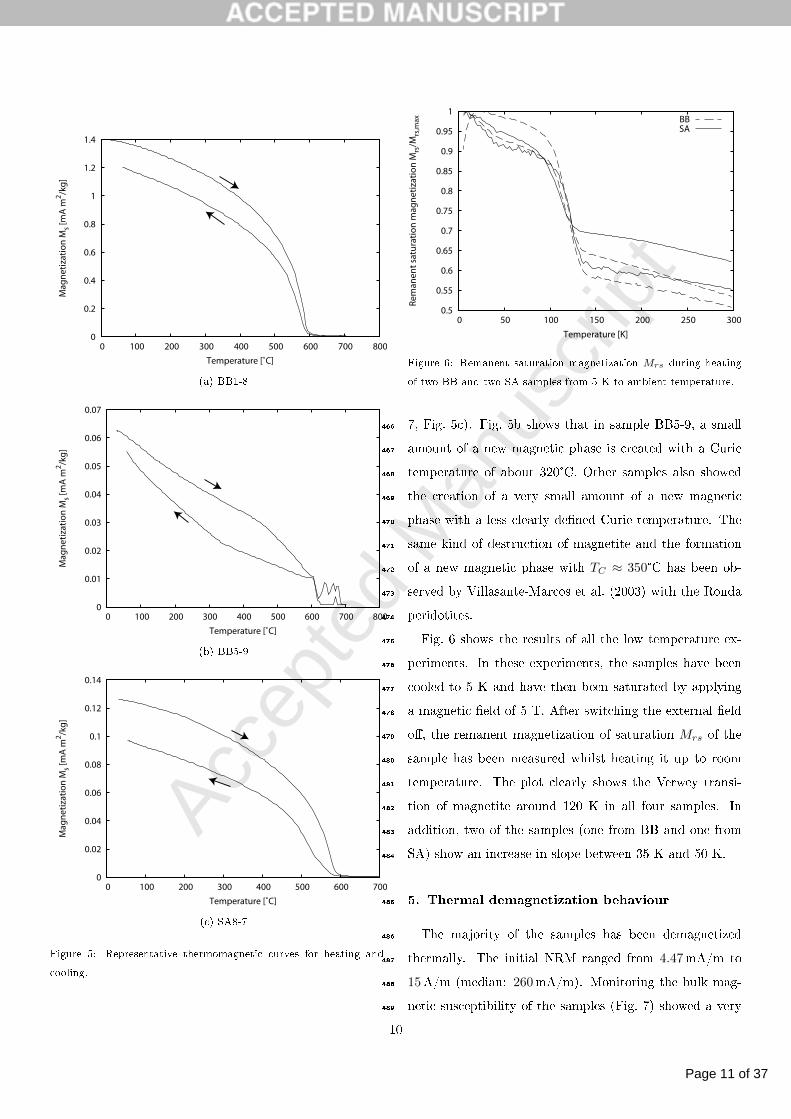
4.3. Thermomagnetic curves459
Fig. 5 shows representative thermomagnetic curves.460
All curves show a Curie temperature TC of about 580°C,461
which is indicative of magnetite. The curves show chemical462
changes that destroys magnetic minerals (probably mag-463
netite) upon heating, in some of them not appreciably (like464
BB1-8, Fig. 5a), but in others more prominently (like SA8-465
9
Page 11 of 37
Accep
ted
Man
uscr
ipt
0
0.2
0.4
0.6
0.8
1
1.2
1.4
0 100 200 300 400 500 600 700 800
Ma
gn
eti
zati
on
Ms
[mA
m2/k
g]
Temperature [˚C]
(a) BB1-8
0
0.01
0.02
0.03
0.04
0.05
0.06
0.07
0 100 200 300 400 500 600 700 800
Ma
gn
eti
zati
on
Ms
[mA
m2/k
g]
Temperature [˚C]
(b) BB5-9
0
0.02
0.04
0.06
0.08
0.1
0.12
0.14
0 100 200 300 400 500 600 700
Ma
gn
eti
zati
on
Ms
[mA
m2/k
g]
Temperature [˚C]
(c) SA8-7
Figure 5: Representative thermomagnetic curves for heating and
cooling.
0.5
0.55
0.6
0.65
0.7
0.75
0.8
0.85
0.9
0.95
1
0 50 100 150 200 250 300
Re
ma
ne
nt
satu
rati
on
ma
gn
eti
zati
on
Mrs
/Mrs
,ma
x
Temperature [K]
BBSA
Figure 6: Remanent saturation magnetization Mrs during heating
of two BB and two SA samples from 5 K to ambient temperature.
7, Fig. 5c). Fig. 5b shows that in sample BB5-9, a small466
amount of a new magnetic phase is created with a Curie467
temperature of about 320°C. Other samples also showed468
the creation of a very small amount of a new magnetic469
phase with a less clearly dened Curie temperature. The470
same kind of destruction of magnetite and the formation471
of a new magnetic phase with TC ≈ 350°C has been ob-472
served by Villasante-Marcos et al. (2003) with the Ronda473
peridotites.474
Fig. 6 shows the results of all the low temperature ex-475
periments. In these experiments, the samples have been476
cooled to 5 K and have then been saturated by applying477
a magnetic eld of 5 T. After switching the external eld478
o, the remanent magnetization of saturation Mrs of the479
sample has been measured whilst heating it up to room480
temperature. The plot clearly shows the Verwey transi-481
tion of magnetite around 120 K in all four samples. In482
addition, two of the samples (one from BB and one from483
SA) show an increase in slope between 35 K and 50 K.484
5. Thermal demagnetization behaviour485
The majority of the samples has been demagnetized486
thermally. The initial NRM ranged from 4.47mA/m to487
15A/m (median: 260mA/m). Monitoring the bulk mag-488
netic susceptibility of the samples (Fig. 7) showed a very489
10

Page 12 of 37
Accep
ted
Man
uscr
ipt
0
0.005
0.01
0.015
0.02
0.025
0.03
0 100 200 300 400 500 600
Bulk susceptibility
BBSA
Figure 7: Mean bulk susceptibility of sites.
slight increase in susceptibility starting around 200°C for490
SA and a moderate increase starting around 300°C in BB,491
both reaching a maximum at around 550°C. This did not492
have a recognizable eect on the stability of the magnetic493
components, however.494
Most samples showed a very weak component at very495
low temperatures that was found to contain no useful496
palaeomagnetic data (see section 5.1). After cleaning this497
rst component, the samples still showed a heterogeneous498
palaeomagnetic behaviour one or more, often mutually499
overlapping, magnetic components: Samples from BB had500
either one or two components and samples from SA had501
one, two or three components. All of these components502
have been analyzed and are be described in the following.503
An overview of the median unblocking temperatures of504
the three components is shown in Tab. 2, and the numbers505
of samples belonging to them are summarized in Tab. 3506
and 4.507
5.1. Very low temperature component508
Most samples showed a magnetic component (in some509
cases more, in others less pronounced) at very low temper-510
atures below 180°C in BB and, to a lesser degree, below511
140°C in SA (see Fig. 19 in the appendix). These direc-512
tions show a very high dispersion but nevertheless cluster513
No. of comp. Site Comp. Temperature range
1BB 180600°C
SA 140605°C
2 BBLT 180460°C
HT 535600°C
23 SA
LT 140420°C
IT 460575°C
HT 533603°C
Table 2: Median temperature ranges used to calculate linear t lines.
LT: low temperature; IT: intermediate temperature; HT: high tem-
perature.
Site N 1 component 2 components Rejected
BB1 9 0 (0) 8 1
BB2 9 3 (2) 4 2
BB3 8 2 (1) 6
BB4 9 2 (0) 6 1
BB5 9 3 (2) 5 1
BB7 9 6 (6) 2
BB8 8 5 (1) 2 1
Total 60 21 (12) 33 6
Table 3: Number of samples from Beni Bousera with the given num-
ber of components. Numbers in parentheses is the number of samples
that showed directions clustering closely together.
11

Page 13 of 37
Accep
ted
Man
uscr
ipt
Site N 1 cmp 2 cmp 2 cmp 3 cmp Rej
(IT) (HT)
SA1 7 4 (4) 2
SA2 9 6 (4) 3
SA3 8 3 (0) 3 2
SA5 7 2 (2) 1 1 2 1
SA6 8 4 (4) 4
SA7 8 1 (0) 3 4
SA8 8 1 (0) 6 1
Total 55 21 (14) 10 9 11 3
Table 4: Number of samples from the Sarchal clis with the given
number of components. Numbers in parentheses is the number of
samples that showed directions clustering closely together. In cases
where two components where visible, the higher temperature com-
ponent could either be identied with the IT or the HT component,
and the respective numbers are given in the table.
around nearly 90° inclination in BB and around a north-514
west direction in SA. In the case of BB, there was no cor-515
relation between the number of components of the sample516
and the direction of the very low temperature component.517
In SA, the mean direction of this component coincides very518
roughly with the NRM of most samples. The very high519
dispersion suggest that the measurement of the rst few520
temperature steps may be inuenced by a VRM that was521
acquired in the lab. Therefore, the remanent magnetiza-522
tions below these temperatures have not been taken into523
account for any of the calculated directions following be-524
low.525
5.2. One component (BB and SA)526
21 samples of BB (35%) and 21 samples of SA (38%) had527
only one component. In BB, these samples had unblock-528
ing temperatures between 595°C and 620°C, and in four529
cases 680°C (median: 600°C, Fig. 8d) and in SA they had530
unblocking temperatures between 560°C and 640°C (me-531
dian was 605°C). Directions have been calculated using an532
anchored line-t for the temperature range 180595°C and533
140595°C, respectively.534
As can be seen in Fig. 9, the directions of most of535
the samples (BB: 12, SA: 14) cluster around a common,536
roughly north-trending direction (normal polarity). In the537
case of BB, the mean declination of these `clustering' sam-538
ples is virtually 0°, but in the case of SA, it is slightly neg-539
ative (i.e. slightly `o' to the west). Some of the samples540
showed very disperse directions (either polarity), though,541
and were not included in the calculation of a mean direc-542
tion.543
5.3. Two components (BB)544
33 samples of BB (55%) showed two magnetic compo-545
nents, a low temperature (LT) component that is roughly546
north, and a high temperature (HT) component that is ro-547
tated and may be normal or reversed polarity (see Fig. 8a548
and 8c). The LT component showed a linear trend from549
180°C up to a temperature between 340°C and 555°C (me-550
dian was 460°C). The HT component then showed a linear551
trend starting between 380°C and 575°C (median: 535°C)552
to its unblocking temperature between 555°C and 620°C553
(median: 600°C, Fig. 8). Sometimes the two components554
overlapped. Directions of the LT component have been555
calculated using a non-anchored line-t using a tempera-556
ture range from 180°C to the highest temperature of the557
linear trend for each sample. Directions of the HT compo-558
nent have all been calculated using an anchored line-t on559
the temperature range 535595°C wherever possible, and560
in some cases on 555595°C or 575°C600°C.561
The LT component is northward (normal polarity) and562
shows a very low dispersion (Fig. 11a). The HT component563
is either normal polarity and rotated westward by roughly564
90°, or reversed polarity and rotated eastward by roughly565
90°. The normal polarity HT directions show very lit-566
tle dispersion, whilst the reversed polarity directions show567
a considerable dispersion. The directions of LT and HT568
components along with their mean directions (calculated569
seperately for normal and reversed polarity directions) are570
12

Page 14 of 37
Accep
ted
Man
uscr
ipt
N
up/W 0 C
180 C
180 C
490 C
490 C
(a) BB1-6B
N
up/W
180ˆC
180ˆC
555ˆC
555ˆC
(b) BB1-8B
N
up/W
100 C420 C
420 C
575 C
(c) BB5-8B
Nup/W
180 C
575 C
(d) BB5-10A
Figure 8: Zijderveld plots of BB. Solid lines are best t lines.
N
(a) BB, single component samples.
N
(b) SA, single component samples.
Figure 9: Directions (without tectonic correction) of samples that had only one component. Circles are roughly north trending directions,
diamonds are non-north trending directions. Mean direction of the roughly north-trending directions are indicated along with the α95
condence level. Filled symbols: normal polarity, unlled: reversed polarity.
13

Page 15 of 37
Accep
ted
Man
uscr
ipt
N
up/W
340 C
340 C
575 C
(a) SA5-2A
N
up/W
100 C
420 C
560 C
(b) SA6-2B
N
up/W
340 C 420 C
575 C
(c) SA1-4B
N
up/W
460 C
545 C
(d) SA3-1B
Figure 10: Zijderveld plots of SA samples where three components (LT, IT, HT) are visible. Solid lines are best t lines. The dashed lines
are hypothetical components that might cause the observed curvature due to overlap with the other components.14

Page 16 of 37
Accep
ted
Man
uscr
ipt
N
(a) BB, 2 component samples, thermal
N
(b) BB, 2 component samples, AF
N
(c) SA, 23 component samples, thermal
N
(d) SA, 23 component samples, AF
Figure 11: Directions (without tectonic correction) of samples with 2 or 3 components as obtained by thermal and AF demagnetization,
respectively. Circles represent HT component, squares LT component and triangles are IT component. Mean directions are indicated along
with the α95 condence level and have been calculated seperately for normal (black symbols) and reversed polarity (open symbols). Red
symbols indicate SA samples where all three components (LT, IT, HT) were clearly visible (the others are samples where only two components
were clearly visible). Filled symbols: normal polarity, unlled: reversed polarity.
15

Page 17 of 37
Accep
ted
Man
uscr
ipt
shown in Fig. 11a.571
5.4. Two to three components (SA)572
31 samples of SA (56%) had either two or three compo-573
nents: A low temperature (LT), an intermediate temper-574
ature (IT) and a high temperature (HT) component. The575
number of visible components did not correlate with the576
degree of serpentinization.577
In 11 samples (20%), the presence of all of these three578
components could clearly be seen in the Zijderveld plots579
(see Fig. 10b and 10c) and linear t lines could be cal-580
culated. In some cases, however, the presence of three581
components could only be deduced by a curvature of the582
Zijderveld plot (Fig. 10a and 10d): In Fig. 10a a LT and583
a HT component are linear but in-between one nds an584
S-shaped part. Such a shape is best explained by three585
components with the unblocking temperature spectrum of586
the intermediate component completely overlapping with587
those of the other two components (see e.g. Kirschvink,588
1980 for similar considerations). Similarly, Fig. 10d shows589
linear LT and IT components but the highest few tem-590
perature steps describe a curve which is best explained by591
another HT component that completely overlaps with the592
IT component. In these cases, linear t lines could not593
be used to calculate both the HT and IT component, but594
best-t great circles have been used instead to obtain an595
estimate of the HT component, whenever possible (Halls,596
1976).597
In yet other samples, only two components were visi-598
ble (Fig. 10a and 10d), in which case the rst component599
was always the LT component and the second component600
could be identied as either the IT or the HT component601
according to its direction.602
The LT component showed a linear trend (see Fig. 8)603
on the temperature range from 140°C to 340490°C (me-604
dian: 420°C). The IT component showed a linear trend605
starting at 380560°C (median: 460°) and ending at 520606
605°C (median: 575°C). The HT component showed a lin-607
ear trend starting at 380575°C (median: 533°) and ending608
at 575625°C (median: 603°C). Sometimes this led to the609
necessity of using just a single point to dene a t line610
to the origin. The temperature ranges used for the calcu-611
lation of the directions have been chosen for each sample612
individually. The LT component, however, was always cal-613
culated starting at 140°C. For the LT and IT components614
non-anchored and for the HT component anchored line-ts615
were used.616
The LT component nearly always lies between north and617
north-west and shows relatively little dispersion (α95 =618
5.1°, Fig. 11c). The HT component shows equally little619
dispersion (α95 = 9.6°) and is approximately northward.620
Looking at the LT and the HT components together, a621
striking feature is that the dispersion they show, roughly622
describes a great circle from a point in the north with a low623
inclination to a point in the west with a higher inclination.624
The IT component directions all lie in the southern hemi-625
sphere, and most lie south-west. All but ve are reversed626
polarity. They show a large dispersion (α95 = 19.8°),627
which is due to the fact that in most samples the IT over-628
lapped with the LT and/or the HT component. Hence, IT629
directions should be considered only very rough estimates.630
5.5. Rejected samples631
Six samples from BB (10%) and three samples from SA632
(5%) have not been taken into account for the palaeomag-633
netic analysis, because they showed uncoherent palaeo-634
magnetic components that were very dierent to the rest635
of the samples.636
6. Alternating eld demagnetization637
A number of specimens have been AF demagnetized.638
This permitted to compare the directions of the magnetic639
components between the two demagnetization methods.640
This way, the unblocking temperatures could be related641
to the coercivities of the respective mineral, which greatly642
16

Page 18 of 37
Accep
ted
Man
uscr
ipt
helps the mineralogical interpration of the remanences (see643
section 7.1).644
In general, thermal and AF demagnetization gave sim-645
ilar results, but because of technical problems with the646
SQUID, high eld data (>30 mT) had to be discarded647
and therefore directions obtained by AF have not been648
taken into account for nal calculation of the mean di-649
rections. For most of the AF demagnetized specimens, a650
second specimen of the same sample has been thermally651
demagnetized as well. Fig. 11b and 11d show the direc-652
tions as obtained by AF with those obtained by thermal653
demagnetization.654
6.1. Beni Bousera655
In BB, all samples demagnetized by AF showed two sta-656
ble components (Fig. 11b), a low coercivity (LC) compo-657
nent that unblocked at around 912 mT and a high co-658
ercivity (HC) component that unblocked at applied elds659
above 30 mT (the exact coercivity could not be determined660
due to technical problems). Generally, the LC component661
had a northward direction very similar to the LT compo-662
nent of thermally demagnetized samples with two compo-663
nents.664
The high coercivity component either had a west665
normal-polarity or an east reversed-polarity direction, and666
hence corresponds to the HT component of the thermally667
demagnetized samples. Deviating from this rule, however,668
there were two samples where the LC and HC components669
were `swapped', in the sense that the LC component was670
westward rotated and the HC component was north, as671
shown in Fig. 12. Moreover, two samples that showed two672
clearly distinguishable component in AF, showed only one673
component in thermal demagnetization.674
6.2. Ceuta675
In SA, all samples showed either two or three stable676
components (Fig. 11d). A low coercivity component that677
unblocked at 912 mT was present in all samples and had678
north to westward directions with normal polarity. This679
component can be identied with the LT component of the680
thermally demagnetized samples. In cases where they were681
three components, an intermediate coercivity (IC) compo-682
nent tended to be south, reversed-polarity and a high co-683
ercivity (HC) component tended to be roughly north with684
a normal-polarity and low inclination. In samples that685
showed only two components, the higher coercivity com-686
ponent showed the same behaviour as either the IC or the687
HC component. Hence, in general, the IC component of688
AF demagnetized specimens can be identied with the IT689
component of thermally demagnetized specimens and the690
HC component can be identied with the HT component.691
In one sample was this behaviour `swapped' again, and692
seven samples that showed only one component in thermal693
demagnetization showed two or even three distinguishable694
components in AF.695
6.3. Relation between unblocking temperature and coerciv-696
ity697
Fig. 13 shows the normalized intensity of the sum of698
the partial TRM's (pTRM) during the thermal demag-699
netization. Most samples were completely demagnetized700
at around 595°C, but three samples (all of BB) had an701
unblocking temperature of about 680°C (note that as the702
plot shows the sum of pTRMs, experimental noise at high703
temperatures incorrectly shows up as apparent high inten-704
sities at high temperatures as this is just an artifact,705
the unblocking temperatures of the highest temperature706
component have been determined by the absolute inten-707
sities as opposed to the pTRM sums). The plots show708
that there are at least two populations of unblocking tem-709
peratures, one that causes a major decay between 140°C710
and 340°C and another one with a major intensity decay711
at high temperatures between 535°C and 595°C. Depend-712
ing on the relative prominence of these two populations,713
samples lose most of their remanence either at low temper-714
atures, or at high temperatures, or showed a quasi-linear715
17

Page 19 of 37
Accep
ted
Man
uscr
ipt
N
180 C
380 C
535 C
(a) BB4-12C, thermal
N
up/W
180 C
535 C
(b) BB4-12C, thermal
N
0 mT
1 mT
8 mT
(c) BB4-12A, AF
N
up/W 1 mT
8 mT
(d) BB4-12A, AF
Figure 12: Paleomagnetic results of two specimens of BB4-12, demagnetized thermally and by AF, respectively.
18

Page 20 of 37
Accep
ted
Man
uscr
ipt
0
0.2
0.4
0.6
0.8
1
0 10 20 30 40
0 100 200 300
No
rma
lize
d In
ten
sity
Field [mT]
Temperature [˚C]
AF (BB7-6A)Thermal (BB7-6A)
340
Figure 14: Normalized intensity of the remanent magnetization of
BB7-6A that has rst been partially thermally demagnetized and
then further demagnetized by AF.
decay from 140°C to 595°C.716
Plots of the remanence intensity decays during AF de-717
magnetization of samples demagnetized with the SQUID718
are shown in Fig. 13c and 13d (measurements above 30 mT719
have been removed). Again, two coercivity populations720
can be distinguished, one with a major decay between 0721
and 9 mT (this is somewhat less pronounced for the SA722
samples) and another one causing a slow decay between 12723
and 30 mT or more, where again, the relative importance724
of the two populations varied from sample to sample.725
Comparing the specimens of samples that had both AF726
and thermally demagnetized, a clear correlation between727
the two unblocking temperature and coercivity popula-728
tions could be seen: The intensity decay at low tempera-729
tures corresponded to the intensity decay of low coercivi-730
ties and the one of high temperatures corresponded to high731
coercivities.732
To make the correspondence between coercivity and733
blocking temperature, sample BB7-6A, has rst been par-734
tially demagnetized by thermal demagnetization up to735
340°C and then completely demagnetized by AF demag-736
netization (Fig. 14 and 15). After partial thermal demag-737
netization, the strong decay between 0 and about 5 mT is738
not visible anymore.739
7. Discussion740
7.1. Responsible mineralogy for the NRM741
In the SEM/EDX analysis, iron-oxides, chromite and742
pyrrhotite have been identied as possible candidates for743
the NRM.744
Saddiqi et al. (1995), in their study of the BB peri-745
dotites, consider magnetite, titanomagnetite and hematite746
the most likely magnetic remanence carriers. In this study,747
however, most samples had an unblocking temperature748
of around 580°C and only three samples showed an un-749
blocking temperature of 680°C. Although, the accuracy750
of the unblocking temperature determination is relatively751
low (compare section 4.3), they clearly favour an interpre-752
tation as magnetite as opposed to hematite. Equally, only753
minute amounts of titanium have been found in the EDX754
analysis, therefore we do not consider titanomagnetite a755
likely candidate either.756
The unblocking temperature spectra showed in many757
samples a strong decay below 300°C (Fig. 13a), suggesting758
the presence of pyrrhotite. However, in the demagnetiza-759
tion, no components compatible with the Curie temper-760
ature of pyrrhotite (320°C, Dunlop and Özdemir, 2009)761
could be observed: All the LT components persisted well762
above 400°C and often showed overlap with the IT/HT763
component at even higher temperatures. Therefore, if764
pyrrhotite carries a signicant portion of the NRM, it has765
recorded the same magnetic signal as one of the other mag-766
netic minerals.767
The iron-poor endmember of the chromite series768
(Fe (Cr,Fe)2O4) has a Curie temperature of −185°C769
that increases with decreasing Cr content (Dunlop and770
Özdemir, 2009) until it reaches TC = 580°C for the iron-771
rich endmember (magnetite). Therefore, Cr may play a772
similar role as Ti, in reducing the unblocking temperature773
of magnetite, although we do not believe that this is the774
dominant mechanism for producing the dierent unblock-775
ing temperatures for the reasons described below.776
19

Page 21 of 37
Accep
ted
Man
uscr
ipt
0
0.2
0.4
0.6
0.8
1
0 100 200 300 400 500 600 700
No
rma
lize
d In
ten
sity
Temperature [˚C]
(a) BB, thermal
0
0.2
0.4
0.6
0.8
1
0 100 200 300 400 500 600 700
No
rma
lize
d In
ten
sity
Temperature [˚C]
(b) SA, thermal
0
0.2
0.4
0.6
0.8
1
0 5 10 15 20 25 30
No
rma
lize
d In
ten
sity
Applied !eld [mT]
(c) BB, AF
0
0.2
0.4
0.6
0.8
1
0 5 10 15 20 25 30
No
rma
lize
d In
ten
sity
Applied !eld [mT]
(d) SA, AF
Figure 13: Normalized intensity of the sum of partial remanent magnetizations during thermal (a, b) and AF (c, d) demagnetization (only
SQUID).
20

Page 22 of 37
Accep
ted
Man
uscr
ipt
N
0 C
340 C / 0 mT 16 mT
34 mT
(a)
180°
340° / 0 mT
10 mT
34 mT
34 mT
22 mT
100 mT
(b)
Figure 15: Paleomagnetic results of sample BB7-6A, demagnetized rst partially thermally and then by AF. The Zijderveld plot goes to the
origin at higher elds, but points have not been plotted for better visibility.
The unblocking temperatures of most samples and the777
IRM experiments suggest magnetite as the principal car-778
rier of the NRM. Notably, there is a signicant amount of779
multi-domain (MD) grains of magnetite, as can be seen by780
the very low coercivities in Fig. 13c and 13d and the Day781
plot Fig. 4.782
We believe that the there are two major grain size pop-783
ulations of magnetite that are responsible for the observed784
magnetic components in the vast majority of the samples.785
One of them is in the MD range and is responsible for the786
LT component, the other one is in the SD or PSD range787
and is responsible for the HT and IT components. This788
hypothesis is supported by the following observations:789
1. In the Day plot (Fig. 4), the samples fall almost per-790
fectly on the theoretical magnetite SD+MD mixing791
curves of Dunlop (2002a). Although Dunlop (2002b)792
found that some serpentinized peridotites fell on a793
novel region below the theoretical curve (for which794
he does not have an explanation), we believe that in795
our case the magnetic properites of the peridotites are796
dominated by SD and MD magnetite grains so that797
they follow the theoretical curve.798
2. The low temperature experiments (Fig. 6), although799
they do not reject small contributions of titano-800
magnetite, give clear indications of pure magnetite801
through a clearly visible Verwey transition. It is nei-802
ther shifted from 120 K nor depressed, hence not in-803
dicating any Ti content or surface oxidation (Dun-804
lop and Özdemir, 2009). Moreover, the experiments805
are not indicative of pyrrhotite, which has a transi-806
tion from a monoclinic to trigonal crystal structure807
around 35 K (Rochette et al., 1990). There is a808
change of slope around that temperature, however,809
the transition of pyrrhotite causes a very sharp in-810
crease in Mrs over a very narrow temperature range811
(over about 5 K), which is not seen in Fig. 6. It should812
21

Page 23 of 37
Accep
ted
Man
uscr
ipt
be noted that Dunlop and Özdemir (1997, and refer-813
ences therein) show very similar low temperature ther-814
moremanent curves for annealed crushed magnetite815
that exhibit just this change of slope around 50 K.816
3. The very low coercivities of the LC component are817
likely due to MD grains. The correspondence in di-818
rection of the LC component in AF demagnetization819
and the LT component in thermal demagnetization820
and the correlation between the intensity decay at low821
coercivities and at low temperatures support an iden-822
tication of these MD grains with the LT component.823
4. Similarly, both the IT and the HT components in SA824
have high unblocking temperatures and high coerciv-825
ities that point to grains in the PSD/SD range. Both826
components had very similar unblocking temperatures827
and coercivities. These similarities in their magnetic828
properties point to similar chemical compositions and829
similar grain sizes/shapes.830
5. Fig. 15 suggests that the grains with unblocking tem-831
peratures below 340° correspond to very low coercivi-832
ties (in this particular sample about 5 mT), and hence833
probably to MD grains. The AF intensity decay curve834
after partial thermal demagnetization in Fig. 14 has835
the shape typical of a PSD or SD grain size distribu-836
tion. Hence the HT and IT components are probably837
due to these SD/PSD grains.838
We conclude that the dierent unblocking temperatures of839
the dierent components are likely due to dierent grain840
size distributions, although Cr or Ti impurities may pos-841
sibly play a role as well.842
7.2. Acquisition of the remanence843
According to Villasante-Marcos et al. (2003) and ref-844
erences therein, there were two post-metamorphic ser-845
pentinization phases (at least in Ronda), the rst846
formed sub-microscopic magnetite and the second up to847
millimetre-sized magnetite grains, mainly along fractures.848
Hence, supposing that rst serpentinization phase created849
SD/PSD magnetite grains, they likely acquired a CRM at850
the time of their formation ~20 Ma ago. The larger grains851
from the posterior serpentinization phase are likely in the852
MD range and should as well carry a CRM from the time853
of their formation.854
This interpretation as CRMs is contrary to Saddiqi et al.855
(1995, Beni Bousera) and Feinberg et al. (1996, Ronda),856
but in line with Villasante-Marcos et al. (2003, Ronda).857
Saddiqi et al. (1995) and Feinberg et al. (1996) inter-858
pret the two magnetic components they found in the Beni859
Bousera and Ronda peridotites as pure TRMs. Their in-860
terpretation implies that the rotations they observed were861
completely nished by the time the peridotites had cooled862
to about 450°C (Saddiqi et al., 1995, Beni Bousera) and863
250°C (Feinberg et al., 1996, Ronda), respectively.864
There are, however, various observations that favour865
our interpretation of CRM's due to two serpentinization866
phases. The main reason is that some samples showed a867
very sharply separated components but others show a con-868
tinuous curvature from LT to HT component. If the acqui-869
sition mechanism was a TRM by cooling, then one would870
expect a more homogeneous behaviour: on the one hand,871
if the rotation was slow compared to the cooling time,872
one should see a curvature in the Zijderveld diagrammes873
as progressively higher temperatures should have recorded874
sequential stages of the rotation. On the other hand, if the875
rotation was fast compared to the cooling time, such a cur-876
vature should become very small (i.e. over a very narrow877
range of blocking temperatures) or completely disappear.878
Our data, however, shows both of these behaviours (com-879
pare Fig. 8a and 8b). According to the gures in Feinberg880
et al. (1996), they appearently observed a heterogeneous881
behaviour in Ronda, too. By assuming CRM to be the882
acquisition mechanism, this behaviour is easily explained:883
The two serpentinization phases (pre- and post-rotation),884
formed two dierent grain-size populations, one of them885
recording the pre-rotational and the other one recording886
the post-rotational direction. Depending on the overlap887
22

Page 24 of 37
Accep
ted
Man
uscr
ipt
of these two grain-size spectra (or equivalently blocking888
temperature spectra) one will have either overlapping di-889
rections or sharply separated directions.890
In the case of the LT and HT components, the two ser-891
pentinization phases formed very dierent grain-size pop-892
ulations (one mainly in the MD range and one mainly in893
the PSD/SD range), that in many cases did not show much894
overlap hence the components very easily isolated. On895
the other hand, in the case of the IT and HT compo-896
nents that both formed during the posterior serpentiniza-897
tion, both IT and HT components formed very similar898
grain-size spectra, but the HT component is slightly bi-899
ased towards larger grains (i.e. with higher blocking tem-900
peratures). Hence, they are strongly overlapping and not901
easily isolated.902
7.3. Palaeomagnetic directions903
Due to the existence of previous negative fold tests904
of other authors in the Beni Bousera (and also Ronda)905
peridotites (Saddiqi et al., 1995; Feinberg et al., 1996;906
Villasante-Marcos et al., 2003), we consider only in situ907
directions. As shown in those works, all the remanences908
are younger than the foliation/anticline formation. The909
negative fold test in the BB peridotites (Saddiqi et al.,910
1995), was performed using 6 sites showing a reversed, ro-911
tated component, where α95 increased from 10.3º to 22.3º912
(and k decreased from 43 to 10) after tectonic correction.913
As a rough quality control, this has been checked for the914
current study using only 4 sites from BB and SA using915
local foliation measurements. The angular dispersion of916
mean directions (Table 5) increased in both SA and BB917
after applying the tectonic correction: from 7.3 to 7.7º918
(SA) and from 25.1 to 63.7º (BB).919
7.3.1. Beni Bousera (BB)920
In the case of Beni Bousera, the samples with only one921
component showed either a non-rotated direction or a com-922
pletely dispersed direction. The dispersed directions have923
not been considered useful for palaeomagnetic purposes.924
They could be isothermal remanent magnetizations (IRM)925
that hence have not preserved their original magnetiza-926
tions. The clustering directions have probably only pre-927
served a recent (post-rotation) remanent magnetization.928
In the same way, the LT component of those samples929
with two components is probably a recent magnetization.930
LT components of these samples and the NRM of those931
samples with only one component can be considered to932
have been recorded by the same (re-)magnetization event.933
Both have been used to calculate site mean directions us-934
ing Fisher's statistics (Fisher, 1953). The mean direction935
of them is D = 2.4, I = 56.7 and α95 = 5.4°, which936
conrms that there is no vertical axis rotation nor tilting,937
as the expected declination is 0º for the last 20 Ma and938
the observed inclination coincides with the expected one939
for the last few Ma (see section 7.4). All (uncorrected)940
site mean directions are summarized in Tab. 5 plotted in941
Fig. 16.942
The HT component of samples with two components is943
likely a pre-rotation remanent magnetization. Site mean944
directions have been calculated for these samples using945
the magnetization vectors as obtained by anchored line946
ts wherever possible. In some cases the HT component947
was either too small or overlapped with the LT component,948
however. In these cases (see Fig. 17), converging remag-949
netization circles have been used to obtain an estimate of950
the HT component using the method of Kirschvink (1980)951
that combines best-t lines with best-t planes.952
Generally, HT components of a single site had the same953
polarity. The respective mean directions of normal and re-954
versed polarity sites are given in Tab. 6 along with all the955
other mean directions of the dierent components. No-956
tably, normal polarity sites have been found for the rst957
time and were roughly antipodal (i.e. westward) to the958
reversed polarity directions.959
23

Page 25 of 37
Accep
ted
Man
uscr
ipt
Site Comp. Nu/N D I α95 k
BB1 LT 8/9 358.2 65.4 6.1 83.9
BB2 LT 6/9 355.9 65.4 11.3 35.9
BB3 LT 7/8 11.4 56.4 11.4 29.0
BB4 LT 6/9 3.9 56.5 7.0 93.6
BB5 LT 7/9 7.5 50.6 12.6 23.8
BB7 LT 8/8 1.6 51.6 5.7 96.3
BB8 LT 3/8 355.7 50.4 18.6 45.1
BB1 HT 8/9 289.8 72.5 4.7 137.2
BB2 HT 4/9 269.4 65.3 13.0 51.2
BB3 HT 5/8 90.2 -62.3 15.3 26.1
BB4 HT 4/9 146.4 -49.7 54.5 3.8
BB5 HT 5/9 92.6 -64.7 22.6 12.4
BB7 HT 2/8 102.4 -36.3
BB8 HT 3/8 128.9 -48.5 22.3 31.7
SA1 LT 7/7 335.1 49.9 9.1 44.8
SA2 LT 7/9 333.1 44.1 12.7 23.6
SA3 LT 3/8 342.3 51.5 26.7 22.4
SA5 LT 6/7 343.4 42.0 19.5 12.8
SA6 LT 8/8 339.5 56.0 7.2 59.8
SA7 LT 7/8 339.5 49.0 12.2 25.3
SA8 LT 7/8 348.8 51.2 4.6 174.5
SA1 IT 1/7 205.2 -44.7
SA3 IT 3/8 166.3 -49.5 38.5 11.3
SA6 IT 2/8 223.0 -19.3
SA7 IT 3/8 175.7 -41.7 12.0 106.6
SA8 IT 5/8 200.8 -19.1 23.3 11.7
SA1 HT 2/7 356.3 31.6
SA2 HT 3/9 352.3 38.1 11.7 112.7
SA3 HT 3/8 352.8 35.0 4.1 902.0
SA5 HT 3/7 2.5 31.7 13.1 90.1
SA6 HT 4/8 352.8 46.1 13.7 45.8
SA7 HT 4/8 8.8 15.9 9.0 105.4
SA8 HT 1/8 347.3 21.0
Table 5: Summary of site mean directions (without tectonic correction).
24

Page 26 of 37
Accep
ted
Man
uscr
ipt
N
(a) BB
N
(b) SA
Figure 16: Site mean directions (without tectonic correction) of BB (a) and SA (b) sites. Squares: group 1a and LT components of group
2 (BB) and 3 (SA); circles: HT components of group 2 (BB) and 3 (SA); triangles: IT component of group 3 (SA); grey diamonds: high
temperature component from Saddiqi et al. (1995). Open symbols indicate reversed polarity, mean directions are indicated along with α95
condence levels.
25

Page 27 of 37
Accep
ted
Man
uscr
ipt
N
180 C 555 C180 C
535 C
(a) BB3
N
460 C
575 C
(b) SA5
Figure 17: Calculation of directions of the HT component that overlapped with LT (BB group 2) or IT (SA group 3), respectively, using
converging remagnetization circles. α95 circles are indicated.
7.3.2. Ceuta (SA)960
From the considerations outlined in section 5, and from961
analogy with BB, the palaeomagnetic directions of one-962
component samples of SA (in particular the clustering963
ones) are likely a recent (due to the posterior serpentiniza-964
tion phase) remanent magnetization, as is the LT compo-965
nent of SA group 3 samples. Similarly as in BB, we assume966
that directions of single component samples of SA and the967
LT component of samples with multiple components have968
recorded the same event. The six samples of that showed969
very disperse single components are again considered IRMs970
and are not been taken into account for the calculations971
of mean directions. The mean direction of LT components972
directions is D = 340.2, I = 49.2 with α95 = 4.4°.973
The IT component of SA showed in many cases a signif-974
icant overlap with one or both of the other components,975
such that no reliable direction could be obtained. Never-976
theless, 15 samples had a clear, non-overlapping IT com-977
ponent. These have been used to obtain estimates of site978
mean directions. The mean direction of all sites is then979
D = 196.6, I = −36.6° and α95 = 22.9°.980
In four cases, the HT component showed considerable981
overlap and a low signal-to-noise ratio. Therefore, con-982
verging remagnetization circles had to be used to obtain983
estimates of the HT components of these samples (see984
Fig. 17). The mean direction of the HT component of985
all sites is D = 356.4, I = 31.6 and α95 = 9.1°.986
All calculated (uncorrected) mean directions for each of987
the components are given in Tab. 6.988
7.3.3. Palaeosecular variation averaging989
Despite the limited number of sites involved, the mean990
directions listed in Tab. 6 can be regarded to suciently991
average the paleosecular variation (PSV) of the geomag-992
netic eld, because of the positive reversal tests of the IT993
and HT components, the α95-envelope reliability criteria994
26
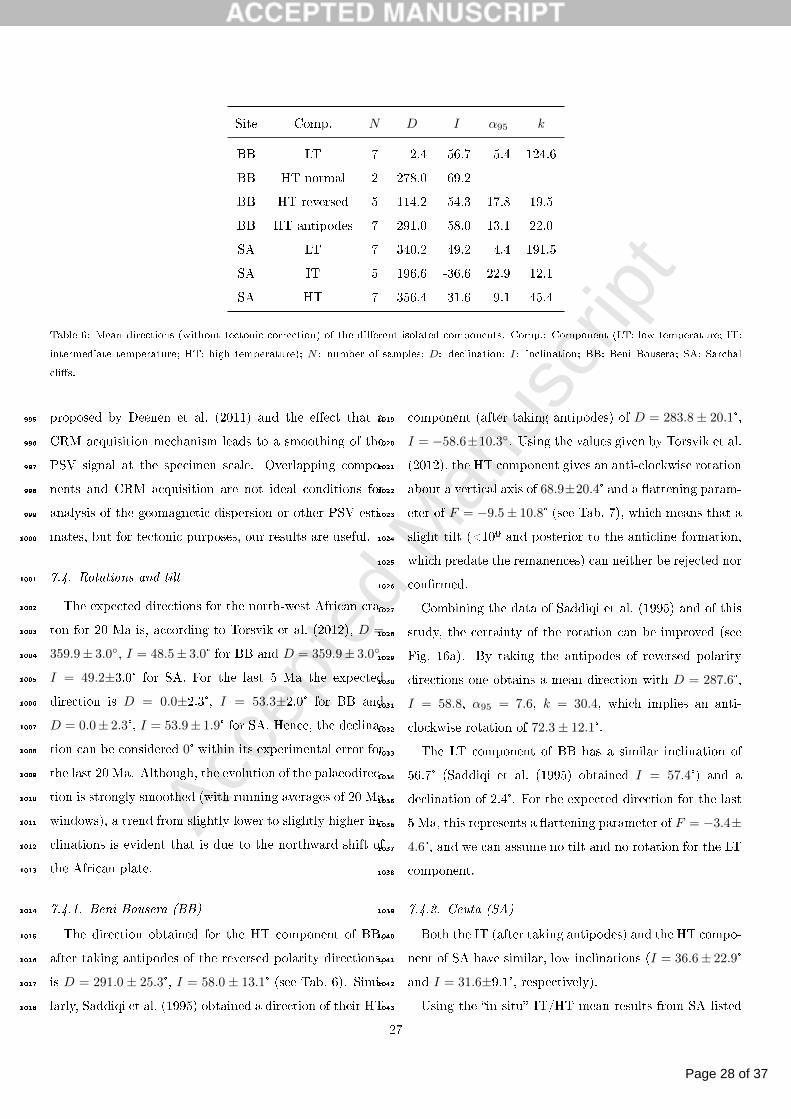
Page 28 of 37
Accep
ted
Man
uscr
ipt
Site Comp. N D I α95 k
BB LT 7 2.4 56.7 5.4 124.6
BB HT normal 2 278.0 69.2
BB HT reversed 5 114.2 -54.3 17.8 19.5
BB HT antipodes 7 291.0 58.0 13.1 22.0
SA LT 7 340.2 49.2 4.4 191.5
SA IT 5 196.6 -36.6 22.9 12.1
SA HT 7 356.4 31.6 9.1 45.4
Table 6: Mean directions (without tectonic correction) of the dierent isolated components. Comp.: Component (LT: low temperature; IT:
intermediate temperature; HT: high temperature); N : number of samples; D: declination; I: inclination; BB: Beni Bousera; SA: Sarchal
clis.
proposed by Deenen et al. (2011) and the eect that a995
CRM acquisition mechanism leads to a smoothing of the996
PSV signal at the specimen scale. Overlapping compo-997
nents and CRM acquisition are not ideal conditions for998
analysis of the geomagnetic dispersion or other PSV esti-999
mates, but for tectonic purposes, our results are useful.1000
7.4. Rotations and tilt1001
The expected directions for the north-west African cra-1002
ton for 20 Ma is, according to Torsvik et al. (2012), D =1003
359.9± 3.0, I = 48.5± 3.0° for BB and D = 359.9± 3.0,1004
I = 49.2±3.0° for SA. For the last 5 Ma the expected1005
direction is D = 0.0±2.3°, I = 53.3±2.0° for BB and1006
D = 0.0± 2.3°, I = 53.9± 1.9° for SA. Hence, the declina-1007
tion can be considered 0° within its experimental error for1008
the last 20 Ma. Although, the evolution of the palaeodirec-1009
tion is strongly smoothed (with running averages of 20 Ma1010
windows), a trend from slightly lower to slightly higher in-1011
clinations is evident that is due to the northward shift of1012
the African plate.1013
7.4.1. Beni Bousera (BB)1014
The direction obtained for the HT component of BB,1015
after taking antipodes of the reversed polarity directions,1016
is D = 291.0 ± 25.3°, I = 58.0 ± 13.1° (see Tab. 6). Simi-1017
larly, Saddiqi et al. (1995) obtained a direction of their HT1018
component (after taking antipodes) of D = 283.8 ± 20.1°,1019
I = −58.6±10.3. Using the values given by Torsvik et al.1020
(2012), the HT component gives an anti-clockwise rotation1021
about a vertical axis of 68.9±20.4° and a attening param-1022
eter of F = −9.5 ± 10.8° (see Tab. 7), which means that a1023
slight tilt (<10º and posterior to the anticline formation,1024
which predate the remanences) can neither be rejected nor1025
conrmed.1026
Combining the data of Saddiqi et al. (1995) and of this1027
study, the certainty of the rotation can be improved (see1028
Fig. 16a). By taking the antipodes of reversed polarity1029
directions one obtains a mean direction with D = 287.6°,1030
I = 58.8, α95 = 7.6, k = 30.4, which implies an anti-1031
clockwise rotation of 72.3 ± 12.1°.1032
The LT component of BB has a similar inclination of1033
56.7° (Saddiqi et al. (1995) obtained I = 57.4°) and a1034
declination of 2.4°. For the expected direction for the last1035
5 Ma, this represents a attening parameter of F = −3.4±1036
4.6°, and we can assume no tilt and no rotation for the LT1037
component.1038
7.4.2. Ceuta (SA)1039
Both the IT (after taking antipodes) and the HT compo-1040
nent of SA have similar, low inclinations (I = 36.6± 22.9°1041
and I = 31.6±9.1°, respectively).1042
Using the in situ IT/HT mean results from SA listed1043
27

Page 29 of 37
Accep
ted
Man
uscr
ipt
Site Component Data from R± ∆R F ± ∆F
BB
HT this work 68.9 ± 20.4° −9.5 ± 10.8°
HT Saddiqi et al.* 76.1 ± 16.2° −10.1 ± 8.6°
HT combined 72.3 ± 12.1° −10.1 ± 6.5°
LT this work 2.4 ± 8.1° −3.4 ± 4.6°
LT Saddiqi et al.* 1.3 ± 8.3° −4.1 ± 4.6°
SA
HT this work 3.5 ± 8.9° 17.6 ± 7.7°
IT this work −16.7 ± 23.3° 12.6 ± 18.5°
LT this work 19.7 ± 5.9° 0.0 ± 4.2°
Table 7: Rotations R (observed minus expected declinations; positive values are clockwise rotations) and attening of inclination F (expected
minus observed inclination) parameters with their condence limits (Demarest, 1983). *: The rotations of Saddiqi et al. (1995) have been
re-calculated using the expected directions from Torsvik et al. (2012).
in Table 6, a reversal test and their quality classication1044
has been performed following McFadden and McElhinny1045
(1990), giving a positive type C result. As the angle be-1046
tween the two mean directions (in the same hemisphere),1047
γO = 17.4º, is smaller than the critical angle γC = 19.6º1048
at which the hypothesis of a common mean direction for1049
the distribution would be rejected, the test is positive1050
(type C results are those where 10º < γC ≤ 20º). Hence,1051
the hypothesis of a common mean direction may not be1052
rejected at the 95-percent condence level. The antipo-1053
dal character of IT and HT mean directions do not favour1054
any interpretation involving local deformation occurring1055
between the two acquisition times.1056
We argue that the IT component recorded roughly the1057
same magnetization event, but with the opposite polarity1058
of the Earth's magnetic eld and we interpret the antipo-1059
dal mist as due to (1) an overlap of the IT component1060
with the two other components and (2) insucient averag-1061
ing of the secular variation due to the small sampling set.1062
Because of the large uncertainty of the IT component, its1063
direction will not be used in the arguments following in1064
the next section.1065
The HT component has a attening parameter of F =1066
17.6 ± 7.7° with respect to the expected direction. In dec-1067
lination, it coincides with the expected direction (at any1068
time during the last 20 Ma).1069
The LT direction of SA has a direction of D = 340.2°,1070
I = 49.2° and has therefore the expected inclination (F =1071
0.0 ± 4.2°) but is rotated about a vertical axis by 19.7 ±1072
5.9° in an anti-clockwise sense with respect to stable NW1073
Africa.1074
7.5. Palaeomagnetic constraints on timing and geody-1075
namic evolution1076
As described in section 7.2, the IT (of SA) and HT (of1077
BB and SA) components are likely due to the rst ser-1078
pentinization stage during the post-metamorphic cooling,1079
after the deformation (foliation, folded pyroxenite veins)1080
dated between 2520 Ma ago, and after the BB (undated)1081
age of folding. The LT components are likely due to a pos-1082
terior serpentinization. Then, in Beni Bousera the older1083
component (HT) is rotated, whilst the younger one (LT) is1084
present-day north, and there is no tilt appearent in neither1085
component.1086
In SA, the older HT component points north but is tilted1087
and the younger LT component is rotated about a verti-1088
cal axis but has no tilt. As the HT and IT components1089
are roughly antipodal, we argue that the IT and HT com-1090
28
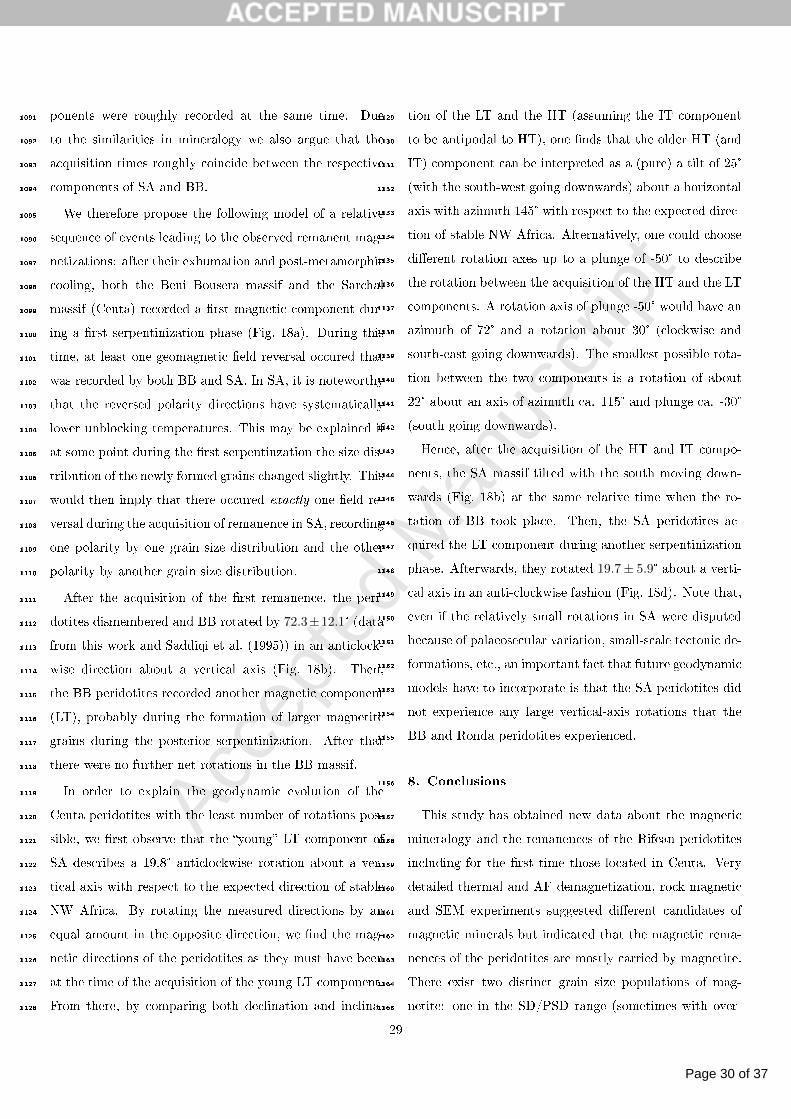
Page 30 of 37
Accep
ted
Man
uscr
ipt
ponents were roughly recorded at the same time. Due1091
to the similarities in mineralogy we also argue that the1092
acquisition times roughly coincide between the respective1093
components of SA and BB.1094
We therefore propose the following model of a relative1095
sequence of events leading to the observed remanent mag-1096
netizations: after their exhumation and post-metamorphic1097
cooling, both the Beni Bousera massif and the Sarchal1098
massif (Ceuta) recorded a rst magnetic component dur-1099
ing a rst serpentinization phase (Fig. 18a). During this1100
time, at least one geomagnetic eld reversal occured that1101
was recorded by both BB and SA. In SA, it is noteworthy1102
that the reversed polarity directions have systematically1103
lower unblocking temperatures. This may be explained if1104
at some point during the rst serpentinzation the size dis-1105
tribution of the newly formed grains changed slightly. This1106
would then imply that there occured exactly one eld re-1107
versal during the acquisition of remanence in SA, recording1108
one polarity by one grain size distribution and the other1109
polarity by another grain size distribution.1110
After the acquisition of the rst remanence, the peri-1111
dotites dismembered and BB rotated by 72.3±12.1° (data1112
from this work and Saddiqi et al. (1995)) in an anticlock-1113
wise direction about a vertical axis (Fig. 18b). Then,1114
the BB peridotites recorded another magnetic component1115
(LT), probably during the formation of larger magnetite1116
grains during the posterior serpentinization. After that1117
there were no further net rotations in the BB massif.1118
In order to explain the geodynamic evolution of the1119
Ceuta peridotites with the least number of rotations pos-1120
sible, we rst observe that the young LT component of1121
SA describes a 19.8° anticlockwise rotation about a ver-1122
tical axis with respect to the expected direction of stable1123
NW Africa. By rotating the measured directions by an1124
equal amount in the opposite direction, we nd the mag-1125
netic directions of the peridotites as they must have been1126
at the time of the acquisition of the young LT component.1127
From there, by comparing both declination and inclina-1128
tion of the LT and the HT (assuming the IT component1129
to be antipodal to HT), one nds that the older HT (and1130
IT) component can be interpreted as a (pure) a tilt of 25°1131
(with the south-west going downwards) about a horizontal1132
axis with azimuth 145° with respect to the expected direc-1133
tion of stable NW Africa. Alternatively, one could choose1134
dierent rotation axes up to a plunge of -50° to describe1135
the rotation between the acquisition of the HT and the LT1136
components. A rotation axis of plunge -50° would have an1137
azimuth of 72° and a rotation about 30° (clockwise and1138
south-east going downwards). The smallest possible rota-1139
tion between the two components is a rotation of about1140
22° about an axis of azimuth ca. 115° and plunge ca. -30°1141
(south going downwards).1142
Hence, after the acquisition of the HT and IT compo-1143
nents, the SA massif tilted with the south moving down-1144
wards (Fig. 18b) at the same relative time when the ro-1145
tation of BB took place. Then, the SA peridotites ac-1146
quired the LT component during another serpentinization1147
phase. Afterwards, they rotated 19.7 ± 5.9° about a verti-1148
cal axis in an anti-clockwise fashion (Fig. 18d). Note that,1149
even if the relatively small rotations in SA were disputed1150
because of palaeosecular variation, small-scale tectonic de-1151
formations, etc., an important fact that future geodynamic1152
models have to incorporate is that the SA peridotites did1153
not experience any large vertical-axis rotations that the1154
BB and Ronda peridotites experienced.1155
8. Conclusions1156
This study has obtained new data about the magnetic1157
mineralogy and the remanences of the Rifean peridotites1158
including for the rst time those located in Ceuta. Very1159
detailed thermal and AF demagnetization, rock magnetic1160
and SEM experiments suggested dierent candidates of1161
magnetic minerals but indicated that the magnetic rema-1162
nences of the peridotites are mostly carried by magnetite.1163
There exist two distinct grain size populations of mag-1164
netite: one in the SD/PSD range (sometimes with over-1165
29

Page 31 of 37
Accep
ted
Man
uscr
ipt
(a) Exhumation of the SA, BB and Ronda peridotites, followed by cooling, serpentinization, deformation,
formation of SD magnetite grains and acquisition of a high and intermediate temperature CRM (younger
than the 20-25 Ma foliation ages and spanning periods of normal and reversed polarities).
(b) Dismembering and large vertical-axis rotations (anticlockwise in BB and clockwise in Ronda) and tilt
(SA, the horizontal axis of this rotation is indicated in the equal area diagramme).
(c) Another serpentinization, formation of MD magnetite grains and acquisition of a low temperature CRM
(covering only a normal polarity period).
(d) Small anticlockwise rotation of SA. Note that the nal stage correspoonds with in situ observed directions.
Figure 18: Schematic diagrammes of the net rotations proposed for the Ceuta and Beni Bousera peridotites in successive stages. The boxes
represent the Ceuta (SA), the Beni Bousera (BB) and the Ronda peridotites (note that the boxes do not indicate any accurate geographical
location). The acquisition and in-situ rotations of the magnetic LT (blue squares), IT (yellow triangles) and HT (red circles) components.
30

Page 32 of 37
Accep
ted
Man
uscr
ipt
lapping reversed and normal polarities) and one in the MD1166
range (always normal polarity) that carry dierent direc-1167
tional components. Hence, contrary to earlier studies in1168
BB, the mechanism of remanence acquisition of all the1169
magnetic components in both the BB and SA peridotites1170
is most likely a CRM (note that the serpentinization pro-1171
cesses causing a CRM are beyond the scope of this palaeo-1172
magnetic study).1173
Integrating the results of the all the experiments, a se-1174
quence of geodynamic stages can be inferred (note that1175
we cannot infer any longitudinal or latitudinal constrains1176
paleomagnetically, but only rotations):1177
1. A rst remanent magnetization, of both normal and1178
reversed polarities, was acquired by the BB and SA1179
peridotites by the formation of SD/PSD magnetite1180
grains during a serpentinization phase after their ex-1181
humation and subsequent cooling (postdating high1182
temperature deformation and the age of folding of the1183
BB anticline) about 20 Ma ago.1184
2. After their dismembering, the Ceuta peridotites, un-1185
like their BB and Ronda counterparts, were tilted1186
by some 22-30°, south moving downwards. The Beni1187
Bousera peridotites were rotated anticlockwise by 72.31188
± 12.1° about a vertical axis. The reliability of this1189
rotation has been improved in this study by the rst1190
observation of normal polarity directions of the older1191
HT component of BB. Moreover, whilst a TRM as1192
the mechanism of remanence acquisition, as was sug-1193
gested in earlier works, would imply a rapid rota-1194
tion of BB that took only two consecutive subchrons1195
and was completely nished by the end of the post-1196
metamorphic cooling (16 Ma), our interpretation as a1197
CRM favour a rotation posterior to the serpentiniza-1198
tion of the post-metamorphic cooling and does not1199
require such a fast rotation.1200
3. At a later stage, both SA and BB recorded another1201
magnetic signal of normal polarity only, carried by1202
multi-domain magnetite grains. This is the only tim-1203
ing constraint of the rotation of BB (contrary to the1204
earlier TRM interpretation).1205
4. Finally, the Ceuta peridotites rotated anticlockwise1206
by 19.7 ± 5.9° about a vertical axis. It is noteworthy1207
that this rotation was (1) much smaller than the rota-1208
tions found in Beni Bousera and Ronda (see sections1209
1.3) and (2) have taken place at a later stage than1210
those at the other sites (if one assumes that stage1211
three is roughly coeval for the three bodies).1212
The new palaeomagnetic data of the Ceuta and the Beni1213
Bousera peridotites that have been found in this study1214
are constraints that need to be incorporated in any geody-1215
namic model of the evolution of the Betic-Rifean mountain1216
belt.1217
9. Acknowledgments1218
We are thankful for the nancial support from the1219
Spanish projects PR27/05-13936-BSCH, CGL2009-10840,1220
CGL2011-29474-C02-01 and CGL2012-38481. VCRM is1221
especially grateful to his colleagues D. García, F.J. Pavón,1222
G. McIntosh, V. Villasante and I. Palencia for their geolog-1223
ical guidance and assistance during eldwork. We would1224
also like to express our gratitude to A. Crespo Blanc and1225
M. Maone, whose various comments have greatly im-1226
proved this work.1227
Ari, A., Gueydan, F., Pitra, P., Essai, A., Précigout, J., 2011.1228
Oligo-miocene exhumation of the beni-bousera peridotite through1229
a lithosphere-scale extensional shear zone. Geodinamica Acta1230
24 (1), 4960.1231
Allerton, S., Lonergan, L., Platt, J., Platzman, E., McClelland, E.,1232
1993. Palaeomagnetic rotations in the eastern betic cordillera,1233
southern spain. Earth and Planetary Science Letters 119 (3), 2251234
241.1235
Andrieux, J., Fontbote, J.-M., Mattauer, M., 1971. Sur un modèle1236
explicatif de l'arc de gibraltar. Earth and Planetary Science Let-1237
ters 12 (2), 191198.1238
Balanyá, J., García-Dueñas, V., 1987. Les directions structurales1239
dans le domaine d'alborán de part et d'autre du détroit de gibral-1240
tar. Comptes rendus de l'Académie des sciences. Série 2, Mé-1241
canique, Physique, Chimie, Sciences de l'univers, Sciences de la1242
Terre 304 (15), 929932.1243
31

Page 33 of 37
Accep
ted
Man
uscr
ipt
Barberá, X., Cabrera, L., Gomis, E., Parés, J., 1996. Determinación1244
del polo paleomagnético para el límite oligoceno-mioceno en la1245
cuenca del ebro. Geogaceta 20 (5), 10141016.1246
Calvo, M., Cuevas, J., Tuba, J., 2001. Preliminary palaeomag-1247
netic results on oligoceneearly miocene mac dykes from south-1248
ern spain. Tectonophysics 332 (3), 333345.1249
Calvo, M., Osete, M. L., Vegas, R., 1994. Palaeomagnetic rotations in1250
opposite senses in southeastern spain. Geophysical research letters1251
21 (9), 761764.1252
Calvo, M., Vegas, R., Osete, M. L., 1997. Palaeomagnetic results1253
from upper miocene and pliocene rocks from the internal zone1254
of the eastern betic cordilleras (southern spain). Tectonophysics1255
277 (4), 271283.1256
Chalouan, A., Michard, A., 2004. The alpine rif belt (morocco): a1257
case of mountain building in a subduction-subduction-transform1258
fault triple junction. Pure and applied Geophysics 161 (3), 4891259
519.1260
Chalouan, A., Michard, A., El Kadiri, K., Negro, F., Frizon de Lam-1261
otte, D., J.I., S., Saddiqi, O., 2008. The rif belt. In: Michard, A.,1262
Saddiqi, O., Chalouan, A., de Lamotte, D. F. (Eds.), Continen-1263
tal Evolution: The Geology of Morocco: Structure, Stratigraphy,1264
and Tectonics of the Africa-Atlantic-Mediterranean Triple Junc-1265
tion. Springer.1266
Cifelli, F., Mattei, M., Porreca, M., 2008. New paleomagnetic data1267
from oligoceneupper miocene sediments in the rif chain (northern1268
morocco): Insights on the neogene tectonic evolution of the gibral-1269
tar arc. Journal of Geophysical Research: Solid Earth (19782012)1270
113 (B2).1271
Day, R., Fuller, M., Schmidt, V., 1977. Hysteresis properties1272
of titanomagnetites: grain-size and compositional dependence.1273
Physics of the Earth and Planetary Interiors 13 (4), 260267.1274
Deenen, M. H., Langereis, C. G., van Hinsbergen, D. J., Biggin, A. J.,1275
2011. Geomagnetic secular variation and the statistics of palaeo-1276
magnetic directions. Geophysical Journal International 186 (2),1277
509520.1278
Demarest, H. H., 1983. Error analysis for the determination of tec-1279
tonic rotation from paleomagnetic data. Journal of Geophysical1280
Research: Solid Earth (19782012) 88 (B5), 43214328.1281
Dunlop, D., Özdemir, Ö., 1997. Rock Magnetism: Fundamentals and1282
Frontiers. Cambridge Studies in Magnetism. Cambridge Univer-1283
sity Press.1284
Dunlop, D., Özdemir, O., 2009. Magnetizations in rocks and miner-1285
als. In: Kono, M. (Ed.), Geomagnetism: treatise on geophysics.1286
Dunlop, D. J., 2002a. Theory and application of the day plot (mrs/ms1287
versus hcr/hc) 1. theoretical curves and tests using titanomag-1288
netite data. Journal of Geophysical Research 107 (B3), 2056.1289
Dunlop, D. J., 2002b. Theory and application of the day plot1290
(mrs/ms versus hcr/hc) 2. application to data for rocks, sedi-1291
ments, and soils. Journal of Geophysical Research: Solid Earth1292
(19782012) 107 (B3), EPM5.1293
Feinberg, H., Saddiqi, O., Michard, A., 1996. New constraints on the1294
bending of the gibraltar arc from palaeomagnetism of the ronda1295
peridotites (betic cordilleras, spain). Geological Society, London,1296
Special Publications 105 (1), 4352.1297
Fisher, R., 1953. Dispersion on a sphere. Proceedings of the Royal1298
Society of London. Series A. Mathematical and Physical Sciences1299
217 (1130), 295305.1300
Frizon de Lamotte, D., Andrieux, J., Guezou, J.-C., 1991. Cinema-1301
tique des chevauchements neogenes dans l'arc betico-rifain; dis-1302
cussion sur les modeles geodynamiques. Bulletin de la Société1303
géologique de France 162 (4), 611626.1304
Gysi, A. P., Jagoutz, O., Schmidt, M. W., Targuisti, K., 2011. Pet-1305
rogenesis of pyroxenites and melt inltrations in the ultramac1306
complex of beni bousera, northern morocco. Journal of Petrology1307
52 (9), 16791735.1308
Halls, H. C., 1976. A least-squares method to nd a remanence direc-1309
tion from converging remagnetization circles. Geophysical Journal1310
of the Royal Astronomical Society 45 (2), 297304.1311
URL http://dx.doi.org/10.1111/j.1365-246X.1976.tb00327.x1312
Jasonov, P., Nourgaliev, D., Burov, B., Heller, F., 1998. A modern-1313
ized coercivity spectrometer. Geol. Carpathica 49, 224226.1314
Kirschvink, J., 1980. The least-squares line and plane and the anal-1315
ysis of palaeomagnetic data. Geophysical Journal International1316
62 (3), 699718.1317
Kornprobst, J., 1969. Le massif ultrabasique de beni bousera (rif1318
interne, maroc): Étude des péridotites de haute température et1319
de haute pression, et des pyroxénolites, à grenat ou sans grenat,1320
qui leur sont associées. Contributions to Mineralogy and Petrology1321
23, 283322.1322
Krijgsman, W., Garces, M., 2004. Palaeomagnetic constraints on the1323
geodynamic evolution of the gibraltar arc. Terra Nova 16 (5), 2811324
287.1325
Lonergan, L., White, N., 1997. Origin of the betic-rif mountain belt.1326
Tectonics 16 (3), 504522.1327
Loomis, T., 1975. Tertiary mantle diapirism, orogeny and plate tec-1328
tonics east of the strait of gibraltar. Am. J. Sci. 275 (1), 130.1329
Maone, M., Morris, A., Plümper, O., van Hinsbergen, D. J., 2014.1330
Magnetic properties of variably serpentinized peridotites and their1331
implication for the evolution of oceanic core complexes. Geochem-1332
istry, Geophysics, Geosystems.1333
Martin-Hernandez, F., Ferre, E., Belley, F., Ruiz-Martinez, V., Gar-1334
rido, C., Osete, M., 2009. Magnetic signature and fabric of serpen-1335
tinized mantle rocks in the betic-rif arc and tectonic implications.1336
In: AGU Spring Meeting Abstracts. Vol. 1. p. 04.1337
Mattei, M., Cifelli, F., Rojas, I. M., Crespo Blanc, A., Comas, M.,1338
Faccenna, C., Porreca, M., 2006. Neogene tectonic evolution of1339
32

Page 34 of 37
Accep
ted
Man
uscr
ipt
the gibraltar arc: New paleomagnetic constrains from the betic1340
chain. Earth and Planetary Science Letters 250 (3), 522540.1341
McFadden, P., McElhinny, M., 1990. Classication of the rever-1342
sal test in palaeomagnetism. Geophysical Journal International1343
103 (3), 725729.1344
Michard, A., Chalouan, A., Feinberg, H., Goé, B., Montigny, R.,1345
2002. How does the alpine belt end between spain and morocco?1346
Bulletin de la Société géologique de France 173 (1), 315.1347
Michard, A., Chalouan, A., Montigny, R., Ouazzani-Touhami, M.,1348
1983. Les nappes cristallophylliennes du rif (sebtides, maroc), té-1349
moins d'un édice alpin de type pennique incluant le manteau1350
supérieur. CR Acad. Sci., Ser. II 296, 13371340.1351
Michard, A., Goe, B., Bouybaouene, M., Saddiqi, O., 1997. Late1352
hercynianmesozoic thinning in the alboran domain: metamor-1353
phic data from the northern rif, morocco. Terra Nova 9 (4), 1711354
174.1355
Monié, P., Galindo-Zaldivar, J., Loderio, F., Goe, B., Jabaloy, A.,1356
1991. 40ar/39ar geochronology of alpine tectonism in the betic1357
cordilleras (southern spain). Journal of the Geological Society1358
148 (2), 289297.1359
Najid, D., Westphal, M., Hernandez, J., 1981. Paleomagnetism of1360
quaternary and miocene lavas from north-east and central mo-1361
rocco. J. Geophys 49, 149152.1362
Osete, M., Freeman, R., Vegas, R., 1988. Preliminary palaeomagnetic1363
results from the subbetic zone (betic cordillera, southern spain):1364
kinematic and structural implications. Physics of the earth and1365
planetary interiors 52 (3), 283300.1366
Osete, M., Freeman, R., Vegas, R., 1989. Palaeomagnetic evidence1367
for block rotations and distributed deformation of the iberian-1368
african plate boundary. In: Paleomagnetic rotations and conti-1369
nental deformation. Springer, pp. 381391.1370
Osete, M., Villalaín, J., Palencia, A., Osete, C., Sandoval, J.,1371
DUENas, V. G., 2004. New palaeomagnetic data from the betic1372
cordillera: constraints on the timing and the geographical distri-1373
bution of tectonic rotations in southern spain. In: Geodynamics1374
of Azores-Tunisia. Springer, pp. 701722.1375
Platt, J., Vissers, R., 1989. Extensional collapse of thickened conti-1376
nental lithosphere: A working hypothesis for the alboran sea and1377
gibraltar arc. Geology 17 (6), 540543.1378
Platt, J. P., Behr, W. M., Johanesen, K., Williams, J. R., 2013. The1379
betic-rif arc and its orogenic hinterland: A review. Annual Review1380
of Earth and Planetary Sciences 41, 313357.1381
Platzman, E., 1992. Paleomagnetic rotations and the kinematics of1382
the gibraltar arc. Geology 20 (4), 311314.1383
Platzman, E., Lowrie, W., 1992. Paleomagnetic evidence for rotation1384
of the iberian peninsula and the external betic cordillera, southern1385
spain. Earth and planetary science letters 108 (1), 4560.1386
Platzman, E., Platt, J., Olivier, P., 1993. Palaeomagnetic rotations1387
and fault kinematics in the rif arc of morocco. Journal of the1388
Geological Society 150 (4), 707718.1389
Reuber, I., Michard, A., Chalouan, A., Juteau, T., Jermoumi, B.,1390
1982. Structure and emplacement of the alpine-type peridotites1391
from beni bousera, rif, morocco: a polyphase tectonic interpreta-1392
tion. Tectonophysics 82 (3), 231251.1393
Rochette, P., Fillion, G., Mattéi, J.-L., Dekkers, M. J., 1990. Mag-1394
netic transition at 3034 kelvin in pyrrhotite: insight into a1395
widespread occurrence of this mineral in rocks. Earth and Plane-1396
tary Science Letters 98 (3), 319328.1397
Saddiqi, O., Feinberg, H., El Azzab, D., Michard, A., 1995. Paléo-1398
magnétisme des péridotites des beni bousera (rif interne, maroc):1399
conséquences pour l'évolution miocène de l'arc de gibraltar. C. R.1400
Acad. Sci. 321, 361368.1401
Sánchez-Gómez, M., Dueñas, V. G., Muñoz, M., Balanyá, J. C.,1402
1995. Relación estructural entre los cuerpos peridotíticos situados1403
al norte y al sur del estrecho de gibraltar. Geogaceta 17 (17),1404
135137.1405
Sánchez-Rodríguez, L., Gebauer, D., 2000. Mesozoic formation of1406
pyroxenites and gabbros in the ronda area (southern spain), fol-1407
lowed by early miocene subduction metamorphism and emplace-1408
ment into the middle crust: Upb sensitive high-resolution ion1409
microprobe dating of zircon. Tectonophysics 316 (1), 1944.1410
Seidemann, D. E., 1976. An 40ar/39ar age spectrum for a cordierite-1411
bearing rock: Isolating the eects of excess radiogenic 40ar. Earth1412
and Planetary Science Letters 33 (2), 268272.1413
Torsvik, T. H., Van der Voo, R., Preeden, U., Mac Niocaill, C., Stein-1414
berger, B., Doubrovine, P. V., van Hinsbergen, D. J., Domeier,1415
M., Gaina, C., Tohver, E., et al., 2012. Phanerozoic polar wander,1416
palaeogeography and dynamics. Earth-Science Reviews.1417
Villalaín, J., Osete, M., Vegas, R., García-Dueñas, V., Heller, F.,1418
1994. Widespread neogene remagnetization in jurassic limestones1419
of the south-iberian palaeomargin (western betics, gibraltar arc).1420
Physics of the earth and planetary interiors 85 (1), 1533.1421
Villalaín, J., Osete, M., Vegas, R., García-Dueñas, V., Heller, F.,1422
1996. The neogene remagnetization in the western betics: a brief1423
comment on the reliability of palaeomagnetic directions. Geologi-1424
cal Society, London, Special Publications 105 (1), 3341.1425
Villasante-Marcos, V., Osete, M., Gervilla, F., Garca-Duenas,1426
V., 2003. Palaeomagnetic study of the ronda peridotites (betic1427
cordillera, southern spain). Tectonophysics 377 (1), 119141.1428
Zeck, H. P., Monié, P., Villa, I. M., Hansen, B. T., 1992. Very high1429
rates of cooling and uplift in the alpine belt of the betic cordilleras,1430
southern spain. Geology 20 (1), 7982.1431
10. Appendix1432
33

Page 35 of 37
Accep
ted
Man
uscr
ipt
Position Sample Fe Mg Si O Ni Al S Cr Co Ca Cu Ti Mn Cl
1 BB5-6B 9.8 11.3 1.3 41.9 19.8 15.8 0.2
2 BB5-6B 5.8 11.6 47.3 22.8 12.5
3 BB5-6B 1.1 15.8 6.4 24.5 0.3 3.3 48.7
4 BB5-6B 32.1 20.9 47.0
5 BB5-6B 3.7 23.2 16.2 54.6 0.9 1.5
6 BB5-6B 46.0 2.4 2.1 49.7
7 BB5-6B 52.0 0.6 47.4
8 BB5-6B 6.1 11.6 47.5 24.5 10.4
9 BB5-6B 37.4 2.5 47.2 0.3 0.9 11.6
10 BB4-2B 2.1 24.8 17.9 53.0 2.3
11 BB4-2B 8.3 22.7 11.4 45.9 4.7 2.1 5.0
12 BB4-2B 4.8 24.8 13.2 49.9 6.8 0.2 0.4
13 SA2-3A 24.3 12.6 11.6 3.5 35.5 12.5
14 SA2-3A 27.8 25.7 46.5
15 SA2-3A 8.4 50.2 41.4 * ** 0.0
16 SA2-3A 5.8 44.3 49.3 * 0.6 **
17 SA2-3A 26.1 0.7 0.5 27.5 45.3
18 SA2-3A 26.3 28.2 45.5
19 SA2-3A 94.4 1.2 1.8 ? 2.6 **
20 SA2-3A 82.8 6.6 4.1 ? 6.5 **
21 SA2-3A 55.3 25.9 18.3 * 0.5
22 SA2-3A 46.1 2.0 1.2 47.9 0.4 1.0 1.0 0.4
23 SA2-3A 24.9 0.5 27.6 47.0
24 SA2-3A 30.2 8.2 0.5 43.7 14.3 3.1
25 SA8-3A 36.5 5.0 2.6 47.7 4.2 3.3 0.7
26 SA8-3A 13.0 0.6 0.8 31.5 53.6 0.4
27 SA8-3A 17.5 9.1 9.7 43.0 3.5 14.1 1.6 1.6
28 SA8-3A 34.0 9.7 6.1 50.2
29 SA8-3A 7.6 18.1 11.7 37.5 9.1 16.1
30 SA8-3A 54.0 0.7 45.3
Table 8: Atomic percentages of the elements from the EDX analyses of the SA samples. *: Oxygen present but the amount has not been
calculated; **: Small amount is possibly present but has not been calculated; ?: Presence or absence of oxygen unknown.
34

Page 36 of 37
Accep
ted
Man
uscr
ipt
Position Sample Grain size Major elements Mineral
1 BB5-6B 10 µm Fe, Mg, O, Al, Cr Chromitea
2 BB5-6B 500 µm Fe, Mg, O, Al, Cr Chromitea
3 BB5-6B 10 µm Cu, Mg, O CuO + ...
4 BB5-6B 50 µm Fe, Ni, S Pentlandite
5 BB5-6B < 1 µm Mg, Si, O Forsterite
6 BB5-6B 10 µm Fe, O Magnetite
7 BB5-6B 10 µm Fe, O Wüstite
8 BB5-6B 50 µm Al, Mg, O, Cr Pyroxene/Chromite
9 BB5-6B 5 µm Fe, O, Cr Magnetite/Chromite
10 BB4-2B 10 µm Mg, Si, O Forsterite
11 BB4-2B 1 µm Mg, Si, O Forsterite
12 BB4-2B 1 µm Mg, Si, O Forsterite
13 SA2-3A 100 µm Fe, Ni, S, Cu, O Pentlandite + CuO
14 SA2-3A 50 µm Fe, Ni, S Pentlandite
15 SA2-3A 100 µm Fe, Mg, Si, O* Pyroxene/Olivine
16 SA2-3A matrix Mg, Si, O* Pyroxene/Olivine
17 SA2-3A 10 µm Fe, Ni, S Pentlandite
18 SA2-3A 10 µm Fe, Ni, S Pentlandite
19 SA2-3A 10 µm Fe, O* Magnetite/Hematite
20 SA2-3A 10 µm Fe, O* Magnetite/Hematite
21 SA2-3A 10 µm Fe, Mg, Si, O* Olivineb
22 SA2-3A 5 µm Fe, O Wüstite
23 SA2-3A 10 µm Fe, Ni, S Pentlandite
24 SA2-3A 10 µm Fe, O, Al Magnetite/Hematitea
25 SA8-3A 10 µm Fe, O Magnetite/Hematite
26 SA8-3A 10 µm Fe, Ni, S Pentlandite
27 SA8-3A 10 µm Fe, Mg, Si, O, Cr Fayalitec
28 SA8-3A 5 µm Fe, Mg, Si, O Magnetite/Hematite
29 SA8-3A 1 µm Fe, Mg, Si, O, Ni, S Pentlandite
30 SA8-3A 50 µm Fe, O Wüstite
Table 9: Overview of the minerals that have been analysed with their possible identication. *: see note of Tab. 8, a: Contains substantial
amounts of Al, b: Contains substantial amounts of Fe, c: Contains substantial amounts of Cr.
35

Page 37 of 37
Accep
ted
Man
uscr
ipt
N
(a) BB
N
(b) SA
Figure 19: Magnetic directions below 180°C (BB) and 100°C (SA). Mean directions and α95 condence levels are indicated.
36