Embed Size (px)
Citation preview
Full Terms & Conditions of access and use can be found athttp://www.tandfonline.com/action/journalInformation?journalCode=hdvn20
Download by: [University of Connecticut] Date: 22 December 2016, At: 10:15
Developmental Neuropsychology
ISSN: 8756-5641 (Print) 1532-6942 (Online) Journal homepage: http://www.tandfonline.com/loi/hdvn20
Neurophysiology of Speech Differences inChildhood Apraxia of Speech
Jonathan L. Preston, Peter J. Molfese, Nina Gumkowski, Andrea Sorcinelli,Vanessa Harwood, Julia R. Irwin & Nicole Landi
To cite this article: Jonathan L. Preston, Peter J. Molfese, Nina Gumkowski, Andrea Sorcinelli,Vanessa Harwood, Julia R. Irwin & Nicole Landi (2014) Neurophysiology of Speech Differencesin Childhood Apraxia of Speech, Developmental Neuropsychology, 39:5, 385-403, DOI:10.1080/87565641.2014.939181
To link to this article: http://dx.doi.org/10.1080/87565641.2014.939181
View supplementary material
Published online: 04 Aug 2014.
Submit your article to this journal
Article views: 491
View related articles
View Crossmark data
Citing articles: 2 View citing articles
DEVELOPMENTAL NEUROPSYCHOLOGY, 39(5), 385–403Copyright © 2014 Taylor & Francis Group, LLCISSN: 8756-5641 print / 1532-6942 onlineDOI: 10.1080/87565641.2014.939181
Neurophysiology of Speech Differences in ChildhoodApraxia of Speech
Jonathan L. PrestonHaskins Laboratories, New Haven, Connecticut, and Department of Communication Disorders,
Southern Connecticut State University, New Haven, Connecticut
Peter J. Molfese and Nina GumkowskiHaskins Laboratories, New Haven, Connecticut
Andrea SorcinelliDepartment of Psychology, New York University, New York, New York
Vanessa HarwoodHaskins Laboratories, New Haven, Connecticut, and Department of Speech, Language &
Hearing Sciences, University of Connecticut, Storrs, Connecticut
Julia R. IrwinHaskins Laboratories, New Haven, Connecticut, and Department of Psychology, Southern
Connecticut State University, New Haven, Connecticut
Nicole LandiHaskins Laboratories, New Haven, Connecticut, and Department of Psychology,
University of Connecticut, Storrs, Connecticut
Event-related potentials (ERPs) were recorded during a picture naming task of simple and com-plex words in children with typical speech and with childhood apraxia of speech (CAS). Resultsreveal reduced amplitude prior to speaking complex (multisyllabic) words relative to simple (mono-syllabic) words for the CAS group over the right hemisphere during a time window thought to reflectphonological encoding of word forms. Group differences were also observed prior to production ofspoken tokens regardless of word complexity during a time window just prior to speech onset (thoughtto reflect motor planning/programming). Results suggest differences in pre-speech neurolinguisticprocesses.
Correspondence should be addressed to Jonathan L. Preston, Haskins Laboratories, 300 George Street, Suite 900,New Haven, CT 06511. E-mail: [email protected]
386 PRESTON ET AL.
Childhood apraxia of speech (CAS) is a subtype of speech sound disorder that impacts speechintelligibility through impaired precision and consistency of speech sounds. CAS is characterizedby disrupted transitions between sounds and impairments in prosodic elements of speech such aslexical stress (ASHA, 2007). One manifestation of CAS is significant breakdown in the preci-sion of speech as words become increasingly complex (e.g., increased number of phonemes andsyllables). Although CAS is believed to have a neurobiological basis that results in an impairedability to plan and/or program the movements for speech (ASHA, 2007), there is currently littleunderstanding of the neurobiological foundation of the core deficits in producing complex wordforms and planning and programming movements. CAS is often identified in early childhood butsymptoms can remain well into school age or even adulthood, and there may be lasting impactson social, academic, and communicative success. Treatment outcomes remain less than optimal,reflecting a lack of understanding of the underlying neurolinguistic mechanisms for CAS. Muchbehavioral research has been conducted on CAS, but few studies have addressed neurobiologicalfoundations of the disorder. The present study aims to characterize the neurobiological basis ofdifferences in generating simple and complex word forms and preparing articulatory movementsin school-age children with CAS.
One clinical characteristic of CAS is a breakdown in speech accuracy as words becomeincreasingly complex, and this construct is often evaluated as part of diagnostic protocols inresearch and in clinical practice (Forrest, 2003; Lewis et al., 2004; Shriberg et al., 2010; Strand,McCauley, Weigand, Stoeckel, & Baas, 2013). Complex word forms can be difficult for chil-dren with CAS to produce, especially when challenging syllable structures such as consonantsequences are attempted (Crary, 1984; Maassen, Nijland, & Van Der Meulen, 2001). In par-ticular, multisyllabic utterances are commonly in error among children with CAS, with errorsencompassing omissions, substitutions, additions and distortions of sounds, lexical stress errors,and sound sequencing errors (Crary, 1984; Lewis, Freebairn, Hansen, Iyengar, & Taylor, 2004;Nijland et al., 2003; Peter, Button, Stoel-Gammon, Chapman, & Raskind, 2013; Shriberg et al.,2003; Velleman & Shriberg, 1999). Hence, errors in phonological and phonetic output becomeincreasingly apparent as children with CAS generate longer phoneme sequences and plan theassociated movements.
Numerous processes are involved prior to speech production, and the descriptions of those pro-cesses vary among researchers. In general, after a word is retrieved from the lexicon, phonologicalstages occur prior to phonetic stages. Phonological stages involve selection and retrieval ofphonological representations as well as assembling/ordering phonological elements within aframe, and specifying lexical stress. Therefore, phonological stages encode the length, com-plexity, and prosody of the utterance, and these stages may be vulnerable to disruption in CAS(Shriberg, Lohmeier, Strand, & Jakielski, 2012). Phonological stages are followed by phoneticprocesses of motor planning and programming (or “transcoding,” cf. Shriberg et al., 2012).Motor planning involves generating the movement goals for a selected word or utterance (vander Merwe, 2008), and it requires specifying the general spatial and temporal parameters asso-ciated with targeted articulatory movements. After the motor plan has been constructed, motorprogramming ensues by specifying how the movement goal will be achieved; motor programminginvolves selecting and communicating with motor units that can accomplish the plan. Childrenwith CAS may have difficulty with either or both of these phonetic processes (Crary, 1984;Maassen et al., 2001; Nijland & Maassen, 2003; Nijland et al., 2002; Shriberg et al., 2012).However, differences related to phonological and phonetic processes are difficult to infer simply
NEUROPHYSIOLOGY IN CAS 387
by listening to children’s speech. The present study seeks to identify objective, brain-basedmarkers of these differences in children with CAS.
Picture naming is a common paradigm used during assessment and treatment of CAS.Levelt, Indefrey and colleagues (Indefrey, 2011; Indefrey & Levelt, 2004; Levelt, 1999; Levelt,Praamstra, Meyer, Helenius, & Salmelin, 1998; Levelt, Roelofs, & Meyer, 1999) have outlined aWord Production Model (WPM) that specifies the general time course of the psycholinguistic pro-cesses (and, to some degree, the associated neurolinguistic processes) revealed by picture namingstudies of typically speaking adults. Although exact ranges of time windows may vary somewhatdepending on the nature of the lexical items, participant characteristics, and so on some generalprinciples have been identified in the WPM. The first approximately 175 msec after a picture ispresented are generally associated with visual processing of the picture. This stage is followedby selection of the lexical item, which may occur from approximately 175–275 msec post pictureonset. These early processes are not hypothesized to be impaired in CAS. However, subsequentprocesses in the phonological stages are thought to involve phonological retrieval (approximately275–350 msec post picture onset) followed by syllabification (approximately 350–475 msec postpicture onset), which involves combining phonemes into syllables and assigning stress patterns.This syllabification process is likely to begin soon after the first sounds are retrieved, with syllabi-fication of initial sounds and syllables perhaps occurring before the final sounds are retrieved, andthus syllabification of early sounds may overlap with the phonological retrieval of later soundsin words (Indefrey, 2011). The syllabification process generally involves constructing the framefrom which the motor plan is generated, which will differ depending on the complexity of theutterance.
The WPM identifies phonetic encoding as the final stage just prior to articulatory movement(approximately 475–600 msec post picture onset) in which messages are transmitted to mus-cle groups; this phase could also be characterized as motor planning and programming. Motorplanning may overlap in time with syllabification, as the plan for early parts of a word maybe initiated while later parts of the word are still being assembled (Meyer, Roelofs, & Levelt,2003). Although the WPM may over-simplify the complex processes involved in lexical accessand speech production (e.g., it fails to identify feed-back processes), several decades of bothbehavioral and neuroimaging studies of adults support the general ordering of processes andthe temporal windows associated with picture naming (Indefrey, 2011; Indefrey & Levelt, 2004;Levelt, 1999; Levelt et al., 1999). We assume that children would follow a similar ordering ofprocesses, although children’s naming latencies may be slightly delayed relative to adults. Theneural differences in phonological and phonetic processes in children with CAS would thereforebe expected to emerge in a picture naming task around 350 msec after the picture is presented butbefore speech production occurs (i.e., during syllabification processes in the phonological stage,and during planning and programming in the phonetic stages).
The functional neurobiology of speech planning and programming differences in CAS has notbeen well explored. Functional magnetic resonance imaging (fMRI) data have been reportedon a speech production task in one family with a genetic mutation causing CAS, and thesedata suggest widespread differences in cortical and subcortical speech production networks.Liégeois et al. (2003) reported that, during a speech production task, family members withCAS showed reduced activation in inferior frontal gyrus compared to family members with-out CAS. However, the temporal resolution of fMRI is quite limited and does not allow foran analysis of the specific processes underlying speech production. To evaluate the specific
388 PRESTON ET AL.
neurobiological characteristics of speech motor planning and programming, more temporally sen-sitive neurobiological tools such as electroencephalography (EEG)/event-related potential (ERP)are needed.
TEMPORALLY SENSITIVE MEASURES
EEG records electrical activity of the brain at the scalp. One advantage of EEG is its fine-grainedtemporal resolution, which allows for analysis of neural activity on the order of milliseconds.Time-locked analysis of the EEG signal in response to a stimulus is known as event-related poten-tial (ERP), and ERPs have been used for many decades to assess neural signatures associated witha variety of speech and language processes in normal and disordered populations. To date, thereappears to be only one ERP study of CAS. Froud and Khamis-Dakwar (2012) used ERPs tostudy the mismatch negativity (MMN) responses in five children with CAS and five age-matchedcontrols. They observed that children with typical speech showed a standard MMN responseto phonemically contrastive tokens (i.e., /ba/ vs. /pa/), but children with CAS showed a lessmature response. However, children with CAS did show a MMN response when presented withallophonic contrasts (i.e., /pa/ vs. /pha/), which was not observed in the children with typicalspeech. The result was interpreted as atypical processing of phonetic and phonological informa-tion in children with CAS with overly specified representations for at least some phonologicalinformation. This study provides some indication that there may be underlying phonologicaldeficits in addition to problems planning/programming speech-related movements. However, theprevailing theory of the fundamental difference in children with CAS is in planning/programmingthe movements for speech (ASHA, 2007), rather than in phonological processing or auditory per-ception per se. Thus, it is possible that a MMN paradigm might not be sensitive to the causalmechanisms underlying impairments in planning speech.
ERPs have been used to study neurophysiological processes involved in preparing to speak,although to a much lesser extent than studies of auditory perception. Using Levelt and Indefry’sWPM as a guide, Eulitz, Hauk and Cohen (2000) used ERPs to examine covert relative to overtspeech produced by adults in response to pictures. They found clear differences between theseconditions in a window from 275–400 msec after picture onset. This difference was interpreted toreflect the component associated with phonological and phonetic stages necessary for producingthe word. Additionally, they observed stronger activation over the left hemisphere than the right.Other imaging studies have observed physiological responses at time windows that generallyagree with the behavioral studies of picture naming (Indefrey, 2011; Indefrey & Levelt, 2004;Levelt et al., 1998).
One additional ERP paradigm relevant to the current investigation involves identification ofpre-motor potentials. A number of studies have observed slow negative ERP signals presentbefore the onset of limb movements, oral movements, and speech (McArdle, Mari, Pursley,Schulz, & Braun, 2009; Sochurková, Rektor, Jurák, & Stancák, 2006; Tremblay, Shiller, &Gracco, 2008; Wheaton, Shibasaki, & Hallett, 2005; Wohlert, 1993). In such studies, the ERPanalyses are time-locked to the onset of movement. Thus, a slow negative wave prior to theonset of speech indexes motoric processes involved in planning or programming the move-ment. We therefore expect to observe differences in this signal prior to speech onset in childrenwith CAS.
NEUROPHYSIOLOGY IN CAS 389
PURPOSE AND HYPOTHESES
There is presently little neurophysiological evidence of the core impairments in CAS that arebelieved to occur before the onset of speech. The present study employs a picture namingparadigm to evaluate whether the assumed difference in these underlying processes can berevealed by ERP. Although the long-term goal is to identify neurobiological markers of CAS,the current study takes an initial step to determine if a simple picture naming task can be usedto identify differences that are in line with theoretical predictions associated with phonologicalcomplexity and motor planning and programming. Using the temporal guidelines predicted byLevelt and Indefrey’s WPM, we examine the electrophysiological basis of processes associatedwith preparing to speak simple and complex words in children with and without CAS. Basedon prior studies of adults performing picture naming tasks, it was hypothesized that the groupswould differ in their neural organization for preparing to produce complex words and that thesedifferences would arise primarily during late phonological stages of syllabification (approxi-mately 350–475 msec post-picture onset); that is, the effects of stimulus complexity would beexpected to be revealed at these stages in which assembling phonemes and imposing lexical stressis occurring. Additionally, later stages of phonetic encoding in which articulatory movements areplanned and programmed (approximately 475 msec and beyond) would also be expected to differin CAS. Thus, we hypothesized that differences between children with CAS and controls wouldbe revealed during syllabification of articulatorily complex items and during planning and pro-gramming stages of all items. Finally, whereas previous fMRI studies have revealed increasedengagement of the right hemisphere for speech production tasks, we sought to explore whetherERP data would reveal differences in scalp topographical lateralization1 (which can indicateunderlying neural lateralization) during a speech production task in children with CAS. Thetime windows of interest were phonological stages that encompass assembly and ordering ofphonemes (i.e., 350–475 msec after picture onset) as well as later phonetic stages associated withmotor planning and programming prior to speech movements (i.e., 475–600 msec after pictureonset). As an additional analysis, we sought to examine pre-speech potentials just prior to theonset of movement.
METHOD
Participants
Two groups of participants were recruited: children with typical speech (TS) and children withCAS. All participants in both groups were between 9–15 years of age (mean 12 yr 4 mo,SD 22 mos), had English as their native language, and reported no history of head trauma.Additionally, all participants achieved a standard score above 80 on the Expressive VocabularyTest-2 (Williams, 2007).
1Although scalp laterality differences do not map directly to specific underlying regions, when responses are more orless lateralized, global laterality differences can be hypothesized.
390 PRESTON ET AL.
To be eligible for the typical speech (TS) group, children were required to have no history ofspeech, language, hearing, or learning difficulties. They also had normal speech sound productionand prosody, as judged by a licensed speech-language pathologist (the first author) in a shortconversation and as determined by a standard score above 95 on the Goldman-Fristoe Test ofArticulation-2 (Goldman & Fristoe, 2000). Fourteen children were recruited and met eligibilitycriteria for the TS group.
Children with CAS were diagnosed by local clinicians as having CAS. All had been in speech-language therapy since the age of 2 or 3 and were still receiving services. For the present study,two speech-language pathologists familiar with CAS (including the first author) confirmed thediagnosis through analysis of children’s performance on several tasks (cf. Preston, Brick, &Landi, 2013). To confirm that children had speech sound production problems, children in theCAS group were required to score below 80 on the GFTA-2 (mean 57.8, SD 15.8). Althoughall participants with CAS had errors on rhotic sounds /r, Ç, Ä/ during the GFTA-2 and conver-sational speech, children with CAS produced sound substitutions, omissions, and distortions onother sounds as well (including consonants as well as vowels). In addition, errors of migration(i.e., moving sounds out of order) and/or metathesis (switching the order of sounds in words)were also observed in 3–4 syllable words. Errors in lexical and phrasal stress were also observedin multisyllabic words and in conversation. Hence, their errors were not just phoneme-specificdistortions as might be expected of children with residual speech sound errors who do not haveCAS. Additionally, to verify speech motor sequencing difficulties, participants with CAS hadto score below 85% on the Sequencing subtest of the Verbal Motor Production Assessment forChildren (Hayden & Square, 1999). Qualitatively, children with CAS produced slow and inaccu-rate sound sequences on diadochokinetic tasks (e.g., /p∧t∧k∧/, /a-m-u/). Finally, the RecallingSentences subtest of the CELF-4 was used both to evaluate language skills (language memoryand complex morpho-syntax) and to judge articulatory precision, sound sequencing, and prosodyat the sentence level. Errors on this task in production of vowels, consonant sequences, and lexi-cal and phrasal stress were used to confirm the diagnosis of CAS. Because there are currently nospecified values for diagnosing these features in CAS, these symptoms were used to identify CASbut specific thresholds were not employed. Of the 14 children who were referred by clinicians ashaving CAS, nine met eligibility criteria for the CAS group.
One child from each group did not provide sufficiently analyzable ERP data for the presentstudy (see ERP Data Collection and Processing below). Therefore, the ERP data included13 children in the TS group (9 male, 4 female) and 8 in the CAS group (7 male, 1 female).
ERP Task and Stimuli
A picture naming task was used to compare the two groups on items that require relatively low orrelatively high demands on speech motor planning (i.e., Simple and Complex items). A stimuluslist (see Appendix) was developed for each of the two conditions, with 12 items in each con-dition. All items in both the Simple and Complex conditions began with voiced plosives /b/ or/d/. Items in the Simple condition were designed to place relatively low demands on speech plan-ning. Simple items were monosyllabic, contained no consonant clusters, and had the phonologicalforms CV (e.g., boy) or CVC (e.g., bone). Complex items were designed to place relatively highdemands on speech planning. Complex items were 2–3 syllables in length and were allowed to
NEUROPHYSIOLOGY IN CAS 391
contain consonant clusters (e.g., butterfly, blueberry). All items in the Complex condition beganwith a stressed syllable. As participants were being prepared for the EEG cap, they were famil-iarized with the pictures to ensure they used the correct word (e.g., “boy” rather than “child”); toremind the participant of the target word, any picture in which the participant used the wrong labelwas repeated two more times before the ERP experiment began. Pictures were 300 × 300 pix-els (4.2 × 4.2 inches) and were displayed on an 18-inch monitor with the participant sitting in achair approximately 40 inches from the monitor. Participants were instructed to “name the picturewhen it appears on the screen.”
Six blocks were presented, with each block containing all 12 Simple and all 12 Complex wordsin a random sequence. Hence, 144 individual trials were available for analysis for each participant(72 Simple, 72 Complex). The experimental task took approximately 12 minutes. Pictures wereon the screen for a jittered interval of 3,250–3,550 msec, then a black screen was presented for2,000 msec after the picture disappeared. A microphone was positioned 4 inches from the childrento track response time based on the onset of the acoustic signal.
ERP Data Collection
Stimulus presentation was controlled using a recent model Dell PC with E-PRIME2.0 Professional (PST, Inc.) running Windows XP Service Pack 3. EEG data were collected usinga 128 electrode net with a Net Amps 300 amplifier (EGI, Inc.) connected to an Apple Mac Prodesktop computer running Mac OS X 10.6.8. Data were sampled at 500 Hz with reference to Cz.Accurate timing was ensured through routine measurements of visual onset delay as measured bya photocell. Impedances measured before and after each recording session and were kept below40 k�.
Stimulus-Locked Data Analysis
Following data acquisition, ERP data were filtered using a bandpass of 0.1 Hz to 30 Hz. Files weresegmented into 700 msec epochs, which included 100 msec before picture onset and 600 msecafter. To ensure only trials with valid responses were included, trials were marked for exclusion ifresponse time between picture onset and the acoustic response was less than 350 msec or greaterthan 1,400 msec post stimulus onset (6% of trials). Additional trials to be discarded from theanalysis had been identified by the ERP lab manager, an analysis specialist who conducted theexperiment, and confirmed by the senior author. These included trials in which the participantdid not name the picture, said something other than the target word, or revised their response.However, trials in which speech sound errors occurred (e.g., sound distortions, substitutions, oromissions) were not removed from the analysis; these errors are characteristic of the disorder andthus were kept in for purposes of ecological validity.
Next, trials containing artifacts (eye movements, eye blinks, and bad channels) were identifiedusing a semi-automated method. Thresholds for identification of eye blinks and eye movementswere those that exceeded a max-min absolute threshold of 150 µV measured using electrodesdirectly above and below the eyes; channels horizontal to the eyes that exceeded a threshold of100 µV were identified as eye movements. Other channels in the net were marked unusable ifthey exceeded a threshold of 200 µV. Channels found to be unusable for more than 40% of the
392 PRESTON ET AL.
segments were excluded for all segments. Segments were removed if they contained more than10 unusable channels, eye blinks, or eye movements. On remaining trials, bad channels werereplaced using spherical spline interpolation (Perrin, Pernier, Bertrand, & Echallier, 1989) as rec-ommended by Picton et al. (2000). All remaining epochs were then re-referenced to the averagereference to remove channel bias (Dien, 1998), and baseline corrected based on the 100 msecprior to stimulus onset. Finally data were averaged by epoch type (Simple vs. Complex) for eachparticipant separately.
Subjects providing fewer than 12 good trials per condition were removed from statistical anal-yses; this criterion resulted in one CAS participant being excluded. The average number of trialsfor each group is presented in Table 1. All remaining subjects were screened for excessive noiseusing an averaging procedure which flips the polarity of every other trial. The total noise per-turbation from 0 was measured over the entire epoch and averaged across all channels for eachparticipant using code written in R by the second author. One subject in the TS group was foundto be an outlier based on a standard normal distribution; this participant was excluded from theanalysis.
ERP averaged data were processed using the ERP PCA Toolkit (Dien, 2010). Data for allparticipants were down sampled to 250 Hz to reduce the impacts of noise and temporal correlationin the data. Next, a principal components analysis (PCA) with promax (oblique) rotation wasrun to identify temporal factors of interest; the purpose of the PCA was to identify systematicvariance (without direct reference to group or to stimulus condition). Seven temporal factorswere extracted from the PCA using a scree test (Cattell, 1966). Although PCA temporal factorsare active over the course of the entire ERP average, we used a loading criterion of 0.6 to identifytime windows when the factors were most active (Dien, 2010). We then retained only temporalfactors that accounted for at least 5% of the variance. There were three temporal factors (TFs)
TABLE 1Descriptive Statistics for Demographic and Behavioral Measures and ERP Responses
TS Group Mean (SD) CAS Group Mean (SD)
Age 12 y 2 mo (23 mo) 12 y 7 mo (28 mo)EVT-2 Standard Score 110.3 (8.5) 95.5 (18.3)GFTA-2 Standard Score 101.7 (2.2) 57.9 (15.6)Number of usable ERP trials (stimulus-locked analysis):
Simple 33.1 (13.0) 30.3 (10.0)Complex 31.9 (13.6) 30.4 (12.4)
Number of usable ERP trials (stimulus-locked analysis):Simple 43.2 (8.7) 28.7 (11.8)Complex 40.8 (7.0) 31.0 (12.5)
Response time (msec)Simple 675.6 (102.2) 818.7 (80.6)Complex 679.9 (92.8) 839.1 (75.6)
Note. TS = Typical speech; CAS = Childhood apraxia of speech; ERP = Event-related potentials; EVT-2 =Expressive Vocabulary Test-2 (Williams, 2007); GFTA-2 = Goldman-Fristoe Test of Articulation-2 (Goldman &Fristoe, 2000). Note that, in a pilot study of 15 typically speaking adults ages 18–35, the average response timewas 608 msec (SD 58) for simple items and 617 msec (SD 55) for complex items, suggesting that the TS groupof children was approximately 65 msec (or 10%) slower than typically speaking adults.
NEUROPHYSIOLOGY IN CAS 393
that met these criteria. Two TFs encompassed time windows of theoretical interest (TF2, TF3).TF1 (accounting for 29% of the variance) encompassed a broad time window from 88–372 msecpost stimulus onset, and included time windows canonically associated primarily with visualprocessing, lexical retrieval and the early stages of phonological retrieval. TF1 was not furtherexplored, although the Supplemental Material lists the outcomes of the statistical comparisons.
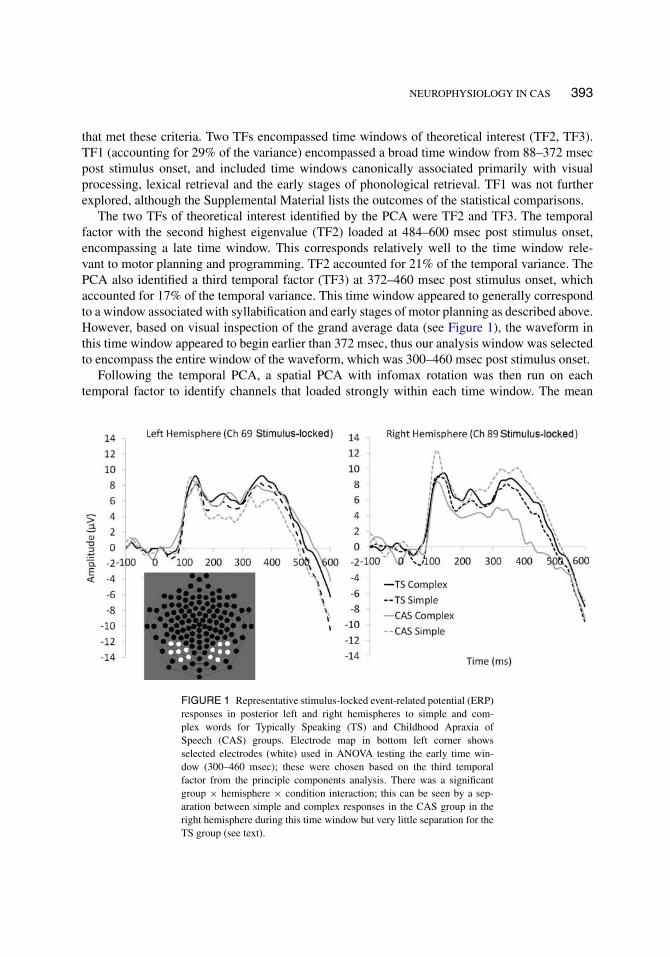
The two TFs of theoretical interest identified by the PCA were TF2 and TF3. The temporalfactor with the second highest eigenvalue (TF2) loaded at 484–600 msec post stimulus onset,encompassing a late time window. This corresponds relatively well to the time window rele-vant to motor planning and programming. TF2 accounted for 21% of the temporal variance. ThePCA also identified a third temporal factor (TF3) at 372–460 msec post stimulus onset, whichaccounted for 17% of the temporal variance. This time window appeared to generally correspondto a window associated with syllabification and early stages of motor planning as described above.However, based on visual inspection of the grand average data (see Figure 1), the waveform inthis time window appeared to begin earlier than 372 msec, thus our analysis window was selectedto encompass the entire window of the waveform, which was 300–460 msec post stimulus onset.
Following the temporal PCA, a spatial PCA with infomax rotation was then run on eachtemporal factor to identify channels that loaded strongly within each time window. The mean
FIGURE 1 Representative stimulus-locked event-related potential (ERP)responses in posterior left and right hemispheres to simple and com-plex words for Typically Speaking (TS) and Childhood Apraxia ofSpeech (CAS) groups. Electrode map in bottom left corner showsselected electrodes (white) used in ANOVA testing the early time win-dow (300–460 msec); these were chosen based on the third temporalfactor from the principle components analysis. There was a significantgroup × hemisphere × condition interaction; this can be seen by a sep-aration between simple and complex responses in the CAS group in theright hemisphere during this time window but very little separation for theTS group (see text).
394 PRESTON ET AL.
amplitudes from the channels in the first spatial factor were extracted for both left and righthemispheres and were submitted for statistical analysis for each temporal–spatial factor pairing.When the spatial PCA identified clusters involving both anterior and posterior electrodes, differ-ences in polarity preclude averaging across all electrodes. We selected the cluster that includedthe most electrodes (posterior electrodes in the case of the early time window, anterior electrodesin the case of the later time window).
To summarize the stimulus-locked analysis, an early time window (300–460 msec post stimu-lus onset) and a late time window (484–600 msec post stimulus onset) identified by the temporalPCA were used for group comparison. These time windows are in line with those described by theLevelt and Indefrey WPM as later stages of phonological encoding (syllabification) and phoneticprocesses of motor planning and programming. Within each time window, a spatial PCA wasrun to identify clusters of electrodes with the maximal variance in the time window. The groupswere compared using separate 2 (group: TS, CAS) × 2 (condition: simple, complex) × 2 (hemi-sphere: left, right) ANOVAs for the regions associated with the early temporal factor and the latertemporal factor.
Response-Locked Analysis
In addition to the aforementioned analysis that was time-locked to the onset of the picture, we alsoemployed a supplemental response-locked analysis. This analysis examined the 600 msec priorto the acoustic response at the onset of the word. Procedures were similar to the stimulus-lockedanalysis except that the segmention included 700 msec epochs prior to the acoustic response,including a 100 msec baseline. Six participants in the CAS group and nine in the TS groupprovided usable data for this analysis. A temporal–spatial PCA was again conducted using theresponse-locked segmentation. First, a temporal PCA with promax rotation was conducted. ThreeTFs were identified that had temporal loadings greater than 0.6 and that accounted for at least5% of the variance. The first temporal factor (with the highest loading, accounting for 47%of the variance) ranged from –188 msec prior to the acoustic response to 0 msec (the acous-tic response). This factor was further explored as it was presumed to reflect the processes ofplanning/programming movements just prior to the onset of speech. A spatial PCA was run withinfomax rotation to identify electrodes associated with the first spatial factor. Both anterior andposterior electrodes loaded on this factor; there were more posterior electrodes so these wereaveraged and included in the statistical analysis. The groups were compared in this time windowand in these posterior electrodes using a 2 (group: TS, CAS) × 2 (condition: simple, complex)× 2 (hemisphere: left, right) ANOVA. The remaining two TFs identified by the temporal PCAwere not further explored, although statistical comparisons are presented in the SupplementalMaterial.
RESULTS
Descriptive statistics for behavioral and demographic data are presented in Table 1. The groupsdid not differ in age (t[19] = .049, p = .63) or EVT-2 scores (t[19] = 2.1, p = .061) but asexpected, they did differ in GFTA-2 scores (t[1, 19], p < .0001).
NEUROPHYSIOLOGY IN CAS 395
Additionally, with respect to response time (from picture onset to the acoustic response), theCAS group was significantly slower than the TS group (F[1, 38] = 27.4, p < .0001); there wasno significant main effect for complexity (F[1, 38] = 0.18, p = .67) and no group × complexityinteraction (F[1, 38] = 0.08, p = .78). A 2 × 2 ANOVA confirmed that there was no significantdifference in the number of usable ERP trials between the groups (F[1, 38] = 0.3, p = .58) orconditions (F[1, 38] = 0.03, p = .86) and no group × condition interaction (F[1, 38] = 0.03,p = .86) in the stimulus-locked analysis.
Analysis of the Early Stimulus-Locked Temporal Window
Visual inspection of the waveforms revealed patterns similar to those described in other picturenaming studies (e.g., Eulitz et al., 2000), providing confirmation that the task was eliciting theexpected responses. Figure 1 shows selected electrodes from regions identified by the spatial PCAalong with representative waveforms associated with the earlier “planning” time window from300–460 msec (TF3). As can be seen in the figure, the CAS group shows separation of the simpleand complex conditions in the posterior right hemisphere, whereas no such separation existsfor the TS group in either hemisphere. The results of the ANOVA indicated a significant three-way interaction of group × hemisphere × complexity (F[1, 19] = 6.65, p = .018, partial η2 =0.259) in this early time window. The three-way interaction was decomposed by running separategroup × complexity ANOVAs in the left and right hemispheres. There was no significant group× complexity interaction over the left hemisphere (F[1, 19] = 0.92, p = .348, partial η2 = 0.046)but there was a significant group × complexity interaction over the right hemisphere (F[1,19] =4.78, p = .041, partial η2 = 0.201). Thus, the magnitude of the difference between simple andcomplex items was greater for the CAS group than for the TS group in the right hemisphere.When decomposed by group, the CAS group showed a significant complexity × hemisphereinteraction (F[1, 7] = 7.09, p = .032, partial η2 = .503) but the TS group did not (F[1, 12] =0.44, p = .518, partial η2 = 0.036). Thus, the pattern of response for simple and complex itemswas similar across hemispheres for the TS group, but the electrophysiological response for simpleand complex items was not the same across hemispheres for the CAS group. As can be seen inFigure 1, the difference between simple and complex items over the right hemisphere is largerfor the CAS group than for the TS group (with reduced amplitude over the right hemisphere forcomplex items in the CAS group); the left hemisphere waveforms appear similar by group andby condition.
Analysis of the Late Stimulus-Locked Temporal Window
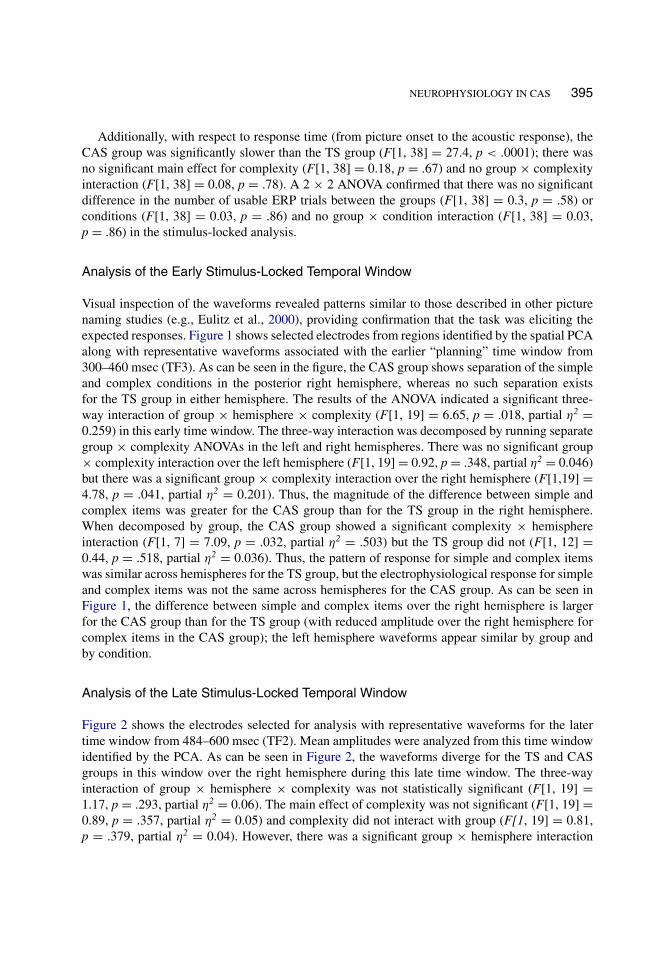
Figure 2 shows the electrodes selected for analysis with representative waveforms for the latertime window from 484–600 msec (TF2). Mean amplitudes were analyzed from this time windowidentified by the PCA. As can be seen in Figure 2, the waveforms diverge for the TS and CASgroups in this window over the right hemisphere during this late time window. The three-wayinteraction of group × hemisphere × complexity was not statistically significant (F[1, 19] =1.17, p = .293, partial η2 = 0.06). The main effect of complexity was not significant (F[1, 19] =0.89, p = .357, partial η2 = 0.05) and complexity did not interact with group (F[1, 19] = 0.81,p = .379, partial η2 = 0.04). However, there was a significant group × hemisphere interaction
396 PRESTON ET AL.
FIGURE 2 Representative stimulus-locked event-related potential (ERP)responses in anterior left and right hemispheres to simple and complexwords for Typically Speaking (TS) and Childhood Apraxia of Speech(CAS) groups. Electrode map in top left shows selected electrodes (white)used in ANOVA testing the later time window (484–600 msec); these werechosen based on the second temporal factor from the principle compo-nents analysis. There was a significant group × hemisphere interaction inthis late time window, which is depicted by the separation of responsesbetween the groups in the right hemisphere but not in the left (see text).
NEUROPHYSIOLOGY IN CAS 397
(F[1, 19] = 6.80, p = 0.017, partial η2 = 0.26) indicating that, in this later time window, thegroups engaged the left and right hemispheres differently. There was a significant complexity ×hemisphere interaction (F[1, 19] = 4.79, p = .041], partial η2 = 0.20) suggesting that complexitywas processed differently over the two hemispheres. As can be seen in Figure 2, the TS and CASgroups show similar patterns over the left hemisphere during this late time window, but the twogroups’ waveforms diverge over the right hemisphere for both simple and complex words.
Response-Locked Analysis
Because the response times differed between the groups, we sought to confirm that this late time-window was truly reflecting similar planning/programming processes for both groups. Thus, anadditional analysis was undertaken by using the acoustic response as an estimate of the onset ofmovement. We therefore analyzed the first TF identified by the PCA at –188 to 0 msec prior tothe acoustic response.
Figure 2 shows waveforms from the same right hemisphere electrode identified by the sec-ond TF in the stimulus-locked analysis (Panel B) as well as in the response-locked analysis(Panel C). This is presented to visually compare the same electrode under both the stimulus-locked and response-locked analysis methods. It can be seen that a relatively similar patternemerges (revealing group differences), enhancing our confidence that the late temporal windowin the stimulus-locked condition reflects a waveform associated with pre-movement potentials.
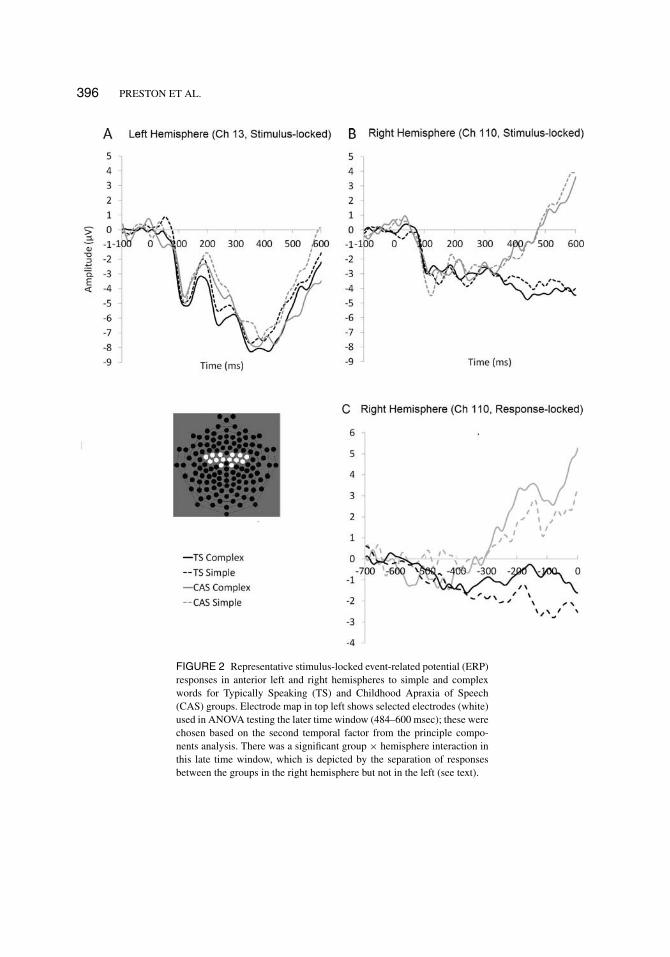
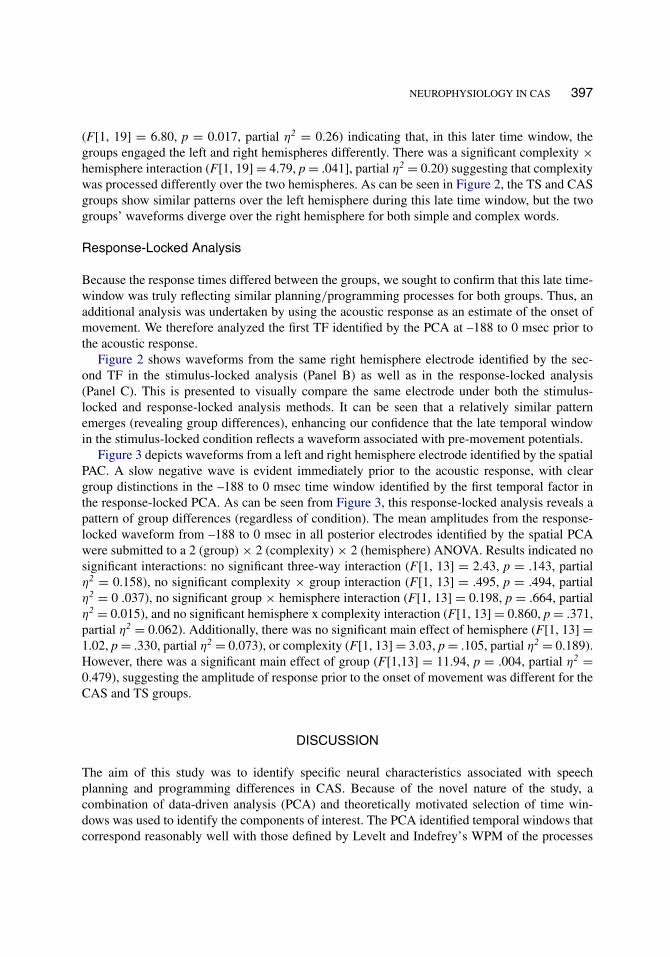
Figure 3 depicts waveforms from a left and right hemisphere electrode identified by the spatialPAC. A slow negative wave is evident immediately prior to the acoustic response, with cleargroup distinctions in the –188 to 0 msec time window identified by the first temporal factor inthe response-locked PCA. As can be seen from Figure 3, this response-locked analysis reveals apattern of group differences (regardless of condition). The mean amplitudes from the response-locked waveform from –188 to 0 msec in all posterior electrodes identified by the spatial PCAwere submitted to a 2 (group) × 2 (complexity) × 2 (hemisphere) ANOVA. Results indicated nosignificant interactions: no significant three-way interaction (F[1, 13] = 2.43, p = .143, partialη2 = 0.158), no significant complexity × group interaction (F[1, 13] = .495, p = .494, partialη2 = 0 .037), no significant group × hemisphere interaction (F[1, 13] = 0.198, p = .664, partialη2 = 0.015), and no significant hemisphere x complexity interaction (F[1, 13] = 0.860, p = .371,partial η2 = 0.062). Additionally, there was no significant main effect of hemisphere (F[1, 13] =1.02, p = .330, partial η2 = 0.073), or complexity (F[1, 13] = 3.03, p = .105, partial η2 = 0.189).However, there was a significant main effect of group (F[1,13] = 11.94, p = .004, partial η2 =0.479), suggesting the amplitude of response prior to the onset of movement was different for theCAS and TS groups.
DISCUSSION
The aim of this study was to identify specific neural characteristics associated with speechplanning and programming differences in CAS. Because of the novel nature of the study, acombination of data-driven analysis (PCA) and theoretically motivated selection of time win-dows was used to identify the components of interest. The PCA identified temporal windows thatcorrespond reasonably well with those defined by Levelt and Indefrey’s WPM of the processes
398 PRESTON ET AL.
FIGURE 3 Representative response-locked event-related potential (ERP)responses in posterior left and right hemispheres to simple and complexwords for Typically Speaking (TS) and Childhood Apraxia of Speech(CAS) groups. Electrode map in bottom left shows selected electrodes(white) used in ANOVA testing the time window –188 to 0 msec prior tothe acoustic response; these were chosen based on the first temporal fac-tor from the principle components analysis. There was a significant maineffect of group and no significant interactions in these electrodes (see text).
involved during picture naming. The ERP responses observed in these time windows provide thefirst confirmation of the hypothesis that neurophysiological differences might exist in time win-dows associated with phonological and phonetic processing of complex words in children withCAS. The results provide a neurophysiological complement to prior behavioral studies whichhave used speech output to make inferences about disrupted processes that occur prior to speechoutput (Maas & Mailend, 2012; Maas, Robin, Wright, & Ballard, 2008; Maassen et al., 2001;Nijland & Maassen, 2003; Shriberg et al., 2012).
Response times observed here are generally similar to those observed in prior studies. The TSgroup mean response times were as expected for this type of task (i.e., approximately 675 msec),although they were approximately 10% slower than adults on this same task (see Table 1 foot-notes). Given the presumed impairments in motor planning and programming, slower responsetimes for the CAS group are not unexpected. The lack of complexity effect as measured byresponse times is in line with prior research indicating that longer/more complex words are notnecessarily named slower than simpler items when items are presented in a randomized fashion,as they were here (see Meyer et al., 2003).
The group-by-complexity interaction over the right hemisphere in the early time window(300–460 msec post picture onset) is in line with clinical observations that differences arisein the generation of longer word forms in children with CAS, as they typically show signifi-cantly greater difficulty producing complex words (e.g., butterfly) than simple words (e.g., bone)
NEUROPHYSIOLOGY IN CAS 399
(e.g., Peter et al., 2013). Neurophysiologically, the difference with processing complex wordswas associated in this study with reductions in amplitude of activity over the right hemispherefor complex words (relative to simple words) in the CAS group. There was no complexity effectfor the TS group over either hemisphere but complex words were processed differently acrosshemispheres for the CAS group. The observed differences may reflect a reduction in neural activ-ity during the generation of complex phonological word forms. One possible psycholinguisticexplanation is that the complex multisyllabic utterances require the imposition of lexical stress,which is known to differ in children with CAS (Ballard, Djaja, Arciuli, James, & van Doorn,2012; Ballard, Robin, McCabe, & McDonald, 2010; Shriberg et al., 2003). Alternatively, it maybe the challenge of planning complex sequences of sounds and syllables that underlies this dif-ference during the planning window (Peter et al., 2013). It should also be noted that, based onthe WPM, the time window encompasses both late stages of phonological retrieval as well assyllabification; because there is only one single, slow wave in the ERP signal at this time point,the paradigm used here may not be able to fully distinguish between retrieval and syllabification(which, as noted above, may temporally overlap). Thus a phonological component to CAS mayexist, particularly as it relates to constructing complex phonological word forms.
The differences in the later time window were also evident only over the right hemisphere.These group differences were not dependent on complexity but provided evidence that childrenwith CAS have detectably different electrophysiological activity over the right hemisphere in thelater stages of speech preparation. If this indeed reflects phonetic stages of motor planning orprogramming, the implication may be that children with CAS are recruiting different neuronalpopulations to control the articulators for speech production. In the response-locked analysis,a large number of posterior electrodes were identified and the group difference was observedregardless of hemisphere. Thus, the magnitude of group differences may vary somewhat depend-ing on the nature of the analysis (stimulus-locked or response-locked) or the location of therecordings across the scalp, but the differences between groups are detectable at the group leveleven with relatively small samples. Because group differences were observed using both dataanalytic methods, this enhances the reliability of the findings of group differences just prior tospeech production.
Although the study could be viewed as primarily descriptive (i.e., confirming that neurobi-ological differences exist in preparing for speech), the identification of objective, brain-basedmeasures associated with phonological processes (word complexity) and phonetic processes(issuing commands prior to speech onset) now offers guidance for studies comparing neurophys-iological responses in CAS and other subtypes of speech and language disorders. For example,children with residual articulation errors who do not have symptoms of CAS would not beexpected to differ from children with TS in this type of ERP paradigm. With further refinementof the paradigm, it is possible that an ERP task such as the one described here could eventuallyserve as an objective, theoretically motivated measure for differential diagnosis of CAS versusother subtypes of speech sound disorders.
CAVEATS AND LIMITATIONS
As is the case for most studies of low-incidence populations such as CAS, the sample size islimited. The significant interactions observed here are therefore likely to be robust statistical
400 PRESTON ET AL.
effects. Future studies should explore modifications to the existing paradigm that could enhancethe effect further to be sufficiently reliable at both the group level and the individual level. Forexample, the complex words included here all began with a stressed syllable, but words beginningwith weak–strong stress patterns (e.g., computer) may be more challenging for children to learn(Ballard et al., 2012). The magnitude of the complexity effect might therefore be enhanced byincluding items that begin with weak–strong stress patterns. Additional manipulations could beexplored to further stress the speech production system and to enhance the group distinction (e.g.,eliciting only 3–4 syllable words in the complex condition). Finally, the diagnostic utility of thisparadigm could be explored, as modifications to the paradigm may help to reveal differencesbetween children with CAS and other subtypes of developmental speech and language disorders.
At present, the regions responsible for group differences in syllabification, planning, and pro-gramming remain speculative. However, the updated WPM model laid out by Indefrey (2011)may provide some insight related to the regions involved in specific processes. For example,the translation from linguistic to motor representations may involve communications betweenposterior superior temporal regions and inferior frontal regions, which may rely on the arcu-ate fasciculus. Later stages of motor programming involve a number of cortical and subcorticalregions including supplementary motor area, inferior frontal/precentral regions, and cerebellum.However, other neurobiological accounts of speech production may also be relevant to the presentinvestigation. For example, the DIVA model has been used to characterize CAS as a disorderwith reduced feed-forward control and increased reliance on feedback mechanisms (Terband &Maassen, 2010; Terband, Maassen, Guenther, & Brumberg, 2009). The DIVA model presentlydoes not specify the precise time-course of events in a manner similar to the WPM, making itdifficult to compare predictions of the two models directly. Moreover, the differential relianceon feed-forward and feedback mechanisms in CAS could have implications for differential pro-cessing in the left and right hemispheres (Tourville & Guenther, 2011). However, it should beacknowledged that EEG data are recorded at the scalp and do not necessarily reflect neural activitydirectly below the electrodes. Whereas work by Liégeois et al. (2003) observed reduced activationfor family members with CAS compared to controls in the left inferior frontal gyrus, the primarydifferences observed in our study were over the right hemisphere. The present results are notnecessarily incompatible with these results as the actual sources of the ERP signals are unclear.Future research could pair ERP data with technologies such as functional MRI to understand howspatially sensitive hemodynamic data might inform (and be informed by) the temporally sensi-tive ERP data. Moreover, follow-up work that uses dipole modeling (e.g., LORETA) could alsobe utilized; however, due to the lack of photogrammetry data and small sample size this was notutilized here.
SUMMARY AND CONCLUSIONS
This study adds to our understanding of CAS in several important ways. The data provide evi-dence of disrupted neurobiological responses in CAS during a speech production task. The studyalso reveals that the observed differences in CAS are a function of both task (i.e., the complexityof the items to be planned) and hemisphere (with reduced amplitudes over the right hemispherebut not the left). Finally, differences were observed in the time windows associated with bothphonological processes (assembly of sound sequences and/or imposition of stress, which was
NEUROPHYSIOLOGY IN CAS 401
associated with complexity of the word) and phonetic processes (generating a motor plan and/ortransmission of motor commands). The evidence of differences in the brain’s response duringspeech preparation sets the foundation for further pursuit of theoretically driven research onneurophysiological markers of subtypes of speech impairment during speech production tasks.
ACKNOWLEDGMENTS
The authors would like to thank Emily Phillips and Erin Grohman for assistance with datacollection.
FUNDING
Funding was provided by the Childhood Apraxia of Speech Association of North America(CASANA), the Language and Early Assessment Research Network (LEARN) at HaskinsLaboratories, and NIH grant P01HD001994.
SUPPLEMENTAL MATERIAL
Supplemental material for this article can be accessed at www.tandfonline.com/hdvn.
REFERENCES
ASHA. (2007). Childhood Apraxia of Speech [Technical Report]. Retrieved from www.asha.org/policyBallard, K. J., Djaja, D., Arciuli, J., James, D. G. H., & van Doorn, J. (2012). Developmental trajectory for production
of prosody: Lexical stress contrastivity in children ages 3 to 7 years and in adults. Journal of Speech, Language, andHearing Research, 55(6), 1822–1835.
Ballard, K. J., Robin, D. A., McCabe, P., & McDonald, J. (2010). A treatment for dysprosody in childhood apraxia ofspeech. Journal of Speech, Language, and Hearing Research, 53(5), 1227–1245. doi:10.1044/1092-4388(2010/09-0130)
Cattell, R. B. (1966). The scree test for the number of factors. Multivariate Behavioral Research, 1(2), 245–276.Crary, M. A. (1984). Phonological characteristics of developmental verbal dyspraxia. Seminars in Speech and Language,
5(2), 71–83.Dien, J. (1998). Issues in the application of the average reference: Review, critiques, and recommendations. Behavior
Research Methods, Instruments, & Computers, 30(1), 34–43.Dien, J. (2010). The ERP PCA Toolkit: An open source program for advanced statistical analysis of event-related potential
data. Journal of Neuroscience Methods, 187(1), 138–145.Eulitz, C., Hauk, O., & Cohen, R. (2000). Electroencephalographic activity over temporal brain areas during phonological
encoding in picture naming. Clinical Neurophysiology, 111(11), 2088–2097.Forrest, K. (2003). Diagnostic criteria of developmental apraxia of speech used by clinical speech-language pathologists.
American Journal of Speech-Language Pathology, 12(3), 376–380.Froud, K., & Khamis-Dakwar, R. (2012). Mismatch negativity responses in children with a diagnosis of childhood apraxia
of speech (CAS). American Journal of Speech-Language Pathology, 21(4), 302–312.Goldman, R., & Fristoe, M. (2000). Goldman Fristoe test of articulation (2nd ed.). Circle Pines, MN: AGS.Hayden, D., & Square, P. (1999). Verbal motor production assessment for children. San Antonio, TX: Psychological
Corporation.
402 PRESTON ET AL.
Indefrey, P. (2011). The spatial and temporal signatures of word production components: A critical update. Frontiers inPsychology, 2, 255.
Indefrey, P., & Levelt, W. J. M. (2004). The spatial and temporal signatures of word production components. Cognition,92(1–2), 101–144.
Levelt, W. J. (1999). Models of word production. Trends in Cognitive Sciences, 3(6), 223–232.Levelt, W. J., Praamstra, P., Meyer, A. S., Helenius, P., & Salmelin, R. (1998). An MEG study of picture naming. Journal
of Cognitive Neuroscience, 10(5), 553–567.Levelt, W. J., Roelofs, A., & Meyer, A. S. (1999). A theory of lexical access in speech production. Behavioral & Brain
Science, 22(1), 1–38; discussion 38–75.Lewis, B. A., Freebairn, L. A., Hansen, A. J., Iyengar, S. K., & Taylor, H. G. (2004). School-age follow-up of children
with childhood apraxia of speech. Language, Speech, and Hearing Services in Schools, 35, 122–140.Liégeois, F., Baldeweg, T., Connelly, A., Gadian, D. G., Mishkin, M., & Vargha-Khadem, F. (2003). Language fMRI
abnormalities associated with FOXP2 gene mutation. Nature Neuroscience, 6(11), 1230–1237.Maas, E., & Mailend, M. L. (2012). Speech planning happens before speech execution: Online reaction time methods in
the study of apraxia of speech. Journal of Speech, Language and Hearing Research, 55(5), S1523–1534.Maas, E., Robin, D. A., Wright, D. L., & Ballard, K. J. (2008). Motor programming in apraxia of speech. Brain and
Language, 106(2), 107–118.Maassen, B., Nijland, L., & Van Der Meulen, S. (2001). Coarticulation within and between syllables by children with
developmental apraxia of speech. Clinical Linguistics & Phonetics, 15(1), 145–150.McArdle, J. J., Mari, Z., Pursley, R. H., Schulz, G. M., & Braun, A. R. (2009). Electrophysiological evidence of functional
integration between the language and motor systems in the brain: A study of the speech bereitschaftspotential. ClinicalNeurophysiology, 120(2), 275–284.
Meyer, A. S., Roelofs, A., & Levelt, W. J. M. (2003). Word length effects in object naming: The role of a responsecriterion. Journal of Memory and Language, 48(1), 131–147.
Nijland, L., & Maassen, B. (2003). Evidence of motor programming deficits in children diagnosed with DAS. Journal ofSpeech, Language & Hearing Research, 46(2), 437–450.
Nijland, L., Maassen, B., Van der Meulen, S., Gabreels, F., Kraaimaat, F. W., & Schreuder, R. (2002). Coarticulationpatterns in children with developmental apraxia of speech. Clinical Linguistics & Phonetics, 16(6), 461–483.
Nijland, L., Maassen, B., Van der Meulen, S., Gabreels, F., Kraaimaat, F. W., & Schreuder, R. (2003). Planning of syllablesin children with developmental apraxia of speech. Clinical Linguistics & Phonetics, 17(1), 1.
Perrin, F., Pernier, J., Bertrand, O., & Echallier, J. (1989). Spherical splines for scalp potential and current densitymapping. Electroencephalography and Clinical Neurophysiology, 72(2), 184–187.
Peter, B., Button, L., Stoel-Gammon, C., Chapman, K., & Raskind, W. H. (2013). Deficits in sequential processing mani-fest in motor and linguistic tasks in a multigenerational family with childhood apraxia of speech. Clinical Linguistics& Phonetics, 27(3), 163–191.
Picton, T., Bentin, S., Berg, P., Donchin, E., Hillyard, S., Johnson, R., . . . Rugg, M. (2000). Guidelines for using humanevent-related potentials to study cognition: Recording standards and publication criteria. Psychophysiology, 37(2),127–152.
Preston, J. L., Brick, N., & Landi, N. (2013). Ultrasound biofeedback treatment for persisting childhood apraxia of speech.American Journal of Speech-Language Pathology, 22(4), 627–643.
Shriberg, L. D., Campbell, T. F., Karlsson, H. B., Brown, R. L., McSweeny, J. L., & Nadler, C. J. (2003). A diagnosticmarker for childhood apraxia of speech: The lexical stress ratio. Clinical Linguistics & Phonetics, 17(7), 549–574.
Shriberg, L. D., Fourakis, M., Hall, S. D., Karlsson, H. B., Lohmeier, H. L., McSweeny, J. L., . . . Wilson, D. L. (2010).Extensions to the speech disorders classification system (SDCS). Clinical Linguistics & Phonetics, 24(10), 795–824.
Shriberg, L. D., Lohmeier, H. L., Strand, E. A., & Jakielski, K. J. (2012). Encoding, memory, and transcoding deficits inchildhood apraxia of speech. Clinical Linguistics & Phonetics, 26(5), 445–482.
Sochurková, D., Rektor, I., Jurák, P., & Stancák, A. (2006). Intracerebral recording of cortical activity related to self-paced voluntary movements: A bereitschaftspotential and event-related desynchronization/synchronization. Seegstudy. Experimental Brain Research, 173(4), 637–649.
Strand, E. A., McCauley, R. J., Weigand, S. D., Stoeckel, R. E., & Baas, B. S. (2013). A Motor speech assessment forchildren with severe speech disorders: Reliability and validity evidence. Journal of Speech, Language & HearingResearch, 56(2), 505–520.
NEUROPHYSIOLOGY IN CAS 403
Terband, H., & Maassen, B. (2010). Speech motor development in childhood apraxia of speech: Generating testablehypotheses by neurocomputational modeling. Folia Phoniatrica et Logopaedica, 62(3), 134–142.
Terband, H., Maassen, B., Guenther, F. H., & Brumberg, J. (2009). Computational neural modeling of speech motorcontrol in childhood apraxia of speech (CAS). Journal of Speech, Language, and Hearing Research, 52(6),1595–1609.
Tourville, J. A., & Guenther, F. H. (2011). The diva model: A neural theory of speech acquisition and production.Language and Cognitive Processes, 26(7), 952–981.
Tremblay, P., Shiller, D. M., & Gracco, V. L. (2008). On the time-course and frequency selectivity of the EEG for differentmodes of response selection: Evidence from speech production and keyboard pressing. Clinical Neurophysiology,119(1), 88–99.
van der Merwe, A. (2008). A theoretical framework for characterization of pathological speech sensorimotor control. InM. McNeil (Ed.), Clinical management of sensorimotor speech disorders (pp. 3–18). New York, NY: Thieme.
Velleman, S. L., & Shriberg, L. D. (1999). Metrical analysis of the speech of children with suspected developmentalapraxia of speech. Journal of Speech, Language & Hearing Research, 42(6), 1444–1460.
Wheaton, L. A., Shibasaki, H., & Hallett, M. (2005). Temporal activation pattern of parietal and premotor areas relatedto praxis movements. Clinical Neurophysiology, 116(5), 1201–1212.
Williams, K. T. (2007). Expressive Vocabulary Test (2nd ed.). Minneapolis, MN: Pearson.Wohlert, A.B. (1993). Event-related brain potentials preceding speech and nonspeech oral movements of varying
complexity. Journal of Speech and Hearing Research, 36(5), 897–905.
APPENDIXSTIMULUS ITEMS
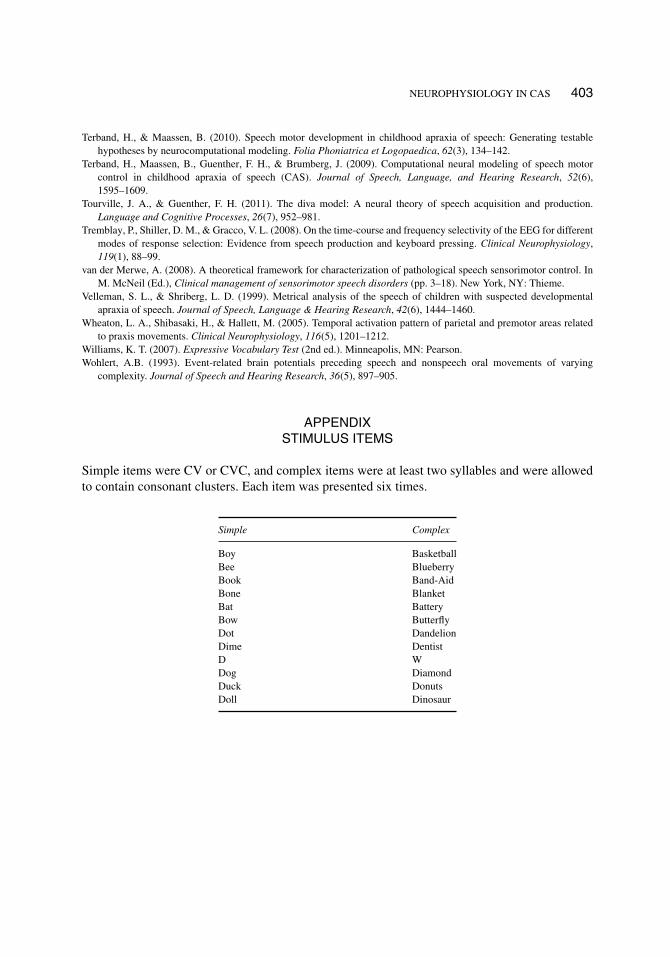
Simple items were CV or CVC, and complex items were at least two syllables and were allowedto contain consonant clusters. Each item was presented six times.
Simple Complex
Boy BasketballBee BlueberryBook Band-AidBone BlanketBat BatteryBow ButterflyDot DandelionDime DentistD WDog DiamondDuck DonutsDoll Dinosaur