Embed Size (px)
Citation preview
NEURAL NETWORKS IN THE AUTOMATION OF PHOTOGRAMMETRIC PROCESSES
S. Mikrut a,*, Z. Mikrut b
aAGH, Dept. of Geoinformation, Photogrammetry and Environmental Remote Sensing, University of Science and
Technology Cracow (AGH), 30059 Krakow, Poland - [email protected] bAGH, Dept. of Automatics, University of Science and Technology Cracow (AGH), 30059 Krakow,
Poland - [email protected]
Commission IV, WG IV/3 KEY WORDS: Photogrammetry, Automation, Correlation, Extraction, Recognition, Neural ABSTRACT: The concept of research was based on the selection of several representations, which later were correlated by means of classic, and neural methods. In the course of research, classic methods of image matching were tested and compared with neural methods that originated in the course of research. Additionally, experiments consisting in manual measurements, performed by independent observers, were conducted. The essence of methodology that was based on neural networks consisted in the preparation of suitable representations of image fragments and using them for the classification of various types of neural networks. One of the assumed methods was based on the distribution of image gradient module value and of its direction. The usability of that representation for the selection of sub-images was tested by means of SOM Kohonen neural network. Another method consisted in the utilization of the log-polar and log-Hough transforms, which are considered to be simplified models of preliminary image processing, performed by visual systems of people and animals. The usability of that representation was tested by means of the backpropagation type of neural network. As regards the generation of the third representation, the ICM (Intersecting Cortical Model) network was applied, which is one of the versions of the PCNN (Pulse Coupled Neural Network). Using that network, the so-called image signatures, or vectors composed of tens of elements which describe the image structure, were generated.
* Corresponding author.
1. INTRODUCTION
The use of neural networks to solve photogrammetric problems is a relatively new direction of research, although those networks have been used in digital image analysis for long. The problem consists not only in the lack of popularization of that technique among photogrammetry specialists. An additional difficulty results from the specificity of photogrammetric images, which are marked by a high diversity and fragmentation of information. The smaller is the scale of images, the greater is that fragmentation. This gives origin to troubles with the creation of a set of data for teaching and testing, as that set should, first of all, be representative. Another difficulty is the lack of neural tools, with which one could perform one of the most significant stages of the analysis, that is matching (correlating). Therefore, there remain issues related to the classification of areas and detection of features, as shown by the application examples drawn from literature and presented in Chapter 2. The authors of this paper have proposed a conception of using neural networks for the preliminary selection of sub-images and, indirectly, for matching them. The paper is a recapitulation of several years' works. The research conception was based on a selection of several representations, which were later used as inputs for the classifying neural networks. Broadly understood neural networks were also used to create representations, which were then correlated. The classic methods of image matching were tested and compared with neural methods, which originated in the course of research. Additionally, experiments
consisting in manual measurements performed by independent observers were conducted. The arrangement of the paper is the following. Chapter 2 presents examples of the application of neural networks in photogrammetry and in related issues taken from the literature on the subject. Chapter 3 recollects principles, associated with the use of neural networks technique, as well as discusses to a greater extent a less known ICM (Intersecting Cortical Model) pulse-coupled network. The main part of the paper is included in Chapter 4, which presents the authors' ideas related to the feasibility of application of neural networks on different stages of photogrammetric image analysis. It also discusses briefly those concepts, which have been implemented. Chapter 5 includes the specification of results and conclusions.
2. EXAMPLES OF THE APPLICATION OF NEURAL NETWORKS IN PHOTOGRAMMETRY AND REMOTE
SENSING
The attempts to use neural networks to solve various problems in the fields of photogrammetry and remote sensing have been made, practically speaking, from the very beginning of their development. The possibilities of using an artificial intelligence in photogrammetry were presented as early as in 1988 (in a general outline) by T. Sarjakoski (Sarjakoski, 1988). One of the first applications concerned the use of networks for feature extraction (Zheng, 1992). At the same time, Hu (during
331
The International Archives of the Photogrammetry, Remote Sensing and Spatial Information Sciences. Vol. XXXVII. Part B4. Beijing 2008
the ISPRS Congress in Amsterdam) presented detection of roads on aerial images with the use of Hopfield network for the optimisation of the matching algorithm (Hu et al., 2000). However, the most popular application is the use of neural networks for the classification of multi-spectrum image contents. In one of the examples (Vieira, 2000), the author utilized those networks as one of classification methods. The ANN (Artificial Neural Network) method was used in addition to LCA, PTS, and MDR methods. The networks were also used for the classification of specific INSAR-type images, where regions damaged as a result of earthquakes were detected (Ito et al., 2000). Moreover, the networks were used to create thematic maps based on satellite data, with the use of the classification method (Barsi, 2000), in relation to data provided by Landsat. Other examples of utilization of neural networks for the classification of remote sensing images can be found in the work by Kamiya (Kamiya, 2000). Another example of the use of artificial neural networks concerned automatic name placement on digital maps (Hong, 2000), or rectification of satellite images (Sunar et al., 2000). There were also attempts at using neural networks for image correlating, although the issue has so far been tested mainly in the field of robotics. Some researchers (Pajares et al., 1998) tried to solve the problem through the utilization of the network teaching strategy, which was based on Self-Organizing Feature Mapping (SOFM), being one of the Kohonen network variants.
3. OUTLINE OF THE NEURAL NETWORK TECHNIQUE
The majority of neural network applications is related to a broadly-understood classification. The methodology, which is applied as a standard one, consists in preparing suitable representations of image fragments and using them for the classification of various network types. Most often that classification employs a backpropagation-type network, which is taught by means of a method "involving a teacher", or a Kohonen's SOM network (Kohonen, 1997), which is an example of teaching without supervision. In both instances, the teaching of a network consists in changing the values of neuron connection weights. Those changes take place as a result of feeding successive representations, which have been collected in the teaching set, to the network input, and applying proper rules. In the case of backpropagation networks, the weight changes depend on differences between response generated by the network and the anticipated response, as defined by the experimenter. In the Kohonen layer, after the feeding of a teaching vector, the neuron, which has generated the highest value, is determined. The weights of that neuron, as well as of its neighbours are changed so that to approximate the value of the input vector. The theory, which describes the operation of those networks, was presented in numerous publications (Arbib, 1995; Bishop, 1995; Haykin, 1999; Tadeusiewicz et al., 2007) so it seems that there is no need to discuss it in this paper. Also computer programs were prepared to facilitate the use of neural networks even by people of a lesser experience (Duin, 2000; Matlab, 2006).
3.1 Pulse-coupled neural networks
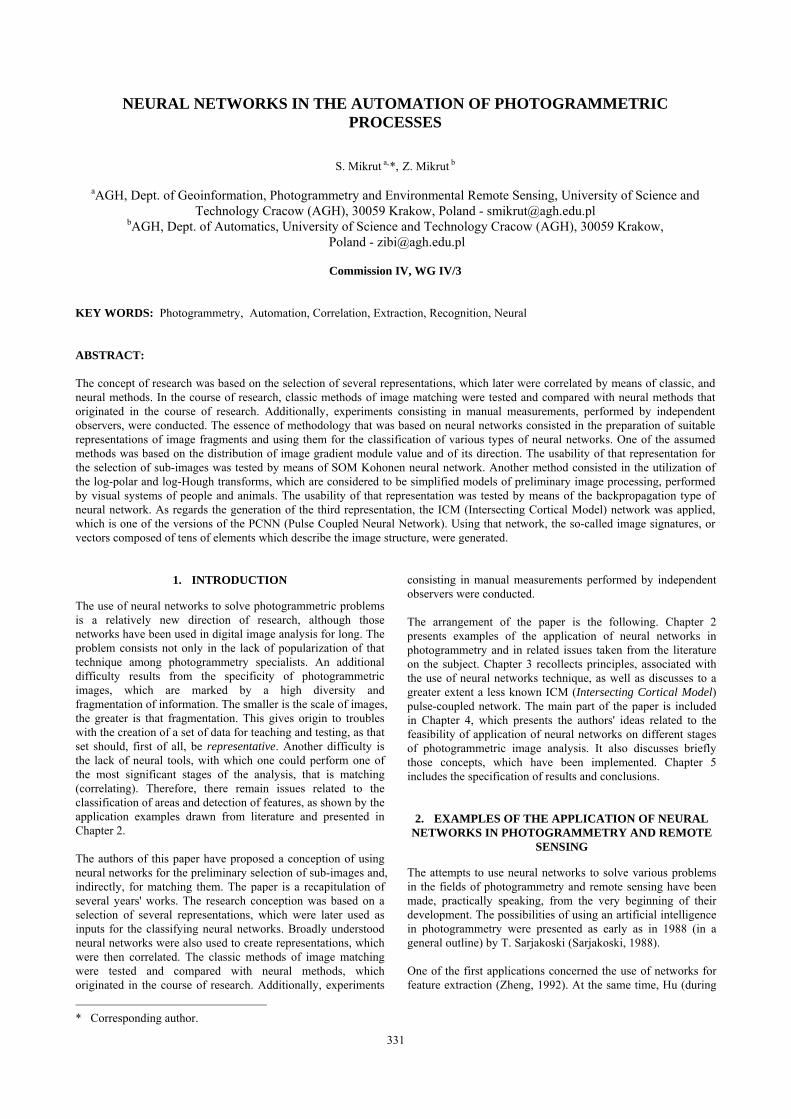
A pulse-coupled neural network (PCNN) is a model of a biological network, and specifically, a model of fragment of cat's sight network (Eckhorn et al., 1990). Those networks are used to process digital images. By using them, it is possible to perform such operations as image segmentation, or contour detection. The theory and possibilities of application of those networks were most fully described in (Lindblad et al., 2005). A pulse-coupled neural network is a single-layer network. It is composed of neurons, and each of them is linked to one pixel of the input image. Fig. 1 shows the block diagram of a single neuron. This is a simplified model of a PCNN network, introduced by Kinser (Kinser, 1996) and named ICM (Intersecting Cortical Model). The simplification consists in the elimination of one of feedback loops. The pulse-coupled neuron is described by means of the following equations:
[ ] [ ] [∑++=+kl
klijklijijij nYWSnfFnF 1 ] (1)
[ ] [ ] [ 11 + ]+Θ=+Θ nhYngn ijijij (2)
[ ] [ ] [ ]⎩⎨⎧ Θ>+
=+otherwise
nnFwhenn ijij
ij 011
1Y (3)
where:
Sij – excitation (input image pixel rescaled to the [0, 1] range),
Fij – component involving the feedback Θij – neuron threshold, Yij – external state of the neuron (1 – pulse, 0 – no
pulse), Wi
jkl
– ij neuron neighbourhood coefficients, with kl coordinates for F
VF – gain amplification coefficient for F n – iteration number (n=1,...,N).
Σ S
Θ
- Y F
W* Y
Σ
Figure 1. Single neuron of the ICM pulse-coupled network
A single neuron generates a pulse in the moment, when total level of excitation of F exceeds the threshold value. After the pulse has been generated, the threshold value rapidly increases, and then gradually drops down to its rest value. In addition to S image pixel value, also feedback signal from adjacent neurons affects the F neuron excitation. During the subsequent
332
The International Archives of the Photogrammetry, Remote Sensing and Spatial Information Sciences. Vol. XXXVII. Part B4. Beijing 2008
calculation steps, the network generates binary images, with value 1 pixels corresponding to the emergence of a pulse, and value 0 signals corresponding to the lack of a pulse. In research works described in Chapter 4, that network was used as a generator of an aerial image fragment representation. That representation is the so-called signature. It is a single-dimensional function, created after the application of the (4) formula to subsequent binary images generated by the network:
[ ] [ ]∑=ji
ij nYnG,
(4)
with n range of changes determining the length and location of the signature. 3.2 Biological neural network model
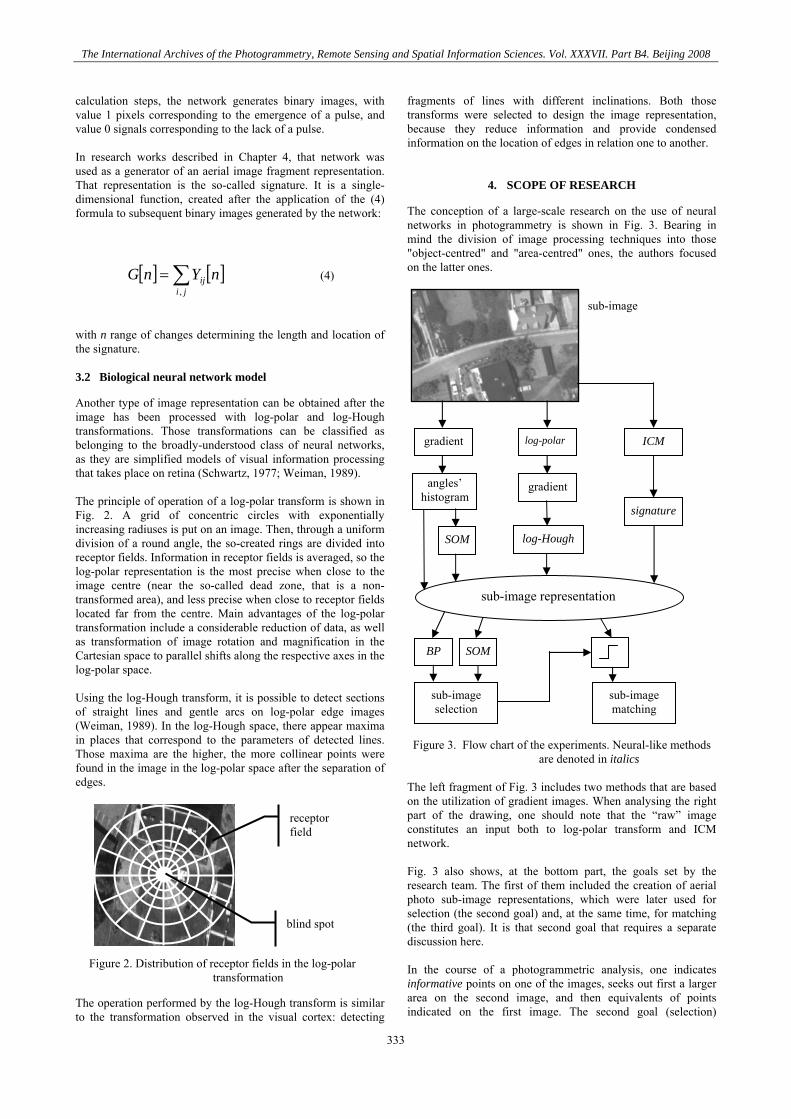
Another type of image representation can be obtained after the image has been processed with log-polar and log-Hough transformations. Those transformations can be classified as belonging to the broadly-understood class of neural networks, as they are simplified models of visual information processing that takes place on retina (Schwartz, 1977; Weiman, 1989). The principle of operation of a log-polar transform is shown in Fig. 2. A grid of concentric circles with exponentially increasing radiuses is put on an image. Then, through a uniform division of a round angle, the so-created rings are divided into receptor fields. Information in receptor fields is averaged, so the log-polar representation is the most precise when close to the image centre (near the so-called dead zone, that is a non-transformed area), and less precise when close to receptor fields located far from the centre. Main advantages of the log-polar transformation include a considerable reduction of data, as well as transformation of image rotation and magnification in the Cartesian space to parallel shifts along the respective axes in the log-polar space. Using the log-Hough transform, it is possible to detect sections of straight lines and gentle arcs on log-polar edge images (Weiman, 1989). In the log-Hough space, there appear maxima in places that correspond to the parameters of detected lines. Those maxima are the higher, the more collinear points were found in the image in the log-polar space after the separation of edges.
The operation performed by the log-Hough transform is similar to the transformation observed in the visual cortex: detecting
fragments of lines with different inclinations. Both those transforms were selected to design the image representation, because they reduce information and provide condensed information on the location of edges in relation one to another.
4. SCOPE OF RESEARCH
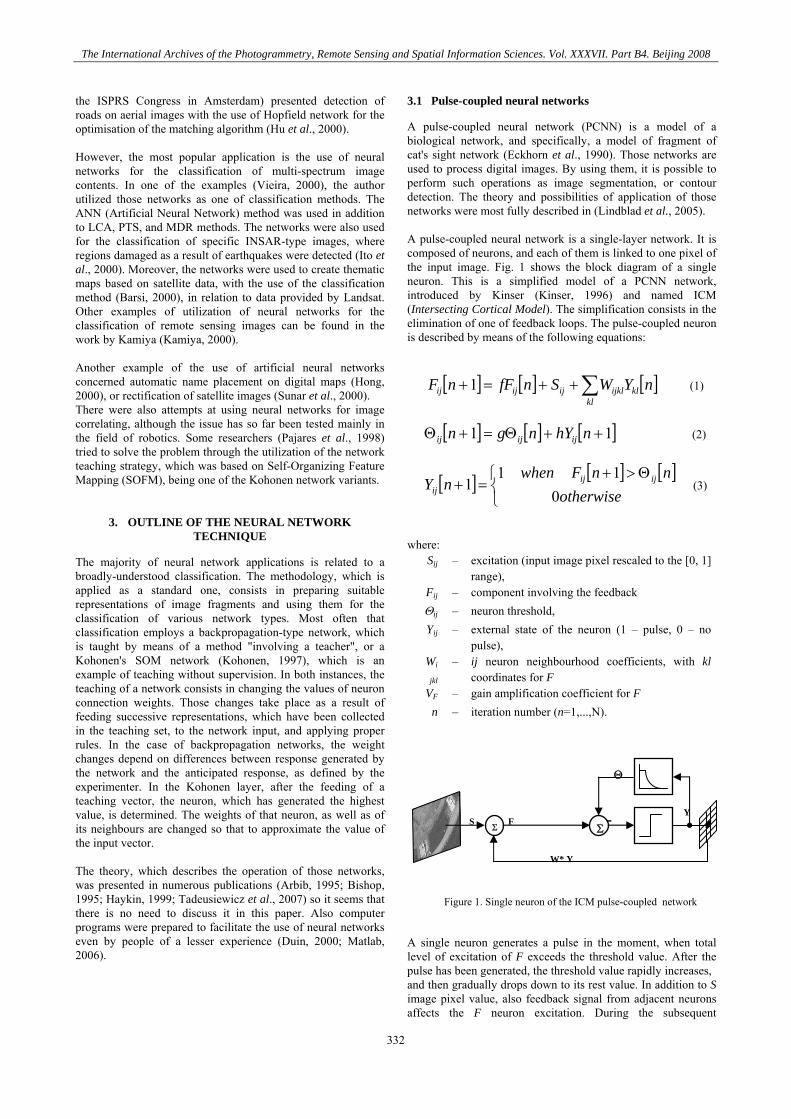
The conception of a large-scale research on the use of neural networks in photogrammetry is shown in Fig. 3. Bearing in mind the division of image processing techniques into those "object-centred" and "area-centred" ones, the authors focused on the latter ones.
Figure 3. Flow chart of the experiments. Neural-like methods
are denoted in italics The left fragment of Fig. 3 includes two methods that are based on the utilization of gradient images. When analysing the right part of the drawing, one should note that the “raw” image constitutes an input both to log-polar transform and ICM network. Fig. 3 also shows, at the bottom part, the goals set by the research team. The first of them included the creation of aerial photo sub-image representations, which were later used for selection (the second goal) and, at the same time, for matching (the third goal). It is that second goal that requires a separate discussion here. In the course of a photogrammetric analysis, one indicates informative points on one of the images, seeks out first a larger area on the second image, and then equivalents of points indicated on the first image. The second goal (selection)
gradient log-polar ICM
angles’ histogram
gradient
signature
log-Hough
sub-image representation
SOM
sub-image selection
sub-image
BP SOM
sub-image matching
receptor field
blind spot
Figure 2. Distribution of receptor fields in the log-polar transformation
333
The International Archives of the Photogrammetry, Remote Sensing and Spatial Information Sciences. Vol. XXXVII. Part B4. Beijing 2008
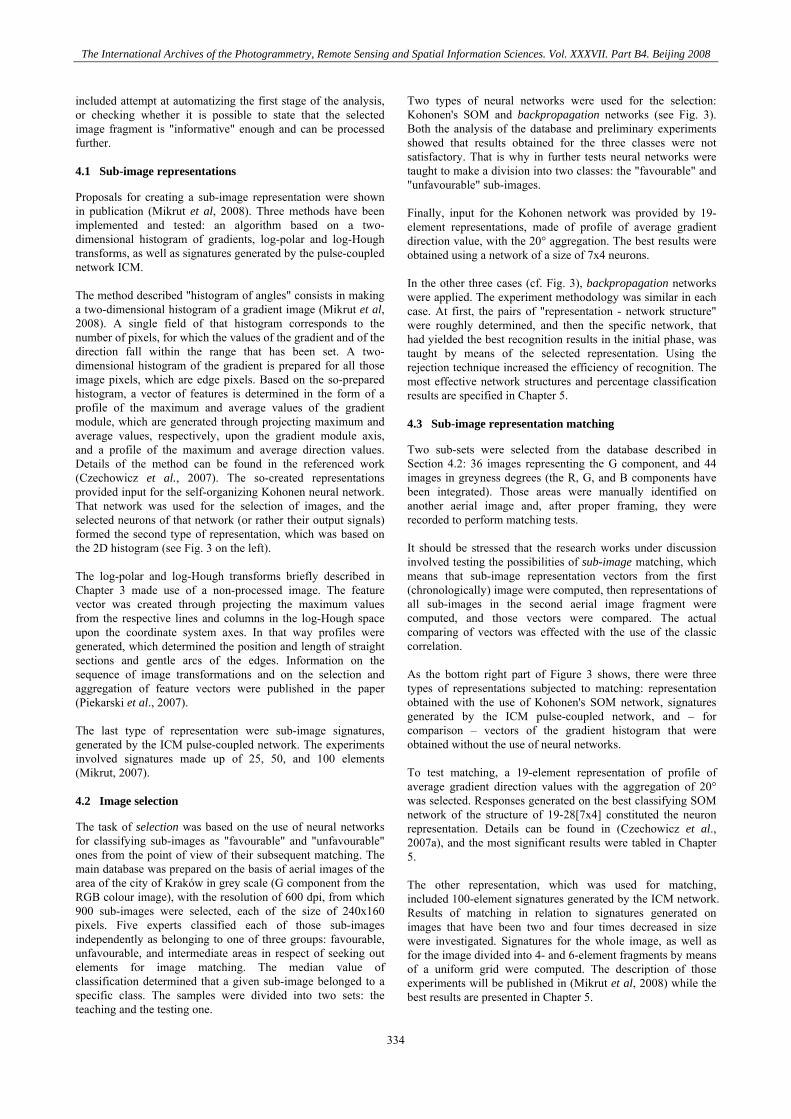
included attempt at automatizing the first stage of the analysis, or checking whether it is possible to state that the selected image fragment is "informative" enough and can be processed further. 4.1 Sub-image representations
Proposals for creating a sub-image representation were shown in publication (Mikrut et al, 2008). Three methods have been implemented and tested: an algorithm based on a two-dimensional histogram of gradients, log-polar and log-Hough transforms, as well as signatures generated by the pulse-coupled network ICM. The method described "histogram of angles" consists in making a two-dimensional histogram of a gradient image (Mikrut et al, 2008). A single field of that histogram corresponds to the number of pixels, for which the values of the gradient and of the direction fall within the range that has been set. A two-dimensional histogram of the gradient is prepared for all those image pixels, which are edge pixels. Based on the so-prepared histogram, a vector of features is determined in the form of a profile of the maximum and average values of the gradient module, which are generated through projecting maximum and average values, respectively, upon the gradient module axis, and a profile of the maximum and average direction values. Details of the method can be found in the referenced work (Czechowicz et al., 2007). The so-created representations provided input for the self-organizing Kohonen neural network. That network was used for the selection of images, and the selected neurons of that network (or rather their output signals) formed the second type of representation, which was based on the 2D histogram (see Fig. 3 on the left). The log-polar and log-Hough transforms briefly described in Chapter 3 made use of a non-processed image. The feature vector was created through projecting the maximum values from the respective lines and columns in the log-Hough space upon the coordinate system axes. In that way profiles were generated, which determined the position and length of straight sections and gentle arcs of the edges. Information on the sequence of image transformations and on the selection and aggregation of feature vectors were published in the paper (Piekarski et al., 2007). The last type of representation were sub-image signatures, generated by the ICM pulse-coupled network. The experiments involved signatures made up of 25, 50, and 100 elements (Mikrut, 2007). 4.2 Image selection
The task of selection was based on the use of neural networks for classifying sub-images as "favourable" and "unfavourable" ones from the point of view of their subsequent matching. The main database was prepared on the basis of aerial images of the area of the city of Kraków in grey scale (G component from the RGB colour image), with the resolution of 600 dpi, from which 900 sub-images were selected, each of the size of 240x160 pixels. Five experts classified each of those sub-images independently as belonging to one of three groups: favourable, unfavourable, and intermediate areas in respect of seeking out elements for image matching. The median value of classification determined that a given sub-image belonged to a specific class. The samples were divided into two sets: the teaching and the testing one.
Two types of neural networks were used for the selection: Kohonen's SOM and backpropagation networks (see Fig. 3). Both the analysis of the database and preliminary experiments showed that results obtained for the three classes were not satisfactory. That is why in further tests neural networks were taught to make a division into two classes: the "favourable" and "unfavourable" sub-images. Finally, input for the Kohonen network was provided by 19-element representations, made of profile of average gradient direction value, with the 20° aggregation. The best results were obtained using a network of a size of 7x4 neurons. In the other three cases (cf. Fig. 3), backpropagation networks were applied. The experiment methodology was similar in each case. At first, the pairs of "representation - network structure" were roughly determined, and then the specific network, that had yielded the best recognition results in the initial phase, was taught by means of the selected representation. Using the rejection technique increased the efficiency of recognition. The most effective network structures and percentage classification results are specified in Chapter 5. 4.3 Sub-image representation matching
Two sub-sets were selected from the database described in Section 4.2: 36 images representing the G component, and 44 images in greyness degrees (the R, G, and B components have been integrated). Those areas were manually identified on another aerial image and, after proper framing, they were recorded to perform matching tests. It should be stressed that the research works under discussion involved testing the possibilities of sub-image matching, which means that sub-image representation vectors from the first (chronologically) image were computed, then representations of all sub-images in the second aerial image fragment were computed, and those vectors were compared. The actual comparing of vectors was effected with the use of the classic correlation. As the bottom right part of Figure 3 shows, there were three types of representations subjected to matching: representation obtained with the use of Kohonen's SOM network, signatures generated by the ICM pulse-coupled network, and – for comparison – vectors of the gradient histogram that were obtained without the use of neural networks. To test matching, a 19-element representation of profile of average gradient direction values with the aggregation of 20° was selected. Responses generated on the best classifying SOM network of the structure of 19-28[7x4] constituted the neuron representation. Details can be found in (Czechowicz et al., 2007a), and the most significant results were tabled in Chapter 5. The other representation, which was used for matching, included 100-element signatures generated by the ICM network. Results of matching in relation to signatures generated on images that have been two and four times decreased in size were investigated. Signatures for the whole image, as well as for the image divided into 4- and 6-element fragments by means of a uniform grid were computed. The description of those experiments will be published in (Mikrut et al, 2008) while the best results are presented in Chapter 5.
334
The International Archives of the Photogrammetry, Remote Sensing and Spatial Information Sciences. Vol. XXXVII. Part B4. Beijing 2008
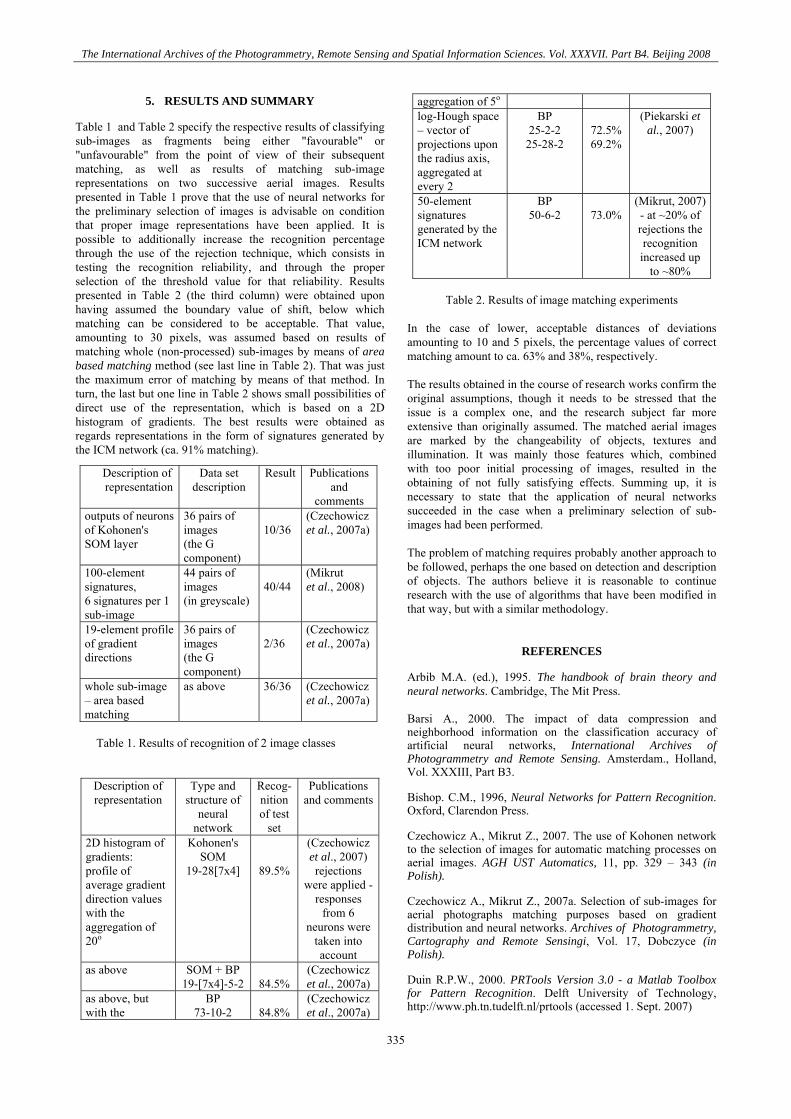
5. RESULTS AND SUMMARY
Table 1 and Table 2 specify the respective results of classifying sub-images as fragments being either "favourable" or "unfavourable" from the point of view of their subsequent matching, as well as results of matching sub-image representations on two successive aerial images. Results presented in Table 1 prove that the use of neural networks for the preliminary selection of images is advisable on condition that proper image representations have been applied. It is possible to additionally increase the recognition percentage through the use of the rejection technique, which consists in testing the recognition reliability, and through the proper selection of the threshold value for that reliability. Results presented in Table 2 (the third column) were obtained upon having assumed the boundary value of shift, below which matching can be considered to be acceptable. That value, amounting to 30 pixels, was assumed based on results of matching whole (non-processed) sub-images by means of area based matching method (see last line in Table 2). That was just the maximum error of matching by means of that method. In turn, the last but one line in Table 2 shows small possibilities of direct use of the representation, which is based on a 2D histogram of gradients. The best results were obtained as regards representations in the form of signatures generated by the ICM network (ca. 91% matching).
Table 1. Results of recognition of 2 image classes
Description of representation
Type and structure of
neural network
Recog-nition of test
set
Publications and comments
2D histogram of gradients: profile of average gradient direction values with the aggregation of 20o
Kohonen's SOM
19-28[7x4]
89.5%
(Czechowicz et al., 2007)rejections
were applied - responses
from 6 neurons were
taken into account
as above SOM + BP19-[7x4]-5-2
84.5%
(Czechowicz et al., 2007a)
as above, but with the
BP 73-10-2
84.8%
(Czechowicz et al., 2007a)
aggregation of 5o
log-Hough space – vector of projections upon the radius axis, aggregated at every 2
BP 25-2-2
25-28-2
72.5% 69.2%
(Piekarski et al., 2007)
50-element signatures generated by the ICM network
BP 50-6-2
73.0%
(Mikrut, 2007) - at ~20% of rejections the recognition increased up
to ~80%
Table 2. Results of image matching experiments In the case of lower, acceptable distances of deviations amounting to 10 and 5 pixels, the percentage values of correct matching amount to ca. 63% and 38%, respectively. The results obtained in the course of research works confirm the original assumptions, though it needs to be stressed that the issue is a complex one, and the research subject far more extensive than originally assumed. The matched aerial images are marked by the changeability of objects, textures and illumination. It was mainly those features which, combined with too poor initial processing of images, resulted in the obtaining of not fully satisfying effects. Summing up, it is necessary to state that the application of neural networks succeeded in the case when a preliminary selection of sub-images had been performed. The problem of matching requires probably another approach to be followed, perhaps the one based on detection and description of objects. The authors believe it is reasonable to continue research with the use of algorithms that have been modified in that way, but with a similar methodology.
REFERENCES
Arbib M.A. (ed.), 1995. The handbook of brain theory and neural networks. Cambridge, The Mit Press. Barsi A., 2000. The impact of data compression and neighborhood information on the classification accuracy of artificial neural networks, International Archives of Photogrammetry and Remote Sensing. Amsterdam., Holland, Vol. XXXIII, Part B3.
Bishop. C.M., 1996, Neural Networks for Pattern Recognition. Oxford, Clarendon Press.
Czechowicz A., Mikrut Z., 2007. The use of Kohonen network to the selection of images for automatic matching processes on aerial images. AGH UST Automatics, 11, pp. 329 – 343 (in Polish).
Czechowicz A., Mikrut Z., 2007a. Selection of sub-images for aerial photographs matching purposes based on gradient distribution and neural networks. Archives of Photogrammetry, Cartography and Remote Sensingi, Vol. 17, Dobczyce (in Polish).
Duin R.P.W., 2000. PRTools Version 3.0 - a Matlab Toolbox for Pattern Recognition. Delft University of Technology, http://www.ph.tn.tudelft.nl/prtools (accessed 1. Sept. 2007)
Description of representation
Data set description
Result Publications and
comments outputs of neurons of Kohonen's SOM layer
36 pairs of images (the G component)
10/36
(Czechowicz et al., 2007a)
100-element signatures, 6 signatures per 1 sub-image
44 pairs of images (in greyscale)
40/44
(Mikrut et al., 2008)
19-element profile of gradient directions
36 pairs of images (the G component)
2/36
(Czechowicz et al., 2007a)
whole sub-image – area based matching
as above 36/36
(Czechowicz et al., 2007a)
335
The International Archives of the Photogrammetry, Remote Sensing and Spatial Information Sciences. Vol. XXXVII. Part B4. Beijing 2008
Eckhorn R., Reitboeck H.J., Arndt M., Dicke P., 1990. Feature linking via synchronization among distributed assemblies: Simulations of results from Cat Visual Cortex. Neural Comp., 2, pp. 293-307.
Haykin S.S., 1999. Neural networks : a comprehensive foundation. Upper Saddle River, Prentice Hall.
Hong F., Zhang Z., Daosheng D., 2000. A Hopfied neural network algorithm for automated name placement for point feature, International Archives of Photogrammetry and Remote Sensing. Amsterdam., Holland, Vol. XXXIII, Part B3.
Hu X., Zhang Z., Zhang J., 2000. An approach of semiautomated road extraction from aerial image based on template matching and neural network. International Archives of Photogrammetry and Remote Sensing. Amsterdam., Holland, Vol. XXXIII, Part B3, pp. 994-999.
Ito Y., Hosokawa M., Lee H., Liu J.G., 2000. Extraction of damaged regions using SAR data and neural networks, International Archives of Photogrammetry and Remote Sensing. Amsterdam., Holland, Vol. XXXIII, Part B1, pp. 156-163.
Kamiya I., 2000. Image classification by spatial shift invariant neural network, International Archives of Photogrammetry and Remote Sensing. Amsterdam., Holland, Vol. XXXIII, Part B3.
Kinser J.M., 1996. A Simplified Pulse-Coupled Neural Network. Proc. SPIE, 2760, No. 3.
Kohonen T., 1997. Self-Organizing Maps. New York, Springer-Verlag.
Lindblad T., Kinser J.M., 2005. Image Processing Using Pulse-Coupled Neural Networks. Springer, Berlin Heidelberg New York.
Matlab 2006. Image Processing Toolbox For Use with Matlab. User's Guide. The MathWorks, Inc., Natick.
Mikrut Z., 2007. PCNN-like neural networks as a tool for the generation of the aerial subimage representations. AGH UST Automatics, 11, pp. 355 – 364 (in Polish).
Mikrut S. (ed.), 2008. Neural networks in processes of automatic matching of aerial images. AGH UST Press (in press) (in Polish)
Pajares G., Cruz J.M., Aranda J., 1998. Stereo matching based on the self-organizing feature-mapping algorithm, Pattern Recognition Letters 19, s. 319-330.
Piekarski P., Mikrut Z., 2007. Log-Hough based image representation for the neural classifier. . Archives of Photogrammetry, Cartography and Remote Sensingi, Vol. 17, Dobczyce (in Polish).
Sarjakoski T., 1988. Artificial intelligence in Photogrammetry. Photogrammetria (PRS) 42, pp. 245-270.
Schwartz E.L., 1977. Spatial mapping in the primate sensory projection: analytic structure and relevance to perception. Biological Cybernetics, 25, pp. 181-194.
Sunar F., Özkan C., 2000. Rectification of remotely sensed images with artificial neural network, International Archives of Photogrammetry and Remote Sensing. Amsterdam., Holland, Vol. XXXIII, Part B3
Tadeusiewicz R., Gąciarz T., Borowik B., Leper B., 2007. Exploration of the neural network features using C# programs. Polish Academy of Arts And Sciences Press, Kraków (in Polish).
Vieira C., Mather P., McCullagh M., 2000. The spectral-temporal response surface and its use in the multi-sensor, multitemporal classification of agricultural crops. International Archives of Photogrammetry and Remote Sensing. Amsterdam, Holland, Vol. XXXIII, Part B2
Weiman C.F.R., 1989. Polar exponential sensor arrays unify iconic and Hough space representation. Proc. SPIE, 1192, Inteligent robots and computer vision VIII.
Zheng Y-J, 1992. Feature extraction: a neural network oriented approach. Int. Archives of Photogrammetry and Remote Sensing, 29.
ACKNOWLEDGEMENTS
The research works described herein were performed under the research grant no. 4T12E 001 27, offered by the State Committee for Scientific Research in Poland.
336