Embed Size (px)
Citation preview
Neuberger Berman Multi-Asset Class Growth FundJuly 2018
For Professional Client Use Only

FIRM OVERVIEW
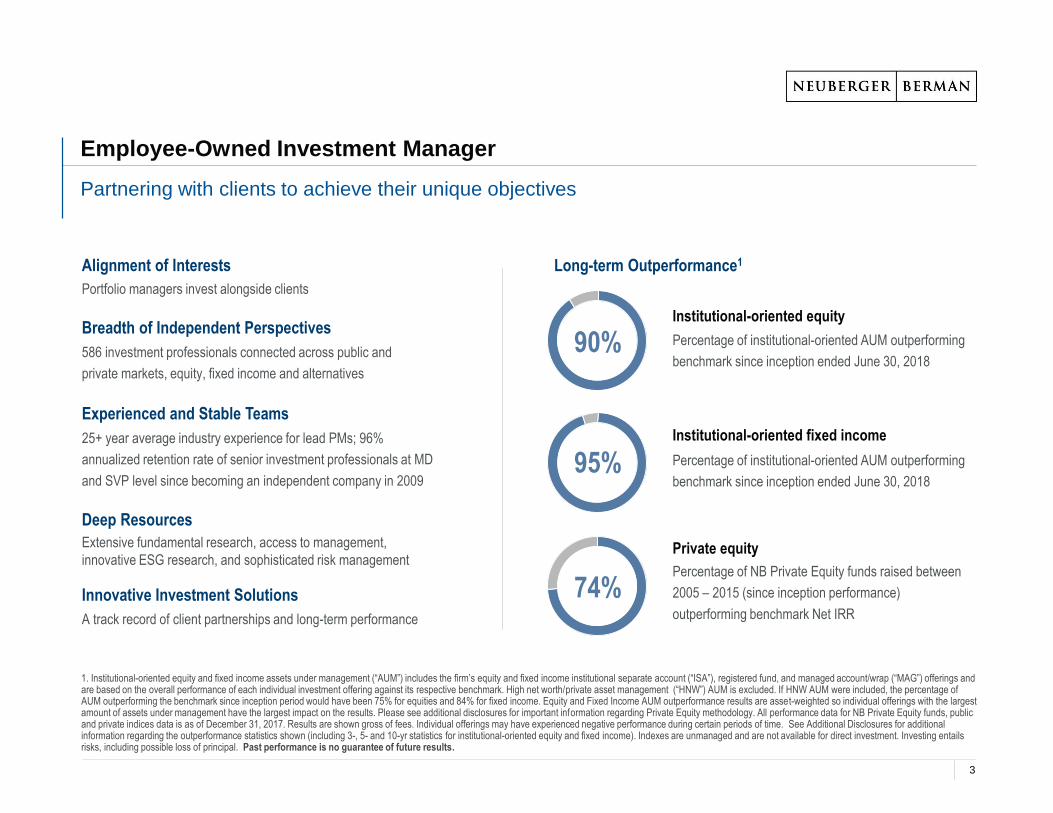
Employee-Owned Investment Manager
Partnering with clients to achieve their unique objectives
1. Institutional-oriented equity and fixed income assets under management (“AUM”) includes the firm’s equity and fixed income institutional separate account (“ISA”), registered fund, and managed account/wrap (“MAG”) offerings and are based on the overall performance of each individual investment offering against its respective benchmark. High net worth/private asset management (“HNW”) AUM is excluded. If HNW AUM were included, the percentage of AUM outperforming the benchmark since inception period would have been 75% for equities and 84% for fixed income. Equity and Fixed Income AUM outperformance results are asset-weighted so individual offerings with the largest amount of assets under management have the largest impact on the results. Please see additional disclosures for important information regarding Private Equity methodology. All performance data for NB Private Equity funds, public and private indices data is as of December 31, 2017. Results are shown gross of fees. Individual offerings may have experienced negative performance during certain periods of time. See Additional Disclosures for additional information regarding the outperformance statistics shown (including 3-, 5- and 10-yr statistics for institutional-oriented equity and fixed income). Indexes are unmanaged and are not available for direct investment. Investing entails risks, including possible loss of principal. Past performance is no guarantee of future results.
Long-term Outperformance1Alignment of Interests
Portfolio managers invest alongside clients
Breadth of Independent Perspectives
586 investment professionals connected across public and
private markets, equity, fixed income and alternatives
Experienced and Stable Teams
25+ year average industry experience for lead PMs; 96%
annualized retention rate of senior investment professionals at MD
and SVP level since becoming an independent company in 2009
Innovative Investment Solutions
A track record of client partnerships and long-term performance
90%Institutional-oriented equity
Percentage of institutional-oriented AUM outperforming
benchmark since inception ended June 30, 2018
95%Institutional-oriented fixed income
Percentage of institutional-oriented AUM outperforming
benchmark since inception ended June 30, 2018
74%
Private equity
Percentage of NB Private Equity funds raised between
2005 – 2015 (since inception performance)
outperforming benchmark Net IRR
Deep Resources
Extensive fundamental research, access to management,
innovative ESG research, and sophisticated risk management
3
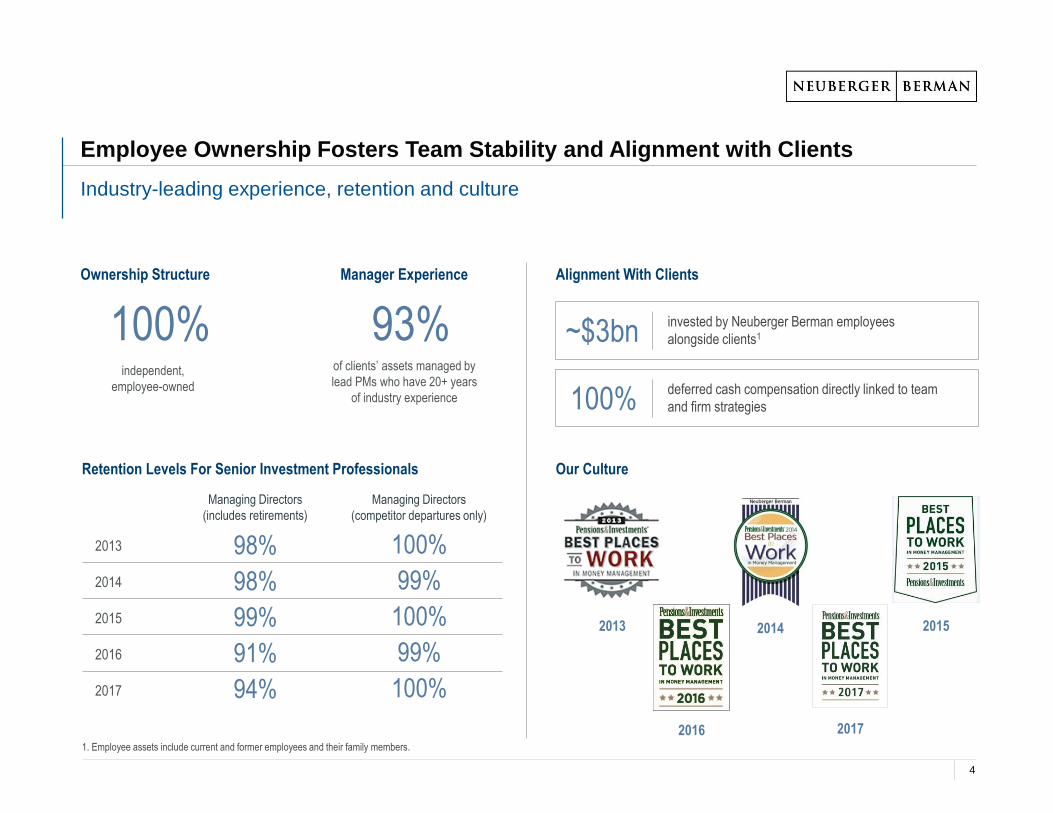
Employee Ownership Fosters Team Stability and Alignment with Clients
Industry-leading experience, retention and culture
1. Employee assets include current and former employees and their family members.
of clients’ assets managed by
lead PMs who have 20+ years
of industry experience
Manager Experience
Retention Levels For Senior Investment Professionals
Managing Directors
(includes retirements)
Managing Directors
(competitor departures only)
98%
98%
99%
91%
94%
100%
99%
100%
99%
100%
2013
2014
2015
2016
2017
93%
Alignment With Clients
invested by Neuberger Berman employees
alongside clients1~$3bn100%independent,
employee-owned
Ownership Structure
deferred cash compensation directly linked to team
and firm strategies100%
Our Culture
2013 2014 2015
2016 2017
4
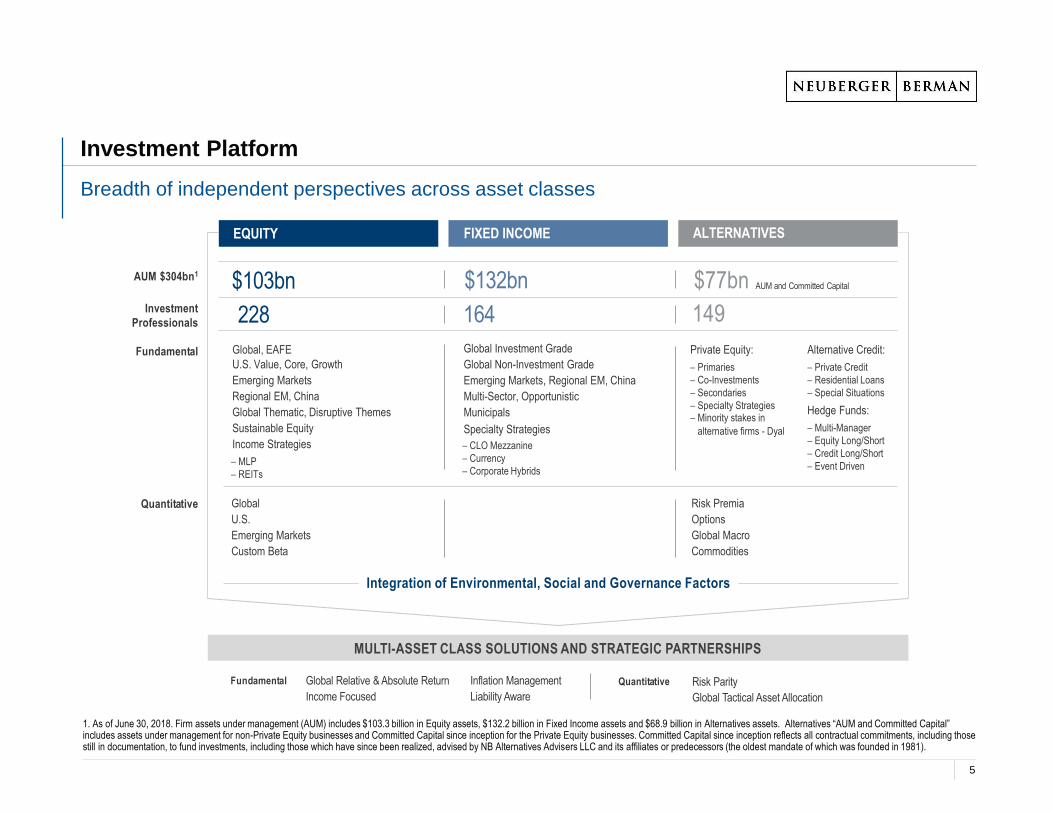
Investment Platform
Breadth of independent perspectives across asset classes
1. As of June 30, 2018. Firm assets under management (AUM) includes $103.3 billion in Equity assets, $132.2 billion in Fixed Income assets and $68.9 billion in Alternatives assets. Alternatives “AUM and Committed Capital” includes assets under management for non-Private Equity businesses and Committed Capital since inception for the Private Equity businesses. Committed Capital since inception reflects all contractual commitments, including those still in documentation, to fund investments, including those which have since been realized, advised by NB Alternatives Advisers LLC and its affiliates or predecessors (the oldest mandate of which was founded in 1981).
EQUITY FIXED INCOME ALTERNATIVES
AUM $304bn1
Investment
Professionals
$103bn
228
$132bn
164
Risk Parity
Global Tactical Asset Allocation
Global Relative & Absolute Return
Income Focused
Inflation Management
Liability Aware
$77bn AUM and Committed Capital
149
Quantitative Global
U.S.
Emerging Markets
Custom Beta
Risk Premia
Options
Global Macro
Commodities
Fundamental Global, EAFE
U.S. Value, Core, Growth
Emerging Markets
Regional EM, China
Global Thematic, Disruptive Themes
Sustainable Equity
Income Strategies
– MLP
– REITs
Global Investment Grade
Global Non-Investment Grade
Emerging Markets, Regional EM, China
Multi-Sector, Opportunistic
Municipals
Specialty Strategies
– CLO Mezzanine
– Currency
– Corporate Hybrids
Private Equity:
– Primaries
– Co-Investments
– Secondaries
– Specialty Strategies– Minority stakes in
alternative firms - Dyal
Alternative Credit:
– Private Credit
– Residential Loans
– Special Situations
Hedge Funds:
– Multi-Manager
– Equity Long/Short
– Credit Long/Short
– Event Driven
QuantitativeFundamental
MULTI-ASSET CLASS SOLUTIONS AND STRATEGIC PARTNERSHIPS
Integration of Environmental, Social and Governance Factors
5

NEUBERGER BERMAN MULTI-ASSET CLASS GROWTH FUND
For Professional Client Use Only
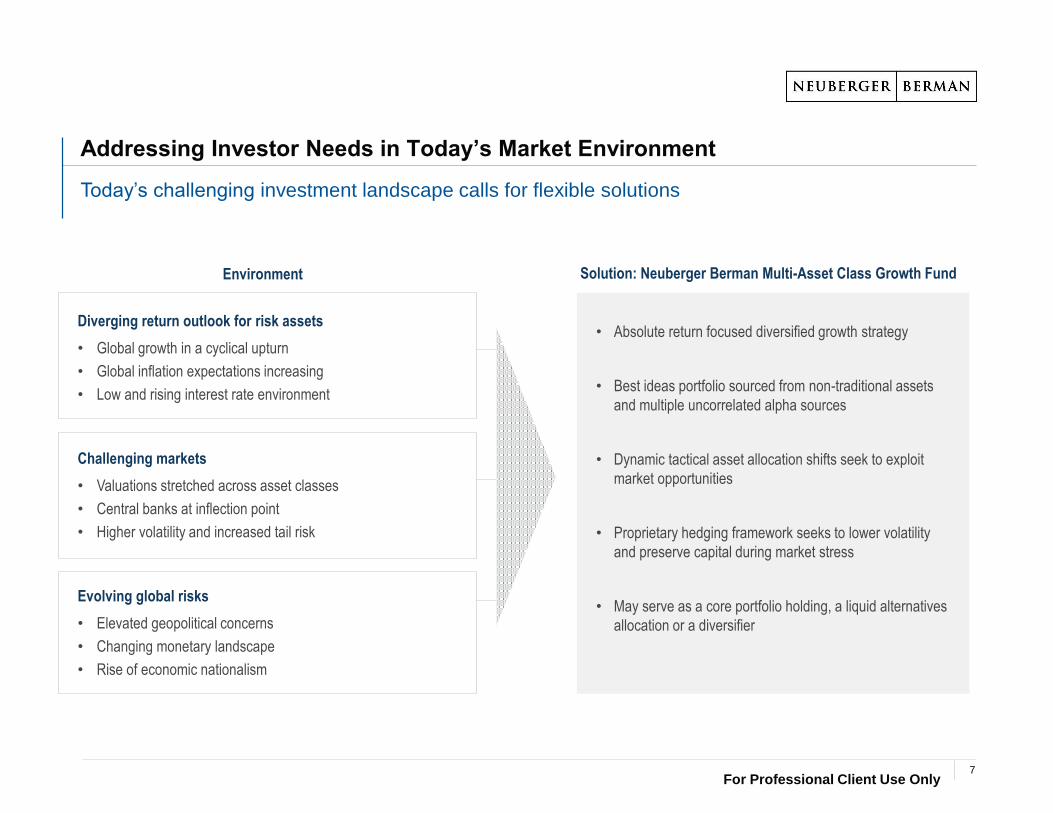
Addressing Investor Needs in Today’s Market Environment
Today’s challenging investment landscape calls for flexible solutions
Solution: Neuberger Berman Multi-Asset Class Growth FundEnvironment
Diverging return outlook for risk assets
• Global growth in a cyclical upturn
• Global inflation expectations increasing
• Low and rising interest rate environment
Challenging markets
• Valuations stretched across asset classes
• Central banks at inflection point
• Higher volatility and increased tail risk
Evolving global risks
• Elevated geopolitical concerns
• Changing monetary landscape
• Rise of economic nationalism
• Absolute return focused diversified growth strategy
• Best ideas portfolio sourced from non-traditional assets
and multiple uncorrelated alpha sources
• Dynamic tactical asset allocation shifts seek to exploit
market opportunities
• Proprietary hedging framework seeks to lower volatility
and preserve capital during market stress
• May serve as a core portfolio holding, a liquid alternatives
allocation or a diversifier
7
For Professional Client Use Only
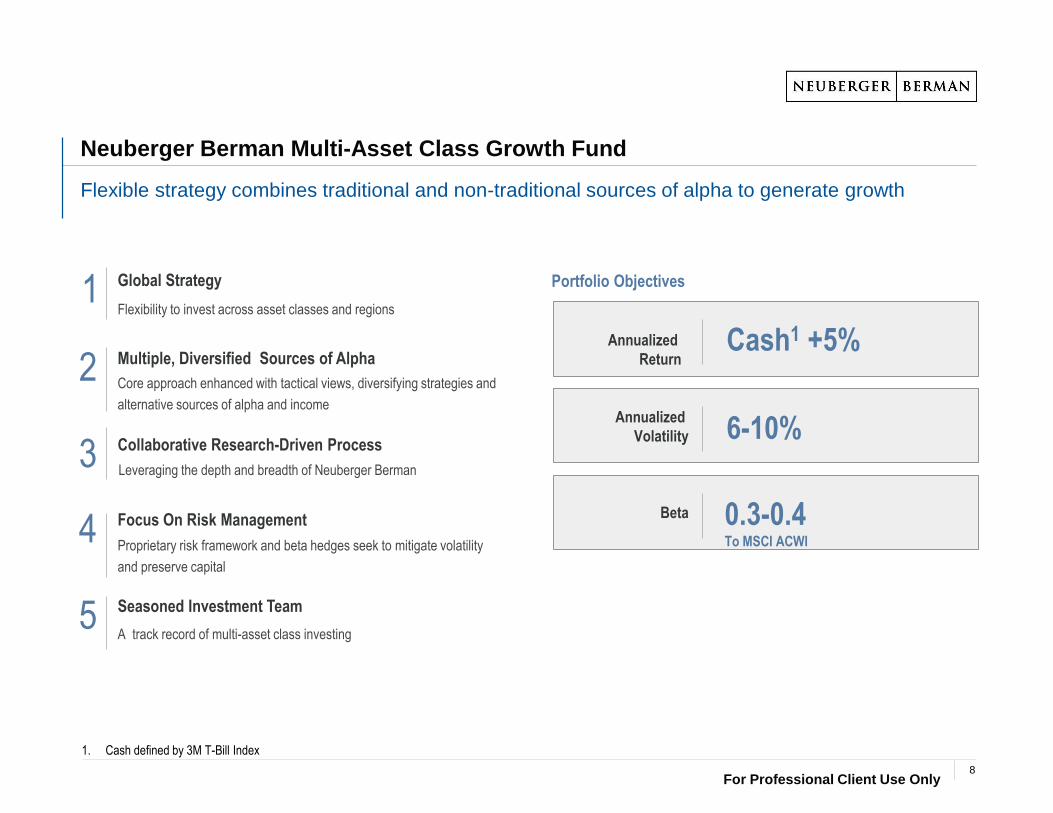
Neuberger Berman Multi-Asset Class Growth Fund
Flexible strategy combines traditional and non-traditional sources of alpha to generate growth
Portfolio Objectives
Cash1 +5%
Annualized
Volatility
Leveraging the depth and breadth of Neuberger Berman
Flexibility to invest across asset classes and regions
Core approach enhanced with tactical views, diversifying strategies and
alternative sources of alpha and income
Proprietary risk framework and beta hedges seek to mitigate volatility
and preserve capital
Global Strategy
Multiple, Diversified Sources of Alpha
Collaborative Research-Driven Process
Focus On Risk Management
A track record of multi-asset class investing
Seasoned Investment Team
1
2
3
4
5
Annualized
Return
6-10%
Beta 0.3-0.4To MSCI ACWI
1. Cash defined by 3M T-Bill Index
8
For Professional Client Use Only
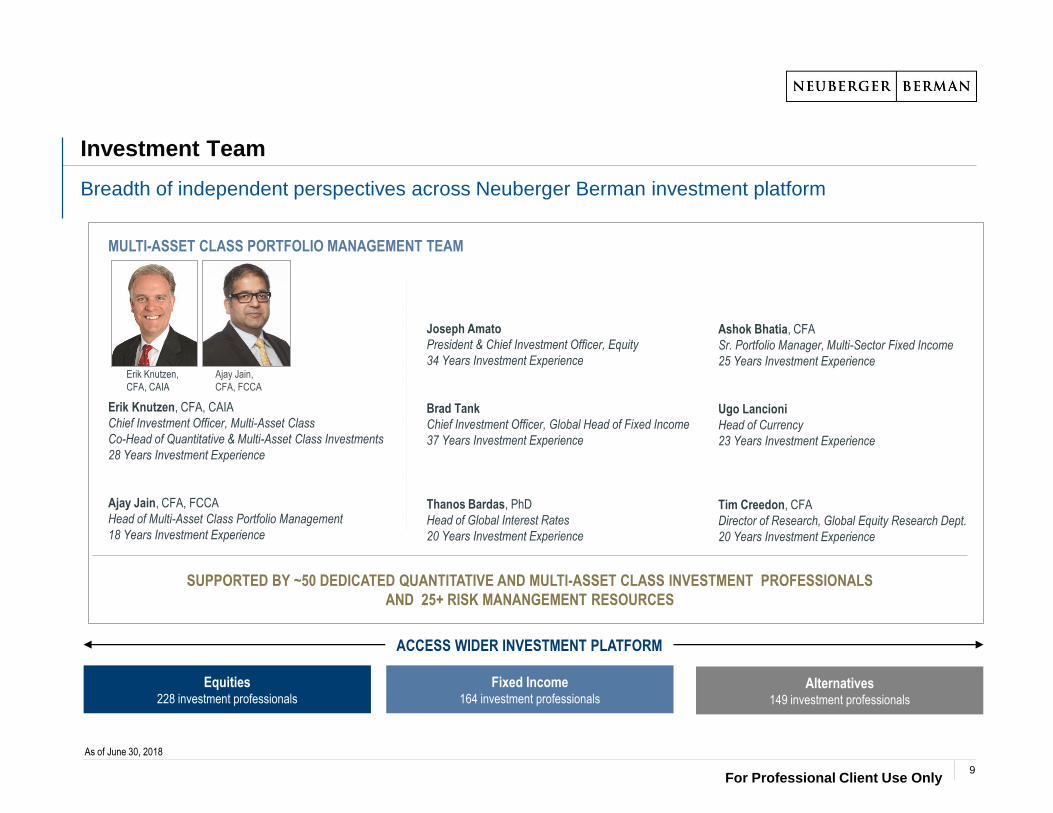
MULTI-ASSET CLASS PORTFOLIO MANAGEMENT TEAM
Erik Knutzen, CFA, CAIA
Chief Investment Officer, Multi-Asset Class
Co-Head of Quantitative & Multi-Asset Class Investments
28 Years Investment Experience
Ajay Jain, CFA, FCCA
Head of Multi-Asset Class Portfolio Management
18 Years Investment Experience
Investment Team
Breadth of independent perspectives across Neuberger Berman investment platform
As of June 30, 2018
Equities228 investment professionals
Fixed Income164 investment professionals
Erik Knutzen,
CFA, CAIA
Ajay Jain,
CFA, FCCA
Joseph Amato
President & Chief Investment Officer, Equity
34 Years Investment Experience
Brad Tank
Chief Investment Officer, Global Head of Fixed Income
37 Years Investment Experience
Thanos Bardas, PhD
Head of Global Interest Rates
20 Years Investment Experience
Ashok Bhatia, CFA
Sr. Portfolio Manager, Multi-Sector Fixed Income
25 Years Investment Experience
Ugo Lancioni
Head of Currency
23 Years Investment Experience
Tim Creedon, CFA
Director of Research, Global Equity Research Dept.
20 Years Investment Experience
SUPPORTED BY ~50 DEDICATED QUANTITATIVE AND MULTI-ASSET CLASS INVESTMENT PROFESSIONALS
AND 25+ RISK MANANGEMENT RESOURCES
ACCESS WIDER INVESTMENT PLATFORM
For Professional Client Use Only
Alternatives149 investment professionals
9
For Professional Client Use Only
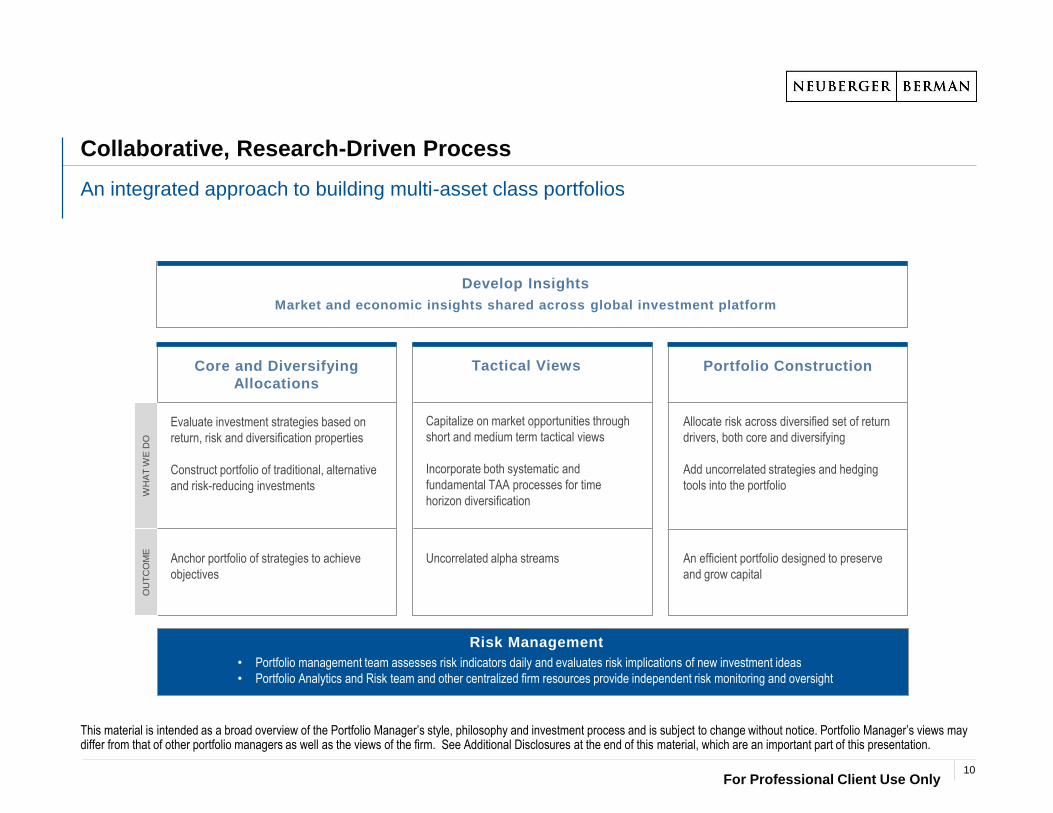
Collaborative, Research-Driven Process
Develop Insights
Risk Management
• Portfolio management team assesses risk indicators daily and evaluates risk implications of new investment ideas
• Portfolio Analytics and Risk team and other centralized firm resources provide independent risk monitoring and oversight
Market and economic insights shared across global investment platform
OU
TC
OM
EW
HA
T W
E D
O
Core and Diversifying
Allocations
Evaluate investment strategies based on
return, risk and diversification properties
Construct portfolio of traditional, alternative
and risk-reducing investments
Anchor portfolio of strategies to achieve
objectives
Tactical Views
Capitalize on market opportunities through
short and medium term tactical views
Incorporate both systematic and
fundamental TAA processes for time
horizon diversification
Uncorrelated alpha streams
Portfolio Construction
Allocate risk across diversified set of return
drivers, both core and diversifying
Add uncorrelated strategies and hedging
tools into the portfolio
An efficient portfolio designed to preserve
and grow capital
An integrated approach to building multi-asset class portfolios
This material is intended as a broad overview of the Portfolio Manager’s style, philosophy and investment process and is subject to change without notice. Portfolio Manager’s views may differ from that of other portfolio managers as well as the views of the firm. See Additional Disclosures at the end of this material, which are an important part of this presentation.
10
For Professional Client Use Only
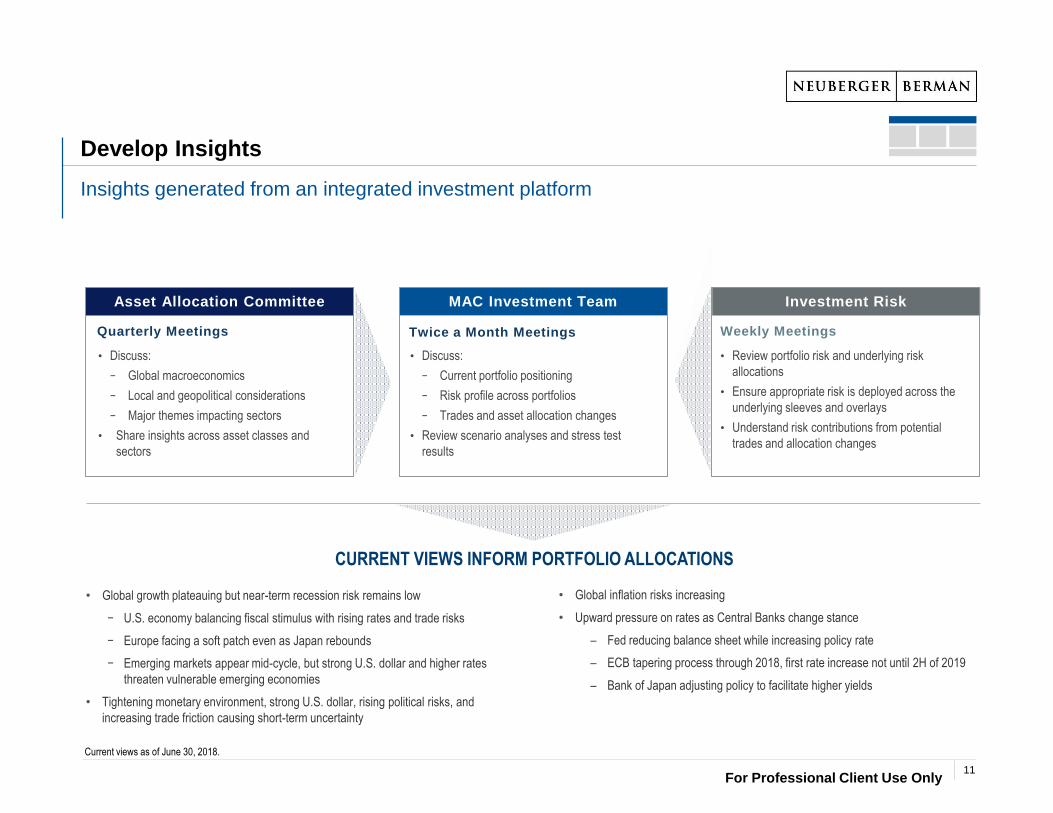
Develop Insights
Insights generated from an integrated investment platform
• Review portfolio risk and underlying risk
allocations
• Ensure appropriate risk is deployed across the
underlying sleeves and overlays
• Understand risk contributions from potential
trades and allocation changes
Weekly Meetings
Investment Risk
• Discuss:
− Global macroeconomics
− Local and geopolitical considerations
− Major themes impacting sectors
• Share insights across asset classes and
sectors
Quarterly Meetings
Asset Allocation Committee MAC Investment Team
• Discuss:
− Current portfolio positioning
− Risk profile across portfolios
− Trades and asset allocation changes
• Review scenario analyses and stress test
results
Twice a Month Meetings
CURRENT VIEWS INFORM PORTFOLIO ALLOCATIONS
Current views as of June 30, 2018.
For Professional Client Use Only
• Global growth plateauing but near-term recession risk remains low
− U.S. economy balancing fiscal stimulus with rising rates and trade risks
− Europe facing a soft patch even as Japan rebounds
− Emerging markets appear mid-cycle, but strong U.S. dollar and higher rates
threaten vulnerable emerging economies
• Tightening monetary environment, strong U.S. dollar, rising political risks, and
increasing trade friction causing short-term uncertainty
• Global inflation risks increasing
• Upward pressure on rates as Central Banks change stance
– Fed reducing balance sheet while increasing policy rate
– ECB tapering process through 2018, first rate increase not until 2H of 2019
– Bank of Japan adjusting policy to facilitate higher yields
11
For Professional Client Use Only
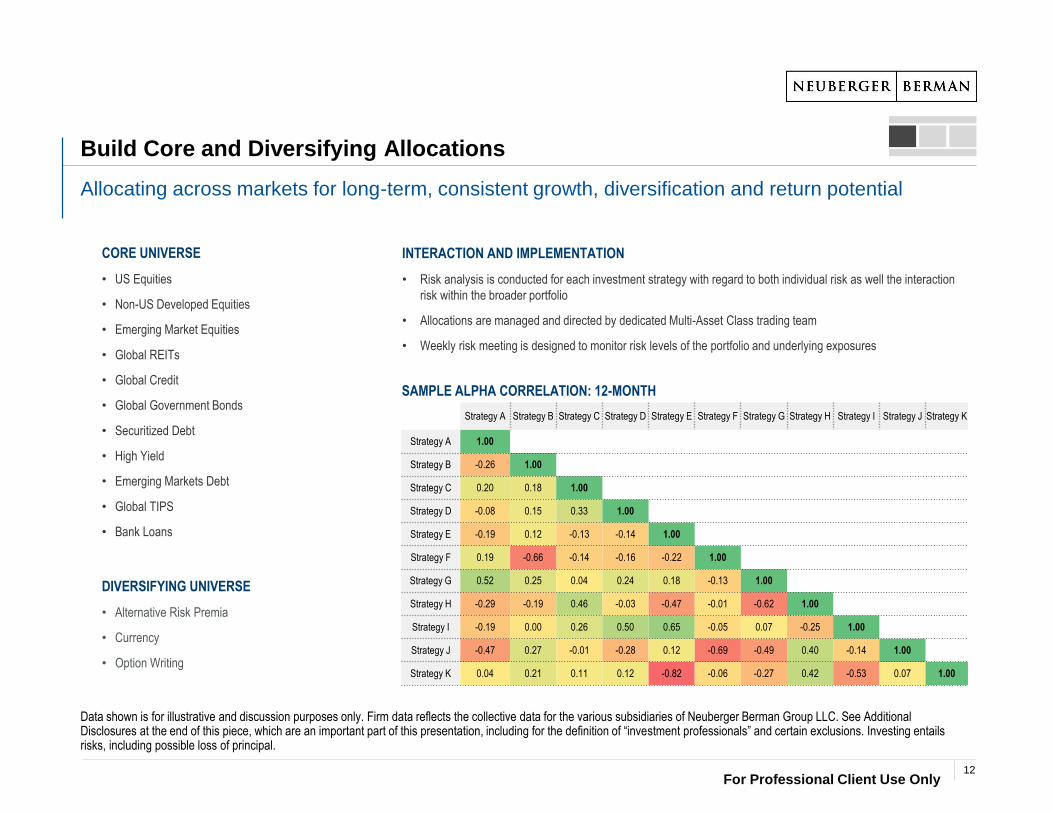
Build Core and Diversifying Allocations
Allocating across markets for long-term, consistent growth, diversification and return potential
Data shown is for illustrative and discussion purposes only. Firm data reflects the collective data for the various subsidiaries of Neuberger Berman Group LLC. See Additional Disclosures at the end of this piece, which are an important part of this presentation, including for the definition of “investment professionals” and certain exclusions. Investing entails risks, including possible loss of principal.
CORE UNIVERSE
• US Equities
• Non-US Developed Equities
• Emerging Market Equities
• Global REITs
• Global Credit
• Global Government Bonds
• Securitized Debt
• High Yield
• Emerging Markets Debt
• Global TIPS
• Bank Loans
DIVERSIFYING UNIVERSE
• Alternative Risk Premia
• Currency
• Option Writing
SAMPLE ALPHA CORRELATION: 12-MONTH
INTERACTION AND IMPLEMENTATION
• Risk analysis is conducted for each investment strategy with regard to both individual risk as well the interaction
risk within the broader portfolio
• Allocations are managed and directed by dedicated Multi-Asset Class trading team
• Weekly risk meeting is designed to monitor risk levels of the portfolio and underlying exposures
Strategy A Strategy B Strategy C Strategy D Strategy E Strategy F Strategy G Strategy H Strategy I Strategy J Strategy K
Strategy A 1.00
Strategy B -0.26 1.00
Strategy C 0.20 0.18 1.00
Strategy D -0.08 0.15 0.33 1.00
Strategy E -0.19 0.12 -0.13 -0.14 1.00
Strategy F 0.19 -0.66 -0.14 -0.16 -0.22 1.00
Strategy G 0.52 0.25 0.04 0.24 0.18 -0.13 1.00
Strategy H -0.29 -0.19 0.46 -0.03 -0.47 -0.01 -0.62 1.00
Strategy I -0.19 0.00 0.26 0.50 0.65 -0.05 0.07 -0.25 1.00
Strategy J -0.47 0.27 -0.01 -0.28 0.12 -0.69 -0.49 0.40 -0.14 1.00
Strategy K 0.04 0.21 0.11 0.12 -0.82 -0.06 -0.27 0.42 -0.53 0.07 1.00
12
For Professional Client Use Only
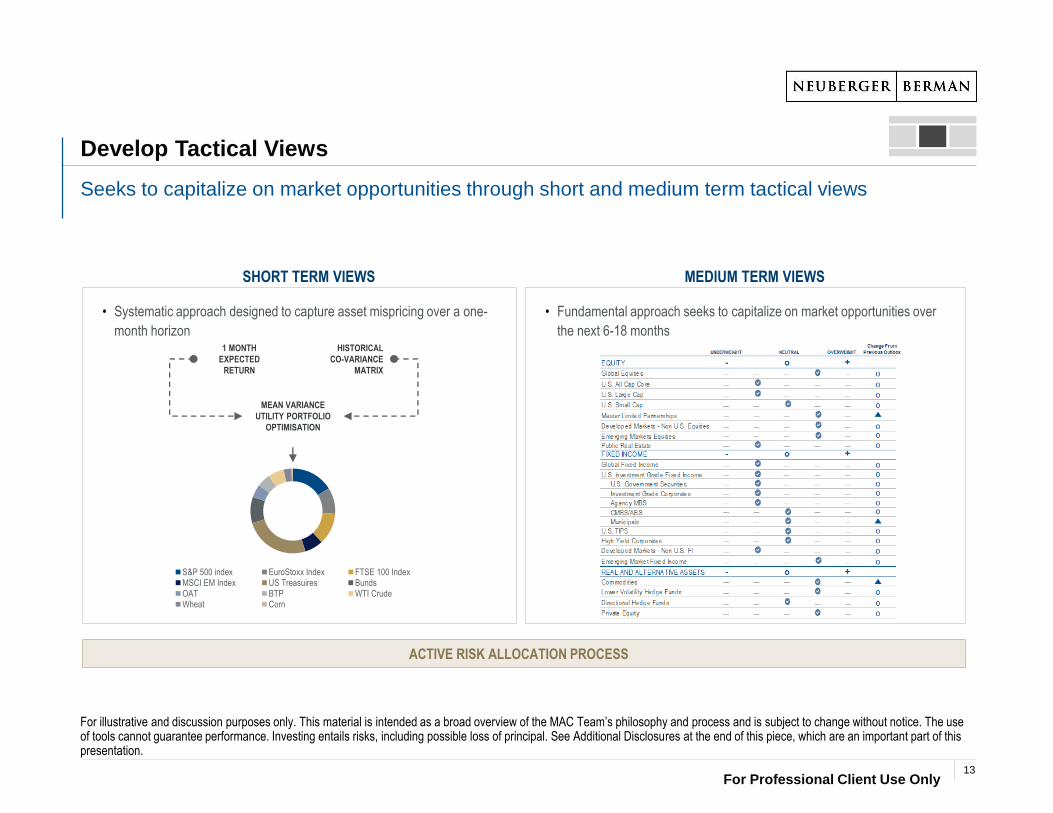
Develop Tactical Views
Seeks to capitalize on market opportunities through short and medium term tactical views
• Fundamental approach seeks to capitalize on market opportunities over
the next 6-18 months
SHORT TERM VIEWS MEDIUM TERM VIEWS
• Systematic approach designed to capture asset mispricing over a one-
month horizon
MEAN VARIANCE
UTILITY PORTFOLIO
OPTIMISATION
1 MONTH
EXPECTED
RETURN
HISTORICAL
CO-VARIANCE
MATRIX
S&P 500 index EuroStoxx Index FTSE 100 IndexMSCI EM Index US Treasuires BundsOAT BTP WTI CrudeWheat Corn
For illustrative and discussion purposes only. This material is intended as a broad overview of the MAC Team’s philosophy and process and is subject to change without notice. The use of tools cannot guarantee performance. Investing entails risks, including possible loss of principal. See Additional Disclosures at the end of this piece, which are an important part of this presentation.
ACTIVE RISK ALLOCATION PROCESS
13
For Professional Client Use Only
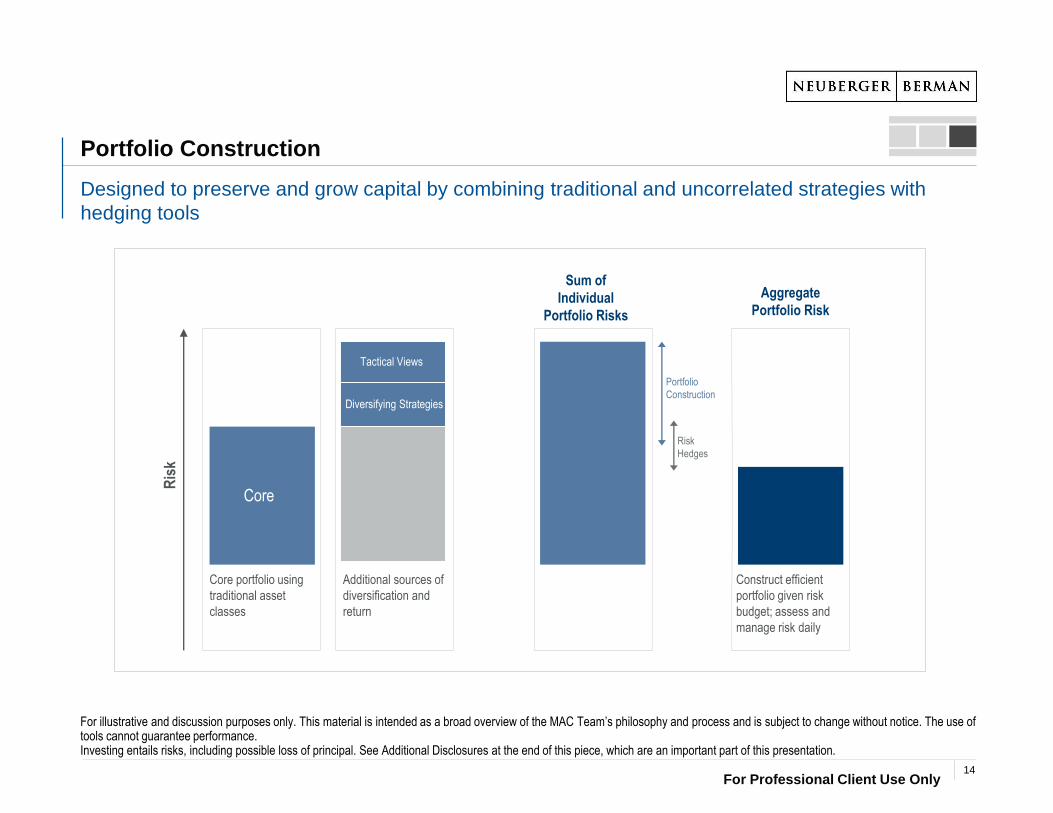
Portfolio Construction
Designed to preserve and grow capital by combining traditional and uncorrelated strategies with
hedging tools
For illustrative and discussion purposes only. This material is intended as a broad overview of the MAC Team’s philosophy and process and is subject to change without notice. The use of tools cannot guarantee performance. Investing entails risks, including possible loss of principal. See Additional Disclosures at the end of this piece, which are an important part of this presentation.
Core portfolio using
traditional asset
classes
Sum of
Individual
Portfolio Risks
Ris
k
Core
Additional sources of
diversification and
return
Construct efficient
portfolio given risk
budget; assess and
manage risk daily
Aggregate
Portfolio Risk
Tactical Views
Diversifying Strategies
Portfolio
Construction
Risk
Hedges
14
For Professional Client Use Only
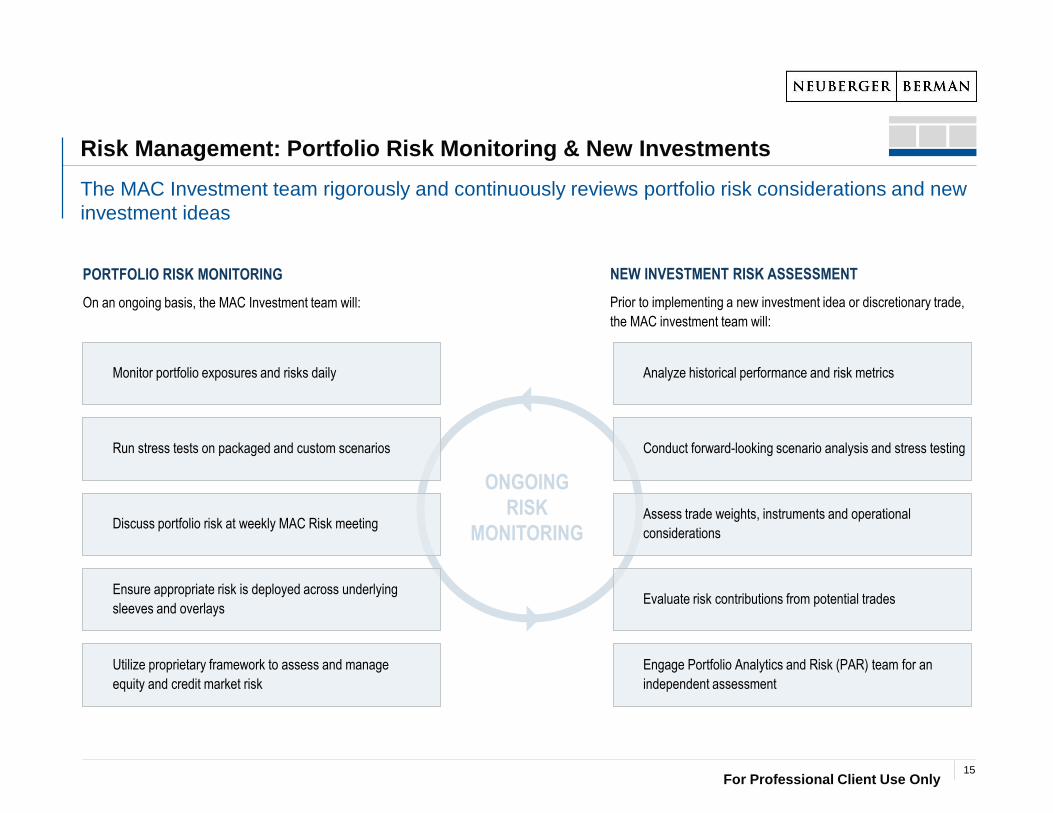
Risk Management: Portfolio Risk Monitoring & New Investments
PORTFOLIO RISK MONITORING
On an ongoing basis, the MAC Investment team will:
The MAC Investment team rigorously and continuously reviews portfolio risk considerations and new
investment ideas
NEW INVESTMENT RISK ASSESSMENT
Prior to implementing a new investment idea or discretionary trade,
the MAC investment team will:
Monitor portfolio exposures and risks daily
Run stress tests on packaged and custom scenarios
Discuss portfolio risk at weekly MAC Risk meeting
Ensure appropriate risk is deployed across underlying
sleeves and overlays
Utilize proprietary framework to assess and manage
equity and credit market risk
Analyze historical performance and risk metrics
Conduct forward-looking scenario analysis and stress testing
Assess trade weights, instruments and operational
considerations
Evaluate risk contributions from potential trades
Engage Portfolio Analytics and Risk (PAR) team for an
independent assessment
ONGOING
RISK
MONITORING
15
For Professional Client Use Only
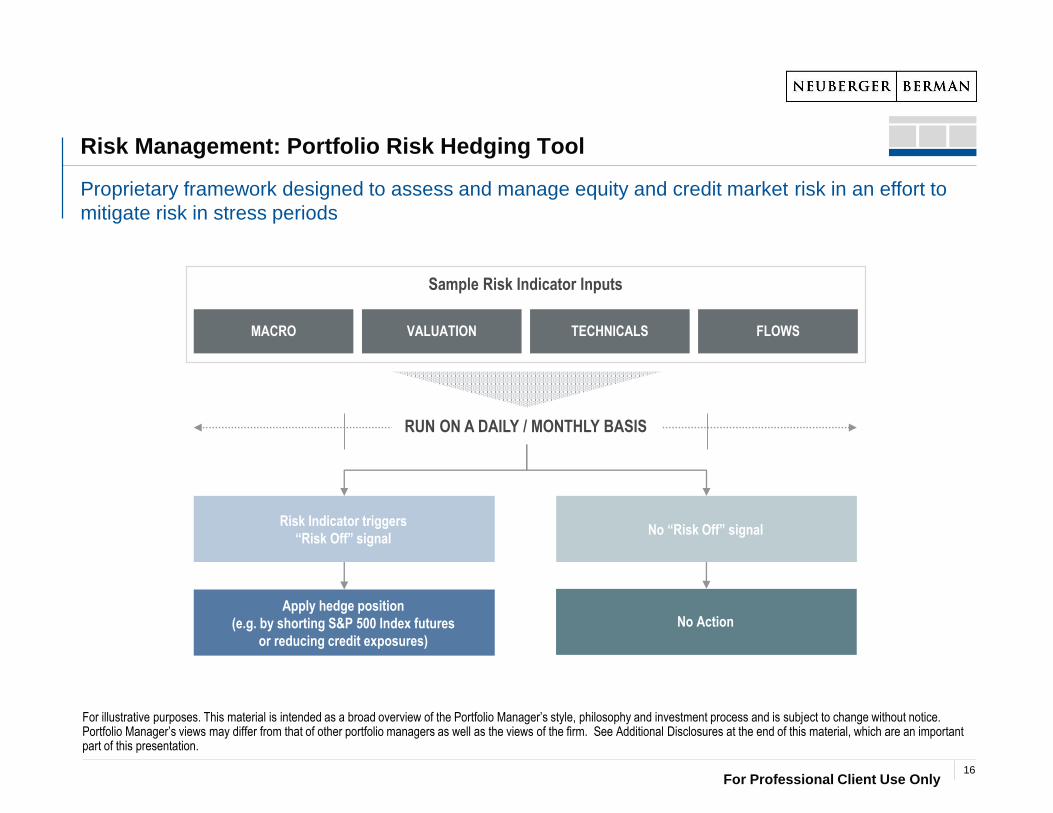
Risk Management: Portfolio Risk Hedging Tool
For illustrative purposes. This material is intended as a broad overview of the Portfolio Manager’s style, philosophy and investment process and is subject to change without notice. Portfolio Manager’s views may differ from that of other portfolio managers as well as the views of the firm. See Additional Disclosures at the end of this material, which are an important part of this presentation.
Proprietary framework designed to assess and manage equity and credit market risk in an effort to
mitigate risk in stress periods
Sample Risk Indicator Inputs
MACRO VALUATION TECHNICALS FLOWS
RUN ON A DAILY / MONTHLY BASIS
Apply hedge position
(e.g. by shorting S&P 500 Index futures
or reducing credit exposures)
Risk Indicator triggers
“Risk Off” signalNo “Risk Off” signal
No Action
16
For Professional Client Use Only
For illustrative and discussion purposes only. This material is intended as a broad overview of the MAC Team’s philosophy and process and is subject to change without notice. The use of tools cannot guarantee performance. Investing entails risks, including possible loss of principal. See Additional Disclosures at the end of this piece, which are an important part of this presentation.
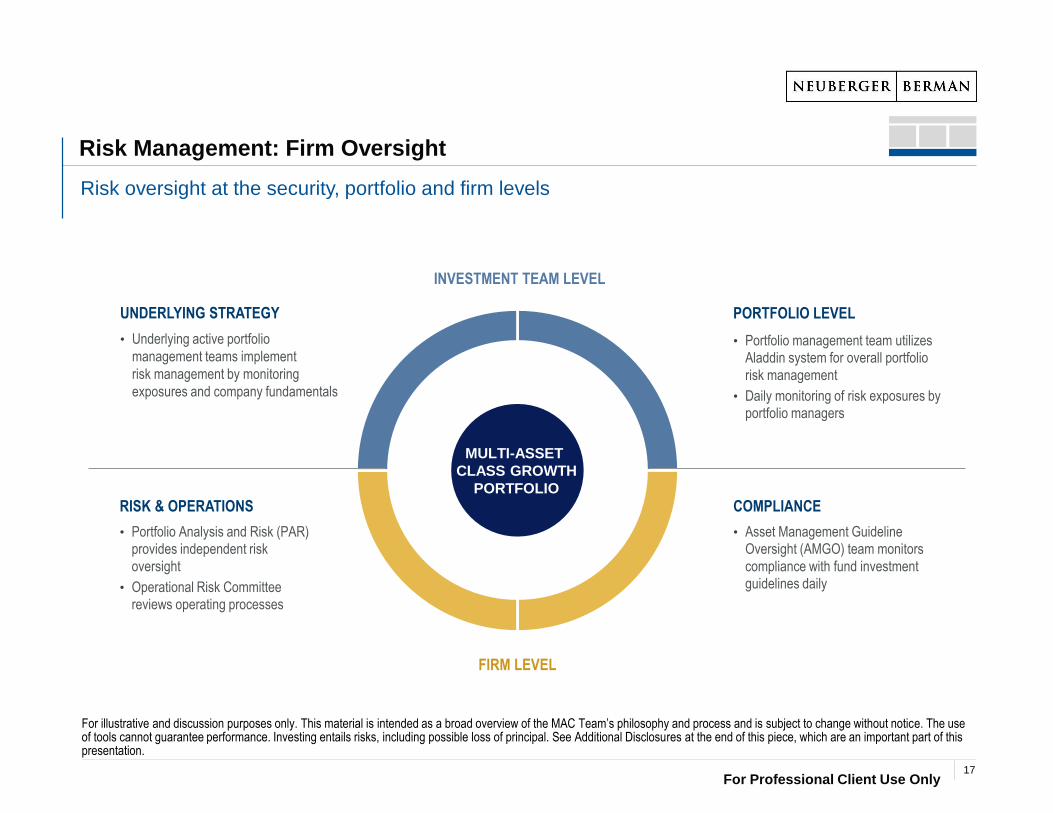
Risk oversight at the security, portfolio and firm levels
Risk Management: Firm Oversight
PORTFOLIO LEVEL
• Portfolio management team utilizes
Aladdin system for overall portfolio
risk management
• Daily monitoring of risk exposures by
portfolio managers
UNDERLYING STRATEGY
• Underlying active portfolio
management teams implement
risk management by monitoring
exposures and company fundamentals
RISK & OPERATIONS
• Portfolio Analysis and Risk (PAR)
provides independent risk
oversight
• Operational Risk Committee
reviews operating processes
COMPLIANCE
• Asset Management Guideline
Oversight (AMGO) team monitors
compliance with fund investment
guidelines daily
MULTI-ASSET
CLASS GROWTH
PORTFOLIO
INVESTMENT TEAM LEVEL
FIRM LEVEL
17

PORTFOLIO CHARACTERISTICS AND PERFORMANCE
For Professional Client Use Only
-30% -20% -10% 0% 10% 20% 30%
Low Vol Global Equity
Global Equity
Investment Grade Corporate
Securitized Credit
Inflation Linked
High Yield
Emerging Markets Debt
Global Sovereign Bonds
Tactical Asset Allocation
Absolute Return Options
Alternative Risk Premia
Currency
Cash & Equivalents
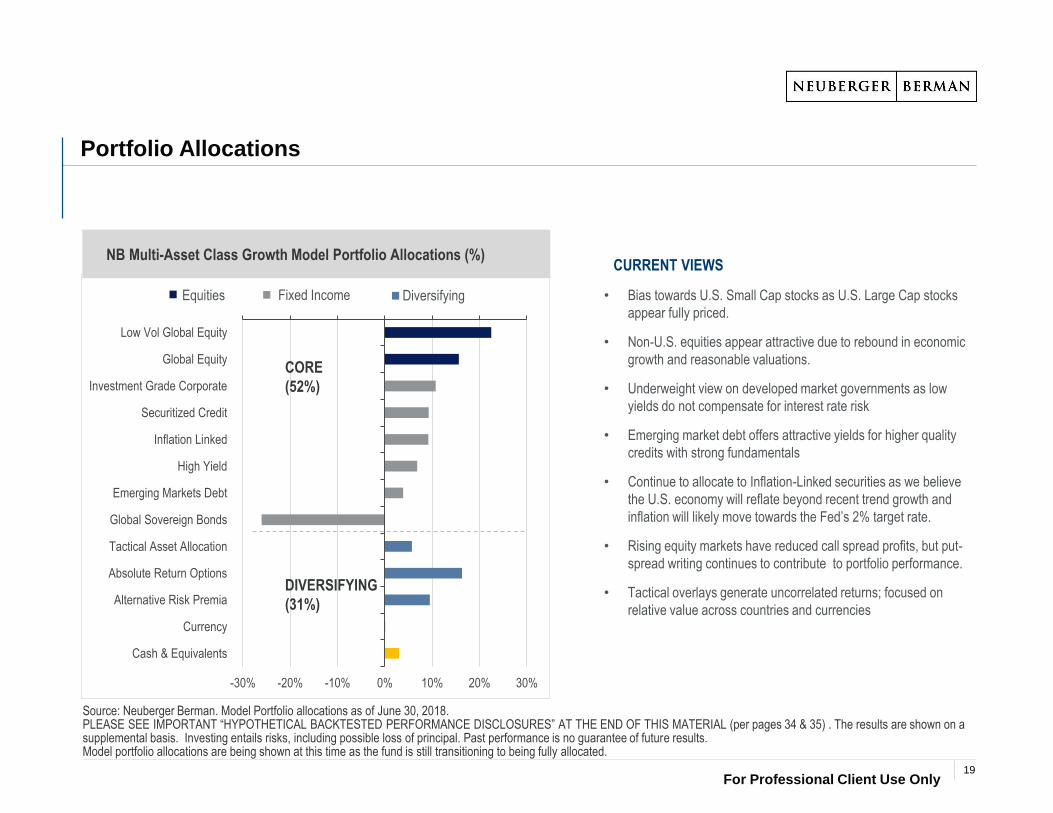
Portfolio Allocations
Source: Neuberger Berman. Model Portfolio allocations as of June 30, 2018. PLEASE SEE IMPORTANT “HYPOTHETICAL BACKTESTED PERFORMANCE DISCLOSURES” AT THE END OF THIS MATERIAL (per pages 34 & 35) . The results are shown on a supplemental basis. Investing entails risks, including possible loss of principal. Past performance is no guarantee of future results.Model portfolio allocations are being shown at this time as the fund is still transitioning to being fully allocated.
NB Multi-Asset Class Growth Model Portfolio Allocations (%)
Equities DiversifyingFixed Income
CURRENT VIEWS
CORE
(52%)
DIVERSIFYING
(31%)
• Bias towards U.S. Small Cap stocks as U.S. Large Cap stocks
appear fully priced.
• Non-U.S. equities appear attractive due to rebound in economic
growth and reasonable valuations.
• Underweight view on developed market governments as low
yields do not compensate for interest rate risk
• Emerging market debt offers attractive yields for higher quality
credits with strong fundamentals
• Continue to allocate to Inflation-Linked securities as we believe
the U.S. economy will reflate beyond recent trend growth and
inflation will likely move towards the Fed’s 2% target rate.
• Rising equity markets have reduced call spread profits, but put-
spread writing continues to contribute to portfolio performance.
• Tactical overlays generate uncorrelated returns; focused on
relative value across countries and currencies
19
For Professional Client Use Only
0.0%
1.0%
2.0%
3.0%
4.0%
5.0%
6.0%
7.0%
8.0%
9.0%
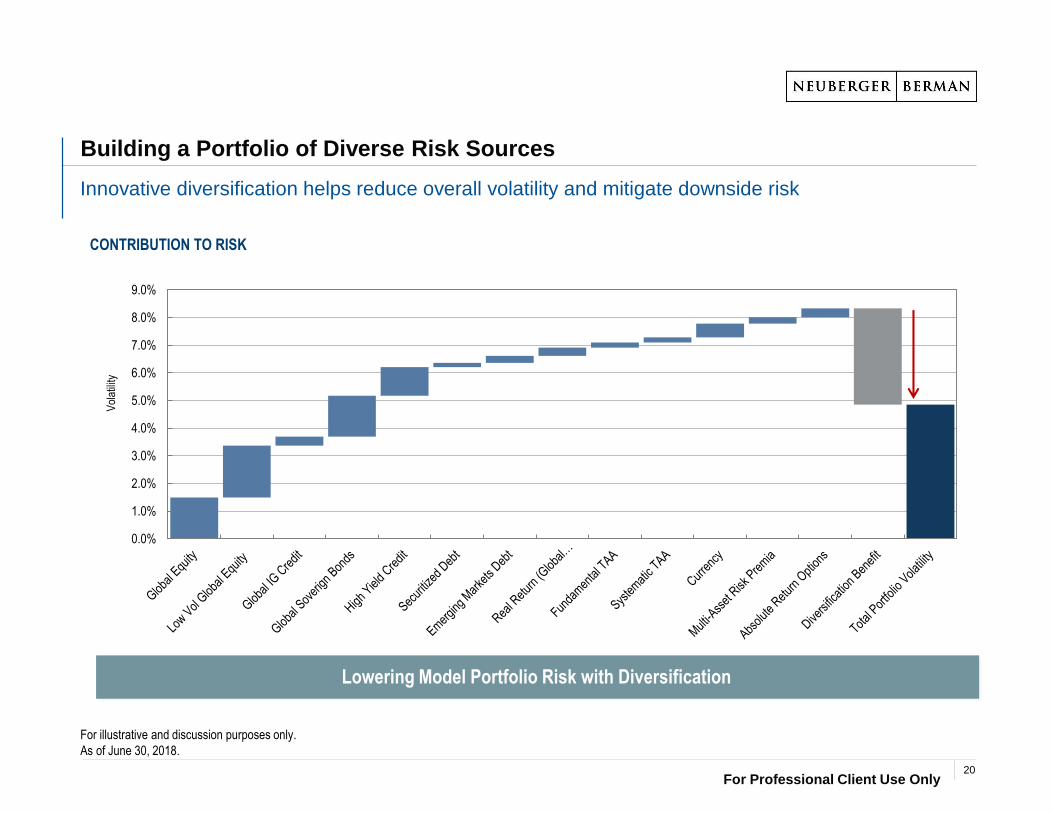
Building a Portfolio of Diverse Risk Sources
For illustrative and discussion purposes only.
As of June 30, 2018.
Lowering Model Portfolio Risk with Diversification
Innovative diversification helps reduce overall volatility and mitigate downside risk
CONTRIBUTION TO RISK
Vol
atili
ty
20
For Professional Client Use Only
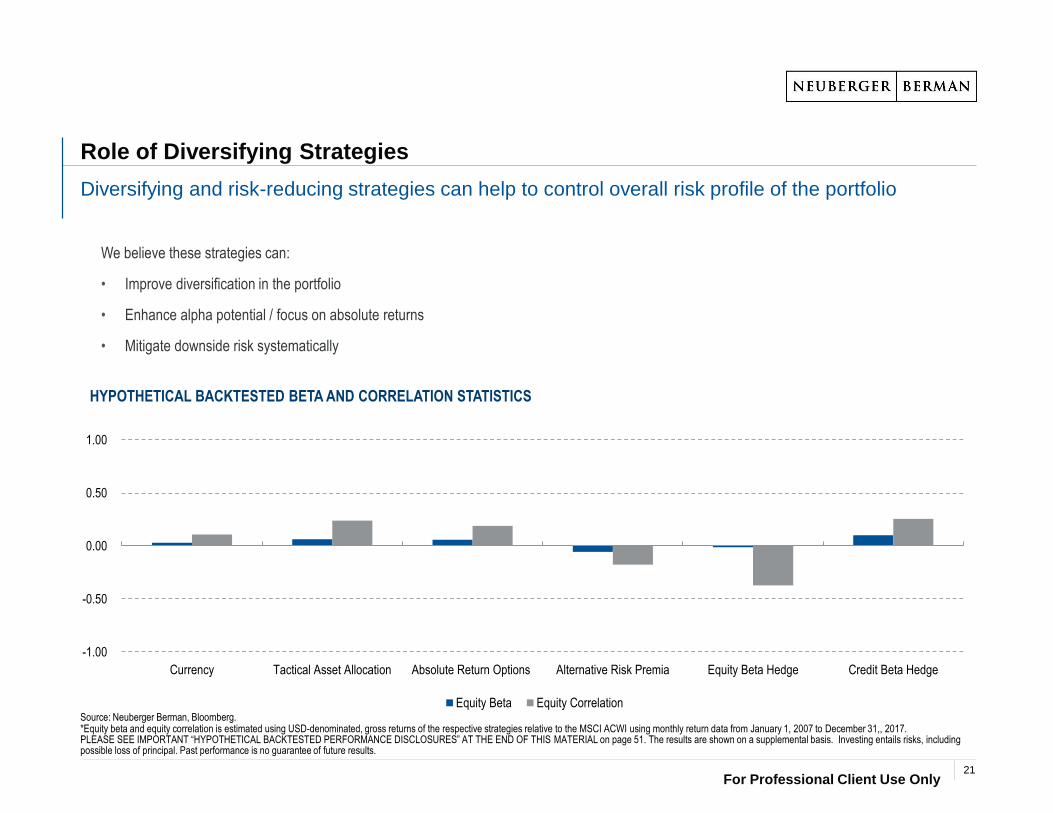
Role of Diversifying Strategies
Diversifying and risk-reducing strategies can help to control overall risk profile of the portfolio
We believe these strategies can:
• Improve diversification in the portfolio
• Enhance alpha potential / focus on absolute returns
• Mitigate downside risk systematically
HYPOTHETICAL BACKTESTED BETA AND CORRELATION STATISTICS
Source: Neuberger Berman, Bloomberg.*Equity beta and equity correlation is estimated using USD-denominated, gross returns of the respective strategies relative to the MSCI ACWI using monthly return data from January 1, 2007 to December 31,, 2017.PLEASE SEE IMPORTANT “HYPOTHETICAL BACKTESTED PERFORMANCE DISCLOSURES” AT THE END OF THIS MATERIAL on page 51. The results are shown on a supplemental basis. Investing entails risks, including possible loss of principal. Past performance is no guarantee of future results.
-1.00
-0.50
0.00
0.50
1.00
Currency Tactical Asset Allocation Absolute Return Options Alternative Risk Premia Equity Beta Hedge Credit Beta Hedge
Equity Beta Equity Correlation
21
For Professional Client Use Only
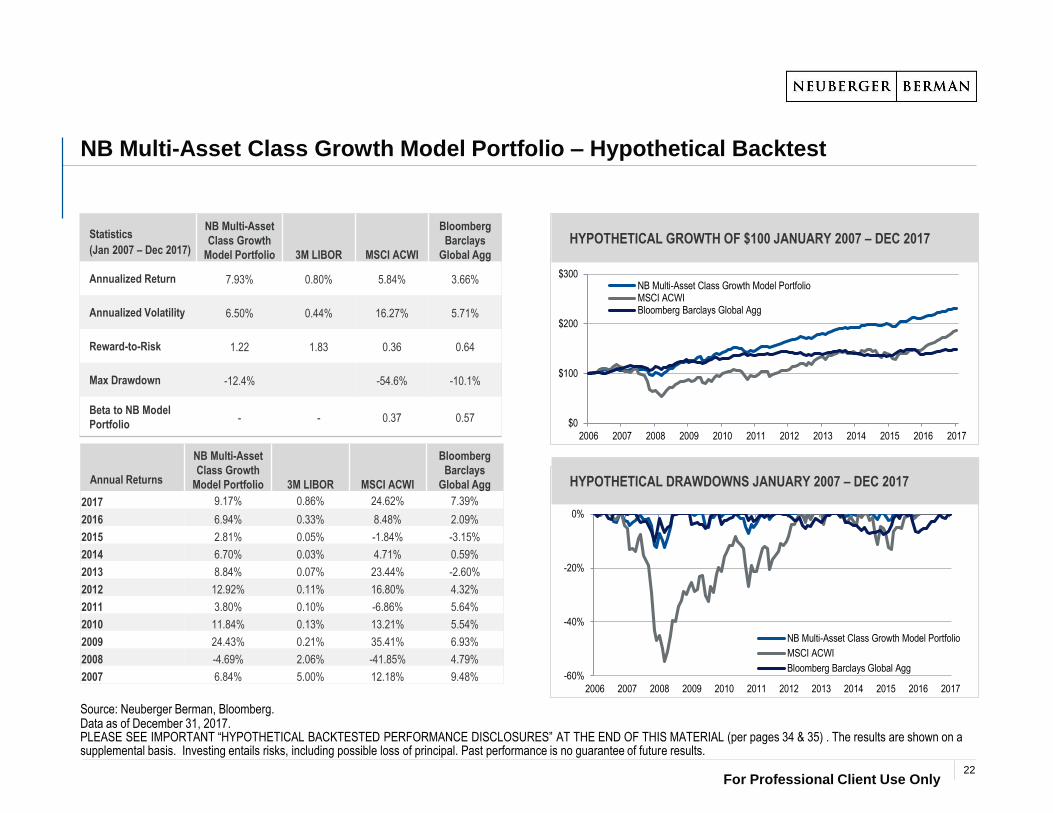
NB Multi-Asset Class Growth Model Portfolio – Hypothetical Backtest
HYPOTHETICAL DRAWDOWNS JANUARY 2007 – DEC 2017
Source: Neuberger Berman, Bloomberg.Data as of December 31, 2017.PLEASE SEE IMPORTANT “HYPOTHETICAL BACKTESTED PERFORMANCE DISCLOSURES” AT THE END OF THIS MATERIAL (per pages 34 & 35) . The results are shown on a supplemental basis. Investing entails risks, including possible loss of principal. Past performance is no guarantee of future results.
HYPOTHETICAL GROWTH OF $100 JANUARY 2007 – DEC 2017Statistics
(Jan 2007 – Dec 2017)
NB Multi-Asset
Class Growth
Model Portfolio 3M LIBOR MSCI ACWI
Bloomberg
Barclays
Global Agg
Annualized Return 7.93% 0.80% 5.84% 3.66%
Annualized Volatility 6.50% 0.44% 16.27% 5.71%
Reward-to-Risk 1.22 1.83 0.36 0.64
Max Drawdown -12.4% -54.6% -10.1%
Beta to NB Model
Portfolio- - 0.37 0.57 $0
$100
$200
$300
2006 2007 2008 2009 2010 2011 2012 2013 2014 2015 2016 2017
NB Multi-Asset Class Growth Model PortfolioMSCI ACWIBloomberg Barclays Global Agg
Annual Returns
NB Multi-Asset
Class Growth
Model Portfolio 3M LIBOR MSCI ACWI
Bloomberg
Barclays
Global Agg
2017 9.17% 0.86% 24.62% 7.39%
2016 6.94% 0.33% 8.48% 2.09%
2015 2.81% 0.05% -1.84% -3.15%
2014 6.70% 0.03% 4.71% 0.59%
2013 8.84% 0.07% 23.44% -2.60%
2012 12.92% 0.11% 16.80% 4.32%
2011 3.80% 0.10% -6.86% 5.64%
2010 11.84% 0.13% 13.21% 5.54%
2009 24.43% 0.21% 35.41% 6.93%
2008 -4.69% 2.06% -41.85% 4.79%
2007 6.84% 5.00% 12.18% 9.48% -60%
-40%
-20%
0%
2006 2007 2008 2009 2010 2011 2012 2013 2014 2015 2016 2017
NB Multi-Asset Class Growth Model Portfolio
MSCI ACWI
Bloomberg Barclays Global Agg
22
For Professional Client Use Only
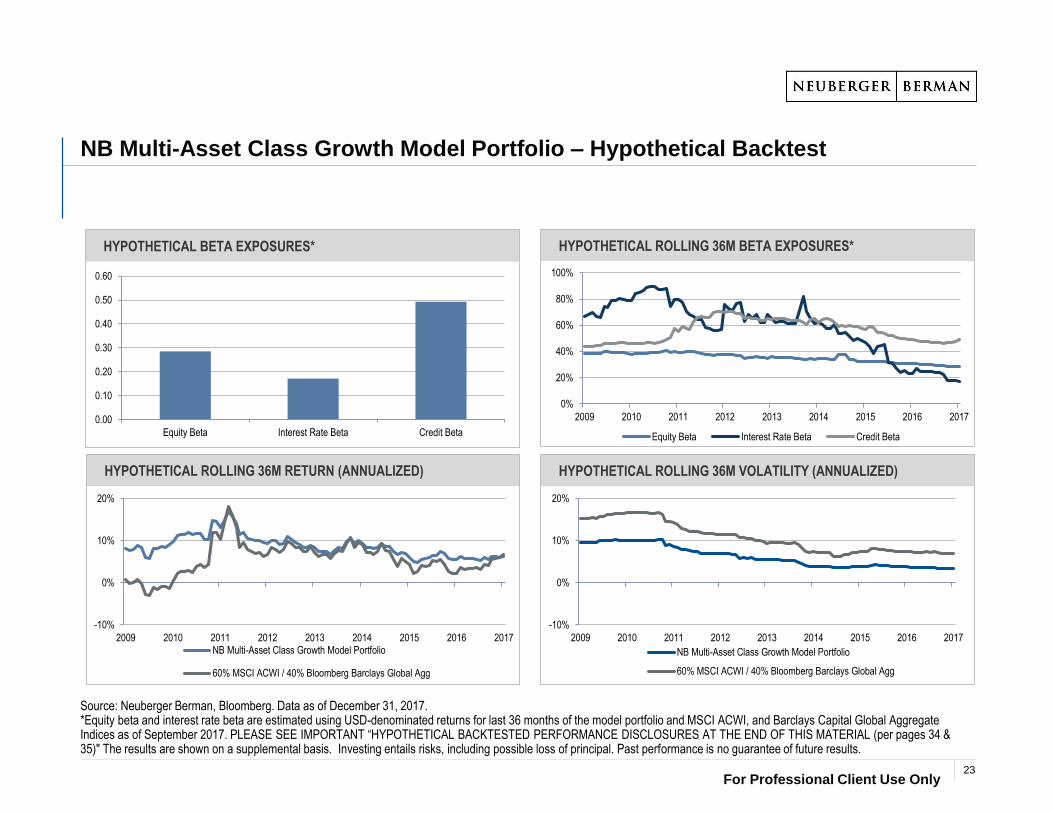
NB Multi-Asset Class Growth Model Portfolio – Hypothetical Backtest
HYPOTHETICAL BETA EXPOSURES* HYPOTHETICAL ROLLING 36M BETA EXPOSURES*
HYPOTHETICAL ROLLING 36M RETURN (ANNUALIZED) HYPOTHETICAL ROLLING 36M VOLATILITY (ANNUALIZED)
Source: Neuberger Berman, Bloomberg. Data as of December 31, 2017.*Equity beta and interest rate beta are estimated using USD-denominated returns for last 36 months of the model portfolio and MSCI ACWI, and Barclays Capital Global Aggregate Indices as of September 2017. PLEASE SEE IMPORTANT “HYPOTHETICAL BACKTESTED PERFORMANCE DISCLOSURES AT THE END OF THIS MATERIAL (per pages 34 & 35)" The results are shown on a supplemental basis. Investing entails risks, including possible loss of principal. Past performance is no guarantee of future results.
0.00
0.10
0.20
0.30
0.40
0.50
0.60
Equity Beta Interest Rate Beta Credit Beta
0%
20%
40%
60%
80%
100%
2009 2010 2011 2012 2013 2014 2015 2016 2017
Equity Beta Interest Rate Beta Credit Beta
-10%
0%
10%
20%
2009 2010 2011 2012 2013 2014 2015 2016 2017NB Multi-Asset Class Growth Model Portfolio
60% MSCI ACWI / 40% Bloomberg Barclays Global Agg
-10%
0%
10%
20%
2009 2010 2011 2012 2013 2014 2015 2016 2017
NB Multi-Asset Class Growth Model Portfolio
60% MSCI ACWI / 40% Bloomberg Barclays Global Agg
23

SOURCES OF RETURN & DIVERSIFICATION
For Professional Client Use Only
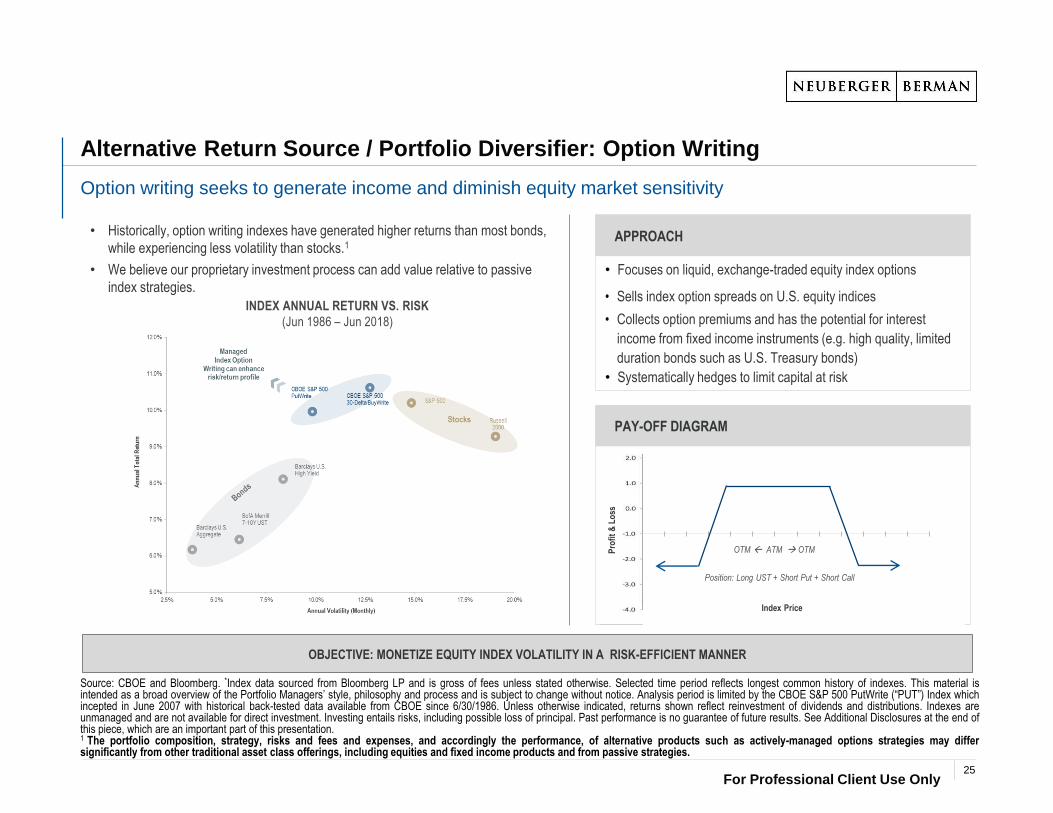
• Historically, option writing indexes have generated higher returns than most bonds,
while experiencing less volatility than stocks.1
• We believe our proprietary investment process can add value relative to passive
index strategies.
Alternative Return Source / Portfolio Diversifier: Option Writing
Option writing seeks to generate income and diminish equity market sensitivity
Source: CBOE and Bloomberg. *Index data sourced from Bloomberg LP and is gross of fees unless stated otherwise. Selected time period reflects longest common history of indexes. This material isintended as a broad overview of the Portfolio Managers’ style, philosophy and process and is subject to change without notice. Analysis period is limited by the CBOE S&P 500 PutWrite (“PUT”) Index whichincepted in June 2007 with historical back-tested data available from CBOE since 6/30/1986. Unless otherwise indicated, returns shown reflect reinvestment of dividends and distributions. Indexes areunmanaged and are not available for direct investment. Investing entails risks, including possible loss of principal. Past performance is no guarantee of future results. See Additional Disclosures at the end ofthis piece, which are an important part of this presentation.1 The portfolio composition, strategy, risks and fees and expenses, and accordingly the performance, of alternative products such as actively-managed options strategies may differsignificantly from other traditional asset class offerings, including equities and fixed income products and from passive strategies.
APPROACH
• Focuses on liquid, exchange-traded equity index options
• Sells index option spreads on U.S. equity indices
• Collects option premiums and has the potential for interest
income from fixed income instruments (e.g. high quality, limited
duration bonds such as U.S. Treasury bonds)
• Systematically hedges to limit capital at risk
PAY-OFF DIAGRAM
OTM ATM OTM
Position: Long UST + Short Put + Short Call
Index PriceP
rofi
t &
Lo
ss
INDEX ANNUAL RETURN VS. RISK
(Jun 1986 – Jun 2018)
OBJECTIVE: MONETIZE EQUITY INDEX VOLATILITY IN A RISK-EFFICIENT MANNER
25
For Professional Client Use Only
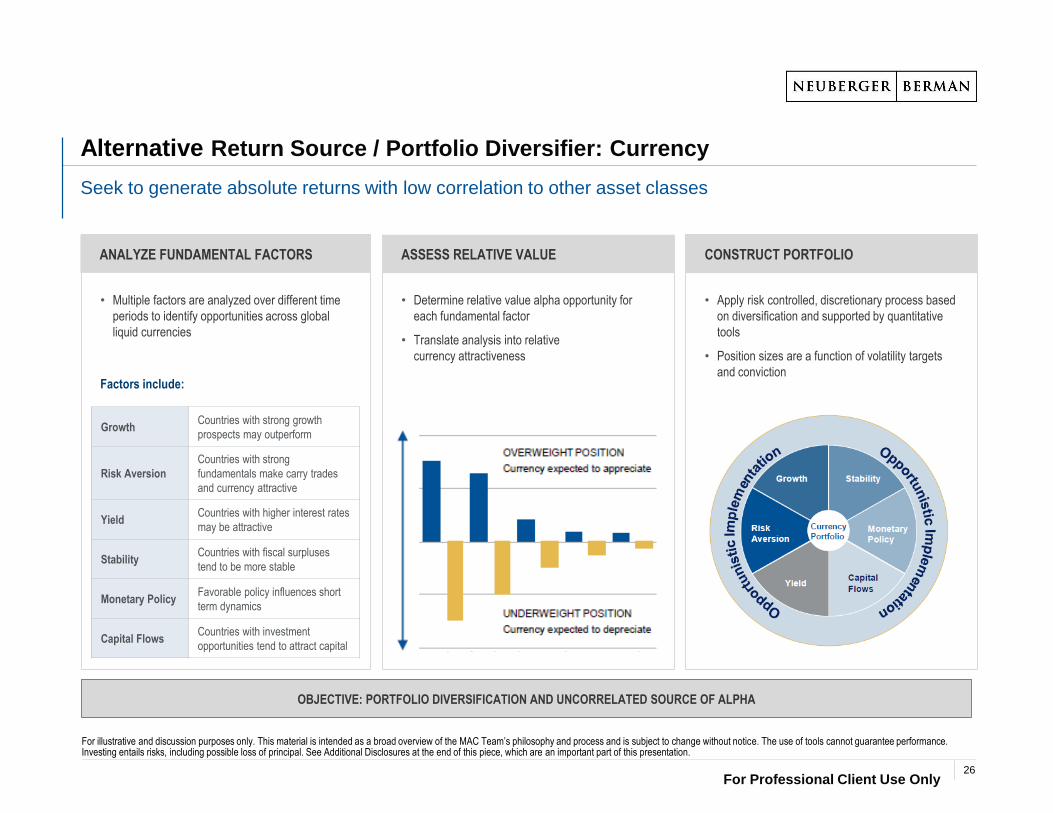
Alternative Return Source / Portfolio Diversifier: Currency
Seek to generate absolute returns with low correlation to other asset classes
For illustrative and discussion purposes only. This material is intended as a broad overview of the MAC Team’s philosophy and process and is subject to change without notice. The use of tools cannot guarantee performance. Investing entails risks, including possible loss of principal. See Additional Disclosures at the end of this piece, which are an important part of this presentation.
• Determine relative value alpha opportunity for
each fundamental factor
• Translate analysis into relative
currency attractiveness
• Multiple factors are analyzed over different time
periods to identify opportunities across global
liquid currencies
• Apply risk controlled, discretionary process based
on diversification and supported by quantitative
tools
• Position sizes are a function of volatility targets
and conviction
GrowthCountries with strong growth
prospects may outperform
Risk Aversion
Countries with strong
fundamentals make carry trades
and currency attractive
YieldCountries with higher interest rates
may be attractive
StabilityCountries with fiscal surpluses
tend to be more stable
Monetary PolicyFavorable policy influences short
term dynamics
Capital FlowsCountries with investment
opportunities tend to attract capital
CONSTRUCT PORTFOLIO ANALYZE FUNDAMENTAL FACTORS ASSESS RELATIVE VALUE
Factors include:
OBJECTIVE: PORTFOLIO DIVERSIFICATION AND UNCORRELATED SOURCE OF ALPHA
26
For Professional Client Use Only
0%
5%
10%
15%
20%E
q-V
al
FI-
Val
FX
-Val
Eq-
…
FI-
Mom FX
-…
Com
-…
Eq-
Car
FI-
Car
FX
-Car
Com
-…
Eq-
Liq
Com
-…
Value
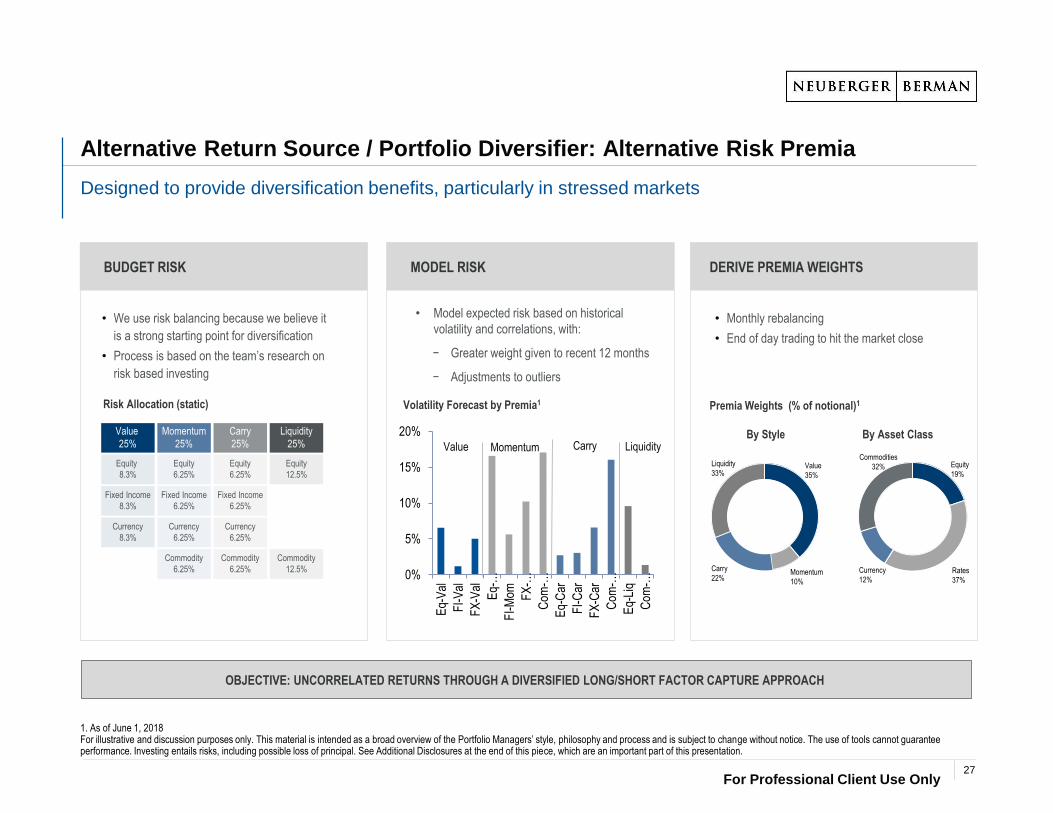
Alternative Return Source / Portfolio Diversifier: Alternative Risk Premia
Designed to provide diversification benefits, particularly in stressed markets
1. As of June 1, 2018For illustrative and discussion purposes only. This material is intended as a broad overview of the Portfolio Managers’ style, philosophy and process and is subject to change without notice. The use of tools cannot guarantee performance. Investing entails risks, including possible loss of principal. See Additional Disclosures at the end of this piece, which are an important part of this presentation.
BUDGET RISK MODEL RISK DERIVE PREMIA WEIGHTS
• Monthly rebalancing
• End of day trading to hit the market close
• We use risk balancing because we believe it
is a strong starting point for diversification
• Process is based on the team’s research on
risk based investing
Value
25%
Momentum
25%
Carry
25%
Liquidity
25%
Equity
8.3%
Equity
6.25%
Equity
6.25%
Equity
12.5%
Fixed Income
8.3%
Fixed Income
6.25%
Fixed Income
6.25%
Currency
8.3%
Currency
6.25%
Currency
6.25%
Commodity
6.25%
Commodity
6.25%
Commodity
12.5%
• Model expected risk based on historical
volatility and correlations, with:
− Greater weight given to recent 12 months
− Adjustments to outliers
LiquidityMomentum Carry
Volatility Forecast by Premia1Risk Allocation (static) Premia Weights (% of notional)1
By Style By Asset Class
Liquidity
33%Value
35%
Carry
22%Momentum
10%
Equity
19%
Currency
12%Rates
37%
Commodities
32%
OBJECTIVE: UNCORRELATED RETURNS THROUGH A DIVERSIFIED LONG/SHORT FACTOR CAPTURE APPROACH
27

SUMMARY AND TERMS
For Professional Client Use Only
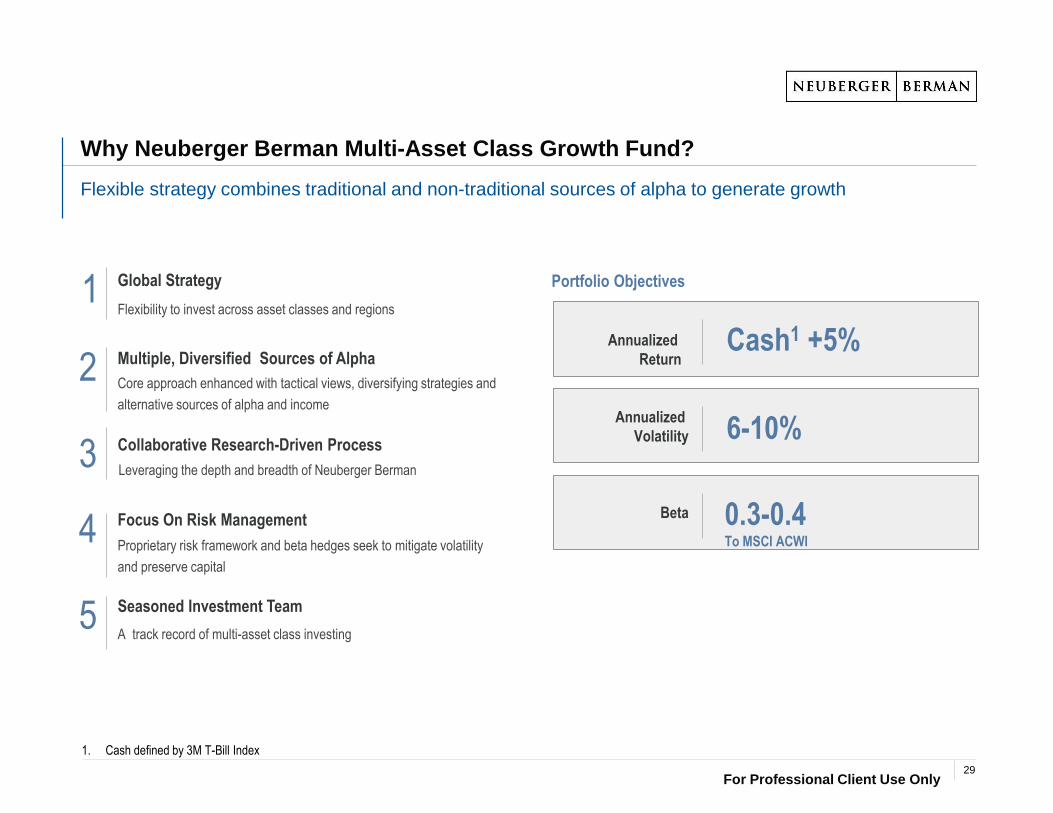
Why Neuberger Berman Multi-Asset Class Growth Fund?
Flexible strategy combines traditional and non-traditional sources of alpha to generate growth
Portfolio Objectives
Cash1 +5%
Annualized
Volatility
Leveraging the depth and breadth of Neuberger Berman
Flexibility to invest across asset classes and regions
Core approach enhanced with tactical views, diversifying strategies and
alternative sources of alpha and income
Proprietary risk framework and beta hedges seek to mitigate volatility
and preserve capital
Global Strategy
Multiple, Diversified Sources of Alpha
Collaborative Research-Driven Process
Focus On Risk Management
A track record of multi-asset class investing
Seasoned Investment Team
1
2
3
4
5
Annualized
Return
6-10%
Beta 0.3-0.4To MSCI ACWI
1. Cash defined by 3M T-Bill Index
29
For Professional Client Use OnlyFor Professional Client Use Only
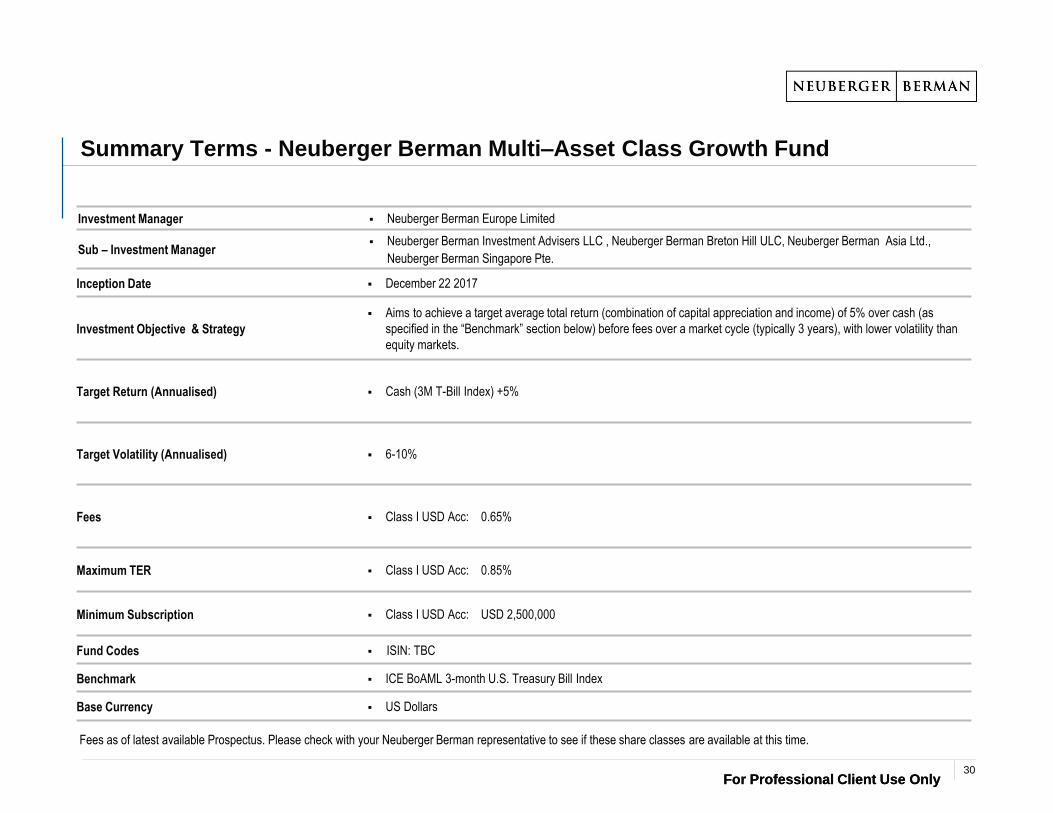
Summary Terms - Neuberger Berman Multi–Asset Class Growth Fund
Investment Manager Neuberger Berman Europe Limited
Sub – Investment Manager Neuberger Berman Investment Advisers LLC , Neuberger Berman Breton Hill ULC, Neuberger Berman Asia Ltd.,
Neuberger Berman Singapore Pte.
Inception Date December 22 2017
Investment Objective & Strategy
Aims to achieve a target average total return (combination of capital appreciation and income) of 5% over cash (as
specified in the “Benchmark” section below) before fees over a market cycle (typically 3 years), with lower volatility than
equity markets.
Target Return (Annualised) Cash (3M T-Bill Index) +5%
Target Volatility (Annualised) 6-10%
Fees Class I USD Acc: 0.65%
Maximum TER Class I USD Acc: 0.85%
Minimum Subscription Class I USD Acc: USD 2,500,000
Fund Codes ISIN: TBC
Benchmark ICE BoAML 3-month U.S. Treasury Bill Index
Base Currency US Dollars
Fees as of latest available Prospectus. Please check with your Neuberger Berman representative to see if these share classes are available at this time.
30

APPENDIX
CONFIDENTIAL
For Professional Client Use Only
Confidential Presentation
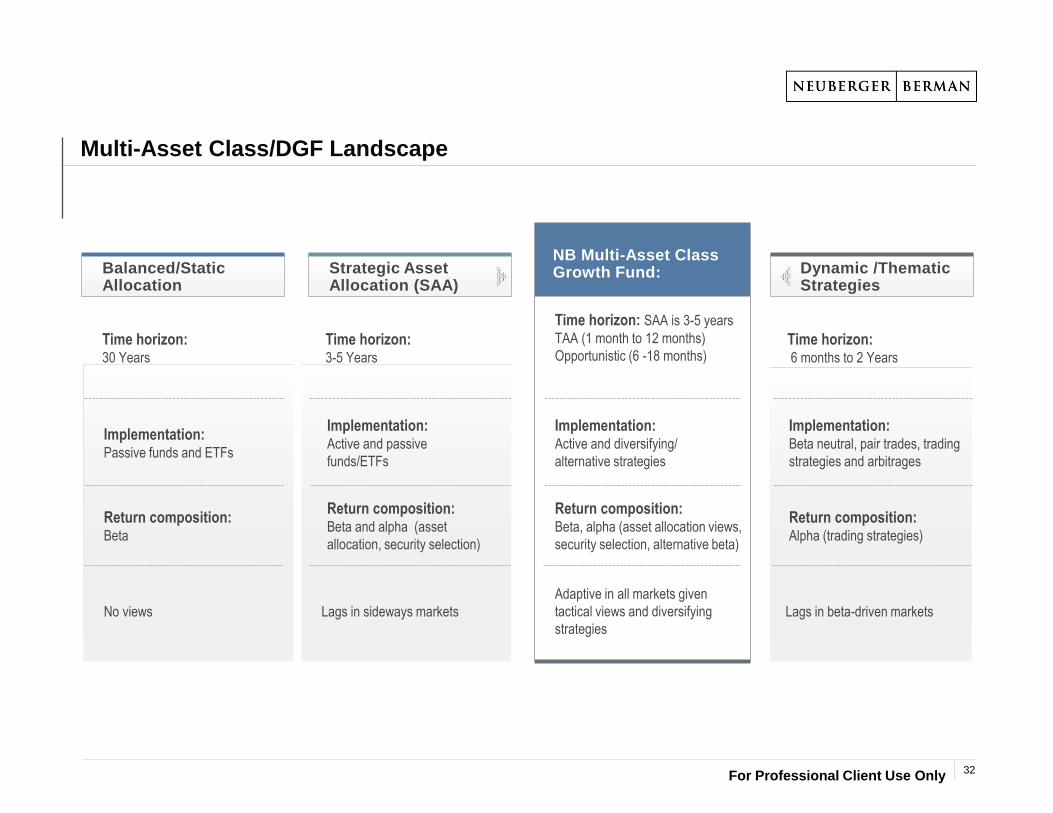
Multi-Asset Class/DGF Landscape
Balanced/Static Allocation
AssessmentStrategic Asset Allocation (SAA)
AssessmentDynamic /Thematic Strategies
Return composition: Beta, alpha (asset allocation views,
security selection, alternative beta)
Time horizon:30 Years
Implementation: Passive funds and ETFs
Implementation: Active and passive
funds/ETFs
Implementation: Active and diversifying/
alternative strategies
Implementation: Beta neutral, pair trades, trading
strategies and arbitrages
Return composition: Beta
Return composition: Beta and alpha (asset
allocation, security selection)
Return composition: Alpha (trading strategies)
Time horizon: SAA is 3-5 years
TAA (1 month to 12 months)
Opportunistic (6 -18 months)
Lags in beta-driven markets
Time horizon: 3-5 Years
Time horizon: 6 months to 2 Years
No views Lags in sideways markets
Adaptive in all markets given
tactical views and diversifying
strategies
NB Multi-Asset Class Growth Fund:
For Professional Client Use Only32

For Professional Client Use Only
Lead Portfolio Manager Biographies
Erik L. Knutzen, CFA, CAIA and Managing Director, joined the firm in May 2014 as Multi-Asset Class Chief Investment Officer. Erik will drive the asset allocation process on a
firm-wide level, as well as engage with clients on strategic partnerships and multi-asset class solutions. Previously, Erik was with NEPC, LLC where he served as chief
investment officer since 2008. As CIO, he oversaw a group of more than 45 investment professionals, including dedicated research teams focused on Alternative Investments,
Traditional Strategies and Asset Allocation. In this role, Erik led investment strategy development including market assessment and outlook, and communication of key themes
and best ideas for NEPC’s client base with, collectively, more than $800bn in assets under advisement. He has over 25 years of experience in the financial services industry,
including nine years at Putnam Investments. During his time there, he was a member of the global asset allocation group, led the institutional portfolio management team with 15
portfolio managers, and served as a senior leader of the firm’s international business. In 2013, he was recognized by aiCIO magazine, ranking atop their 25 most influential
investment consultants. Erik holds an MBA from Harvard Business School and a BA from Williams College. He has been awarded the Chartered Financial Analyst designation,
as well as the Chartered Alternative Investment Analyst designations. Erik sits on the Board of the Massachusetts Audubon Society and is a member of their Investment
Committee.
Ajay Jain, CFA, FCCA, Managing Director, joined the firm in 2014. Ajay is the Head of Multi-Asset Class Portfolio Management. His focus is on the day-to-day portfolio
management of our multi-asset class mandates and implementing views of our Asset Allocation Committee across these portfolios, as well as a focus on building and managing
global tactical asset allocation capabilities / products for clients. Ajay is also a member of Neuberger Berman’s Asset Allocation Committee. Ajay joins the firm from Barclays
Capital, where he served as the head of portfolio engineering for Funds and Advisory – a business that he helped co-found in 2005. Ajay and his team built the fundamental
asset allocation capabilities at Funds and Advisory, and managed a number of absolute return funds, portfolios and overlay strategies for institutional clients based on a
managed quantitative investment capability. Ajay has 15 years’ industry experience, which includes positions in banking and risk management at Deutsche Bank and Toronto
Dominion Securities. Ajay earned an MBA from INSEAD and is a graduate of Delhi University. He has also been awarded the Chartered Financial Analysts designation.
33
For Professional Client Use Only
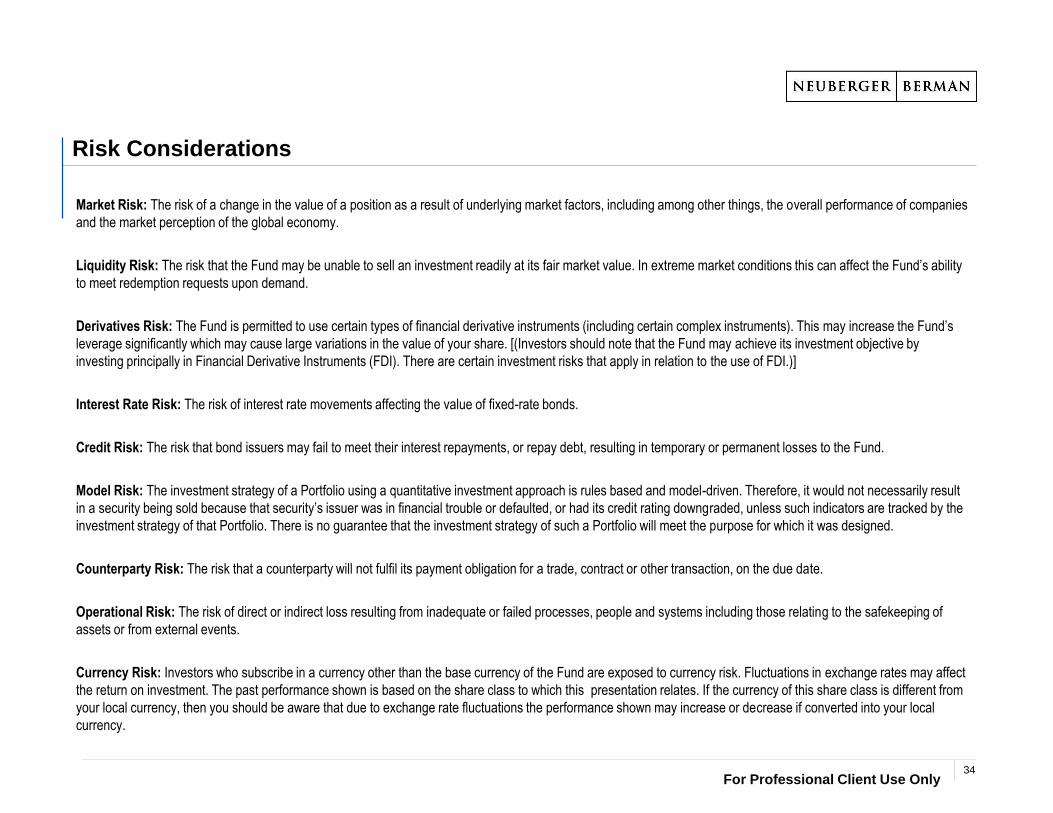
Risk Considerations
Market Risk: The risk of a change in the value of a position as a result of underlying market factors, including among other things, the overall performance of companies
and the market perception of the global economy.
Liquidity Risk: The risk that the Fund may be unable to sell an investment readily at its fair market value. In extreme market conditions this can affect the Fund’s ability
to meet redemption requests upon demand.
Derivatives Risk: The Fund is permitted to use certain types of financial derivative instruments (including certain complex instruments). This may increase the Fund’s
leverage significantly which may cause large variations in the value of your share. [(Investors should note that the Fund may achieve its investment objective by
investing principally in Financial Derivative Instruments (FDI). There are certain investment risks that apply in relation to the use of FDI.)]
Interest Rate Risk: The risk of interest rate movements affecting the value of fixed-rate bonds.
Credit Risk: The risk that bond issuers may fail to meet their interest repayments, or repay debt, resulting in temporary or permanent losses to the Fund.
Model Risk: The investment strategy of a Portfolio using a quantitative investment approach is rules based and model-driven. Therefore, it would not necessarily result
in a security being sold because that security’s issuer was in financial trouble or defaulted, or had its credit rating downgraded, unless such indicators are tracked by the
investment strategy of that Portfolio. There is no guarantee that the investment strategy of such a Portfolio will meet the purpose for which it was designed.
Counterparty Risk: The risk that a counterparty will not fulfil its payment obligation for a trade, contract or other transaction, on the due date.
Operational Risk: The risk of direct or indirect loss resulting from inadequate or failed processes, people and systems including those relating to the safekeeping of
assets or from external events.
Currency Risk: Investors who subscribe in a currency other than the base currency of the Fund are exposed to currency risk. Fluctuations in exchange rates may affect
the return on investment. The past performance shown is based on the share class to which this presentation relates. If the currency of this share class is different from
your local currency, then you should be aware that due to exchange rate fluctuations the performance shown may increase or decrease if converted into your local
currency.
34
For Professional Client Use Only
Hypothetical Backtested Performance Disclosures
The hypothetical performance results included in this material are for a back-tested model portfolio and are shown for illustrative purposes only. Neuberger Berman calculated the hypothetical results by
running a variety of model portfolios on a back-tested basis using the methodology described herein. The results are shown on a supplemental basis and do not represent the performance of any Neuberger
Berman managed account or product and do not reflect the fees and expenses associated with managing a portfolio.
Model NB Multi-Asset Class Growth Portfolio:
Model Presented: Model NB Multi-Asset Class Growth
Period: January 1, 2007 – December 31, 2017
Data Sources: Bloomberg; Neuberger Berman
Hypothetical Backtest Methodology:
The back-tested returns presented reflect hypothetical performance an investor would have obtained had it invested in the manner shown and does not represents returns that any investor actually attained.
Certain of the assumptions have been made for modeling purposes and are unlikely to be realized. No representation or warranty is made as to the reasonableness of the assumptions made or that all
assumptions used in achieving the returns have been stated or fully considered. Changes in the assumptions may have a material impact on the hypothetical returns presented.
The information presented is based upon the following hypothetical assumptions: Returns are gross of taxes and fees. Where live track records have been presented, returns are net of transaction costs;
where index data has been used, returns exclude the impact of transaction costs. The presented hypothetical returns have been simulated by creating a blend of strategies, rebalanced monthly (see next
page for the back-tested constituents and time periods).
There may be material differences between the hypothetical back-tested performance results and actual results achieved by actual accounts. Back-tested model performance is hypothetical and does not
represent the performance of actual accounts. Hypothetical performance has certain inherent limitations. Unlike actual investment performance, hypothetical results do not represent actual trading and
accordingly the performance results may have under- or over-compensated for the impact, if any, that certain economic or other market factors, such as lack of liquidity or price fluctuations, might have had
on the investment decision-making process or results if assets were actually being managed. Hypothetical performance may also not accurately reflect the impact, if any, of other material economic and
market factors, or the impact of financial risk and the ability to withstand losses. Hypothetical performance results are also subject to the fact that they are generally designed with the benefit of hindsight. As a
result, the back-tested models theoretically may be changed from time to time to obtain more favorable performance results. In addition, the results are based, in part, on hypothetical assumptions. Certain of
the assumptions have been made for modeling purposes and may not have been realized in the actual management of accounts. No representation or warranty is made as to the reasonableness of the
assumptions made or that all assumptions used in achieving the hypothetical results have been stated or fully considered. Changes in the model assumptions may have a material impact on the hypothetical
returns presented. There are frequently material differences between hypothetical performance results and actual results achieved by any investment strategy. Neuberger Berman did not manage any
accounts in this manner reflected in the models during the backtested time periods shown.
Unless otherwise indicated, results shown reflect reinvestment of any dividends and distributions. The hypothetical performance figures are shown gross of fees, which do not reflect the deduction of
investment advisory fees and other expense. If such fees and expense were reflected, returns referenced would be lower. Advisory fees are described in Part 2 of Neuberger Berman’s Form ADV. A client's
return will be reduced by the advisory fees and any other expenses it may incur in the management of its account. The deduction of fees has a compounding effect on performance results. For example,
assume Neuberger Berman achieves a 10% annual return prior to the deduction of fees each year for a period of ten years. If a fee of 1% of assets under management were charged and deducted from the
returns, the resulting compounded annual return would be reduced to 8.91%. Please note that there is no comparable reduction from the indices for the fees.
Model NB Multi-Asset Class Growth Portfolio
35
For Professional Client Use Only
Hypothetical Backtested Performance Disclosures
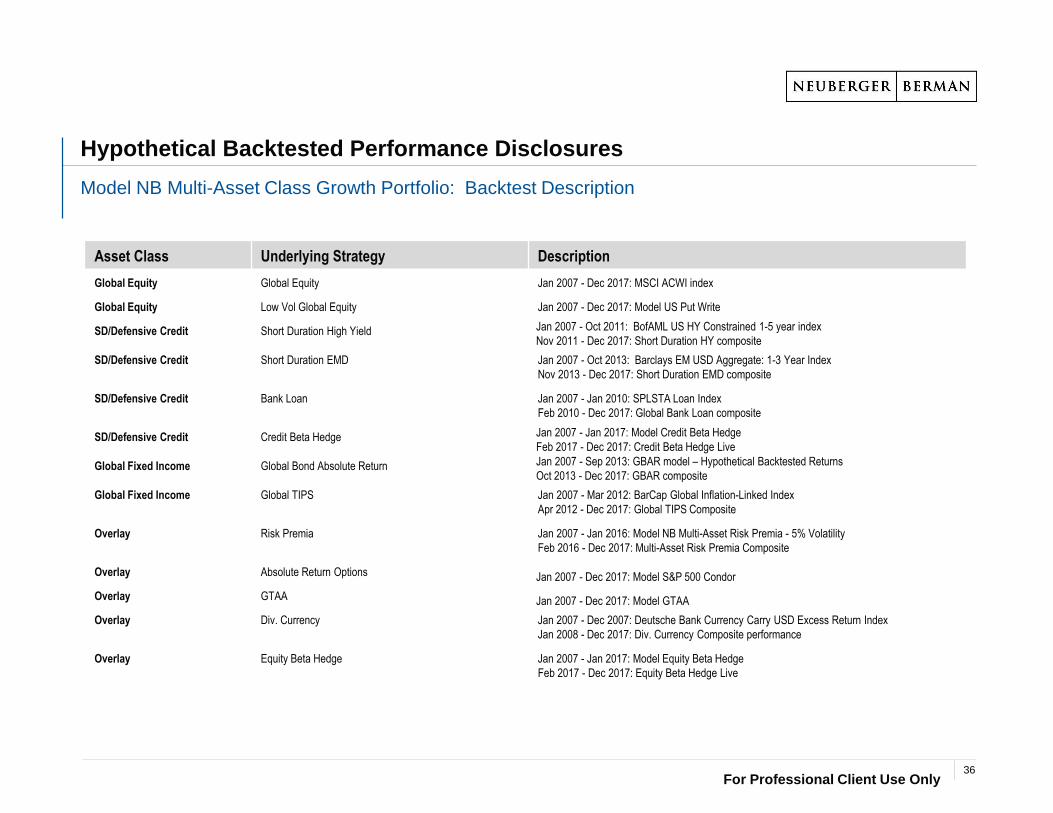
Model NB Multi-Asset Class Growth Portfolio: Backtest Description
Asset Class Underlying Strategy Description
Global Equity Global Equity Jan 2007 - Dec 2017: MSCI ACWI index
Global Equity Low Vol Global Equity Jan 2007 - Dec 2017: Model US Put Write
SD/Defensive Credit Short Duration High Yield Jan 2007 - Oct 2011: BofAML US HY Constrained 1-5 year index
Nov 2011 - Dec 2017: Short Duration HY composite
SD/Defensive Credit Short Duration EMD Jan 2007 - Oct 2013: Barclays EM USD Aggregate: 1-3 Year Index
Nov 2013 - Dec 2017: Short Duration EMD composite
SD/Defensive Credit Bank Loan Jan 2007 - Jan 2010: SPLSTA Loan Index
Feb 2010 - Dec 2017: Global Bank Loan composite
SD/Defensive Credit Credit Beta Hedge Jan 2007 - Jan 2017: Model Credit Beta Hedge
Feb 2017 - Dec 2017: Credit Beta Hedge Live
Global Fixed Income Global Bond Absolute Return Jan 2007 - Sep 2013: GBAR model – Hypothetical Backtested Returns
Oct 2013 - Dec 2017: GBAR composite
Global Fixed Income Global TIPS Jan 2007 - Mar 2012: BarCap Global Inflation-Linked Index
Apr 2012 - Dec 2017: Global TIPS Composite
Overlay Risk Premia Jan 2007 - Jan 2016: Model NB Multi-Asset Risk Premia - 5% Volatility
Feb 2016 - Dec 2017: Multi-Asset Risk Premia Composite
Overlay Absolute Return Options Jan 2007 - Dec 2017: Model S&P 500 Condor
Overlay GTAA Jan 2007 - Dec 2017: Model GTAA
Overlay Div. Currency Jan 2007 - Dec 2007: Deutsche Bank Currency Carry USD Excess Return Index
Jan 2008 - Dec 2017: Div. Currency Composite performance
Overlay Equity Beta Hedge Jan 2007 - Jan 2017: Model Equity Beta Hedge
Feb 2017 - Dec 2017: Equity Beta Hedge Live
36
For Professional Client Use Only
The hypothetical performance results included in this material are backtested model portfolios and are shown for illustrative purposes only. Neuberger Berman calculated the hypothetical results by running a variety ofmodel portfolios on a backtested basis using the methodology described herein. The results are shown on a supplemental basis and do not represent the performance of any Neuberger Berman managed account orproduct and do not reflect the fees and expenses associated with managing a portfolio.
Models Presented:
Model Iron Condor: Reflects a hypothetical backed tested model portfolio based on the performance of selling put and call option spreads on the S&P 500.
Time Periods: January 1, 2007 – December 31, 2017 for Model S&P 500 Iron Condor.
Hypothetical Backtest Methodology:The option strategy back-testing platform is designed to estimate historical performance of portfolios that implement systematic option writing strategies. Models support a multitude of variables including option strategy,e.g., put writing or call writing, underlying exposure (index or stock), tenor, moneyness, risk management parameters and collateral investments. While models incorporate different parameter sets, they adhere to aconsistent structure across all back-tested model scenarios and our model architecture is such that returns are estimated independent of account size.
All models rely on a Black-Scholes pricing to estimate option prices based on historical implied volatility surfaces. We compile daily implied volatility surfaces from exchange listed option price and/or option impliedvolatility data available from external data providers including the Chicago Board of Options Exchange (“CBOE”) and Bloomberg LP. Additional inputs for option pricing (dividends, risk-free rate, etc.) are sourced fromBloomberg LP.
Daily implied volatility surfaces allow models to price weekly expiration dates even though weekly option expirations may not have been actively traded on an exchange over the full history of a model back-test. Modelsmethodically allocate options across weekly expirations to promote diversification across expiration dates and are assumed to settle on each Friday consistent with current option market practices.
Exposures are rebalanced on a daily basis at the close of each trading day. Daily model rebalancing adjusts portfolio exposures and rolls (covers and writes) option positions consistent with specified risk managementtargets. Options are rolled in a manner that seeks to preserve exposures across multiple expiration dates, and risk management targets, e.g., option delta and or moneyness, are set at the inception of a back-test andapplied over its full history. All trading is assumed to be transacted at market closing prices derived from closing implied volatility levels and includes estimates for transaction costs. Option strike prices follow standardoption market conventions unique to the underlying index/security. Models may round up, down or to the nearest strike price when selecting option to write.
Hypothetical option models are fully collateralized such that model portfolios are assumed to hold fixed income securities whose aggregate market values are greater than or equal to the aggregate notional exposure ofthe options. Collateral is assumed to be invested in a widely followed index(s) that approximates the performance of short-term U.S. Treasuries. Models may vary from actual strategy performance due to assignmentrisk for American style options, exchanged traded option contract availability, intra-day trading and differences in transaction costs (implicit and explicit).
There may be material differences between the hypothetical back-tested performance results and actual results achieved by actual accounts. Back-tested model performance is hypothetical and does not represent theperformance of actual accounts. Hypothetical performance has certain inherent limitations. Unlike actual investment performance, hypothetical results do not represent actual trading and accordingly the performanceresults may have under- or over-compensated for the impact, if any, that certain economic or other market factors, such as lack of liquidity or price fluctuations, might have had on the investment decision-makingprocess or results if assets were actually being managed. Hypothetical performance may also not accurately reflect the impact, if any, of other material economic and market factors, or the impact of financial risk andthe ability to withstand losses. Hypothetical performance results are also subject to the fact that they are generally designed with the benefit of hindsight. As a result, the back-tested models theoretically may bechanged from time to time to obtain more favorable performance results. In addition, the results are based, in part, on hypothetical assumptions. Certain of the assumptions have been made for modeling purposes andmay not have been realized in the actual management of accounts. No representation or warranty is made as to the reasonableness of the assumptions made or that all assumptions used in achieving the hypotheticalresults have been stated or fully considered. Changes in the model assumptions may have a material impact on the hypothetical returns presented. There are frequently material differences between hypotheticalperformance results and actual results achieved by any investment strategy. Neuberger Berman did not manage any accounts in this manner reflected in the models during the backtested time periods shown.
Unless otherwise indicated, results shown reflect reinvestment of any dividends and distributions. Unless otherwise indicated, the hypothetical performance figures are shown gross of fees, which do not reflect thededuction of investment advisory fees, transaction costs and other expenses. If such fees and expense were reflected, returns referenced would be lower. Advisory fees are described in Part 2 of Neuberger Berman’sForm ADV. A client's return will be reduced by the advisory fees and any other expenses it may incur in the management of its account. The deduction of fees has a compounding effect on performance results. Forexample, assume Neuberger Berman achieves a 10% annual return prior to the deduction of fees each year for a period of ten years. If a fee of 1% of assets under management were charged and deducted from thereturns, the resulting compounded annual return would be reduced to 8.91%. Please note that there is no comparable reduction from the indices for the fees.
Hypothetical Backtested Performance Disclosures
Model S&P 500 Iron Condor
37
For Professional Client Use Only
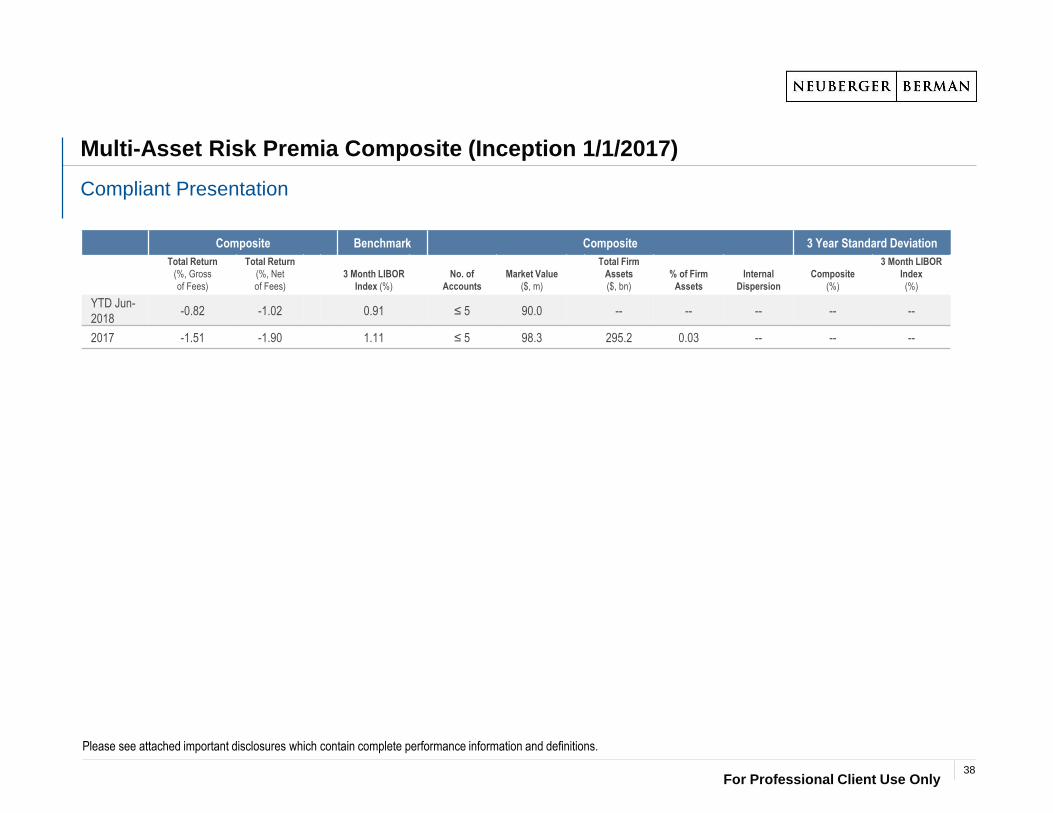
Multi-Asset Risk Premia Composite (Inception 1/1/2017)
Compliant Presentation
Please see attached important disclosures which contain complete performance information and definitions.
Composite Benchmark Composite 3 Year Standard Deviation
Total Return
(%, Gross
of Fees)
Total Return
(%, Net
of Fees)
3 Month LIBOR
Index (%)
No. of
Accounts
Market Value
($, m)
Total Firm
Assets
($, bn)
% of Firm
Assets
Internal
Dispersion
Composite
(%)
3 Month LIBOR
Index
(%)
YTD Jun-
2018-0.82 -1.02 0.91 ≤ 5 90.0 -- -- -- -- --
2017 -1.51 -1.90 1.11 ≤ 5 98.3 295.2 0.03 -- -- --
38
For Professional Client Use Only
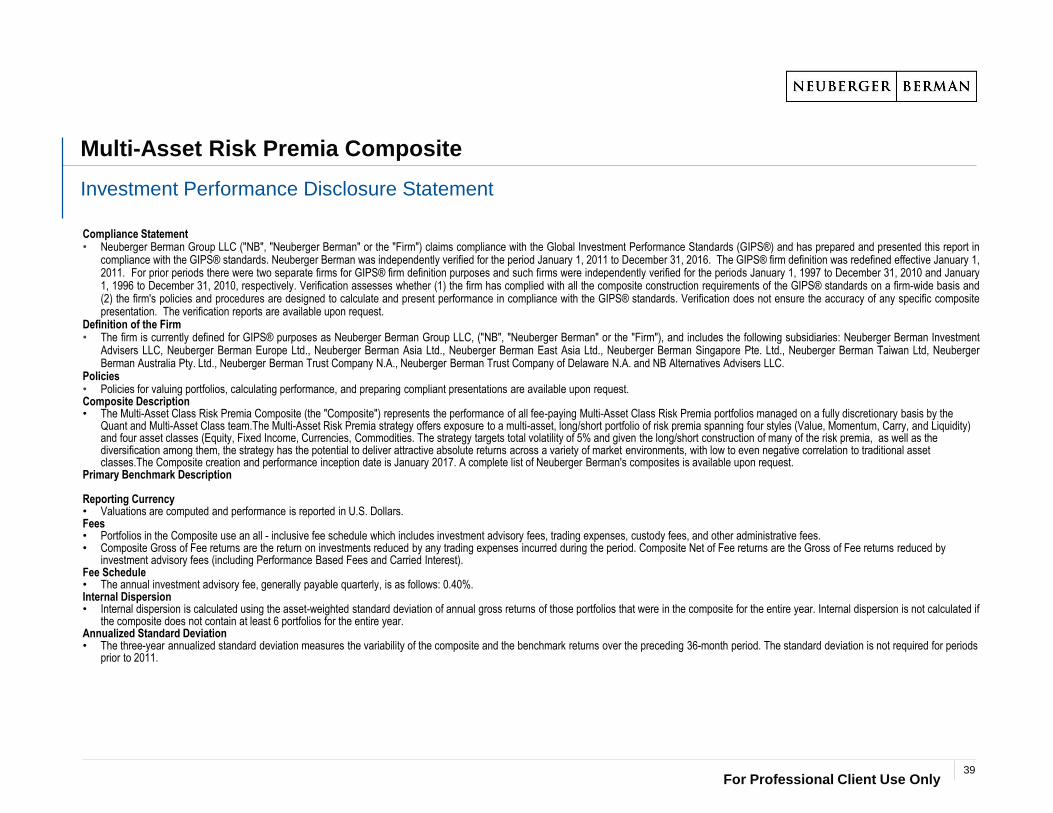
Multi-Asset Risk Premia Composite
Investment Performance Disclosure Statement
Compliance Statement• Neuberger Berman Group LLC ("NB", "Neuberger Berman" or the "Firm") claims compliance with the Global Investment Performance Standards (GIPS®) and has prepared and presented this report in
compliance with the GIPS® standards. Neuberger Berman was independently verified for the period January 1, 2011 to December 31, 2016. The GIPS® firm definition was redefined effective January 1,2011. For prior periods there were two separate firms for GIPS® firm definition purposes and such firms were independently verified for the periods January 1, 1997 to December 31, 2010 and January1, 1996 to December 31, 2010, respectively. Verification assesses whether (1) the firm has complied with all the composite construction requirements of the GIPS® standards on a firm-wide basis and(2) the firm's policies and procedures are designed to calculate and present performance in compliance with the GIPS® standards. Verification does not ensure the accuracy of any specific compositepresentation. The verification reports are available upon request.
Definition of the Firm• The firm is currently defined for GIPS® purposes as Neuberger Berman Group LLC, ("NB", "Neuberger Berman" or the "Firm"), and includes the following subsidiaries: Neuberger Berman Investment
Advisers LLC, Neuberger Berman Europe Ltd., Neuberger Berman Asia Ltd., Neuberger Berman East Asia Ltd., Neuberger Berman Singapore Pte. Ltd., Neuberger Berman Taiwan Ltd, NeubergerBerman Australia Pty. Ltd., Neuberger Berman Trust Company N.A., Neuberger Berman Trust Company of Delaware N.A. and NB Alternatives Advisers LLC.
Policies• Policies for valuing portfolios, calculating performance, and preparing compliant presentations are available upon request.Composite Description• The Multi-Asset Class Risk Premia Composite (the "Composite") represents the performance of all fee-paying Multi-Asset Class Risk Premia portfolios managed on a fully discretionary basis by the
Quant and Multi-Asset Class team.The Multi-Asset Risk Premia strategy offers exposure to a multi-asset, long/short portfolio of risk premia spanning four styles (Value, Momentum, Carry, and Liquidity) and four asset classes (Equity, Fixed Income, Currencies, Commodities. The strategy targets total volatility of 5% and given the long/short construction of many of the risk premia, as well as the diversification among them, the strategy has the potential to deliver attractive absolute returns across a variety of market environments, with low to even negative correlation to traditional asset classes.The Composite creation and performance inception date is January 2017. A complete list of Neuberger Berman's composites is available upon request.
Primary Benchmark Description
Reporting Currency• Valuations are computed and performance is reported in U.S. Dollars.Fees• Portfolios in the Composite use an all - inclusive fee schedule which includes investment advisory fees, trading expenses, custody fees, and other administrative fees.• Composite Gross of Fee returns are the return on investments reduced by any trading expenses incurred during the period. Composite Net of Fee returns are the Gross of Fee returns reduced by
investment advisory fees (including Performance Based Fees and Carried Interest).Fee Schedule• The annual investment advisory fee, generally payable quarterly, is as follows: 0.40%. Internal Dispersion• Internal dispersion is calculated using the asset-weighted standard deviation of annual gross returns of those portfolios that were in the composite for the entire year. Internal dispersion is not calculated if
the composite does not contain at least 6 portfolios for the entire year.Annualized Standard Deviation• The three-year annualized standard deviation measures the variability of the composite and the benchmark returns over the preceding 36-month period. The standard deviation is not required for periods
prior to 2011.
39
For Professional Client Use Only
Hypothetical Backtested Performance DisclosuresThe hypothetical performance results included in this material are backtested model portfolios and are shown for illustrative purposes only. Neuberger Berman calculated the hypothetical results by running a variety of model portfolios on a backtested basis using the methodology described herein. The results are shown on a supplemental basis and do not reflect the fees and expenses associated with managing a portfolio. The models assume a minimum $25 million investment with no cash allocations and monthly rebalancing.
Models Presented:
Model NB Multi-Asset Risk Premia - 5% Volatility (“Model NB MARP”): Reflects a hypothetical backed tested model portfolio that blends the performance of the individual risk premia that comprise the Model
NB MARP with a risk-balancing weighting assigned to each of the 13 alternative risk premia.
Model Equally-Weighted Alternative Risk Premia (“Model Equal Weight”): Reflects a hypothetical backed tested model portfolio that blends the performance of the individual risk premia that comprise the
Model NB MARP with a weighting assigned to each of the 13 alternative risk premia. The returns are then scaled by a constant so that the annualized volatility of the return series is equal to that of the Model NB
MARP.
Model Individual Risk Premia: 13 Individual Risk Premia Models from the categories of value, momentum, carry and liquidity. Reflects 13 individual hypothetical backed tested model portfolios using a rules-based
methodology that are subsequently combined to develop the Model NB MARP and Model Equal Weight portfolios.
Time Periods: January 1, 2005 – April 30, 2018 for Model NB MARP and Model Equal Weight. January 1, 2000 – April 30, 2018 for Model Individual Risk Premia.
Hypothetical Backtest Methodology:The simulated portfolios were constructed by determining a risk budget for the underlying assets and then applying a risk-balanced framework to determine portfolio weights. The risk budget was determined by identifying common risk premia from multiple assets, then bundling “similar” strategies into respective risk premia buckets. Risk budgeting was then applied at both the risk premia level as well as within each bucket, at the strategy level. The risk of each constituent asset was defined using historical data with more weight assigned to recent data (i.e. exponentially weighted with 1 year half life). To calculate the covariance matrix, we use an expanding data set with at least 5 years of data. Some shrinkage methods are also applied at this stage. The correlation matrix is a combination of 1) a standard correlation matrix and 2) a correlation matrix that averages correlations both within the asset classes and also across asset classes. The portfolio weights were derived by allocating equal risk to each asset class and to each asset within the asset class, and subsequently determining the portfolio weights to each asset that would provide for such a distribution of risk budget. After forming the portfolio, the next period’s asset returns obtained from Bloomberg are multiplied by the respective portfolio weights to get the next period's portfolio return. For certain period of time the backtested data reflects the returns of one or more Credit Suisse Index or Index Premia obtained from Bloomberg. The Credit Suisse Index/Premia is based upon the substantial similar methodology as utilized for the NB Model backtests. There may be differences between the NB Model backtests and Credit Suisse Index/Premia data as a result of the differences between the models and indexes/index premia, including the treatment of cash and timing of execution prices (NB Models use intra day execution prices whereas Credit Suisse Index/Premia data is based upon end of day pricing) . For purposes of clarification, regardless of the data source used for the hypothetical backtested models, all data is hypothetical backtested.
There may be material differences between the hypothetical back-tested performance results and actual results achieved by actual accounts. Back-tested model performance is hypothetical and does not represent the performance of actual accounts. Hypothetical performance has certain inherent limitations. Unlike actual investment performance, hypothetical results do not represent actual trading and accordingly the performance results may have under- or over-compensated for the impact, if any, that certain economic or other market factors, such as lack of liquidity or price fluctuations, might have had on the investment decision-making process or results if assets were actually being managed. Hypothetical performance may also not accurately reflect the impact, if any, of other material economic and market factors, or the impact of financial risk and the ability to withstand losses. Hypothetical performance results are also subject to the fact that they are generally designed with the benefit of hindsight. As a result, the back-tested models theoretically may be changed from time to time to obtain more favorable performance results. In addition, the results are based, in part, on hypothetical assumptions. Certain of the assumptions have been made for modeling purposes and may not have been realized in the actual management of accounts. No representation or warranty is made as to the reasonableness of the assumptions made or that all assumptions used in achieving the hypothetical results have been stated or fully considered. Changes in the model assumptions may have a material impact on the hypothetical returns presented. There are frequently material differences between hypothetical performance results and actual results achieved by any investment strategy. Neuberger Berman did not manage any accounts in this manner reflected in the models during the backtested time periods shown.
Unless otherwise indicated, results shown reflect reinvestment of any dividends and distributions. Unless otherwise indicated, the hypothetical performance figures are shown gross of fees, which do not reflect the deduction of investment advisory fees, transaction costs and other expenses. If such fees and expense were reflected, returns referenced would be lower. Advisory fees are described in Part 2 of Neuberger Berman’s Form ADV. A client's return will be reduced by the advisory fees and any other expenses it may incur in the management of its account. The deduction of fees has a compounding effect on performance results. For example, assume Neuberger Berman achieves a 10% annual return prior to the deduction of fees each year for a period of ten years. If a fee of 1% of assets under management were charged and deducted from the returns, the resulting compounded annual return would be reduced to 8.91%. Please note that there is no comparable reduction from the indices for the fees.
40
For Professional Client Use Only
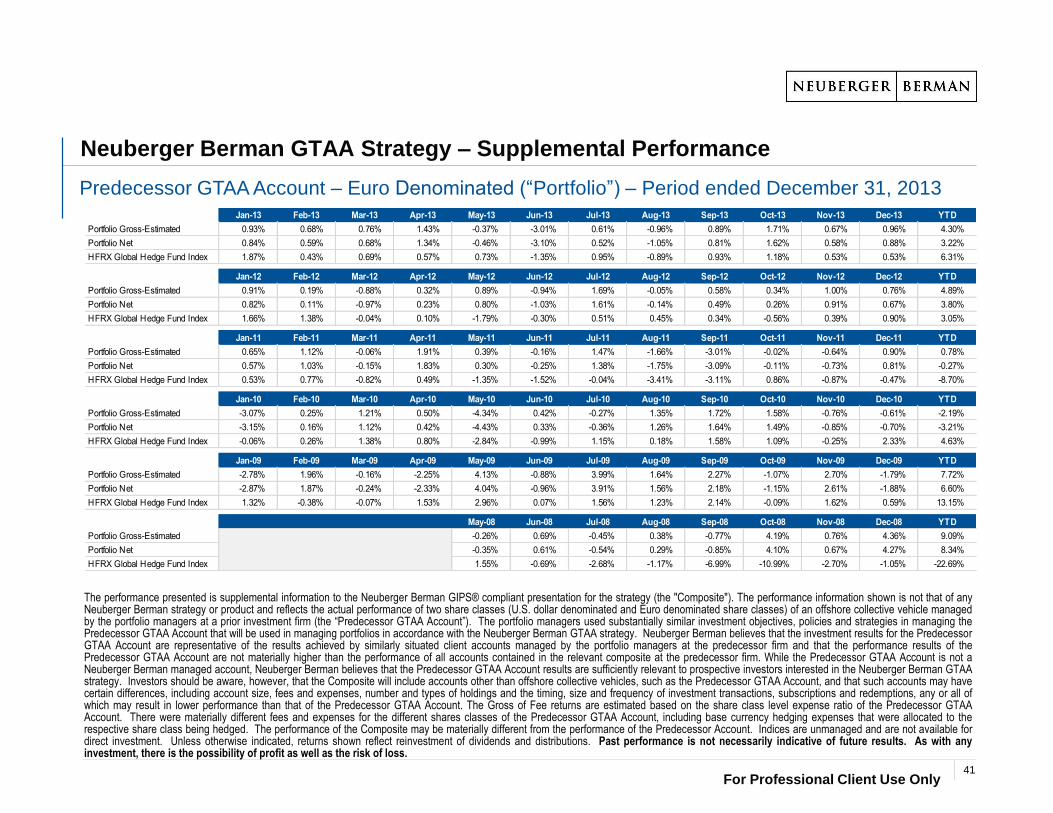
The performance presented is supplemental information to the Neuberger Berman GIPS® compliant presentation for the strategy (the "Composite"). The performance information shown is not that of anyNeuberger Berman strategy or product and reflects the actual performance of two share classes (U.S. dollar denominated and Euro denominated share classes) of an offshore collective vehicle managedby the portfolio managers at a prior investment firm (the “Predecessor GTAA Account”). The portfolio managers used substantially similar investment objectives, policies and strategies in managing thePredecessor GTAA Account that will be used in managing portfolios in accordance with the Neuberger Berman GTAA strategy. Neuberger Berman believes that the investment results for the PredecessorGTAA Account are representative of the results achieved by similarly situated client accounts managed by the portfolio managers at the predecessor firm and that the performance results of thePredecessor GTAA Account are not materially higher than the performance of all accounts contained in the relevant composite at the predecessor firm. While the Predecessor GTAA Account is not aNeuberger Berman managed account, Neuberger Berman believes that the Predecessor GTAA Account results are sufficiently relevant to prospective investors interested in the Neuberger Berman GTAAstrategy. Investors should be aware, however, that the Composite will include accounts other than offshore collective vehicles, such as the Predecessor GTAA Account, and that such accounts may havecertain differences, including account size, fees and expenses, number and types of holdings and the timing, size and frequency of investment transactions, subscriptions and redemptions, any or all ofwhich may result in lower performance than that of the Predecessor GTAA Account. The Gross of Fee returns are estimated based on the share class level expense ratio of the Predecessor GTAAAccount. There were materially different fees and expenses for the different shares classes of the Predecessor GTAA Account, including base currency hedging expenses that were allocated to therespective share class being hedged. The performance of the Composite may be materially different from the performance of the Predecessor Account. Indices are unmanaged and are not available fordirect investment. Unless otherwise indicated, returns shown reflect reinvestment of dividends and distributions. Past performance is not necessarily indicative of future results. As with anyinvestment, there is the possibility of profit as well as the risk of loss.
Predecessor GTAA Account – Euro Denominated (“Portfolio”) – Period ended December 31, 2013
Neuberger Berman GTAA Strategy – Supplemental Performance
Jan-13 Feb-13 Mar-13 Apr-13 May-13 Jun-13 Jul-13 Aug-13 Sep-13 Oct-13 Nov-13 Dec-13 YTD
Portfolio Gross-Estimated 0.93% 0.68% 0.76% 1.43% -0.37% -3.01% 0.61% -0.96% 0.89% 1.71% 0.67% 0.96% 4.30%
Portfolio Net 0.84% 0.59% 0.68% 1.34% -0.46% -3.10% 0.52% -1.05% 0.81% 1.62% 0.58% 0.88% 3.22%
HFRX Global Hedge Fund Index 1.87% 0.43% 0.69% 0.57% 0.73% -1.35% 0.95% -0.89% 0.93% 1.18% 0.53% 0.53% 6.31%
Jan-12 Feb-12 Mar-12 Apr-12 May-12 Jun-12 Jul-12 Aug-12 Sep-12 Oct-12 Nov-12 Dec-12 YTD
Portfolio Gross-Estimated 0.91% 0.19% -0.88% 0.32% 0.89% -0.94% 1.69% -0.05% 0.58% 0.34% 1.00% 0.76% 4.89%
Portfolio Net 0.82% 0.11% -0.97% 0.23% 0.80% -1.03% 1.61% -0.14% 0.49% 0.26% 0.91% 0.67% 3.80%
HFRX Global Hedge Fund Index 1.66% 1.38% -0.04% 0.10% -1.79% -0.30% 0.51% 0.45% 0.34% -0.56% 0.39% 0.90% 3.05%
Jan-11 Feb-11 Mar-11 Apr-11 May-11 Jun-11 Jul-11 Aug-11 Sep-11 Oct-11 Nov-11 Dec-11 YTD
Portfolio Gross-Estimated 0.65% 1.12% -0.06% 1.91% 0.39% -0.16% 1.47% -1.66% -3.01% -0.02% -0.64% 0.90% 0.78%
Portfolio Net 0.57% 1.03% -0.15% 1.83% 0.30% -0.25% 1.38% -1.75% -3.09% -0.11% -0.73% 0.81% -0.27%
HFRX Global Hedge Fund Index 0.53% 0.77% -0.82% 0.49% -1.35% -1.52% -0.04% -3.41% -3.11% 0.86% -0.87% -0.47% -8.70%
Jan-10 Feb-10 Mar-10 Apr-10 May-10 Jun-10 Jul-10 Aug-10 Sep-10 Oct-10 Nov-10 Dec-10 YTD
Portfolio Gross-Estimated -3.07% 0.25% 1.21% 0.50% -4.34% 0.42% -0.27% 1.35% 1.72% 1.58% -0.76% -0.61% -2.19%
Portfolio Net -3.15% 0.16% 1.12% 0.42% -4.43% 0.33% -0.36% 1.26% 1.64% 1.49% -0.85% -0.70% -3.21%
HFRX Global Hedge Fund Index -0.06% 0.26% 1.38% 0.80% -2.84% -0.99% 1.15% 0.18% 1.58% 1.09% -0.25% 2.33% 4.63%
Jan-09 Feb-09 Mar-09 Apr-09 May-09 Jun-09 Jul-09 Aug-09 Sep-09 Oct-09 Nov-09 Dec-09 YTD
Portfolio Gross-Estimated -2.78% 1.96% -0.16% -2.25% 4.13% -0.88% 3.99% 1.64% 2.27% -1.07% 2.70% -1.79% 7.72%
Portfolio Net -2.87% 1.87% -0.24% -2.33% 4.04% -0.96% 3.91% 1.56% 2.18% -1.15% 2.61% -1.88% 6.60%
HFRX Global Hedge Fund Index 1.32% -0.38% -0.07% 1.53% 2.96% 0.07% 1.56% 1.23% 2.14% -0.09% 1.62% 0.59% 13.15%
May-08 Jun-08 Jul-08 Aug-08 Sep-08 Oct-08 Nov-08 Dec-08 YTD
Portfolio Gross-Estimated -0.26% 0.69% -0.45% 0.38% -0.77% 4.19% 0.76% 4.36% 9.09%
Portfolio Net -0.35% 0.61% -0.54% 0.29% -0.85% 4.10% 0.67% 4.27% 8.34%
HFRX Global Hedge Fund Index 1.55% -0.69% -2.68% -1.17% -6.99% -10.99% -2.70% -1.05% -22.69%
41
For Professional Client Use Only
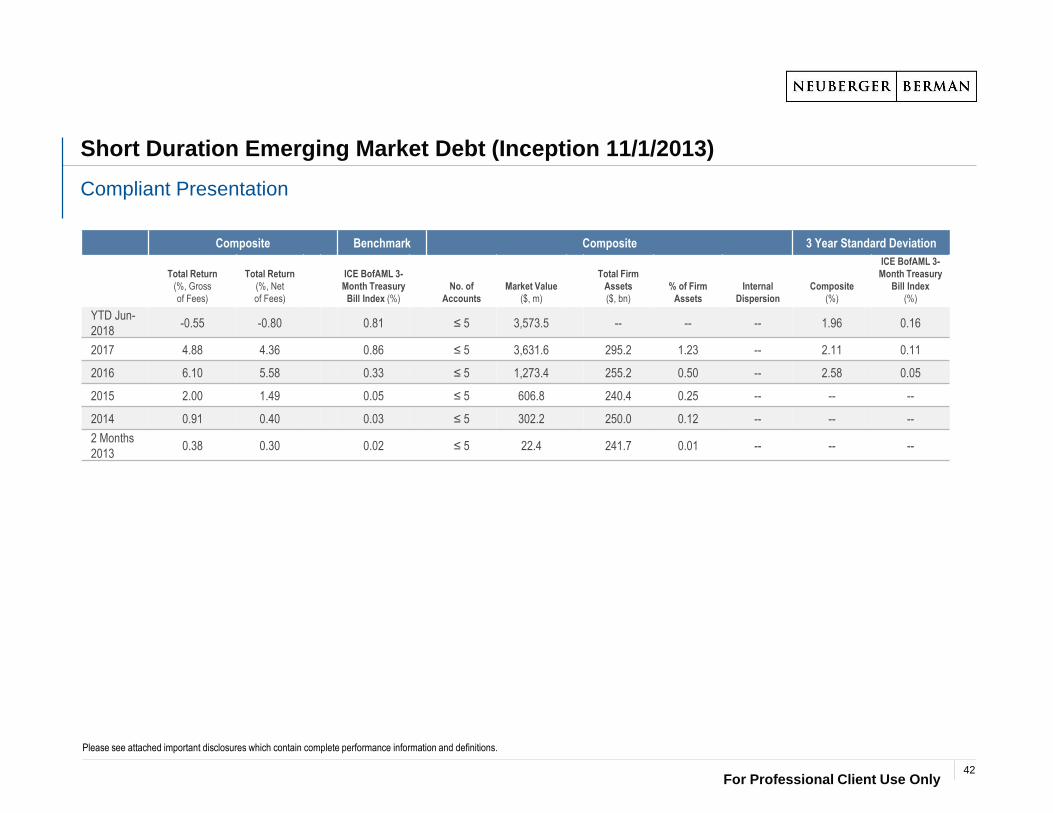
Short Duration Emerging Market Debt (Inception 11/1/2013)
Compliant Presentation
Please see attached important disclosures which contain complete performance information and definitions.
Composite Benchmark Composite 3 Year Standard Deviation
Total Return
(%, Gross
of Fees)
Total Return
(%, Net
of Fees)
ICE BofAML 3-
Month Treasury
Bill Index (%)
No. of
Accounts
Market Value
($, m)
Total Firm
Assets
($, bn)
% of Firm
Assets
Internal
Dispersion
Composite
(%)
ICE BofAML 3-
Month Treasury
Bill Index
(%)
YTD Jun-
2018-0.55 -0.80 0.81 ≤ 5 3,573.5 -- -- -- 1.96 0.16
2017 4.88 4.36 0.86 ≤ 5 3,631.6 295.2 1.23 -- 2.11 0.11
2016 6.10 5.58 0.33 ≤ 5 1,273.4 255.2 0.50 -- 2.58 0.05
2015 2.00 1.49 0.05 ≤ 5 606.8 240.4 0.25 -- -- --
2014 0.91 0.40 0.03 ≤ 5 302.2 250.0 0.12 -- -- --
2 Months
20130.38 0.30 0.02 ≤ 5 22.4 241.7 0.01 -- -- --
42
For Professional Client Use Only
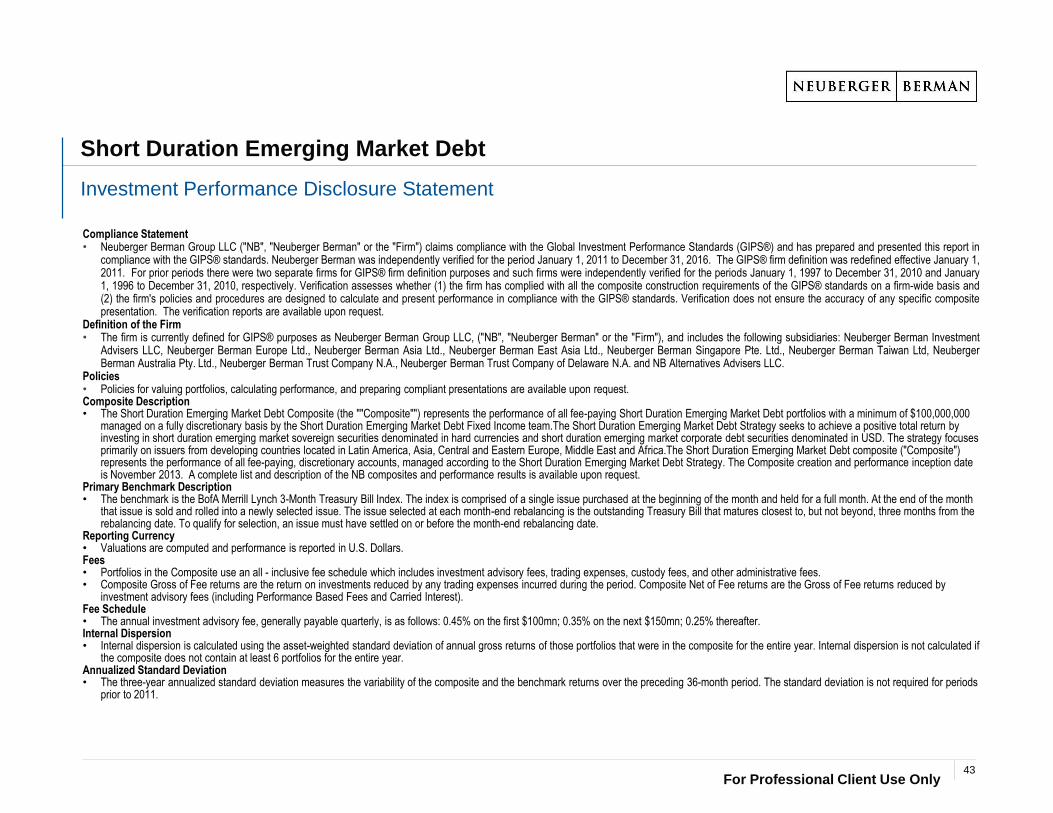
Short Duration Emerging Market Debt
Investment Performance Disclosure Statement
Compliance Statement• Neuberger Berman Group LLC ("NB", "Neuberger Berman" or the "Firm") claims compliance with the Global Investment Performance Standards (GIPS®) and has prepared and presented this report in
compliance with the GIPS® standards. Neuberger Berman was independently verified for the period January 1, 2011 to December 31, 2016. The GIPS® firm definition was redefined effective January 1,2011. For prior periods there were two separate firms for GIPS® firm definition purposes and such firms were independently verified for the periods January 1, 1997 to December 31, 2010 and January1, 1996 to December 31, 2010, respectively. Verification assesses whether (1) the firm has complied with all the composite construction requirements of the GIPS® standards on a firm-wide basis and(2) the firm's policies and procedures are designed to calculate and present performance in compliance with the GIPS® standards. Verification does not ensure the accuracy of any specific compositepresentation. The verification reports are available upon request.
Definition of the Firm• The firm is currently defined for GIPS® purposes as Neuberger Berman Group LLC, ("NB", "Neuberger Berman" or the "Firm"), and includes the following subsidiaries: Neuberger Berman Investment
Advisers LLC, Neuberger Berman Europe Ltd., Neuberger Berman Asia Ltd., Neuberger Berman East Asia Ltd., Neuberger Berman Singapore Pte. Ltd., Neuberger Berman Taiwan Ltd, NeubergerBerman Australia Pty. Ltd., Neuberger Berman Trust Company N.A., Neuberger Berman Trust Company of Delaware N.A. and NB Alternatives Advisers LLC.
Policies• Policies for valuing portfolios, calculating performance, and preparing compliant presentations are available upon request.Composite Description• The Short Duration Emerging Market Debt Composite (the ""Composite"") represents the performance of all fee-paying Short Duration Emerging Market Debt portfolios with a minimum of $100,000,000
managed on a fully discretionary basis by the Short Duration Emerging Market Debt Fixed Income team.The Short Duration Emerging Market Debt Strategy seeks to achieve a positive total return by investing in short duration emerging market sovereign securities denominated in hard currencies and short duration emerging market corporate debt securities denominated in USD. The strategy focuses primarily on issuers from developing countries located in Latin America, Asia, Central and Eastern Europe, Middle East and Africa.The Short Duration Emerging Market Debt composite ("Composite") represents the performance of all fee-paying, discretionary accounts, managed according to the Short Duration Emerging Market Debt Strategy. The Composite creation and performance inception date is November 2013. A complete list and description of the NB composites and performance results is available upon request.
Primary Benchmark Description• The benchmark is the BofA Merrill Lynch 3-Month Treasury Bill Index. The index is comprised of a single issue purchased at the beginning of the month and held for a full month. At the end of the month
that issue is sold and rolled into a newly selected issue. The issue selected at each month-end rebalancing is the outstanding Treasury Bill that matures closest to, but not beyond, three months from the rebalancing date. To qualify for selection, an issue must have settled on or before the month-end rebalancing date.
Reporting Currency• Valuations are computed and performance is reported in U.S. Dollars.Fees• Portfolios in the Composite use an all - inclusive fee schedule which includes investment advisory fees, trading expenses, custody fees, and other administrative fees.• Composite Gross of Fee returns are the return on investments reduced by any trading expenses incurred during the period. Composite Net of Fee returns are the Gross of Fee returns reduced by
investment advisory fees (including Performance Based Fees and Carried Interest).Fee Schedule• The annual investment advisory fee, generally payable quarterly, is as follows: 0.45% on the first $100mn; 0.35% on the next $150mn; 0.25% thereafter. Internal Dispersion• Internal dispersion is calculated using the asset-weighted standard deviation of annual gross returns of those portfolios that were in the composite for the entire year. Internal dispersion is not calculated if
the composite does not contain at least 6 portfolios for the entire year.Annualized Standard Deviation• The three-year annualized standard deviation measures the variability of the composite and the benchmark returns over the preceding 36-month period. The standard deviation is not required for periods
prior to 2011.
43
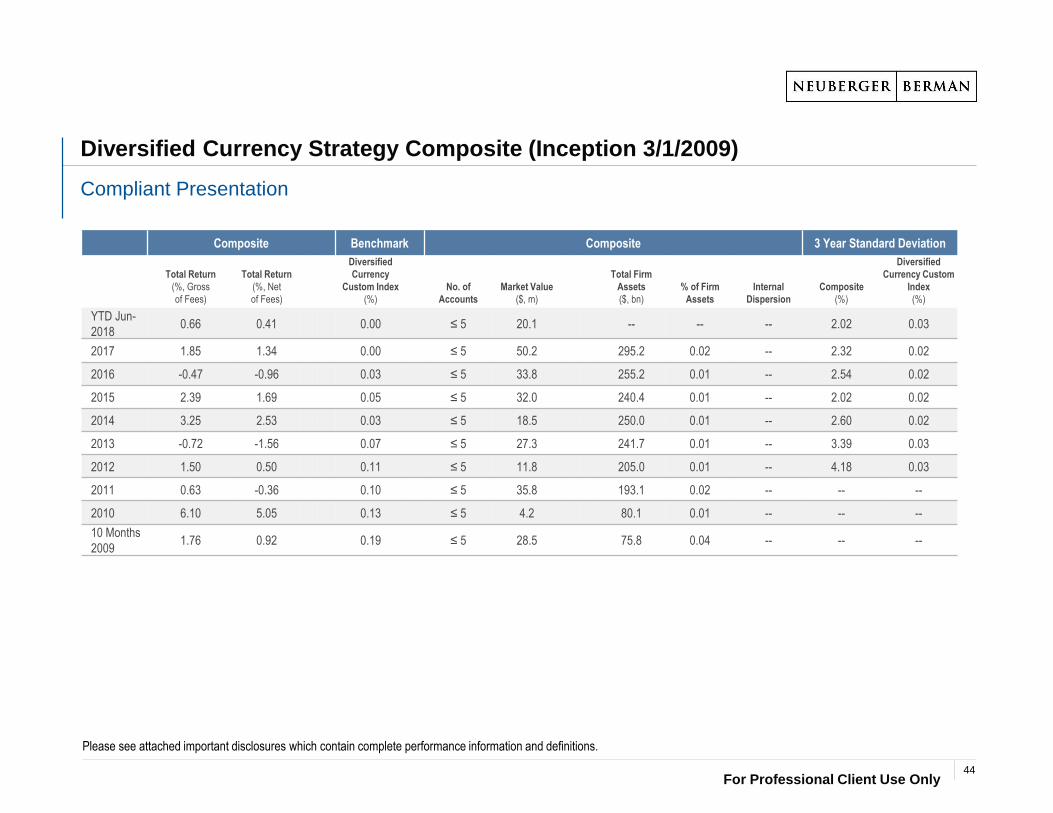
For Professional Client Use Only
Diversified Currency Strategy Composite (Inception 3/1/2009)
Compliant Presentation
Please see attached important disclosures which contain complete performance information and definitions.
Composite Benchmark Composite 3 Year Standard Deviation
Total Return
(%, Gross
of Fees)
Total Return
(%, Net
of Fees)
Diversified
Currency
Custom Index
(%)
No. of
Accounts
Market Value
($, m)
Total Firm
Assets
($, bn)
% of Firm
Assets
Internal
Dispersion
Composite
(%)
Diversified
Currency Custom
Index
(%)
YTD Jun-
20180.66 0.41 0.00 ≤ 5 20.1 -- -- -- 2.02 0.03
2017 1.85 1.34 0.00 ≤ 5 50.2 295.2 0.02 -- 2.32 0.02
2016 -0.47 -0.96 0.03 ≤ 5 33.8 255.2 0.01 -- 2.54 0.02
2015 2.39 1.69 0.05 ≤ 5 32.0 240.4 0.01 -- 2.02 0.02
2014 3.25 2.53 0.03 ≤ 5 18.5 250.0 0.01 -- 2.60 0.02
2013 -0.72 -1.56 0.07 ≤ 5 27.3 241.7 0.01 -- 3.39 0.03
2012 1.50 0.50 0.11 ≤ 5 11.8 205.0 0.01 -- 4.18 0.03
2011 0.63 -0.36 0.10 ≤ 5 35.8 193.1 0.02 -- -- --
2010 6.10 5.05 0.13 ≤ 5 4.2 80.1 0.01 -- -- --
10 Months
20091.76 0.92 0.19 ≤ 5 28.5 75.8 0.04 -- -- --
44

For Professional Client Use Only
Diversified Currency Strategy Composite
Investment Performance Disclosure Statement
Compliance Statement• Neuberger Berman Group LLC ("NB", "Neuberger Berman" or the "Firm") claims compliance with the Global Investment Performance Standards (GIPS®) and has prepared and presented this report in
compliance with the GIPS® standards. Neuberger Berman was independently verified for the period January 1, 2011 to December 31, 2016. The GIPS® firm definition was redefined effective January 1,2011. For prior periods there were two separate firms for GIPS® firm definition purposes and such firms were independently verified for the periods January 1, 1997 to December 31, 2010 and January1, 1996 to December 31, 2010, respectively. Verification assesses whether (1) the firm has complied with all the composite construction requirements of the GIPS® standards on a firm-wide basis and(2) the firm's policies and procedures are designed to calculate and present performance in compliance with the GIPS® standards. Verification does not ensure the accuracy of any specific compositepresentation. The verification reports are available upon request.
Definition of the Firm• The firm is currently defined for GIPS® purposes as Neuberger Berman Group LLC, ("NB", "Neuberger Berman" or the "Firm"), and includes the following subsidiaries: Neuberger Berman Investment
Advisers LLC, Neuberger Berman Europe Ltd., Neuberger Berman Asia Ltd., Neuberger Berman East Asia Ltd., Neuberger Berman Singapore Pte. Ltd., Neuberger Berman Taiwan Ltd, NeubergerBerman Australia Pty. Ltd., Neuberger Berman Trust Company N.A., Neuberger Berman Trust Company of Delaware N.A. and NB Alternatives Advisers LLC.
Policies• Policies for valuing portfolios, calculating performance, and preparing compliant presentations are available upon request.Composite Description• The Diversified Currency Composite (the "Composite") includes the performance of all fee-paying Diversified Currency portfolios managed by the Currency team. The Diversified Currency strategy aims
to generate an absolute return over a medium to long term investment horizon with a moderate level of volatility. The Portfolio will invest primarily in global liquid currencies (including, without limitation, Australian Dollars, Canadian Dollars, Swiss Franc, Euro, Sterling, Japanese Yen, Norwegian Krone, New Zealand Dollars, Swedish Krona and US Dollars) using a fundamentally driven, relative value approach. The strategy is implemented through spot and forward foreign exchange contracts, cash instruments, liquid assets, high quality short term money market instruments, and futures and currency options. The Composite creation date is February 2012 and performance inception date is March 2009. The composite is managed since inception by Ugo Lancioni and the currency team based in London (UK). A complete list of Neuberger Berman's composites is available upon request.
Primary Benchmark Description• The composite follows a total return strategy that does not have an appropriate benchmark.Effective March 2016, the benchmark changed from the BofA Merrill Lynch US 3 Month Treasury Index to no
benchmark. The benchmark was removed to highlight that the Diversified Currency strategy is implemented as an Overlay which intends to add an incremental layer of alpha and to generate an absolute return over a medium to long term investment horizon.
Reporting Currency• Valuations are computed and performance is reported in U.S. Dollars.Fees• Portfolios in the Composite use an all - inclusive fee schedule which includes investment advisory fees, trading expenses, custody fees, and other administrative fees.• Composite Gross of Fee returns are the return on investments reduced by any trading expenses incurred during the period. Composite Net of Fee returns are the Gross of Fee returns reduced by
investment advisory fees (including Performance Based Fees and Carried Interest).Fee Schedule• The annual investment advisory fee, generally payable quarterly, is as follows: 0.70% on the first $25mn; 0.65% on the next $50mn; 0.55% on the next $50mn; 0.45% thereafter. Internal Dispersion• Internal dispersion is calculated using the asset-weighted standard deviation of annual gross returns of those portfolios that were in the composite for the entire year. Internal dispersion is not calculated if
the composite does not contain at least 6 portfolios for the entire year.Annualized Standard Deviation• The three-year annualized standard deviation measures the variability of the composite and the benchmark returns over the preceding 36-month period. The standard deviation is not required for periods
prior to 2011.
45
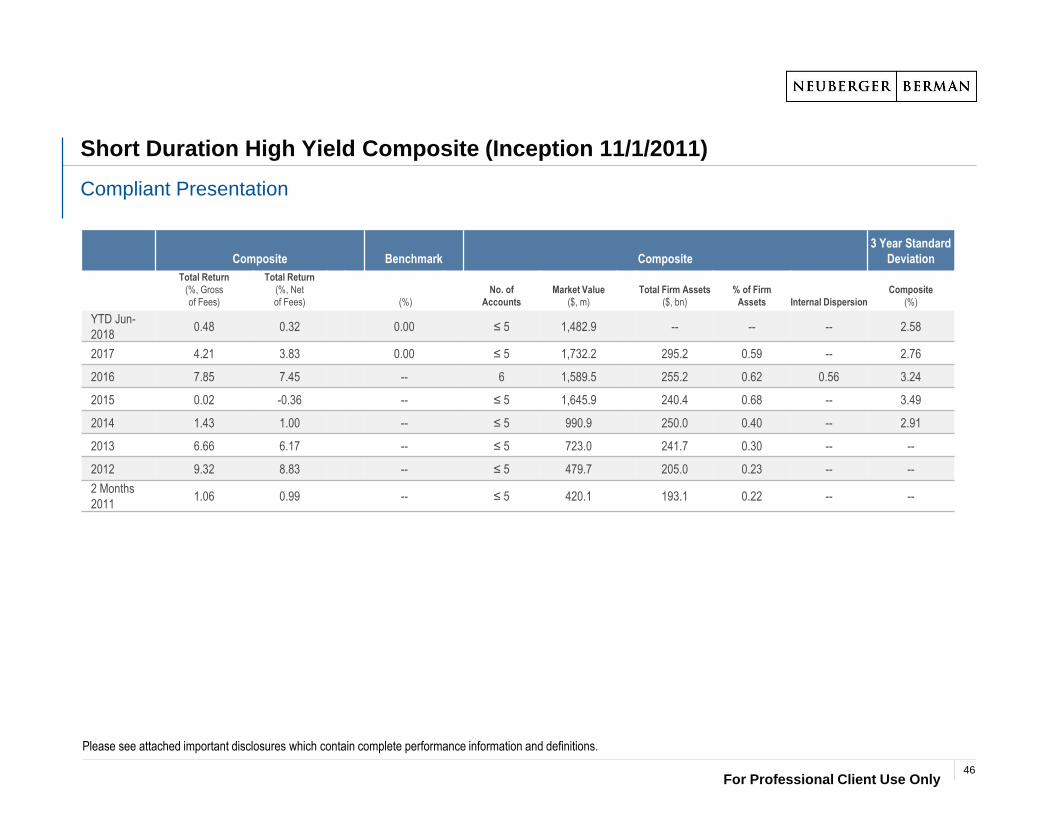
For Professional Client Use Only
Short Duration High Yield Composite (Inception 11/1/2011)
Compliant Presentation
Please see attached important disclosures which contain complete performance information and definitions.
Composite Benchmark Composite
3 Year Standard
Deviation
Total Return
(%, Gross
of Fees)
Total Return
(%, Net
of Fees) (%)
No. of
Accounts
Market Value
($, m)
Total Firm Assets
($, bn)
% of Firm
Assets Internal Dispersion
Composite
(%)
YTD Jun-
20180.48 0.32 0.00 ≤ 5 1,482.9 -- -- -- 2.58
2017 4.21 3.83 0.00 ≤ 5 1,732.2 295.2 0.59 -- 2.76
2016 7.85 7.45 -- 6 1,589.5 255.2 0.62 0.56 3.24
2015 0.02 -0.36 -- ≤ 5 1,645.9 240.4 0.68 -- 3.49
2014 1.43 1.00 -- ≤ 5 990.9 250.0 0.40 -- 2.91
2013 6.66 6.17 -- ≤ 5 723.0 241.7 0.30 -- --
2012 9.32 8.83 -- ≤ 5 479.7 205.0 0.23 -- --
2 Months
20111.06 0.99 -- ≤ 5 420.1 193.1 0.22 -- --
46
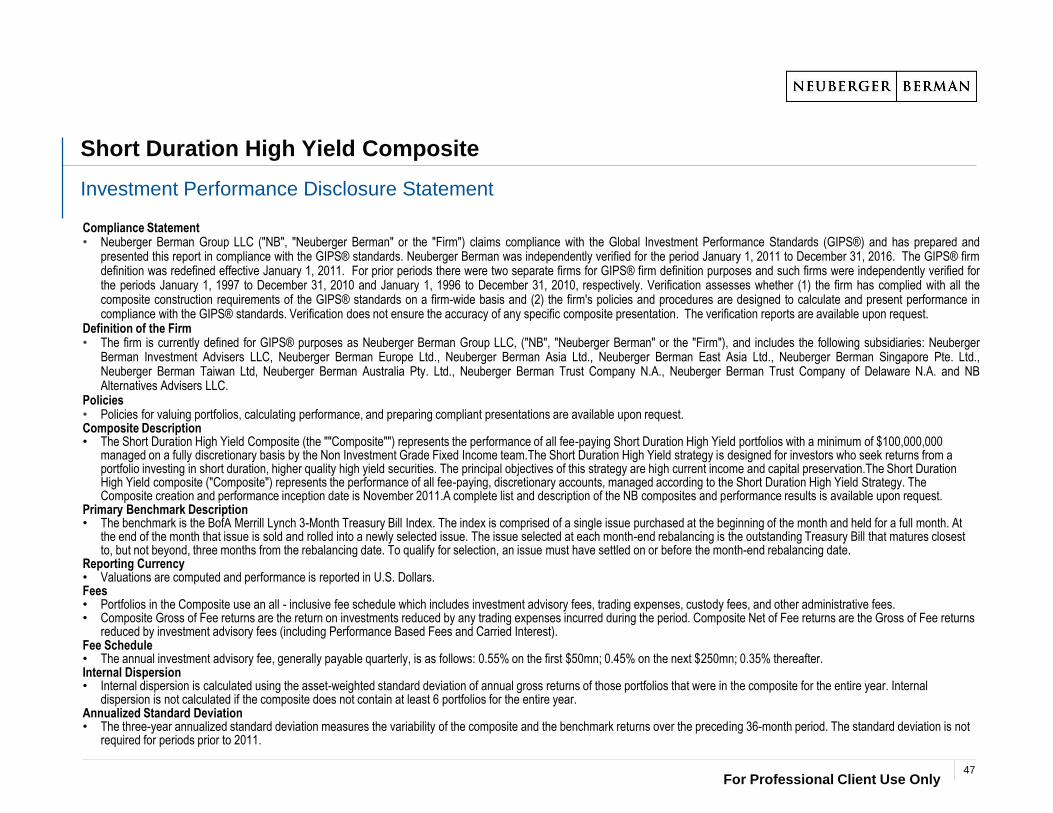
For Professional Client Use Only
Short Duration High Yield Composite
Investment Performance Disclosure Statement
Compliance Statement• Neuberger Berman Group LLC ("NB", "Neuberger Berman" or the "Firm") claims compliance with the Global Investment Performance Standards (GIPS®) and has prepared and
presented this report in compliance with the GIPS® standards. Neuberger Berman was independently verified for the period January 1, 2011 to December 31, 2016. The GIPS® firmdefinition was redefined effective January 1, 2011. For prior periods there were two separate firms for GIPS® firm definition purposes and such firms were independently verified forthe periods January 1, 1997 to December 31, 2010 and January 1, 1996 to December 31, 2010, respectively. Verification assesses whether (1) the firm has complied with all thecomposite construction requirements of the GIPS® standards on a firm-wide basis and (2) the firm's policies and procedures are designed to calculate and present performance incompliance with the GIPS® standards. Verification does not ensure the accuracy of any specific composite presentation. The verification reports are available upon request.
Definition of the Firm• The firm is currently defined for GIPS® purposes as Neuberger Berman Group LLC, ("NB", "Neuberger Berman" or the "Firm"), and includes the following subsidiaries: Neuberger
Berman Investment Advisers LLC, Neuberger Berman Europe Ltd., Neuberger Berman Asia Ltd., Neuberger Berman East Asia Ltd., Neuberger Berman Singapore Pte. Ltd.,Neuberger Berman Taiwan Ltd, Neuberger Berman Australia Pty. Ltd., Neuberger Berman Trust Company N.A., Neuberger Berman Trust Company of Delaware N.A. and NBAlternatives Advisers LLC.
Policies• Policies for valuing portfolios, calculating performance, and preparing compliant presentations are available upon request.Composite Description• The Short Duration High Yield Composite (the ""Composite"") represents the performance of all fee-paying Short Duration High Yield portfolios with a minimum of $100,000,000
managed on a fully discretionary basis by the Non Investment Grade Fixed Income team.The Short Duration High Yield strategy is designed for investors who seek returns from a portfolio investing in short duration, higher quality high yield securities. The principal objectives of this strategy are high current income and capital preservation.The Short Duration High Yield composite ("Composite") represents the performance of all fee-paying, discretionary accounts, managed according to the Short Duration High Yield Strategy. The Composite creation and performance inception date is November 2011.A complete list and description of the NB composites and performance results is available upon request.
Primary Benchmark Description• The benchmark is the BofA Merrill Lynch 3-Month Treasury Bill Index. The index is comprised of a single issue purchased at the beginning of the month and held for a full month. At
the end of the month that issue is sold and rolled into a newly selected issue. The issue selected at each month-end rebalancing is the outstanding Treasury Bill that matures closest to, but not beyond, three months from the rebalancing date. To qualify for selection, an issue must have settled on or before the month-end rebalancing date.
Reporting Currency• Valuations are computed and performance is reported in U.S. Dollars.Fees• Portfolios in the Composite use an all - inclusive fee schedule which includes investment advisory fees, trading expenses, custody fees, and other administrative fees.• Composite Gross of Fee returns are the return on investments reduced by any trading expenses incurred during the period. Composite Net of Fee returns are the Gross of Fee returns
reduced by investment advisory fees (including Performance Based Fees and Carried Interest).Fee Schedule• The annual investment advisory fee, generally payable quarterly, is as follows: 0.55% on the first $50mn; 0.45% on the next $250mn; 0.35% thereafter. Internal Dispersion• Internal dispersion is calculated using the asset-weighted standard deviation of annual gross returns of those portfolios that were in the composite for the entire year. Internal
dispersion is not calculated if the composite does not contain at least 6 portfolios for the entire year.Annualized Standard Deviation• The three-year annualized standard deviation measures the variability of the composite and the benchmark returns over the preceding 36-month period. The standard deviation is not
required for periods prior to 2011.
47
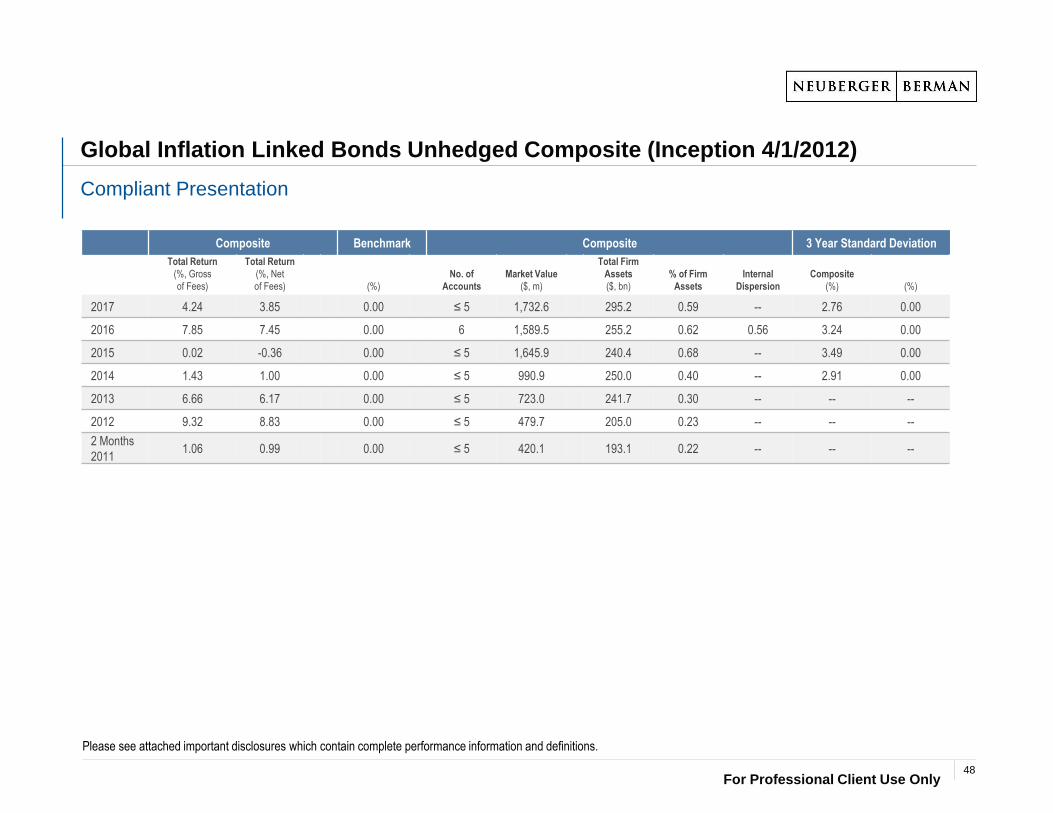
For Professional Client Use Only
Global Inflation Linked Bonds Unhedged Composite (Inception 4/1/2012)
Compliant Presentation
Please see attached important disclosures which contain complete performance information and definitions.
Composite Benchmark Composite 3 Year Standard Deviation
Total Return
(%, Gross
of Fees)
Total Return
(%, Net
of Fees) (%)
No. of
Accounts
Market Value
($, m)
Total Firm
Assets
($, bn)
% of Firm
Assets
Internal
Dispersion
Composite
(%) (%)
2017 4.24 3.85 0.00 ≤ 5 1,732.6 295.2 0.59 -- 2.76 0.00
2016 7.85 7.45 0.00 6 1,589.5 255.2 0.62 0.56 3.24 0.00
2015 0.02 -0.36 0.00 ≤ 5 1,645.9 240.4 0.68 -- 3.49 0.00
2014 1.43 1.00 0.00 ≤ 5 990.9 250.0 0.40 -- 2.91 0.00
2013 6.66 6.17 0.00 ≤ 5 723.0 241.7 0.30 -- -- --
2012 9.32 8.83 0.00 ≤ 5 479.7 205.0 0.23 -- -- --
2 Months
20111.06 0.99 0.00 ≤ 5 420.1 193.1 0.22 -- -- --
48
For Professional Client Use Only
Global Inflation Linked Bonds Unhedged Composite
Investment Performance Disclosure Statement
Compliance Statement• Neuberger Berman Group LLC ("NB", "Neuberger Berman" or the "Firm") claims compliance with the Global Investment Performance Standards (GIPS®) and has prepared and
presented this report in compliance with the GIPS® standards. Neuberger Berman was independently verified for the period January 1, 2011 to December 31, 2016. The GIPS® firmdefinition was redefined effective January 1, 2011. For prior periods there were two separate firms for GIPS® firm definition purposes and such firms were independently verified forthe periods January 1, 1997 to December 31, 2010 and January 1, 1996 to December 31, 2010, respectively. Verification assesses whether (1) the firm has complied with all thecomposite construction requirements of the GIPS® standards on a firm-wide basis and (2) the firm's policies and procedures are designed to calculate and present performance incompliance with the GIPS® standards. Verification does not ensure the accuracy of any specific composite presentation. The verification reports are available upon request.
Definition of the Firm• The firm is currently defined for GIPS® purposes as Neuberger Berman Group LLC, ("NB", "Neuberger Berman" or the "Firm"), and includes the following subsidiaries: Neuberger
Berman Investment Advisers LLC, Neuberger Berman Europe Ltd., Neuberger Berman Asia Ltd., Neuberger Berman East Asia Ltd., Neuberger Berman Singapore Pte. Ltd.,Neuberger Berman Taiwan Ltd, Neuberger Berman Australia Pty. Ltd., Neuberger Berman Trust Company N.A., Neuberger Berman Trust Company of Delaware N.A. and NBAlternatives Advisers LLC.
Policies• Policies for valuing portfolios, calculating performance, and preparing compliant presentations are available upon request.Composite Description• The Global Inflation Linked Bonds Unhedged Composite (the "Composite"), formerly known as Global Inflation-Linked II, includes the performance of all fee-paying Global Inflation
Linked Bonds Unhedged portfolios with no investment minimum managed on a fully discretionary basis by the Investment Grade Fixed Income team. The Global Inflation Linked Bonds Unhedged strategy is designed for investors who seek returns from a portfolio that invests in global inflation linked securities. The emphasis is on bond selection and interest rate timing with respect to real interest rates and inflation expectations. The Composite creation date is January 2013 and performance inception date is April 2012 . A complete list of Neuberger Berman's composites is available upon request.
Primary Benchmark Description• The benchmark is the Bloomberg Barclays Global Inflation Linked Index. The index measures the performance of the major government inflation-linked bond markets. The index is
designed to include only those markets in which a global government linker fund is likely and able to invest. The benchmark is calculated on a total return basis and is unhedged.Reporting Currency• Valuations are computed and performance is reported in U.S. Dollars.Fees• Portfolios in the Composite use an all - inclusive fee schedule which includes investment advisory fees, trading expenses, custody fees, and other administrative fees.• Composite Gross of Fee returns are the return on investments reduced by any trading expenses incurred during the period. Composite Net of Fee returns are the Gross of Fee returns
reduced by investment advisory fees (including Performance Based Fees and Carried Interest).Fee Schedule• The annual investment advisory fee, generally payable quarterly, is as follows: 0.25% on the first $50mn; 0.20% on the next $100mn; 0.15% on the next $100mn; 0.12% thereafter. Internal Dispersion• Internal dispersion is calculated using the asset-weighted standard deviation of annual gross returns of those portfolios that were in the composite for the entire year. Internal
dispersion is not calculated if the composite does not contain at least 6 portfolios for the entire year.Annualized Standard Deviation• The three-year annualized standard deviation measures the variability of the composite and the benchmark returns over the preceding 36-month period. The standard deviation is not
required for periods prior to 2011.
49
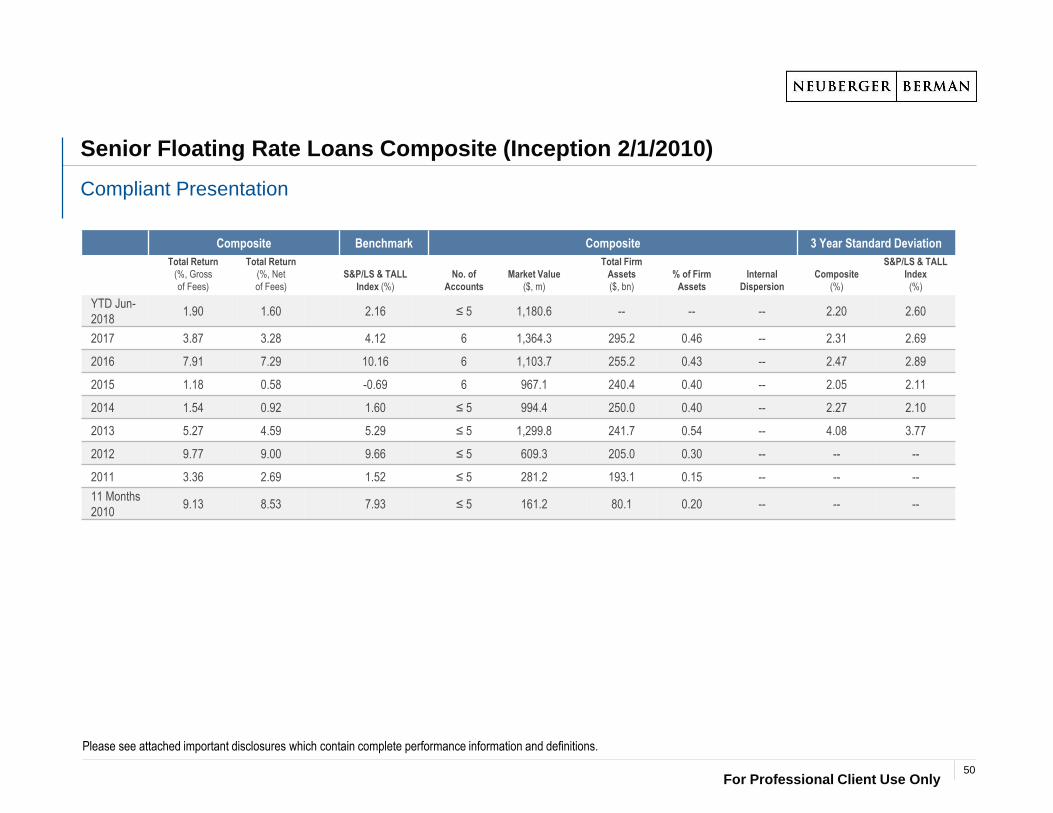
For Professional Client Use Only
Senior Floating Rate Loans Composite (Inception 2/1/2010)
Compliant Presentation
Please see attached important disclosures which contain complete performance information and definitions.
Composite Benchmark Composite 3 Year Standard Deviation
Total Return
(%, Gross
of Fees)
Total Return
(%, Net
of Fees)
S&P/LS & TALL
Index (%)
No. of
Accounts
Market Value
($, m)
Total Firm
Assets
($, bn)
% of Firm
Assets
Internal
Dispersion
Composite
(%)
S&P/LS & TALL
Index
(%)
YTD Jun-
20181.90 1.60 2.16 ≤ 5 1,180.6 -- -- -- 2.20 2.60
2017 3.87 3.28 4.12 6 1,364.3 295.2 0.46 -- 2.31 2.69
2016 7.91 7.29 10.16 6 1,103.7 255.2 0.43 -- 2.47 2.89
2015 1.18 0.58 -0.69 6 967.1 240.4 0.40 -- 2.05 2.11
2014 1.54 0.92 1.60 ≤ 5 994.4 250.0 0.40 -- 2.27 2.10
2013 5.27 4.59 5.29 ≤ 5 1,299.8 241.7 0.54 -- 4.08 3.77
2012 9.77 9.00 9.66 ≤ 5 609.3 205.0 0.30 -- -- --
2011 3.36 2.69 1.52 ≤ 5 281.2 193.1 0.15 -- -- --
11 Months
20109.13 8.53 7.93 ≤ 5 161.2 80.1 0.20 -- -- --
50
For Professional Client Use Only
Senior Floating Rate Loans Composite
Investment Performance Disclosure Statement
Compliance Statement• Neuberger Berman Group LLC ("NB", "Neuberger Berman" or the "Firm") claims compliance with the Global Investment Performance Standards (GIPS®) and has prepared and presented this report in
compliance with the GIPS® standards. Neuberger Berman was independently verified for the period January 1, 2011 to December 31, 2016. The GIPS® firm definition was redefined effective January 1,2011. For prior periods there were two separate firms for GIPS® firm definition purposes and such firms were independently verified for the periods January 1, 1997 to December 31, 2010 and January1, 1996 to December 31, 2010, respectively. Verification assesses whether (1) the firm has complied with all the composite construction requirements of the GIPS® standards on a firm-wide basis and(2) the firm's policies and procedures are designed to calculate and present performance in compliance with the GIPS® standards. The NB Senior Floating Rate Loans composite has been examined forthe periods January 1, 2012 to December 31, 2016. The verification and performance examination reports are available upon request.
Definition of the Firm• The firm is currently defined for GIPS® purposes as Neuberger Berman Group LLC, ("NB", "Neuberger Berman" or the "Firm"), and includes the following subsidiaries: Neuberger Berman Investment
Advisers LLC, Neuberger Berman Europe Ltd., Neuberger Berman Asia Ltd., Neuberger Berman East Asia Ltd., Neuberger Berman Singapore Pte. Ltd., Neuberger Berman Taiwan Ltd, NeubergerBerman Australia Pty. Ltd., Neuberger Berman Trust Company N.A., Neuberger Berman Trust Company of Delaware N.A. and NB Alternatives Advisers LLC.
Policies• Policies for valuing portfolios, calculating performance, and preparing compliant presentations are available upon request.Composite Description• The Senior Floating Rate Loans Composite (the "Composite") includes the performance of all fee-paying Senior Floating Rate Loans portfolios with no investment minimum managed on a fully
discretionary basis by the Non Investment Grade Fixed Income team. The Senior Floating Rate Loans strategy is designed for investors who seek to achieve returns relative to a broad bank loan index. The principal objectives are high current income and capital preservation achieved through the avoidance of credit deterioration, sector rotation and relative value selection. The Composite creation date is June 2011 and performance inception date is February 2010. A complete list of Neuberger Berman's composites is available upon request.
Primary Benchmark Description• The benchmark is the Standard & Poor's / Loan Syndications & Trading Association Leveraged Loan Index. The index measures the performance of the U.S. leveraged loan market based upon real-time
market weightings, spreads and interest payments. Loan Syndications and Trading Association (LSTA)/Loan Pricing Corporation (LPC) mark-to-market pricing is used to price each loan in the index. The benchmark is calculated on a total return basis.Effective September 2013, the Senior Floating Rate Loans composite benchmark changed from the Credit Suisse Leveraged Loan Index to the S&P LSTA Leveraged Loan Index. The benchmark changed to the S&P LSTA Leveraged Loan Index to better reflect the underlying characteristics of the composite strategy.
Reporting Currency• Valuations are computed and performance is reported in U.S. Dollars.Fees• Portfolios in the Composite use an all - inclusive fee schedule which includes investment advisory fees, trading expenses, custody fees, and other administrative fees.• Composite Gross of Fee returns are the return on investments reduced by any trading expenses incurred during the period. Composite Net of Fee returns are the Gross of Fee returns reduced by
investment advisory fees (including Performance Based Fees and Carried Interest).Fee Schedule• The annual investment advisory fee, generally payable quarterly, is as follows: 0.55% on the first $50mn; 0.45% on the next $250mn; 0.35% thereafter. Internal Dispersion• Internal dispersion is calculated using the asset-weighted standard deviation of annual gross returns of those portfolios that were in the composite for the entire year. Internal dispersion is not calculated if
the composite does not contain at least 6 portfolios for the entire year.Annualized Standard Deviation• The three-year annualized standard deviation measures the variability of the composite and the benchmark returns over the preceding 36-month period. The standard deviation is not required for periods
prior to 2011.Additional Notes and Disclosures• Effective January 2012, any portfolio in the Composite with a cash flow over 15% of the beginning market value is removed from the Composite for the month of the cash flow.
51
For Professional Client Use Only
Hypothetical Backtested Performance Disclosures (continued)
The hypothetical performance results included in this material are backtested model portfolios and are shown for illustrative purposes only. Neuberger Berman calculated the hypotheticalresults by running a variety of model portfolios on a backtested basis using the methodology described herein. The results are shown on a supplemental basis and do not represent theperformance of any Neuberger Berman managed account or product and do not reflect the fees and expenses associated with managing a portfolio.
Models Presented:
Model Equity Beta Hedge: Reflects a hypothetical backed tested model portfolio based on the performance of selling LQD ETF anchored in our proprietary monthly credit risk indicator.
Time Periods: January 1, 2007 – January 31, 2017 for Model Credit Beta Hedge.
Hypothetical Backtest Methodology:The simulated portfolios were constructed by selling LQD ETF based on our proprietary monthly credit risk indicator. The indicators used within the strategy were constructed utilizingfundamental market data (money supply within the U.S. economy, the expectation of interest rates in the U.S., survey data focusing on inflation expectations, data showing activitypertaining to central banks and credit spreads). A “risk-off” signal is triggered when a pre-defined threshold for the aforementioned market data gets exceeded on a monthly basis. Whenthe “risk-off” signal is triggered, we would reduce the credit beta in the portfolio. The simulated portfolio assumed a monthly rebalancing. For purposes of clarification, regardless of the datasource used for the hypothetical backtested models, all data is hypothetical backtested data and does not reflect the management of actual accounts.
There may be material differences between the hypothetical back-tested performance results and actual results achieved by actual accounts. Back-tested model performance ishypothetical and does not represent the performance of actual accounts. Hypothetical performance has certain inherent limitations. Unlike actual investment performance, hypotheticalresults do not represent actual trading and accordingly the performance results may have under- or over-compensated for the impact, if any, that certain economic or other market factors,such as lack of liquidity or price fluctuations, might have had on the investment decision-making process or results if assets were actually being managed. Hypothetical performance mayalso not accurately reflect the impact, if any, of other material economic and market factors, or the impact of financial risk and the ability to withstand losses. Hypothetical performanceresults are also subject to the fact that they are generally designed with the benefit of hindsight. As a result, the back-tested models theoretically may be changed from time to time toobtain more favorable performance results. In addition, the results are based, in part, on hypothetical assumptions. Certain of the assumptions have been made for modeling purposesand may not have been realized in the actual management of accounts. No representation or warranty is made as to the reasonableness of the assumptions made or that all assumptionsused in achieving the hypothetical results have been stated or fully considered. Changes in the model assumptions may have a material impact on the hypothetical returnspresented. There are frequently material differences between hypothetical performance results and actual results achieved by any investment strategy. Neuberger Berman did not manageany accounts in this manner reflected in the models during the backtested time periods shown.
Unless otherwise indicated, results shown reflect reinvestment of any dividends and distributions. Unless otherwise indicated, the hypothetical performance figures are shown gross of fees,which do not reflect the deduction of investment advisory fees, transaction costs and other expenses. If such fees and expense were reflected, returns referenced would belower. Advisory fees are described in Part 2 of Neuberger Berman’s Form ADV. A client's return will be reduced by the advisory fees and any other expenses it may incur in themanagement of its account. The deduction of fees has a compounding effect on performance results. For example, assume Neuberger Berman achieves a 10% annual return prior to thededuction of fees each year for a period of ten years. If a fee of 1% of assets under management were charged and deducted from the returns, the resulting compounded annual returnwould be reduced to 8.91%. Please note that there is no comparable reduction from the indices for the fees.
Model Credit Beta Hedge
52
For Professional Client Use Only
Hypothetical Backtested Performance Disclosures (continued)
The hypothetical performance results included in this material are backtested model portfolios and are shown for illustrative purposes only. Neuberger Berman calculated the hypotheticalresults by running a variety of model portfolios on a backtested basis using the methodology described herein. The results are shown on a supplemental basis and do not represent theperformance of any Neuberger Berman managed account or product and do not reflect the fees and expenses associated with managing a portfolio.
Models Presented:
Model Equity Beta Hedge: Reflects a hypothetical backed tested model based on performance of our proprietary daily equity risk indicator
Time Periods: January 1, 2007 – January 31, 2017 for Model Equity Beta Hedge.
Hypothetical Backtest Methodology:The simulated portfolios were constructed by shorting S&P 500 futures based on our proprietary daily equity risk indicator. The indicator is constructed by combining market data metrics(macroeconomic surprises, earnings and balance sheet valuations, trend and other technical indicators and fund flow data) and a “risk-off” signal that is triggered when the definedthreshold for the combination of the above described market data is exceeded. When the “risk-off” signal is triggered, we would sell S&P 500 futures contracts on the equity indices. Thesimulated portfolio assumed a daily rebalancing. For purposes of clarification, regardless of the data source used for the hypothetical backtested models, all data is hypothetical backtesteddata and does not reflect the management of actual accounts.
There may be material differences between the hypothetical back-tested performance results and actual results achieved by actual accounts. Back-tested model performance ishypothetical and does not represent the performance of actual accounts. Hypothetical performance has certain inherent limitations. Unlike actual investment performance, hypotheticalresults do not represent actual trading and accordingly the performance results may have under- or over-compensated for the impact, if any, that certain economic or other market factors,such as lack of liquidity or price fluctuations, might have had on the investment decision-making process or results if assets were actually being managed. Hypothetical performance mayalso not accurately reflect the impact, if any, of other material economic and market factors, or the impact of financial risk and the ability to withstand losses. Hypothetical performanceresults are also subject to the fact that they are generally designed with the benefit of hindsight. As a result, the back-tested models theoretically may be changed from time to time toobtain more favorable performance results. In addition, the results are based, in part, on hypothetical assumptions. Certain of the assumptions have been made for modeling purposesand may not have been realized in the actual management of accounts. No representation or warranty is made as to the reasonableness of the assumptions made or that all assumptionsused in achieving the hypothetical results have been stated or fully considered. Changes in the model assumptions may have a material impact on the hypothetical returnspresented. There are frequently material differences between hypothetical performance results and actual results achieved by any investment strategy. Neuberger Berman did not manageany accounts in this manner reflected in the models during the backtested time periods shown.
Unless otherwise indicated, results shown reflect reinvestment of any dividends and distributions. Unless otherwise indicated, the hypothetical performance figures are shown gross of fees,which do not reflect the deduction of investment advisory fees, transaction costs and other expenses. If such fees and expense were reflected, returns referenced would belower. Advisory fees are described in Part 2 of Neuberger Berman’s Form ADV. A client's return will be reduced by the advisory fees and any other expenses it may incur in themanagement of its account. The deduction of fees has a compounding effect on performance results. For example, assume Neuberger Berman achieves a 10% annual return prior to thededuction of fees each year for a period of ten years. If a fee of 1% of assets under management were charged and deducted from the returns, the resulting compounded annual returnwould be reduced to 8.91%. Please note that there is no comparable reduction from the indices for the fees.
Model Equity Beta Hedge
53
For Professional Client Use Only
Additional Disclosures
Institutional-Oriented Equity and Fixed Income AUM Benchmark Outperformance Note: Institutional-oriented equity and fixed income assets under management (“AUM”) includes the
firm’s equity and fixed income institutional separate account (“ISA”), registered fund, and managed account/wrap (“MAG”) offerings and are based on the overall performance of each
individual investment offering against its respective benchmark offerings and are based on the overall performance of each individual investment offering against its respective benchmark.
High net worth/private asset management (“HNW”) AUM is excluded. For the period ending September 30, 2017, the percentage of total institutional-oriented equity AUM outperforming
the benchmark was as follows: 10-year: 87%; 5-year: 63%; and 3-year: 53% ; and total institutional-oriented fixed income AUM outperforming was as follows: 10-year:78%; 5-year:58%;
and 3-year:63%. If HNW AUM were included, total equity AUM outperforming the benchmark was as follows: 10-year: 64%; 5-year: 44%; and 3-year: 38%; and total fixed income AUM
outperforming was as follows: 10-year: 78%; 5-year: 58%; and 3-year: 63%. Equity and Fixed Income AUM outperformance results are asset weighted so individual offerings with the
largest amount of assets under management have the largest impact on the results. As of 9/30/2017, six institutional-oriented equity offerings accounted for approximately 54% of the total
firm institutional-oriented equity AUM reflected, and eight institutional-oriented fixed income offerings accounted for approximately 50% of the total firm institutional-oriented fixed income
AUM reflected. Performance for the individual offerings reflected are available upon request. AUM for multi-asset class, balanced and alternative (including long-short equity or fixed
income) offerings, as well as AUM for hedge fund, private equity and other private investment vehicle offerings are not reflected in the AUM outperformance results shown. AUM
outperformance is based on gross of fee returns. Gross of fee returns do not reflect the deduction of investment advisory fees and other expenses. If such fees and expenses were
reflected, AUM outperformance results would be lower. Investing entails risk, including possible loss of principal. Past performance is no guarantee of future results.
Private Equity Outperformance Note: The performance information includes all funds, both commingled and custom, managed by NB Alternatives Advisers LLC with vintage years of 2002
– 2014, with the exception of a closed-end, public investment company registered under the laws of Guernsey (the “Funds”). Vintage years post 2015 are excluded as benchmark
information is not yet available. Percentages are based on the number of funds, calculated as the total number of funds whose performance exceeds the MSCI World Index + 300 bps
divided by the total number of all funds with vintage years of 2002 through 2014.
The public indices are unmanaged and are not subject to fees and expenses typically associated with investment funds. Investments cannot be made directly in a broad-based securities
index. The risk/return profile of the MSCI World Index is materially different from those of the Funds and an investment in the Funds is not comparable to an investment in the securities
that comprise the MSCI World Index. Investors should be aware that private equity funds may incur losses both when the major indices are rising and when they are falling.
Private Offerings: Certain strategies referenced herein may only be available through a private offering of interests made pursuant to offering and subscription documents, which will be
furnished solely to qualified investors on a confidential basis at their request for their consideration in connection with an offering. These documents will contain information about the
investment objective, terms and conditions of an investment in such vehicle and will also contain tax information and risk disclosures that are important to an investment decision. Any
decision to invest in such vehicle should be made after a careful review of these documents, the conduct of such investigations as an investor deems necessary or appropriate and after
consultation with legal, accounting, tax and other advisors in order to make an independent determination of the suitability and consequences of an investment in such vehicle.
Selection Criteria for Case Studies Referenced in This Presentation: The case studies included in this material were selected because they are among the firm's largest or longest-standing
strategic partnerships, multi-asset class mandates strategies or client types that are reflective of the firm’s broad-based or customized capabilities. The case studies include mandates
with multiple investment strategies and vehicles that are managed by the various affiliated investment advisers that are subsidiaries of Neuberger Berman Group LLC. Case studies were
not selected based on performance and may reflect highly customized mandates with client-specific objectives, guidelines and restrictions. It is not known whether any clients for the
mandates shown approve or disapprove of any Neuberger Berman adviser, strategy or vehicle.
54
For Professional Client Use Only
Disclaimer
This document is addressed to professional clients only.This document is a financial promotion and is issued by Neuberger Berman Europe Limited, which is authorised and regulated by the Financial Conduct Authority and is registered in England and Wales, at Lansdowne House, 57 Berkeley Square, London, W1J 6ER and is also a Registered Investment Adviser with the Securities and Exchange Commission in the U.S. and regulated by the Dubai Financial Services Authority.This fund is a sub-fund of Neuberger Berman Investment Funds PLC, authorised by the Central Bank of Ireland pursuant to the European Communities (Undertaking for Collective Investment in Transferable Securities) Regulations 2011, as amended. The information in this document does not constitute investment advice or an investment recommendation and is only a brief summary of certain key aspects of the fund. Investors should read the prospectus and the key investor information document (KIID) which are available on our website: http://www.nb.com/_layouts/www/legal-documents.aspx. Investment objectives, risk information, fees and expenses and other important information about the fund can be found in the prospectus.
Notice to investors in Switzerland: Neuberger Berman Investment Funds plc is established in Ireland as an investment company with variable capital incorporated with limited liability under Irish law, and the sub-funds are also authorised by the Swiss Financial Market Supervisory Authority FINMA for distribution to non-qualified investors in and from Switzerland. The Swiss representative and paying agent is BNP Paribas Securities Services, Paris, succursale de Zurich, Selnaustrasse 16, 8002 Zürich, Switzerland. The prospectus, the key investor information documents, the memorandum and articles of association and the annual and semi-annual reports are all available free of charge from the representative in Switzerland.This document is presented solely for information purposes and nothing herein constitutes investment, legal, accounting or tax advice, or a recommendation to buy, sell or hold a security.We do not represent that this information, including any third party information, is accurate or complete and it should not be relied upon as such.No recommendation or advice is being given as to whether any investment or strategy is suitable for a particular investor. Each recipient of this document should make such investigations as it deems necessary to arrive at an independent evaluation of any investment, and should consult its own legal counsel and financial, actuarial, accounting, regulatory and tax advisers to evaluate any such investment.It should not be assumed that any investments in securities, companies, sectors or markets identified and described were or will be profitable.Any views or opinions expressed may not reflect those of the firm as a whole.All information is current as of the date of this material and is subject to change without notice.The fund described in this document may only be offered for sale or sold in jurisdictions in which or to persons to which such an offer or sale is permitted. The fund can only be promoted if such promotion is made in compliance with the applicable jurisdictional rules and regulations. This document and the information contained therein may not be distributed in the US.Indices are unmanaged and not available for direct investment.An investment in the fund involves risks, with the potential for above average risk, and is only suitable for people who are in a position to take such risks. For more information please read the prospectus which can be found on our website at: http://www.nb.com/_layouts/www/legal-documents.aspx. Past performance is not a reliable indicator of current or future results. The value of investments may go down as well as up and investors may not get back any of the amount invested. The performance data does not take account of the commissions and costs incurred on the issue and redemption of units.The value of investments designated in another currency may rise and fall due to exchange rate fluctuations in respect of the relevant currencies. Adverse movements in currency exchange rates can result in a decrease in return and a loss of capital.Tax treatment depends on the individual circumstances of each investor and may be subject to change, investors are therefore recommended to seek independent tax advice.Investment in the fund should not constitute a substantial proportion of an investor’s portfolio and may not be appropriate for all investors. Diversification and asset class allocation do not guarantee profit or protect against loss.No part of this document may be reproduced in any manner without prior written permission of Neuberger Berman Europe Limited.The “Neuberger Berman” name and logo are registered service marks of Neuberger Berman Group LLC.
© 2018 Neuberger Berman Group LLC. All rights reserved.171316
55