Embed Size (px)
Citation preview

JANUARY 2018
Network Options Assessment2017/18
UK electricity transmission

HomeThis will take you to the contents page. You can click on the titles to navigate to a section.
ArrowsClick on the arrows to move backwards or forwards a page.
A to ZYou will find a link to the glossary on each page.
HyperlinksHyperlinks are highlighted in bold throughout the report. You can click on them to access further information.
How to use this interactive document To help you find the information you need quickly and easily we have published NOA as an interactive document.
Network Options Assessment 2017/18 – January 2018 01

For the past couple of years our Future Energy Scenarios (FES) publication has highlighted how we are in the midst of an energy revolution. Our Network Options Assessment (NOA) publication, along with our other System Operator (SO) publications, aims to help our industry ensure a secure, sustainable and affordable energy future.
We publish the NOA as part of our SO role. The NOA describes the major projects considered to meet the future needs in GB’s electricity transmission system as outlined in the Electricity Ten Year Statement (ETYS) 2017, and recommends which investments in the year ahead would best manage the capability of the GB transmission networks against the uncertainty of the future.
To be transparent in our processes and to ensure that the SO is impartial throughout, we follow the NOA methodology, approved by Ofgem earlier in the year. This methodology sets out how we base our recommendations on the data and analysis of the 2017 FES and ETYS.
The news about SO separation from the National Grid Transmission Owner was announced earlier in the year. I do not foresee that this results in significant change to the NOA itself although the changing roles and responsibilities of different parties will be reflected in future methodologies. We are also planning how NOA can continue to evolve over the coming years to maximise consumer benefit.
Investment decisionThe SO considered the investment options proposed by the Transmission Owners. A couple of the highlights are:• Recommendation for investment
of £21.6m in 2018/19 across 22 projects to potentially deliver projects worth almost £3.2bn.
• Analysis suggests a total interconnection capacity of 17.4 GW between GB and European markets by 2030 would provide optimal benefit.
The NOA represents a balance between asset investment and network management to achieve the best use of bill payers’ money. How the future energy landscape could look is uncertain, and the SO’s recommendations are there to help make sure the GB transmission network is fit for the future. In producing this year’s NOA we have listened to and acted on your feedback. We welcome your views on the changes we have made and in helping further shape the publication to meet your needs.
Julian LeslieHead of Network Capability, Electricity
Network Options Assessment 2017/18 – January 2018 02

Chapter four
Proposed options ...................................................624.1 Introduction .................................................634.2 Reinforcement options – Scotland and the North of England region ...........................644.3 Reinforcement options – the South and East of England region ......................724.4 Reinforcement options – Wales and West Midlands region ...........76
Chapter five
Chapter six
Chapter seven
Investment recommendations .............................785.1 Introduction .................................................795.2 Interpretation of the NOA outcomes .....815.3 NOA outcomes............................................835.4 Recommendation for each option .........95
Interconnection analysis .....................................1026.1 Introduction ...............................................1036.2 Interconnection theory ...........................1056.3 Current and potential
interconnection ........................................1066.4 Methodology .............................................1076.5 Outcome .................................................... 1116.6 Summary ....................................................121
Stakeholder engagement ....................................1227.1 Introduction ...............................................1237.2 Continuous development .......................1247.3 Stakeholder engagement ......................125
Appendix A – Economic analysis results .........127Appendix B – SWW Projects ...............................1338.1 Shetland Link ............................................1338.2 Orkney Link ...............................................1358.3 Western Isles Link ....................................1378.4 Eastern Network Reinforcement .........1398.5 South East Network Reinforcement ....143Appendix C – List of four-letter codes ..............145Appendix D – Meet the NOA team .....................148Appendix E – Glossary .........................................149Disclaimer ..............................................................153
Chapter eight
Aim of the report .....................................................101.1 Introduction ................................................111.2 How the NOA fits in with the FES
and ETYS .....................................................121.3 What NOA can do .......................................131.4 What NOA cannot do .................................141.5 The NOA report methodology .................151.6 Navigating through the document .........161.7 What’s new? ................................................171.8 Stakeholder engagement
and feedback ..............................................19
Chapter one
Methodology ............................................................202.1 Introduction .................................................212.2 NOA process ...............................................222.3 Economic analysis .....................................252.4 The NOA Committee .................................322.5 How the NOA connects to
the SWW process .......................................332.6 Interaction between the NOA
results and the FES ....................................352.7 Other options .............................................36
Chapter two
Boundary descriptions ..........................................383.1 Introduction .................................................393.2 Scotland and the North of England region ...........................403.3 The South and East of England region ..523.4 Wales and West Midlands region ...........59
Chapter three
Contents
Network Options Assessment 2017/18 – January 2018 03

Executive summary
Using the 2017 FES, ETYS 2017 and following the methodology approved by Ofgem, the System Operator (SO) recommends the options which the GB Transmission Owners (TOs) should invest in for the upcoming year. Below, we present a summary of the key points of the NOA 2017/18.
Key points
• The SO recommends investment of £21.6m in 2018/19 across 22 projects to maintain the option to deliver projects worth almost £3.2bn. This year’s investment will allow us to manage the future capability of the GB transmission networks against the uncertainty of the future. This will make sure that the networks can continue supporting the transition to the future energy landscape in an efficient, economical and coordinated way.
• As the energy landscape is uncertain, the SO must make sure that any network investment is truly necessary. Our reviewed methodology was approved by Ofgem and included improvements to minimise the potential for ‘false-positive’ recommendations. The first improvement was the introduction of implied scenario probabilities. Implied probabilities calculate how probable we need to believe a scenario is in order to make the same decision under a conventional decision-making process. The second was the inception of a NOA Committee. This Committee, comprised of SO representatives, provides scrutiny of the results in a transparent and rigorous way.
• The NOA is about getting the right decision, balancing potential constraint costs against investment costs for an uncertain future. The NOA Committee identified two reduced-build options that could create significant consumer value. As the SO, we requested the TOs bring forward more reduced-build options in the future.
• We performed analysis of 76 different reinforcement options in this NOA. Twenty-one options are given either a Stop or Do not start recommendation as they are not optimal at this time. We also recommend 31 optimal options to be put on Hold where investment decisions could be made when there is greater certainty in the future. This ensures that a recommendation for an investment is made at the most efficient time. Where the recommendation cannot be delayed any further, our economic analysis assesses the cost impact of not investing in this financial year. Based on this analysis the SO recommends deferring the spend of £8.6m on four options in 2018/19. Table 0.1 is an overview of the investment recommendations where the decision must be made this year.
Network Options Assessment 2017/18 – January 2018 04
• This year the recommended investment spend is lower, primarily due to two factors. Since the publication of the NOA 2016/17 the Hinkley–Seabank project has progressed to a position and is now included in the baseline. Secondly, the South Coast reactive compensation scheme (due to commission in 2018) has progressed to the final delivery stage where most of the capital cost has already been incurred before this year’s analysis.
• All Eastern Links (2 GW HVDC links and the Torness to north east England AC reinforcement) have had their earliest in service dates delayed by two to four years for this year’s analysis. This has delayed several reinforcements because they only provide benefit once the links are in service. Due to
the delay in the earliest in service dates of the Eastern Links combined with higher north–south flows, we identified the opportunity of implementing an operational measure to deliver up to £600m of consumer benefit. In parallel, we’ve requested the TOs investigate the feasibility of accelerating the delivery of the Eastern Link options. We will therefore look to pursue these options in more detail next year.
• This year’s interconnection analysis suggests that a total interconnection capacity of 17.4 GW between GB and European markets by 2030 would provide optimal consumer benefit. Many other factors outside the scope of this analysis will influence the outcome for GB interconnection over the next decade and beyond.
Executive summary
It is important to recognise that these recommendations represent the best view at a snap-shot in time. Investment decisions taken by any business should always consider these recommendations in the light of subsequent events and developments in the energy sector. The project options we have recommended in this NOA will make sure that the GB transmission network can continue supporting the transition to the future energy landscape in an efficient, economical and coordinated way.
This year the NOA identifies which options we recommend to proceed are likely to meet Ofgem’s criteria for onshore competition. The competition assessment for SWW is in accordance with the Ofgem agreed methodology and the outcomes are described in Chapter 5.
Network Options Assessment 2017/18 – January 2018 05

Option
EIS
D1
Two
Deg
rees
Co
nsum
er P
ower
Slo
w P
rog
ress
ion
Ste
ady
Sta
te
Loca
l C
ont
ract
ed A
Loca
l C
ont
ract
ed B
No
Loca
l C
ont
ract
ed A
No
Loca
l C
ont
ract
ed B
NO
A 2
016/
17
Rec
om
men
dat
ion
NO
A 2
017/
18R
eco
mm
end
atio
n
Rea
sons
fo
r C
hang
e
E4DCEastern subsea HVDC Link from Peterhead to Hawthorn Pit (Potential SWW)
2028 2028 2028 2028 2028 N/A N/A N/A N/A Proceed Proceed No change
ECU2East Coast onshore 275kV upgrade (Potential SWW)
2023 2023 2023 2023 2023 N/A N/A N/A N/A Delay ProceedGeneration background changes
ECUPEast Coast onshore 400kV incremental reinforcement (Potential SWW)
2026 2026 2026 2026 2026 N/A N/A N/A N/A Delay ProceedGeneration background changes
DWNODenny to Wishaw 400kV reinforcement
2028 2028 2028 2028 2030 N/A N/A N/A N/A No decision required Proceed
Generation background changes
HNNOHunterston East–Neilston 400kV reinforcement
2023 2023 2023 2023 2023 N/A N/A N/A N/A N/A Proceed New reinforcement
E2DCEastern subsea HVDC Link from Torness to Hawthorn Pit (Potential SWW)
2027 2027 2027 2027 N/A N/A N/A N/A N/A Proceed Proceed No change
TLNOTorness to north east England AC reinforcement
2030 N/A N/A N/A N/A N/A N/A N/A N/A Proceed Hold for SWW The EISD is delayed2
HAEUHarker SGT6 replacement 2021 2029 2021 2021 2021 N/A N/A N/A N/A Do not
proceed ProceedGeneration background changes
WHTI3Turn-in of West Boldon to Hartlepool circuit at Hawthorn Pit
2021 2021 N/A 2021 N/A N/A N/A N/A N/A Proceed Proceed No change
NOR1Reconductor 13.75km of Norton to Osbaldwick 400kV double circuit
2021 2021 2021 2021 2023 N/A N/A N/A N/A Proceed Proceed No change
CPREReconductor sections of Penwortham to Padiham and Penwortham to Carrington
2021 2021 N/A N/A N/A N/A N/A N/A N/A No decision required Proceed
Generation background changes
MRUPUprate the Penwortham to Washway Farm to Kirkby 275kV double circuit to 400kV
2023 N/A N/A N/A N/A N/A N/A N/A N/A Proceed Proceed No change2
Table 0.1 Summary of investment recommendations (the options are in order from north to south)
Network Options Assessment 2017/18 – January 2018 06
1 Earliest In Service Date – the earliest year that a project can be delivered.2 For more information please refer to Chapter 5 – Investment recommendations.3 We assessed the same reinforcement for one year’s later delivery (denoted WHT2). It is optimal under the Consumer Power and Steady State scenarios.
Executive summary
Option
EIS
D
Two
Deg
rees
Co
nsum
er P
ower
Slo
w P
rog
ress
ion
Ste
ady
Sta
te
Loca
l C
ont
ract
ed A
Loca
l C
ont
ract
ed B
No
Loca
l C
ont
ract
ed A
No
Loca
l C
ont
ract
ed B
NO
A 2
016/
17
Rec
om
men
dat
ion
NO
A 2
017/
18R
eco
mm
end
atio
n
Rea
sons
fo
r C
hang
e
LDQBLister Drive quad booster 2020 N/A N/A 2021 N/A N/A N/A N/A N/A Proceed Proceed No change4
OENOCentral Yorkshire reinforcement
2026 2027 2027 2027 N/A N/A N/A N/A N/A Proceed Hold
Depends on Eastern links to provide capability and hence optimal timing.
TDH1Drax to Thornton 2 circuit thermal uprating
2019 2019 2020 2019 N/A N/A N/A N/A N/A N/A ProceedGeneration background changes
BMMS3X225MVAr MSC at Burwell Main
2023 2023 2023 2023 2023 2023 2023 2023 2023 Proceed Proceed No change
BTNOBramford to Twinstead OHL
2025 2027 2029 2030 N/A 2025 2028 2027 2027 No decision required Delay Critical in one
sensitivity4
WYTIWymondley turn-in 2021 2021 2021 2021 2023 2021 2021 2021 2021 Delay Proceed Interconnector
flows changes
ESC1New Second Elstree to St John’s Wood 400kV cable circuit
2022 2022 2025 2025 2032 2022 2022 2022 2022 N/A Delay New reinforcement
TKRETilbury to Grain and Tilbury to Kingsnorth upgrade
2025 2025 2025 2025 2027 2025 2025 2025 2025 N/A Proceed Interconnector flows changes
KLREKemsley–Littlebrook circuits reconductoring
2020 2020 2020 2020 2020 2020 2020 2020 2020 Proceed Proceed No change
FLR2Fleet–Lovedean reconductoring
2020 2020 2020 2020 2023 2020 2020 2020 2020 Proceed Proceed No change
SCN2New Transmission Route between south London and the South East Coast Indicative Option 2 (Potential SWW)
2027 N/A N/A 2027 2027 2027 2027 N/A N/A Do not proceed Proceed Interconnector flows changes
SCRCSouth East Coast reactive compensation
2018 2018 2018 2018 2018 2018 2018 2018 2018 Proceed Proceed No change
SEEUReactive Compensation Auto-Switching Scheme
2021 2021 2021 2021 2022 2021 2021 2022 2022 Proceed Proceed No change
BNRCBolney and Ninfield additional reactive compensation
2022 2022 N/A 2023 N/A 2022 2022 2022 2022 No decision required Proceed
Required for importing interconnector flows
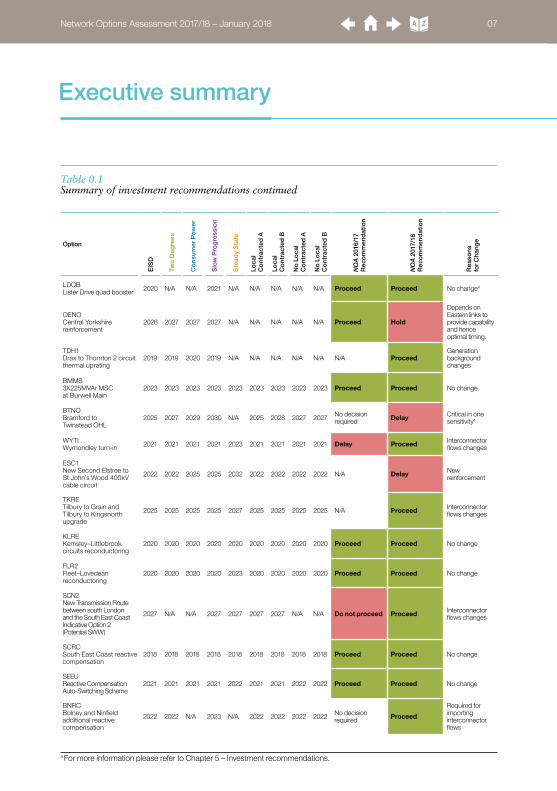
Table 0.1 Summary of investment recommendations continued
Network Options Assessment 2017/18 – January 2018 07
4 For more information please refer to Chapter 5 – Investment recommendations.

We welcome your viewsWe want to continue to develop the NOA and we welcome your views on how to improve it. Chapter 7 – Stakeholder engagement describes how you can contact us with your views.
Future energy publicationsNational Grid has an important role to play in leading the energy debate across our industry and working with you to make sure that together we secure our shared energy future. As System Operator (SO), we are perfectly placed as an enabler, informer and facilitator. The SO publications that we produce every year are intended to be a catalyst for debate, decision making and change.
The starting point for our flagship publications is the Future Energy Scenarios (FES). The FES
is published every year and involves input from stakeholders from across the energy industry.These scenarios are based on the energy trilemma (security of supply, sustainability and affordability) and provide supply and demand projections out to 2050. We use these scenarios to inform the energy industry about network analysis and the investment being planned, which will benefit our customers.
We build our long-term view of the electricity transmission capability and operability in our Future Energy Scenarios (FES), Electricity Ten Year Statement (ETYS), Network Options Assessment (NOA), and electricity System Operability Framework (SOF) publications. To help shape these publications, we seek your views and share information across the energy industry that can inform debate.
Network Options Assessment 2017/18 – January 2018 08
Network Options Assessment 2017/18 – January 2018 09

C
hapter oneNetwork Options Assessment 2017/18 – January 2018 10
Chapter oneAim of the report 11
Network Options Assessment 2017/18 – January 2018 10

C
hapt
er o
neNetwork Options Assessment 2017/18 – January 2018 11
Aim of the report
The NOA 2017/18 is the third assessment to be published. It’s produced for you, our stakeholders, and we’ll use your feedback to develop it further.
The NOA is the vehicle for developing an efficient, coordinated and economic system of electricity transmission, consistent with the National Electricity Transmission System (NETS) Security and Quality of Supply Standard (SQSS). Its purpose is to assess a range of options to make recommendations to the Transmission Owners (TOs) across Great Britain (GB) as to which major NETS reinforcement projects to proceed with to meet the future network requirements, as defined in the Electricity Ten Year Statement (ETYS). It also identifies which projects meet the criteria for onshore competition, providing relevant information to stakeholders.
This report is one of the publications underpinned by the data in our Future Energy Scenarios (FES). This means that the NOA and the ETYS have a consistent base for assessing the potential development of the electricity transmission networks. When read together, the ETYS and the NOA give a full picture of requirements and potential options for the NETS.
The NOA 2017/18 was published in January 2018 and is based on the FES 2017.
Chapter 6 is our interconnection assessment. The analysis is undertaken to inform the industry of the potential benefits of future interconnection, with the goal of providing a market signal to facilitate the development of efficient interconnector capacity with the GB market.
For this year’s analysis we have undertaken further improvements to the methodology, which were approved by Ofgem. We have included locational impacts on the GB transmission network in addition to the welfare and capital cost implications considered last year. We have also used the output from this year’s NOA as the baseline network reinforcement assumptions for the NOA for Interconnectors (NOA IC) analysis: this provides greater consistency between the NOA and NOA IC analysis which we believe will be of added value to our stakeholders.
This chapter introduces the Network Options Assessment (NOA), and explains how it works alongside the other publications that National Grid produces as the System Operator (SO).
1.1 Introduction

C
hapter oneNetwork Options Assessment 2017/18 – January 2018 12
The SO produces a suite of publications on the future of energy for Great Britain (see page 8). These publications aim to inform the whole energy debate by addressing specific issues in each document. The FES, ETYS and NOA can be read together to form an evolutionary and consistent voice in the development of GB’s electricity network.
We use the FES to assess the network requirements for power flows across the GB NETS. These requirements were published in the ETYS in November 2017, and the TOs responded with options for reinforcing the network. Our economic analysis of these options then forms the foundation for the NOA publication. Further explanation of this process and each of the publications can be found in Chapter 2 – Methodology.
In the NOA we summarise reinforcement options and our economic analysis of those options by regions. The criterion by which a region is defined is that an option may not appear in more than one region (this is to prevent an option being evaluated more than once, with the risk of two different answers). Based on the economic analysis, the report also identifies our recommended option or options for each of the regions. For some options we have included a summary of the Strategic Wider Works (SWW) analysis in this document.
It is important to note that while we recommend options to meet system needs, the TOs or other relevant parties will ultimately decide on what, where and when to invest.
Some of the alternative options we have evaluated are reduced-build options as explained in Chapter 4 – Proposed options. The NOA emphasises the need to reinforce the network, and we are keen to embrace innovative ways to do so.
1.2 How the NOA fits in with the FES and the ETYS
Future Energy ScenariosJuly 2017
Electricity Ten Year StatementNovember 2017
Network Options AssessmentJanuary 2018
C
hapt
er o
neNetwork Options Assessment 2017/18 – January 2018 13
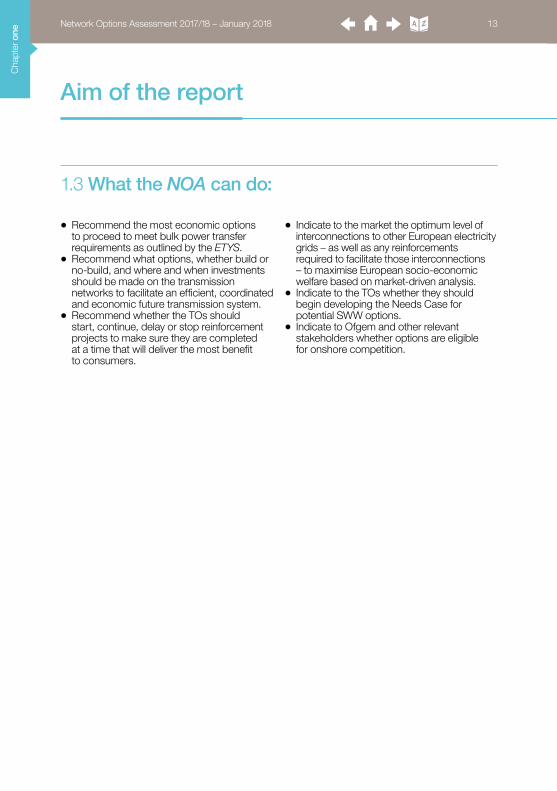
• Recommend the most economic options to proceed to meet bulk power transfer requirements as outlined by the ETYS.
• Recommend what options, whether build or no-build, and where and when investments should be made on the transmission networks to facilitate an efficient, coordinated and economic future transmission system.
• Recommend whether the TOs should start, continue, delay or stop reinforcement projects to make sure they are completed at a time that will deliver the most benefit to consumers.
• Indicate to the market the optimum level of interconnections to other European electricity grids – as well as any reinforcements required to facilitate those interconnections – to maximise European socio-economic welfare based on market-driven analysis.
• Indicate to the TOs whether they should begin developing the Needs Case for potential SWW options.
• Indicate to Ofgem and other relevant stakeholders whether options are eligible for onshore competition.
1.3 What the NOA can do:
Aim of the report
C
hapter oneNetwork Options Assessment 2017/18 – January 2018 14
• Insist that options be pursued. We can only recommend options based on our analysis. The TOs or other relevant parties are ultimately responsible for what, when and where they invest.
• Make recommendations for system needs other than bulk power transfer at present, e.g. local voltage issues.
• Comment on the specific details on any specific option, such as how it could be planned or delivered. It is the TOs or other relevant parties who decide how they implement their options.
• Evaluate the specific designs of any option, such as the choice of equipment, route or environmental impacts. These types of decisions can only be made by the TOs or other relevant parties when the options are in a more advanced stage.
• Assess network asset replacement projects which do not provide network capability uplifts or individual customer connections.
• List all of the options that the TOs develop as, for instance, some reach only a low level of maturity and are discarded early. It is for the TOs to develop options and consult with stakeholders on variations on options.
• Evaluate the operability challenges of possible interconnectors. It can only evaluate the socio-economic welfare that a completed interconnector would provide.
• Forecast or recommend future interconnection levels. It indicates the optimum level of interconnection.
1.4 What the NOA cannot do:
With the introduction of new technologies and business models, the electricity industry is experiencing significant change with the opportunity to deliver great value, for consumers and society. As the SO we have a key role in facilitating the transition to a more decentralised, low carbon electricity industry model. One area we are developing is our approach to assessing network capability and operability needs as well as the options to meet them, of which the NOA is a key part.
We will be publishing a roadmap this spring which will set out where we want to get to with the developments in the long term and the steps that are likely to be needed to get there. As a starting point we are expanding the NOA approach to consider more local or regional challenges, such as local
voltage issues. We are also opening it up to invite a wider range of participants who can compete to meet the transmission system needs at least cost. This includes Distribution Network Operators (DNOs), market participants such as storage providers, the SO and TOs. This is expected to result in more cost-effective options in the long term. This could be through using market based or distribution network solutions to reduce constraint costs while larger network assets are built or could be the cost effective solution to delay to avoid large asset investment. We are running several trials to develop the processes and capability we need to involve new parties in the NOA and incorporate local voltage challenges. We’ll be working closely with our stakeholders on the developments and will publish the results through the year as they become available.

C
hapt
er o
neNetwork Options Assessment 2017/18 – January 2018 15
Aim of the report
The NOA report methodology sets out how the NOA process should work, and establishes the finer detail. We started the NOA report methodology in early 2017, working with the onshore TOs and Ofgem. The initial draft of the methodology for the NOA 2017/18 was published for consultation in May 2017.
After more discussions and refinement the methodology was submitted to Ofgem in July 2017, and subsequently published on our website. The methodology was approved by Ofgem in September 2017.
We describe the methodology further in Chapter 2 – Methodology.
1.5 The NOA report methodology

C
hapter oneNetwork Options Assessment 2017/18 – January 2018 16
1.6 Navigating through the document
We have structured the NOA document in a logical manner to help you understand how we have reached our recommendations and conclusions.
1 Some options are not in our NOA process analysis but are described in Chapter 4 – Proposed Options. Chapter 2 – Methodology covers why these other options are kept separate from our analysis.
Methodology page 20Chapter 2 describes the NOA process and the economic theory behind it. This is a good overview if you are unfamiliar with the NOA, or if you’d like to understand more about how we perform the economic analysis of options.
Boundary descriptions page 38Chapter 3 describes how we divide the GB network into boundaries and regions for analysis, and gives a description of each boundary, as well as an overview of the types of generation you can find within each boundary. This is a good introduction if you’d like to improve your understanding of the GB network.
Proposed options page 62Chapter 4 introduces and describes the reinforcement options that can increase the NETS capability. This is a good description of the types of options being proposed by the TOs.1
Investment recommendations page 78Chapter 5 presents our investment recommendations for 2018/19. This is an important chapter if you are interested in whether we recommend options to be proceeded for this investment year. It also summarises the eligibility assessment for competition in onshore electricity transmission.
Interconnection analysis page 102 Chapter 6 presents our interconnection analysis results. We describe the optimum levels of interconnection between GB and European markets, and explain the economic theory behind the benefit of interconnectors to the consumer. This is an important chapter if you are interested in the future of European interconnection.
Stakeholder engagement page 122Chapter 7 discusses how we can work with you to improve the NOA in future publications. This is a useful chapter if you’d like to give us your feedback and opinion.
Chapter two Chapter five
Chapter three
Chapter six
Chapter four
Chapter seven
C
hapt
er o
neNetwork Options Assessment 2017/18 – January 2018 17
Aim of the report
1.7 What’s new?
1.7.1 Implied probability
1.7.2 Changes to the NOA governance structure
1.7.3 Changes to the NOA recommendation terminologies and definitions
It has been highlighted in the NOA methodology review in March 2017 that the current single year least regret analysis approach could potentially lead to ‘false-positive’ investment recommendations, especially when options are determined by a single scenario or driver. To further improve the robustness of the decision-making process,
we have introduced ‘implied probabilities’ to provide additional insights to the single year least regret analysis results. This additional step at the end of our economic analysis will further assure our NOA recommendations are well justified and reduce the risk of them being ‘false-positive’.
We’ve created a NOA Committee to review our NOA recommendations to provide an additional level of scrutiny to the results that are considered to be marginal. This includes those that are driven by a single scenario or driver, or are considered to be sensitive. The NOA Committee considers information
such as implied probabilities and other additional evidence, together with insights of the holistic needs of the system to ensure that the NOA recommendations are robust and credible. For more information about the NOA Committee, please refer to Chapter 2 – Methodology.
We’ve reviewed the terminologies and definitions for our NOA recommendations. The new terminologies and definitions will ensure that our recommendations can be
clearly interpreted by our stakeholders without ambiguities. The new recommendation terminologies and definitions are explained in Chapter 5 – Investment Recommendations.
Acting on stakeholder feedback we continue to evolve and improve the NOA together. The following areas are new additions for the NOA 2017/18:

C
hapter oneNetwork Options Assessment 2017/18 – January 2018 18
1.7.4 Changes to the presentation of the economic analysis results
1.7.5 Changes to the NOA for Interconnectors
The NOA economic analysis is a sophisticated process that produces results in different stages. We’ve been exploring more intuitive ways to express our economic analysis results that ultimately lead to our final
recommendations. To this end, we’ve moved tables containing detailed economic analysis results to Appendix A, and we’ve created new diagrams in Chapter 5 to better visualise the results.
This year’s NOA for Interconnectors analysis has been enhanced by taking into consideration the locational impacts of potential interconnectors in addition to the welfare and capital cost implications which were considered last year, as well as using the NOA 2017/18 background.
We always want to hear suggestions on how we can continue improving the NOA so don’t hesitate to let us know how we can further develop it to meet your needs.

C
hapt
er o
neNetwork Options Assessment 2017/18 – January 2018 19
Aim of the report
1.8 Stakeholder engagement and feedback
Feedback isn’t limited to the questions we’ve included in this publication, and we’d be delighted to hear from you by any appropriate means. We are also keen to know how you’d prefer to share your views and help us develop the NOA. Please see Chapter 7 – Stakeholder engagement for more information.
To help encourage your feedback, you will see that we’ve included prompts such as this for engagement throughout the publication and these highlight areas in each section where we’d like your views.

Chapter tw
oNetwork Options Assessment 2017/18 – January 2018 20
Chapter twoMethodology 21
Network Options Assessment 2017/18 – January 2018 20

Cha
pter
tw
oNetwork Options Assessment 2017/18 – January 2018 21
Methodology
This chapter highlights the methodology used for the NOA, and explains the economic theory behind our analysis. It also explains how the NOA ties in with the SWW process.
2.1 Introduction

Chapter tw
oNetwork Options Assessment 2017/18 – January 2018 22
2.2 The NOA process
The NOA methodology describes how we assess Major National Electricity Transmission System (NETS) Reinforcements to meet the requirements that we find from our analysis of the Future Energy Scenarios (FES). We have published this year’s methodology on our website. It also includes the methodologies for interconnectors and SWW. As the NOA is derived from the Network Development Policy (NDP), the two methodologies are similar. You can find a copy of our NDP methodology alongside the NOA methodology on our website below:
www.nationalgrid.com/noa
Some users’ connection agreements have major reinforcements as their enabling works. This means that the NOA may recommend a change to the delivery of these works. If this happens, we will work with those stakeholders and keep them informed but their connection date remains the same.
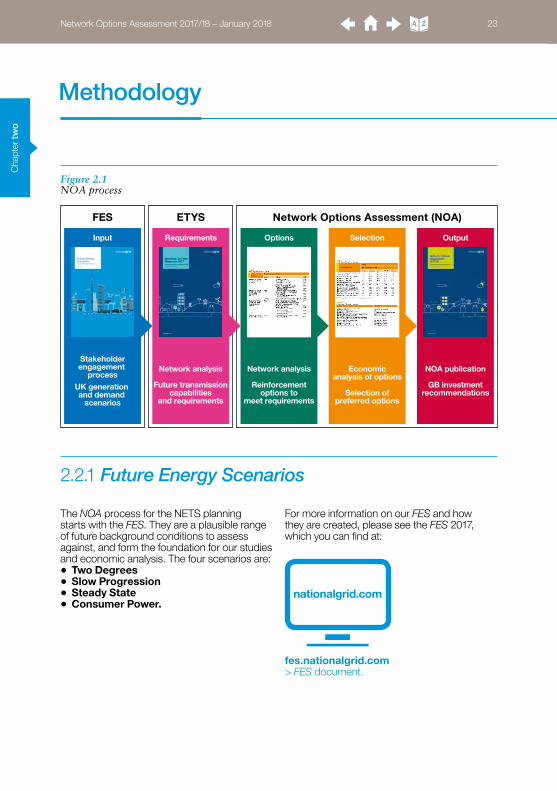
Figure 2.1 shows the steps we take to produce the NOA. It follows the five stages of the NOA report process.
In accordance with our licence condition, Major National Electricity Transmission System Reinforcements are defined in Paragraph 1.30 of the NOA Report methodology. We define them as:“a project or projects in development to deliver additional boundary capacity or alternative system benefits, as identified in the Electricity Ten Year Statement or equivalent document.”
Cha
pter
tw
oNetwork Options Assessment 2017/18 – January 2018 23
Methodology
Figure 2.1 NOA process
FES ETYS Network Options Assessment (NOA)
Stakeholderengagement
processUK generation and demand
scenarios
Input Requirements Options Selection Output
Network analysis
Future transmissioncapabilities
and requirements
Network analysis
Reinforcementoptions to
meet requirements
Economicanalysis of options
Selection ofpreferred options
NOA publication
GB investmentrecommendations
2.2.1 Future Energy Scenarios
The NOA process for the NETS planning starts with the FES. They are a plausible range of future background conditions to assess against, and form the foundation for our studies and economic analysis. The four scenarios are:• Two Degrees• Slow Progression• Steady State• Consumer Power.
For more information on our FES and how they are created, please see the FES 2017, which you can find at:
fes.nationalgrid.com > FES document.
Chapter tw
oNetwork Options Assessment 2017/18 – January 2018 24
2.2.2 Electricity Ten Year Statement
2.2.3 Network Options Assessment
The ETYS is the second stage in the NOA process. We apply the FES to transmission system models and calculate the power flow requirements across the transmission network. To do this we have developed the concept of boundaries. Boundaries don’t exist physically, but are instead a conceptual split of the network into two adjacent parts. As power transfers between these areas, we can see which parts of the network are under the most stress and where network reinforcement would be most suitable. The capability of the network and its future requirements are published in the ETYS 2017, which you can find at:
www.nationalgrid.com/etys
In order to create an electricity transmission network that is fit for the future, we engage equally with all TOs in order for them to propose options to meet the system capability requirements outlined by the ETYS. We encourage a range of options that include upgrading existing assets or creating new assets to ensure that we have a wide selection of options to assess.
With this varied list of options, we move onto the fourth stage of the NOA process, ‘Selection’. We use our understanding of constraint costs to carry out economic analysis of all the options. This narrows the list of proposed options into a list of our preferred options, which we believe are the ones that provide the most benefit for consumers. You can find the full list of our recommended options in Chapter 5 – Investment recommendations. How we perform economic analysis is described in greater detail in the following section.As well as these build options, both the
TOs and SO can propose opportunities for reduced-build options. Reduced-build options are solutions that require very little build and instead maximise use of existing assets often in innovative ways. You can find a full list of the options that we analysed in Chapter 4 – Proposed options.
Cha
pter
tw
oNetwork Options Assessment 2017/18 – January 2018 25
Methodology
2.3 Economic analysis
2.3.1 Theory
2.3.2 Optimum years
To understand our investment recommendations it is important to first understand why we recommend that the TOs invest in their networks.
The transfer of energy across our network boundaries occurs because generation and demand are typically situated in different locations. When the power transfer required across a transmission system boundary is above that boundary’s capability, our control room must reduce the power transfer to avoid dangerously overloading the transmission assets. This limiting of power transfer across a boundary is referred to as ‘constraining’ the network.
When we constrain the network, we ask generators on the exporting side of the stressed boundaries to limit their output. In order to maintain an energy balance, we replace this energy with generation on the importing side
of these boundaries. Balancing the network by switching generation on and off costs money, and if we are constraining the network by large amounts regularly then these constraint costs begin to accumulate.
Assessment of these future constraint costs is an important factor in our decision-making process. It enables us to evaluate and recommend investments such as creating new overhead lines and underground cables for the future transmission network. We refer to these potential investments as ‘options’, and although they cost money they also raise the capability of the network, meaning that more power can be transferred across boundaries without the need to constrain. We work together with the TOs to upgrade the transmission networks at the right time in the right places to find the best balance between investing in the network and constraining it.
To maximise benefit to consumers, we must recommend that the TOs invest in the right options at the right time. However, it takes time for the TOs to upgrade the network, with some options taking longer to implement than others. The earliest year that an option can be delivered is an important factor in our analysis. It’s called the ‘Earliest In Service Date’ (EISD) and an option can’t be delivered before this. We need to take this into account when we consider the optimal timing of options. We don’t want to invest too early unnecessarily, or incur potentially high constraint costs by investing too late. Getting this balance right will achieve the best value for consumers. Consequently, each economically viable option has an
optimum year of delivery that realises the most benefit, and we aim to time an option to be delivered in its optimum year.
If an option’s optimum year of delivery is later than its EISD, then no recommendation on whether to proceed with the option needs to be made yet. However, if an option’s optimum year is the same year as its EISD, then a recommendation on whether to proceed cannot be delayed any longer without risking missing its optimum year. Such an option is then considered ‘critical’. All critical options are entered into our single year least regret analysis, where we ultimately decide the investment recommendations for this year.
Chapter tw
oNetwork Options Assessment 2017/18 – January 2018 26
2.3.3 Single year least regret analysis
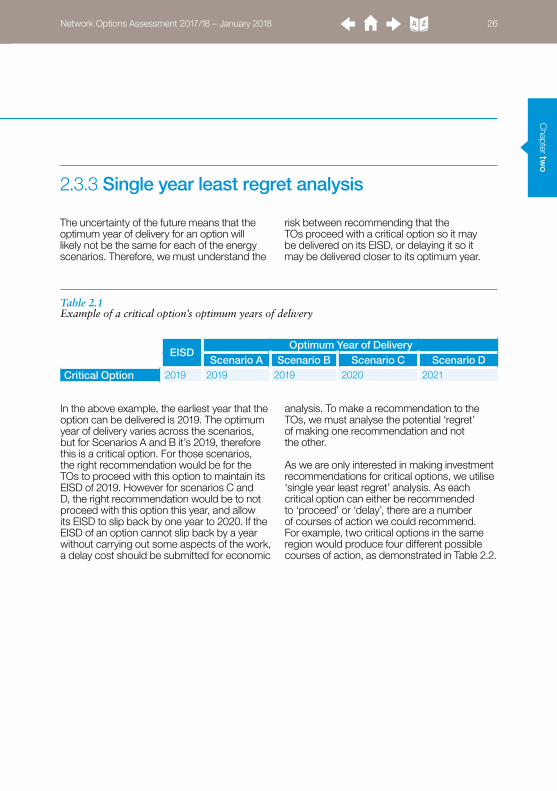
The uncertainty of the future means that the optimum year of delivery for an option will likely not be the same for each of the energy scenarios. Therefore, we must understand the
risk between recommending that the TOs proceed with a critical option so it may be delivered on its EISD, or delaying it so it may be delivered closer to its optimum year.
In the above example, the earliest year that the option can be delivered is 2019. The optimum year of delivery varies across the scenarios, but for Scenarios A and B it’s 2019, therefore this is a critical option. For those scenarios, the right recommendation would be for the TOs to proceed with this option to maintain its EISD of 2019. However for scenarios C and D, the right recommendation would be to not proceed with this option this year, and allow its EISD to slip back by one year to 2020. If the EISD of an option cannot slip back by a year without carrying out some aspects of the work, a delay cost should be submitted for economic
analysis. To make a recommendation to the TOs, we must analyse the potential ‘regret’ of making one recommendation and not the other.
As we are only interested in making investment recommendations for critical options, we utilise ‘single year least regret’ analysis. As each critical option can either be recommended to ‘proceed’ or ‘delay’, there are a number of courses of action we could recommend. For example, two critical options in the same region would produce four different possible courses of action, as demonstrated in Table 2.2.
Table 2.1 Example of a critical option’s optimum years of delivery
EISDOptimum Year of Delivery
Scenario A Scenario B Scenario C Scenario DCritical Option 2019 2019 2019 2020 2021

Cha
pter
tw
oNetwork Options Assessment 2017/18 – January 2018 27
Methodology
2.3.4 Economic regret
Once a reinforcement option is delivered, constraint costs decrease due to the additional capability it brings to the network. However, all options have a cost associated with their implementation, and therefore the net benefit an option brings over its lifetime is the difference between the savings in constraint costs and the total cost of the option.
In the single year least regret analysis, we investigate all possible courses of action presented by critical options for the next
investment year. These courses of action are treated as different investment strategies. Economic regrets are calculated under each scenario with respect to different strategies to help us identify and quantify the maximum risk each course of action poses across different scenarios. Selecting the strategy with the lowest maximum regret leaves consumers exposed to the least amount of risk. The following descriptions demonstrate how economic regrets are calculated in the single year least regret analysis.
In order to balance the level of investment and exposure to risk, we utilise the concept of ‘economic regret’.
Table 2.2 Possible courses of action for two critical options in a region
Course of action 1 Proceed both Options A and B
Course of action 2 Proceed Option A but delay Option B
Course of action 3 Proceed Option B but delay Option A
Course of action 4 Delay both Options A and B
Single year least regret analysis allows us to recommend to the TOs to invest just the right amount so an option can be progressed forward by one year and maintain its EISD. As our energy landscape is changing, our recommendations for an option may adapt accordingly. This means that an option
that we recommended to proceed last year may be recommended to be delayed this year and vice versa. The robustness of the single year least regret analysis is that an ongoing project is revaluated each year to ensure that its planned completion date remains best for the consumer.
Chapter tw
oNetwork Options Assessment 2017/18 – January 2018 28
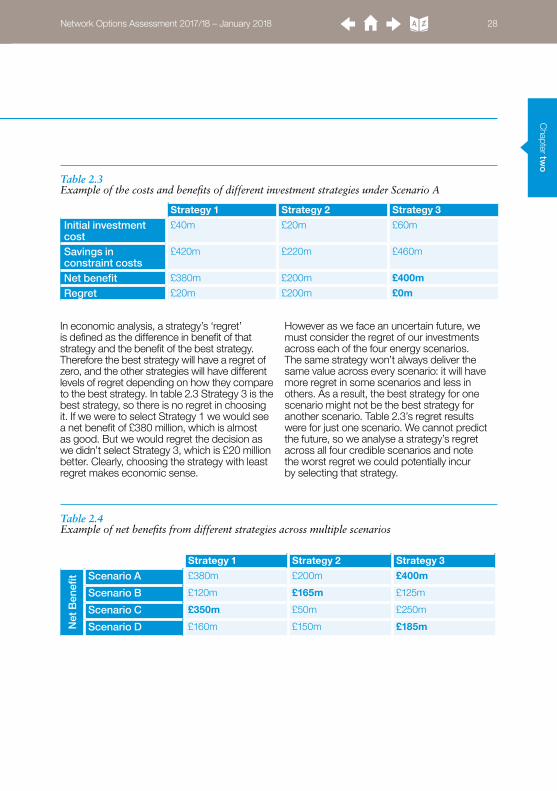
In economic analysis, a strategy’s ‘regret’ is defined as the difference in benefit of that strategy and the benefit of the best strategy. Therefore the best strategy will have a regret of zero, and the other strategies will have different levels of regret depending on how they compare to the best strategy. In table 2.3 Strategy 3 is the best strategy, so there is no regret in choosing it. If we were to select Strategy 1 we would see a net benefit of £380 million, which is almost as good. But we would regret the decision as we didn’t select Strategy 3, which is £20 million better. Clearly, choosing the strategy with least regret makes economic sense.
However as we face an uncertain future, we must consider the regret of our investments across each of the four energy scenarios. The same strategy won’t always deliver the same value across every scenario: it will have more regret in some scenarios and less in others. As a result, the best strategy for one scenario might not be the best strategy for another scenario. Table 2.3’s regret results were for just one scenario. We cannot predict the future, so we analyse a strategy’s regret across all four credible scenarios and note the worst regret we could potentially incur by selecting that strategy.
Table 2.3 Example of the costs and benefits of different investment strategies under Scenario A
Strategy 1 Strategy 2 Strategy 3
Initial investment cost
£40m £20m £60m
Savings in constraint costs
£420m £220m £460m
Net benefit £380m £200m £400m
Regret £20m £200m £0m
Table 2.4 Example of net benefits from different strategies across multiple scenarios
Strategy 1 Strategy 2 Strategy 3
Net
Ben
efit Scenario A £380m £200m £400m
Scenario B £120m £165m £125m
Scenario C £350m £50m £250m
Scenario D £160m £150m £185m

Cha
pter
tw
oNetwork Options Assessment 2017/18 – January 2018 29
Methodology
2.3.5 Implied probability
The single year least regret analysis will always find the strategy that minimises the worst regret across different scenarios. However in some circumstances, the approach may lead to ‘false-positive’ recommendations, especially when recommendations given by the preferred strategy are driven by a single scenario with the highest level of congestion on the system. To mitigate the risks of giving ‘false-positive’ recommendations, implied probability weightings on scenarios are calculated to help interrogate the preferred strategy. In this additional step, a-priori probability weights are not directly applied to any scenarios, instead the probability weights implied by the single year least regret decision are calculated.
In order for the single year least regret chosen strategy to be preferred, the weighted net benefit of the chosen strategy must be greater than for any other strategy. We can therefore compare each competing strategy against the single year least regret chosen strategy and compute the probabilities, which would make us indifferent between the two.
In the example shown in Table 2.5, we can see that it is mainly Scenario B and C deciding the single year least regret analysis results. Scenario C produces the highest regret for strategy 2 and 3, and so is the main driver behind strategy 1 being chosen. The scenario at the opposite end of the need for strategy 1 is scenario B, which provides us with the
The preferred strategy is selected based upon which strategy has the lowest worst regret. In the above example, each scenario has a best choice and a worst choice. Strategy 3 may be the best choice for Scenarios A and D, but would be a much poorer choice under either of the other two scenarios. Least regret
analysis shows that Strategy 1 minimises risk across all four scenarios, as its regret will be no more than £45 million. This approach provides a more stable and robust decision against the range of uncertainties, and minimises exposure to significant regret.
Table 2.5 Example of least regret analysis, with Strategy 1 having the lowest worst regret
Strategy 1 Strategy 2 Strategy 3
Reg
ret Scenario A £20m £200m £0m
Scenario B £45m £0m £40m
Scenario C £0m £300m £100m
Scenario D £25m £35m £0m
Worst regret £45m £300m £100m

Chapter tw
oNetwork Options Assessment 2017/18 – January 2018 30
2.3.6 Economic tools
We use a constraint costs assessment tool to analyse and establish the benefits to consumers of the different options. Historically, we’ve used the Electricity Scenario Illustrator (ELSI) to determine these costs. In March 2016 we purchased a new economic tool, BID3, from Pöyry Management Consulting. We began using it from 2016/17 for econometric analysis work. It forecasts the costs of constraints, which are an important factor in the full cost–benefit analysis of the NOA. We use this information to help us identify the most economic investment strategies, taking into account all the future energy scenarios that we described in Chapter 2 of the ETYS 2017.
To ensure a successful transition to BID3, the model has been extensively benchmarked against the ELSI, and two independent reviewers (Professor Keith Bell, University of Strathclyde, and Dr Iain Staffell, Imperial College London) were appointed to review our work, BID3 configuration and benchmarking.
The future energy landscape is uncertain, so the information we use in our cost–benefit analysis changes over time. We revisit our data, assumptions and analysis results every year to make sure that the preferred strategy is still the best solution. So, when we respond to market- or policy-driven changes, this approach allows us to be flexible, while also keeping the cost associated with this flexibility to the minimum.
largest regret for strategy 1 with respect to strategy 2 and 3. In order for the same decision as the least regret decision to be made under expected net benefit maximisation, it must be that the expected net benefit of strategy 1 is greater than the expected net benefit of strategy 2 or 3. For example, to choose strategy 1 over strategy 2, it must be that:
350p+120(1-p)≥50p+165(1-p)
where p is the probability of scenario C, and 1-p is the probability of scenario B; the net benefit provided by Strategy 1 is £350m and £120m under Scenario C and B respectively, and the net benefit provided by Strategy 2 is £50m and £165m under Scenario C and B respectively.
Solving for p we find that p≥13.04%. This means that we need to believe that Scenario C is greater than 13.04% likely to happen against Scenario B for us to make the same decision as single year least regret analysis suggests. Conversely, we would need to believe that scenario B is less than 86.96% likely when compared with scenario C.

Cha
pter
tw
oNetwork Options Assessment 2017/18 – January 2018 31
Methodology
Figure 2.2 shows the various inputs to BID3. The inputs fall broadly into three categories:
Existing boundary capabilities and their future development – These were calculated using a separate power system analysis package. BID3 is the tool for calculating the market-driven flow across the boundaries, and takes capabilities as an input. The input to BID3 includes the increase in capability that the option provides, its capital cost and the EISD.
Future Energy Scenarios – BID3 assesses all options for network reinforcements against each of the detailed Future Energy Scenarios. The resulting analysis takes us up to 2037 (the values from 2038 are extrapolated from 2037 forecasts so we can estimate full lifetime costs).
Assumptions – BID3’s other input data takes account of fuel cost forecasts, plant availabilities and prices in interconnected European member states.
If you want to know more about BID3, there are a number of resources available on our website. A copy of the independent reviewers’ report is available, as well as our Long Term Market and Network Constraint Modelling Report, which provides further information on why we selected BID3, what we will use it for, and more detail on the inputs to BID3. The reports are available at the main NOA webpage.
Figure 2.2 BID3 tool inputs
Suite of transmission strategies with lifetime costs
BID3 constraint modelling
Economic analysis
Input data• Physical constraints.• Existing network/boundary
capabilities.• Forecast constraint prices.
Transmission solutions (boundary capability uplift and construction cost)
EISD
Future Energy Scenarios
www.nationalgrid.com/noa

Chapter tw
oNetwork Options Assessment 2017/18 – January 2018 32
2.4 The NOA Committee
This year we’ve created the NOA Committee – consisting of SO senior management – to add an additional, transparent level of scrutiny to our NOA recommendations. In this final step, the investment recommendations from our economic analysis are presented to the NOA Committee. The NOA Committee focuses on marginal recommendations that are driven by a single scenario or driver, or are considered to be sensitive, and then challenges their single year least regret analysis results with implied probabilities and other evidence.
The NOA Committee also provides holistic energy industry insight, and takes into account whole-system needs to support or revise those marginal investment recommendations. In preparation for the NOA Committee meeting, the SO discusses the details of economic analysis results with both internal stakeholders and the TOs to make sure the final recommendations are robust. The TOs will be invited to present information at the NOA Committee if at least one of their options (or joint options) is to be discussed.
We’ve brought in the NOA Committee and use implied probabilities to strengthen the methodology. How did you find the explanations for these new parts of the NOA process?

Cha
pter
tw
oNetwork Options Assessment 2017/18 – January 2018 33
Methodology
2.5 How the NOA connects to the SWW process
We use the NOA process to look at the costs and benefits of potential options, and put forward our recommended options. If an option is recommended but it involves large infrastructure that satisfies one of the criteria shown below, then this option is referred to as SWW. SWWs are led by the TOs, who develop the Needs Case for such an option. An option in England and Wales needs to meet at least one of the criteria below to be considered as SWW. All costs are in 2009/10 prices:• The option has a forecast cost
of more than £500 million.• The option has a forecast cost of
between £100 million and £500 million, is supported by only one customer, and is not required in most scenarios.
• The option has a forecast cost of less than £100 million, is supported by only one customer, and is not required in most scenarios, but would require consents.
An option in Scotland needs to meet all of the criteria shown below. Once again, all costs are in 2009/10 prices:• The option has total delivery costs of more
than £50 million for SHE Transmission and £100 million for SP Transmission.
• The output will deliver additional cross-boundary (or sub-boundary) capability, or wider system benefits.
• Costs cannot be recovered under any other provision of the TO’s price control settlement.
It’s important to note that the relevant TO leads on developing Needs Cases for SWW projects, but we support the TO with the economic analysis. The TO initiates the Needs Case work for SWW projects depending on certain factors, including the forecast costs, and whether they trigger the SWW funding formula. Another important factor is the time taken to deliver the option.
This, combined with the date at which the option is needed in service, determines when to start building. The closer this date is, the sooner the TO needs to pursue the detailed analysis to justify the SWW’s funding.
We have published our methodology for the SO process for input into TO-led SWW Needs Case submissions on our website.
www.nationalgrid.com/noa

Chapter tw
oNetwork Options Assessment 2017/18 – January 2018 34
2.5.1 Summary of SWW economic analysis methodology
When an option is deemed to be an SWW, cost–benefit analysis examines the economic benefit of a range of reinforcement options against the base network across their lifetimes. The base is usually ‘do nothing’ or ‘do minimum’, and usually has no associated capital costs. Constraint costs are forecast for the base and each network option across all scenarios.
We calculate the present value (PV) of constraint savings compared to the base for each network solution. These are then subtracted from the PV of capital expenditure associated with each network option, giving a net present value (NPV) for each of the network options. Taking these NPVs, we use lifetime least regret analysis to determine a preferred network option and an optimal delivery year. The results are analysed to determine how changing project capital costs and constraint savings would affect the recommendations.
We may vary the process where modelling the base network is not straightforward. Such variations are assessed, case by case, with Ofgem.
The Joint Regulators Group on behalf of the UK’s economic and competition regulators recommend a discounting approach that discounts all costs (including financing costs as calculated based on a weighted average cost of capital or WACC) and benefits at HM Treasury’s social time preference rate (STPR). This is known as the Spackman approach and is used for all our reinforcements.
Cha
pter
tw
oNetwork Options Assessment 2017/18 – January 2018 35
Methodology
2.6 Interaction between the NOA results and the FES
In the NOA, we set out our vision for the future of the electricity transmission networks and European interconnection. Chapter 5 – Investment recommendations explains our recommended options for onshore reinforcements, based on providing the maximum benefit for GB consumers, and Chapter 6 – Interconnection analysis describes the future optimum interconnection capacity between GB and European markets. This year, the investment recommendations for onshore
reinforcements detailed in Chapter 5 form an input to the interconnection analysis in Chapter 6. This is an improvement on last year’s NOA, ensuring the interconnection analysis is based on the most up-to-date onshore reinforcement recommendations. Both sets of results will influence our 2018 FES analysis, and will therefore contribute to the credible assumptions for the 2018/19 ETYS and NOA. We’ve described the methodology for interconnection analysis in Chapter 6 – Interconnection analysis.
Chapter tw
oNetwork Options Assessment 2017/18 – January 2018 36
2.7 Other options
2.7.1 Excluded options
While this report looks at options that could help meet major NETS reinforcement needs, it doesn’t include:• projects with no boundary benefit (unless
they are specifically included for another reason, such as links to the Scottish islands that trigger the SWW category)
• options that provide benefits, such as voltage control over the summer minimum, but no boundary capability improvement (this is an area where we would welcome your feedback)
• analysis of options where, by inspection, the costs for the expected benefits would be prohibitive
• long-term conceptual options submitted by the TOs to support the analysis; this is explained in more detail in the next section.
We will include a summary in the NOA for projects where the TO has started the SWW Needs Case process, even though they won’t provide boundary capability. The following projects to connect to the Scottish islands are in this category:• Orkney link• Western Isles link• Shetland link.
The SWW Needs Case for Hinkley–Seabank project has been established. Therefore the project is considered in the base networks and not assessed for cost and benefit in this NOA.
The North West Coast Connection project is driven by a customer, and its SWW Needs Case process was initiated in December 2016. Since the customer has paused their development consent order, the SWW Needs Case has been deferred indefinitely while the customer reviews its plans. Therefore the project is not considered in this NOA.
Work on the Wylfa–Pentir second double circuit has already started and should continue due to a local customer agreement in place. Therefore the project is considered in the base networks in this NOA.

Cha
pter
tw
oNetwork Options Assessment 2017/18 – January 2018 37
2.7.2 Long-term conceptual options
Through the NOA process, we state our recommended options for the upcoming investment year, and optimum delivery dates for options over the next few decades. This process provides a long-term strategy through which the TOs are able to constantly evolve and develop their electricity transmission networks to deliver the best value for consumers.
For this, we receive a wide range of options provided by the TOs for analysis and comparison, and which we assess for cost and benefit. However, development of reinforcement in the network will be a continuous process where the designs and costs for some reinforcements in the distant future are unknown. In order to represent these long-term eventual reinforcements in our economic analysis, the TOs also provide us with more conceptualised reinforcements to support the long-term future network.
Methodology

C
hapter oneNetwork Options Assessment 2017/18 – January 2018 38
Chapter threeBoundary descriptions 39
Network Options Assessment 2017/18 – January 2018 38

Cha
pter
thre
e
To France
To Netherlands
To Ireland
To Northern Ireland
East Anglia
Hornsea
Dogger Bank
Firth of Forth
Moray Firth
Rampion
Connah’s Quay
Middleton
Linnmill
Moffat
Fallago
GalashielsGalashiels
Hawick
Harestanes
Kinlochleven
Tummel Bridge
400 kV Substations275 kV Substations132 kV Substations
400 kV Circuits275 kV Circuits220 kV Circuits132 kV CircuitsWestern HVDC LinkInterconnectors
Major Generating Sites Including Pumped Storage
Connected at 400 kVConnected at 275 kVHydro Generation
Errochty
Tummel
Denny
Crossaig
Corriemoillie
Cashlie
SuttonBridge
New Cumnock
Black Law Extension
Hadyard
Kilgallioch
CumbernaldBainsford
Auchenwynd
Robin Rigg
Barrow
Ormonde
Rhyl Flats
Burbo Bank
Kentish Flats
Gunfleet Sands I&II
London Array
Gwynt y Mor
Thanet
Walney I & II
Greater Gabbard 500MW
West of Duddon
Westermost Rough
Humber Gateway
Sheringham Shoal
Greater Gabbard 2nd part
North Hoyle
Lynn
Inner Dowsing
Triton Knoll
Lincs
Race Bank Dudgeon
Teesside
Scroby sands
B4
B5
B4
B5
EC1
B6
B6B7
B7
B11
B11B16
B16
B7a
B7a
NW1
NW2
NW3NW4
B8
B8
B9
B17
B9B12
B12SC1
B10
B15
B13
B13
B10EC5
EC5
SC1
B15
EC3
B2
B2
B1
B1
B0
B0
SW1
SW1
B1a
B1a
Penn
PyleIver
Drax
Fleet
Abham
GrainHurst
Wylfa
Blyth
Sundon
Legacy
Stanah
Pentir
Kirkby
Hutton
Walham
Pelham
Harker
Elland
Keadby
MargamWarley
Norton
Cowley
Bolney
Rassau
Minety
Exeter
Fawley
Didcot
Cottam
Seabank
Taunton
Kitwell
Kemsley
Whitson
Laleham
Walpole
Grendon
Padiham
Rugeley
Rowdown
Norwich Main
Heysham
Enderby
NinfieldLovedean
Bramford
Bredbury
Nursling
Drakelow
Pitsmoor
Neepsend
Aldwarke
Sizewell
Melksham
Thornton
Offerton
Aberthaw
Rochdale
Hartmoor
Pembroke
Landulph
Rye House
Sellindge
Tynemouth
Wymondley
Feckenham
Poppleton
Cilfynydd
Axminster
Bridgwater
Bicker Fen
Staythorpe
Mannington
Ffestiniog
Spennymoor
Penwortham
Osbaldwick
Shrewsbury
Willington
Chickerell
Cellarhead
EatonSocon
Creyke Beck
Trawsfynydd
Grimsby West
Chesterfield
Burwell Main
Alverdiscott
Langage
Indian Queens
Hinkley Point
Dinorwig
Rainhill
Capenhurst
Frodsham
WashwayFarm
South Manchester
Carrington
DainesFiddlersFerry
Macclesfield
Kearsley Whitegate
Stalybridge
Dungeness
CanterburyNorth
Braintree
WalthamCross
Swansea North
Baglan Bay
CardiffEast
Tremorfa
Alpha SteelUpper Boat Uskmouth
ImperialPark
Iron Acton
Marchwood
Botley Wood
Bramley
Culham
Quernmore
CoventryNechells
Willenhall
BustleholmHams Hall
BerkswellOldbury
Bishops Wood
Ironbridge
Ocker Hill
SpaldingNorth
PatfordBridge
FerrybridgeEggborough
ThorpeMarsh
Thurcroft
Brinsworth
HighMarnham
TempleboroughWestMelton
Norton LeesJordanthorpe
Sheffield City
Winco BankStocksbridge West
Burton
SaltendNorth
Saltend South
SouthHumberBank
BradfordWest Kirkstall Skelton
Grange MonkFryston
Killingholme
Humber Refinery
East Claydon
Rayleigh Main
Coryton
SinglewellKingsnorthLittlebrook
Beddington
Chessington
West Weybridge
St JohnsWood
Ealing
Willesden
Watford Elstree
Tottenham Redbridge
Barking
LeightonBuzzard
Amersham Main
TilburyCity Rd
New Cross
Hackney
Brimsdown
South ShieldsWest Boldon
Hawthorne Pit
HartlepoolTod Point
Grangetown Greystones
Lackenby
Stella West
Fourstones
Sloy
Shin
Orrin
Aigas
Quoich
Lochay
Foyers
Rannoch
Glenlee
Clachan
Cassley
Tongland
Errochty
Fasnakyle
Invergarry
Brora
Elgin
Keith
Eccles
Beauly
Thurso
Tealing
Torness
Kintore
Mybster
Dunbeath
Arbroath
Port Ann
Dalmally
Dounreay
LongannetCockenzie
Inveraray
Carradale
Peterhead
Hunterston
St. Fergus
Auchencrosh
Blackhillock
Fort Augustus
KilmarnockSouth
Alness
Nairn
MossfordGrudie Bridge
Macduff
Dingwall
Inverness
Lairg
Luichart
DeanieCulligran
Kilmorack
Boat ofGarten
Broadford
Dunvegan
Stornoway
Harris
TaynuiltCruachan
Whistlefield
Nant
Fort William
Killin Finlarig
Errochty Power Station
Clunie
Fraserburgh
Dyce
Persley
Willowdale
Clayhills
Redmoss
Fiddes
TarlandCraigiebuckler
WoodhillGlenMorrison
Caennacroc
DudhopeMilton of Craigie
Glenagnes
Lyndhurst
CharlestonBurghmuir
Glenrothes
Westfield
Dunoon
AyrCoylton
Maybole
Coalburn
Elvanfoot
Carsfad
Earlstoun
Chapelcross
GretnaDumfries Ecclefechan
Berwick
SCOTTISH HYDRO-ELECTRICTRANSMISSION
St. Fillans
DunbarInverkeithing
Dudhope
NewtonStewart
Glenluce
SP TRANSMISSION LTD
Saltcoats
Meadowhead
Kilwinning
Kaimes
PortobellloShrubhill
MossmorranGlenniston
Redhouse
Leven
Cupar
Currie
GorgieTelford Rd.
Livingston
Bathgate
Grangemouth
DunfemlineKincardine
Devonside
Stirling
Bonnybridge
Easterhouse
Newarthill
WishawBlack LawStrathaven
Clydes Mill
EastKilbrideSouth
Busby
WhiteleeKilmarnockTown
Neilston
ErskineDevolMoor
Helensburgh
StrathlevenSpangoValley
Lambhill
Broxburn
West Ham
NorthfleetEast
West Thurrock
Windyhill
Stoke Bardolph
Bushbury
Bodelwyddan
Knaresborough
Saltholme
Hedon
Clyde (South)
Clyde (North)
Kendoon
Marshall Meadows
Whitelee Extn
SmeatonCoatbridge
Inverarnan
Whitehouse
Knocknagael
Crystal Rig
Dunlaw Extension
To Ireland
Ratcliffeon Soar
Cleve Hill
Mill Hill
Markhill
Arecleoch
Glendoe
Rocksavage
Ardmore
Strichen
North
Hunterston
HunterstonEast
Necton
SW1
SW1
B14
B3b
B3b
S 2C
S 2C
FlintshireBridge
Ewe Hill
Rhigos
Kensal Green
Highbury
PuddingMill
Blackcraig
GlenglassBlack Hill
Dun Hill
Wimbledon
Loch Buidhe
Fyrish
L 1E
L 1E
Network Options Assessment 2017/18 – January 2018 39
This section provides a short introduction to the boundaries on the NETS. You will find a fuller description in this year’s ETYS.
Figure 3.1 shows all the boundaries we have considered for this year’s analysis.
3.1 Introduction
Boundary descriptions
Figure 3.1 ETYS GB boundaries

Chapter three
Network Options Assessment 2017/18 – January 2018 40
The following section describes the NETS in Scotland and Northern England. The onshore transmission network in Scotland is owned by
SHE Transmission and SP Transmission, but is operated by National Grid as SO.
3.2 Scotland and the North of England region
3.2.1 Introduction
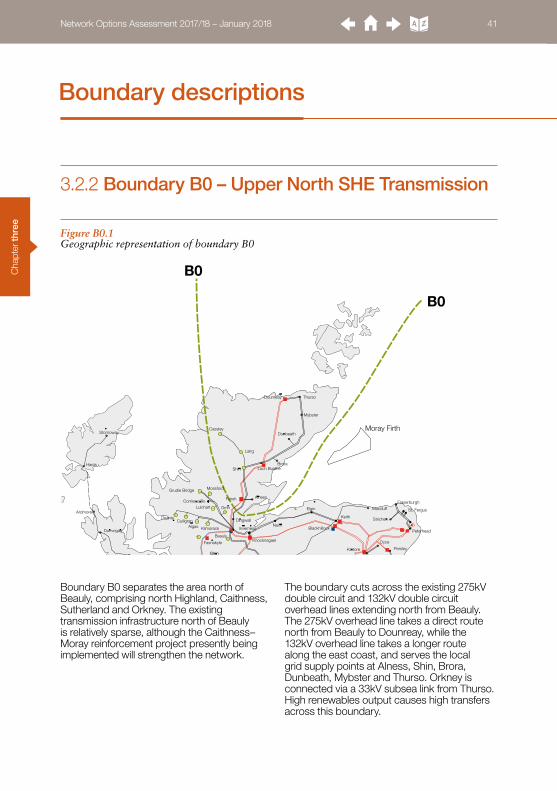
Cha
pter
thre
e
Moray Firth
Corriemoillie
B0
B0
Shin
Orrin
Aigas
Cassley
Fasnakyle
Brora
Elgin
Keith
Beauly
Thurso
Kintore
Mybster
Dunbeath
Dounreay
Peterhead
St. Fergus
Blackhillock
Alness
Nairn
MossfordGrudie Bridge
Macduff
Dingwall
Inverness
Lairg
Luichart
DeanieCulligran
KilmorackDunvegan
Stornoway
Harris
Fraserburgh
Dyce
Persley
Knocknagael
Ardmore
Strichen
Loch Buidhe
Fyrish
Network Options Assessment 2017/18 – January 2018 41
Boundary B0 separates the area north of Beauly, comprising north Highland, Caithness, Sutherland and Orkney. The existing transmission infrastructure north of Beauly is relatively sparse, although the Caithness–Moray reinforcement project presently being implemented will strengthen the network.
The boundary cuts across the existing 275kV double circuit and 132kV double circuit overhead lines extending north from Beauly. The 275kV overhead line takes a direct route north from Beauly to Dounreay, while the 132kV overhead line takes a longer route along the east coast, and serves the local grid supply points at Alness, Shin, Brora, Dunbeath, Mybster and Thurso. Orkney is connected via a 33kV subsea link from Thurso. High renewables output causes high transfers across this boundary.
3.2.2 Boundary B0 – Upper North SHE Transmission
Figure B0.1 Geographic representation of boundary B0
Boundary descriptions
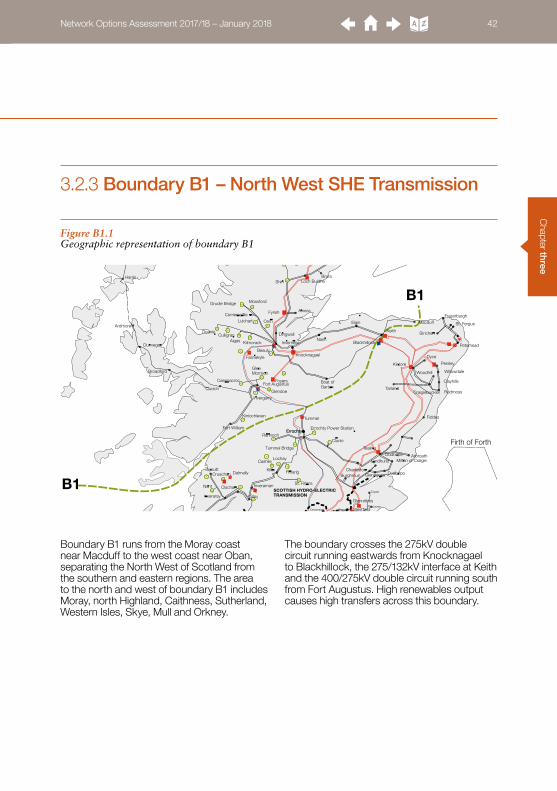
Chapter three
Firth of Forth
Kinlochleven
Tummel Bridge
Errochty
Tummel
Corriemoillie
Cashlie
B1
B1
Sloy
Shin
Orrin
Aigas
Quoich
Lochay
Foyers
Rannoch
Clachan
Errochty
Fasnakyle
Invergarry
Brora
Elgin
Keith
Beauly
Tealing
Kintore
Arbroath
Dalmally
Inveraray
Peterhead
St. Fergus
Blackhillock
Fort Augustus
Alness
Nairn
MossfordGrudie Bridge
Macduff
Dingwall
Inverness
Luichart
DeanieCulligran
Kilmorack
Boat ofGarten
Broadford
Dunvegan
Harris
TaynuiltCruachan
Nant
Fort William
Killin Finlarig
Errochty Power Station
Clunie
Fraserburgh
Dyce
Persley
Willowdale
Clayhills
Redmoss
Fiddes
TarlandCraigiebuckler
WoodhillGlenMorrison
Caennacroc
DudhopeMilton of Craigie
Glenagnes
Lyndhurst
CharlestonBurghmuir
Glenrothes
Westfield
SCOTTISH HYDRO-ELECTRICTRANSMISSION
St. Fillans
Dudhope
Leven
Cupar
Devonside
Inverarnan
Knocknagael
Glendoe
Ardmore
Strichen
Loch Buidhe
Fyrish
Network Options Assessment 2017/18 – January 2018 42
Boundary B1 runs from the Moray coast near Macduff to the west coast near Oban, separating the North West of Scotland from the southern and eastern regions. The area to the north and west of boundary B1 includes Moray, north Highland, Caithness, Sutherland, Western Isles, Skye, Mull and Orkney.
The boundary crosses the 275kV double circuit running eastwards from Knocknagael to Blackhillock, the 275/132kV interface at Keith and the 400/275kV double circuit running south from Fort Augustus. High renewables output causes high transfers across this boundary.
3.2.3 Boundary B1 – North West SHE Transmission
Figure B1.1 Geographic representation of boundary B1

Cha
pter
thre
e
Firth of Forth
Kinlochleven
Tummel Bridge
Errochty
Tummel
Corriemoillie
Cashlie
B1a
B1aSloy
Orrin
Aigas
Quoich
Lochay
Foyers
Rannoch
Clachan
Errochty
Fasnakyle
Invergarry
Elgin
Keith
Beauly
Tealing
Kintore
Arbroath
Dalmally
Inveraray
Peterhead
St. Fergus
Blackhillock
Fort Augustus
Alness
Nairn
MossfordGrudie Bridge
Macduff
Dingwall
Inverness
Luichart
DeanieCulligran
Kilmorack
Boat ofGarten
Broadford
Dunvegan
TaynuiltCruachan
Whistlefield
Nant
Fort William
Killin Finlarig
Errochty Power Station
Clunie
Fraserburgh
Dyce
Persley
Willowdale
Clayhills
Redmoss
Fiddes
TarlandCraigiebuckler
WoodhillGlenMorrison
Caennacroc
DudhopeMilton of Craigie
Glenagnes
Lyndhurst
CharlestonBurghmuir
Glenrothes
Westfield
SCOTTISH HYDRO-ELECTRICTRANSMISSION
St. Fillans
Dudhope
Redhouse
Leven
Cupar
KincardineDevonside
Inverarnan
Knocknagael
Glendoe
Ardmore
Strichen
Fyrish
Network Options Assessment 2017/18 – January 2018 43
Boundary descriptions
Boundary B1a runs from the Moray coast near Macduff to the west coast near Oban, separating the North West of Scotland from the southern and eastern regions. The boundary crosses the 275kV double circuit running eastwards from Blackhillock to Kintore on a direct route, and another 275k double circuit running eastwards from Keith to Peterhead and Kintore, as well as the 400/275kV double circuit running south from Fort Augustus. High renewables output causes high transfers across this boundary.
Boundary B1a was introduced in the ETYS 2016, published in November 2016, specifically to consider the critical circuits between Blackhillock and Kintore. Its main difference from the B1 boundary is that Blackhillock substation is north of the boundary. Additional generation between boundaries B1 and B1a drives the requirement for transmission reinforcement across B1a.
3.2.4 Boundary B1a – North West 1a SHE Transmission
Figure B1a.1 Geographic representation of boundary B1a

Chapter three
Firth of Forth
Fallago
Kinlochleven
Tummel Bridge
Errochty
Tummel
Denny
Crossaig
Cashlie
Black Law Extension
CumbernaldBainsford
B2
B2
Sloy
Quoich
Lochay
Foyers
Rannoch
Clachan
Errochty
Invergarry
Tealing
Torness
Arbroath
Port Ann
Dalmally
LongannetCockenzie
Inveraray
Hunterston
Fort Augustus Boat ofGarten
TaynuiltCruachan
Whistlefield
Nant
Fort William
Killin Finlarig
Errochty Power Station
Clunie
Clayhills
Redmoss
Fiddes
TarlandCraigiebuckler
Caennacroc
DudhopeMilton of Craigie
Glenagnes
Lyndhurst
CharlestonBurghmuir
Glenrothes
Westfield
Dunoon
Berwick
SCOTTISH HYDRO-ELECTRICTRANSMISSION
St. Fillans
DunbarInverkeithing
Dudhope
Saltcoats
Kilwinning
Kaimes
PortobellloShrubhill
MossmorranGlenniston
Redhouse
Leven
Cupar
Currie
GorgieTelford Rd.
Livingston
Bathgate
Grangemouth
DunfemlineKincardine
Devonside
Stirling
Bonnybridge
Easterhouse
Newarthill
WishawBlack LawStrathaven
Clydes Mill
EastKilbrideSouth
Busby
Whitelee
Neilston
ErskineDevolMoor
Helensburgh
StrathlevenSpangoValley
Lambhill
BroxburnWindyhill
Marshall Meadows
SmeatonCoatbridge
Inverarnan
Whitehouse
Crystal Rig
Dunlaw Extension
Glendoe
North
Hunterston
HunterstonEast
Network Options Assessment 2017/18 – January 2018 44
Boundary B2 cuts across the Scottish mainland from the east coast between Aberdeen and Dundee to near Oban on the west coast. The boundary cuts across the two 275kV double circuits and a 132kV single circuit in the east, as well as the 400/275kV
double circuit overhead line running south from Fort Augustus. As a result it crosses all the main north–south transmission routes from the North of Scotland. High renewables output causes high transfers across this boundary.
3.2.5 Boundary B2 – North to South SHE Transmission
Figure B2.1 Geographic representation of boundary B2

Cha
pter
thre
e
To Northern Ireland
Firth of Forth
Linnmill
Moffat
Fallago
GalashielsGalashiels
Hawick
Harestanes
Kinlochleven
Tummel Bridge
Errochty
Tummel
Denny
Crossaig
Cashlie
New Cumnock
Black Law Extension
Hadyard
Kilgallioch
CumbernaldBainsford
Auchenwynd
B4
B4
Blyth
Fourstones
Sloy
Lochay
Rannoch
Glenlee
Clachan
Errochty
Eccles
Tealing
Torness
Arbroath
Port Ann
Dalmally
LongannetCockenzie
Inveraray
Carradale
Hunterston
Auchencrosh
KilmarnockSouth
TaynuiltCruachan
Whistlefield
Nant
Fort William
Killin Finlarig
Errochty Power Station
Clunie
Fiddes
DudhopeMilton of Craigie
Glenagnes
Lyndhurst
CharlestonBurghmuir
Glenrothes
Westfield
Dunoon
AyrCoylton
Maybole
Coalburn
Elvanfoot
Carsfad
EarlstounGretna
Dumfries Ecclefechan
Berwick
SCOTTISH HYDRO-ELECTRICTRANSMISSION
St. Fillans
DunbarInverkeithing
Dudhope
SP TRANSMISSION LTD
Saltcoats
Meadowhead
Kilwinning
Kaimes
PortobellloShrubhill
MossmorranGlenniston
Redhouse
Leven
Cupar
Currie
GorgieTelford Rd.
Livingston
Bathgate
Grangemouth
DunfemlineKincardine
Devonside
Stirling
Bonnybridge
Easterhouse
Newarthill
WishawBlack LawStrathaven
Clydes Mill
EastKilbrideSouth
Busby
WhiteleeKilmarnockTown
Neilston
ErskineDevolMoor
Helensburgh
StrathlevenSpangoValley
Lambhill
BroxburnWindyhill
Clyde (South)
Clyde (North)
Kendoon
Marshall Meadows
Whitelee Extn
SmeatonCoatbridge
Inverarnan
Whitehouse
Crystal Rig
Dunlaw Extension
Markhill
Arecleoch
North
Hunterston
HunterstonEast
Ewe HillBlackcraig
GlenglassBlack Hill
Dun Hill
Network Options Assessment 2017/18 – January 2018 45
Boundary descriptions
Boundary B4 separates the transmission network at the SP Transmission and SHE Transmission interface, running from the Firth of Tay in the east to near the head of Loch Long in the west. The boundary is crossed by 275kV double circuits to Kincardine and Westfield in the east and two 132kV double
circuits from Sloy to Windyhill in the west, as well as the 220kV cables between Crossaig in Kintyre and Hunterston, the 400/275kV double circuit overhead line into Denny North and the 275/132kV interface at Inverarnan. High renewables output causes high transfers across this boundary.
3.2.6 Boundary B4 – SHE Transmission to SP Transmission
Figure B4.1 Geographic representation of boundary B4
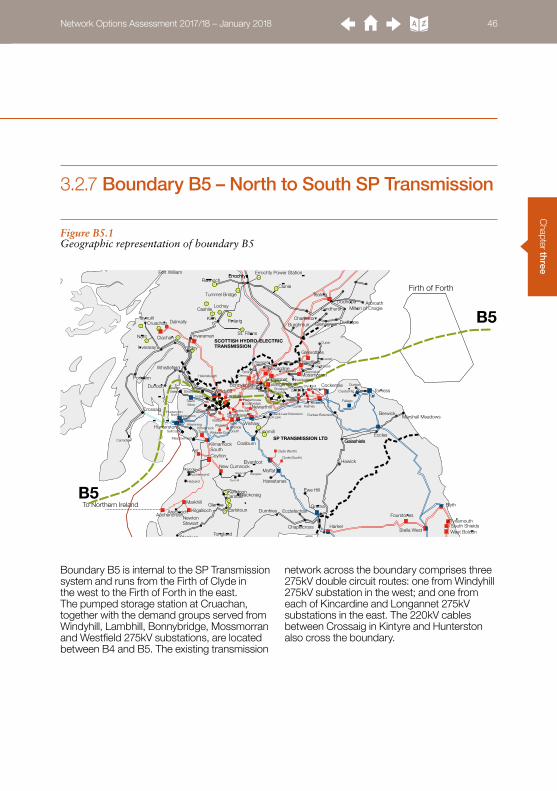
Chapter three
To Northern Ireland
Firth of Forth
Linnmill
Moffat
Fallago
GalashielsGalashiels
Hawick
Harestanes
Tummel Bridge
Errochty
Denny
Crossaig
Cashlie
New Cumnock
Black Law Extension
Hadyard
Kilgallioch
CumbernaldBainsford
Auchenwynd
B5
B5Blyth
HarkerTynemouthSouth ShieldsWest BoldonStella West
Fourstones
Sloy
Lochay
Rannoch
Glenlee
Clachan
Tongland
Errochty
Eccles
Tealing
Torness
Arbroath
Port Ann
Dalmally
LongannetCockenzie
Inveraray
Carradale
Hunterston
Auchencrosh
KilmarnockSouth
TaynuiltCruachan
Whistlefield
Nant
Fort William
Killin Finlarig
Errochty Power Station
Clunie
DudhopeMilton of Craigie
Glenagnes
Lyndhurst
CharlestonBurghmuir
Glenrothes
Westfield
Dunoon
AyrCoylton
Maybole
Coalburn
Elvanfoot
Carsfad
Earlstoun
Chapelcross
GretnaDumfries Ecclefechan
Berwick
SCOTTISH HYDRO-ELECTRICTRANSMISSION
St. Fillans
DunbarInverkeithing
Dudhope
NewtonStewart
SP TRANSMISSION LTD
Saltcoats
Meadowhead
Kilwinning
Kaimes
PortobellloShrubhill
MossmorranGlenniston
Redhouse
Leven
Cupar
Currie
GorgieTelford Rd.
Livingston
Bathgate
Grangemouth
DunfemlineKincardine
Devonside
Stirling
Bonnybridge
Easterhouse
Newarthill
WishawBlack LawStrathaven
Clydes Mill
EastKilbrideSouth
Busby
WhiteleeKilmarnockTown
Neilston
ErskineDevolMoor
Helensburgh
StrathlevenSpangoValley
Lambhill
BroxburnWindyhill
Clyde (South)
Clyde (North)
Kendoon
Marshall Meadows
Whitelee Extn
SmeatonCoatbridge
Inverarnan
Whitehouse
Crystal Rig
Dunlaw Extension
Markhill
Arecleoch
North
Hunterston
HunterstonEast
Ewe HillBlackcraig
GlenglassBlack Hill
Dun Hill
Network Options Assessment 2017/18 – January 2018 46
Boundary B5 is internal to the SP Transmission system and runs from the Firth of Clyde in the west to the Firth of Forth in the east. The pumped storage station at Cruachan, together with the demand groups served from Windyhill, Lambhill, Bonnybridge, Mossmorran and Westfield 275kV substations, are located between B4 and B5. The existing transmission
network across the boundary comprises three 275kV double circuit routes: one from Windyhill 275kV substation in the west; and one from each of Kincardine and Longannet 275kV substations in the east. The 220kV cables between Crossaig in Kintyre and Hunterston also cross the boundary.
3.2.7 Boundary B5 – North to South SP Transmission
Figure B5.1 Geographic representation of boundary B5
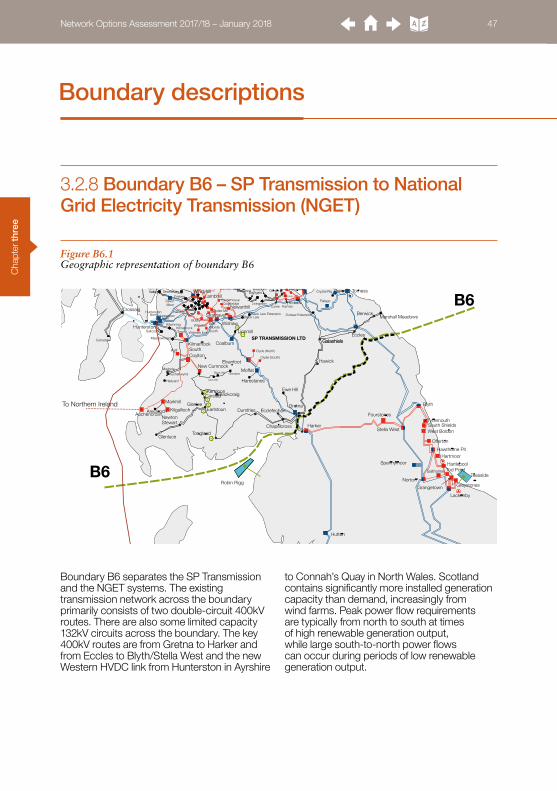
Cha
pter
thre
e
To Northern Ireland
Linnmill
Moffat
Fallago
GalashielsGalashiels
Hawick
Harestanes
Crossaig
New Cumnock
Black Law Extension
Hadyard
Kilgallioch
Bainsford
Auchenwynd
Robin Rigg
Teesside
B6
B6
Blyth
Hutton
Harker
Norton
Offerton
Hartmoor
Tynemouth
Spennymoor
South ShieldsWest Boldon
Hawthorne Pit
HartlepoolTod Point
Grangetown Greystones
Lackenby
Stella West
Fourstones
Glenlee
Tongland
Eccles
Torness
Carradale
Hunterston
Auchencrosh
KilmarnockSouthAyrCoylton
Maybole
Coalburn
Elvanfoot
Carsfad
Earlstoun
Chapelcross
GretnaDumfries Ecclefechan
Berwick
NewtonStewart
Glenluce
SP TRANSMISSION LTD
Saltcoats
Meadowhead
Kilwinning
KaimesCurrie
Gorgie
Livingston
Bathgate
Easterhouse
Newarthill
WishawBlack LawStrathaven
Clydes Mill
EastKilbrideSouth
Busby
WhiteleeKilmarnockTown
Neilston
ErskineDevolMoor
StrathlevenLambhill
Windyhill
Saltholme
Clyde (South)
Clyde (North)
Kendoon
Marshall Meadows
Whitelee Extn
SmeatonCoatbridge
Whitehouse
Crystal Rig
Dunlaw Extension
Markhill
Arecleoch
North
Hunterston
HunterstonEast
Ewe HillBlackcraig
GlenglassBlack Hill
Dun Hill
Network Options Assessment 2017/18 – January 2018 47
Boundary descriptions
Boundary B6 separates the SP Transmission and the NGET systems. The existing transmission network across the boundary primarily consists of two double-circuit 400kV routes. There are also some limited capacity 132kV circuits across the boundary. The key 400kV routes are from Gretna to Harker and from Eccles to Blyth/Stella West and the new Western HVDC link from Hunterston in Ayrshire
to Connah’s Quay in North Wales. Scotland contains significantly more installed generation capacity than demand, increasingly from wind farms. Peak power flow requirements are typically from north to south at times of high renewable generation output, while large south-to-north power flows can occur during periods of low renewable generation output.
3.2.8 Boundary B6 – SP Transmission to National Grid Electricity Transmission (NGET)
Figure B6.1 Geographic representation of boundary B6
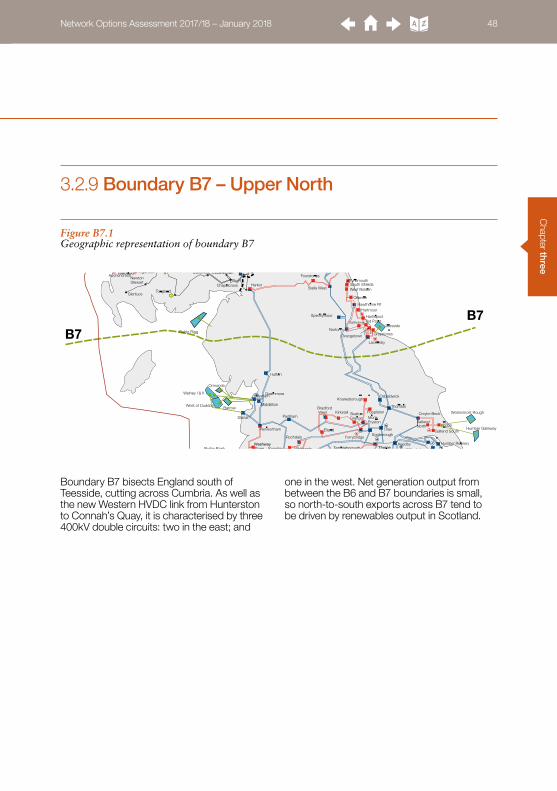
Chapter three
Middleton
Robin Rigg
Barrow
Ormonde
Walney I & II
West of Duddon
Westermost Rough
Humber Gateway
Teesside
B7B7
Drax
Stanah
Hutton
Harker
Elland
Keadby
Norton
Padiham
Heysham
Thornton
Offerton
Rochdale
Hartmoor
Tynemouth
Poppleton
Spennymoor
Penwortham
Osbaldwick
Creyke Beck
Quernmore
FerrybridgeEggborough
SaltendNorth
Saltend South
BradfordWest Kirkstall Skelton
Grange MonkFryston
Humber Refinery
South ShieldsWest Boldon
Hawthorne Pit
HartlepoolTod Point
Grangetown Greystones
Lackenby
Stella West
Fourstones
Tongland
Auchencrosh
Chapelcross
NewtonStewart
Glenluce
Knaresborough
Saltholme
Hedon
Network Options Assessment 2017/18 – January 2018 48
Boundary B7 bisects England south of Teesside, cutting across Cumbria. As well as the new Western HVDC link from Hunterston to Connah’s Quay, it is characterised by three 400kV double circuits: two in the east; and
one in the west. Net generation output from between the B6 and B7 boundaries is small, so north-to-south exports across B7 tend to be driven by renewables output in Scotland.
3.2.9 Boundary B7 – Upper North
Figure B7.1 Geographic representation of boundary B7
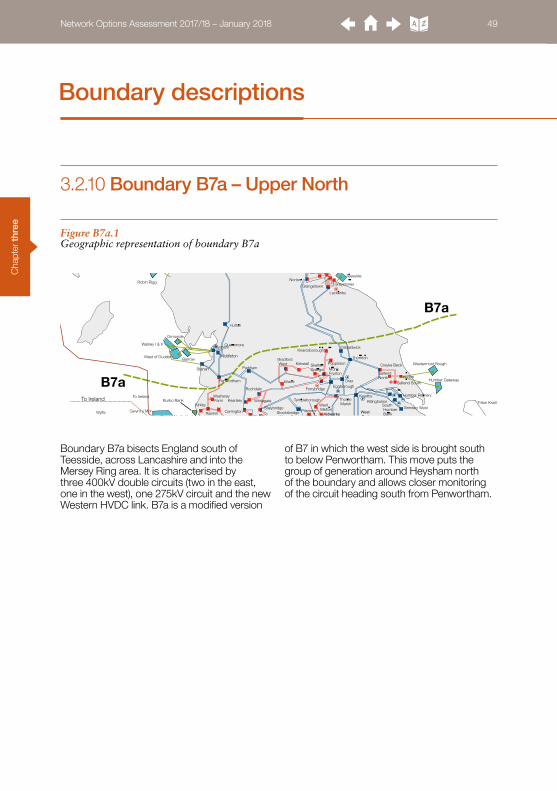
Cha
pter
thre
e
To Ireland
Middleton
Robin Rigg
Barrow
Ormonde
Burbo Bank
Gwynt y Mor
Walney I & II
West of Duddon
Westermost Rough
Humber Gateway
Triton Knoll
Teesside
B7a
B7a
Drax
Wylfa
Stanah
Kirkby
Hutton
Elland
Keadby
Norton
Padiham
Heysham
Pitsmoor
Thornton
Rochdale
Poppleton
Penwortham
Osbaldwick
Creyke Beck
Grimsby WestRainhill
WashwayFarm
Carrington
Kearsley Whitegate
Stalybridge
Quernmore
FerrybridgeEggborough
ThorpeMarsh
TempleboroughWestMelton
Stocksbridge
SaltendNorth
Saltend South
SouthHumberBank
BradfordWest Kirkstall Skelton
Grange MonkFryston
Killingholme
Humber Refinery
Grangetown Greystones
Lackenby
Knaresborough
Hedon
To Ireland
Network Options Assessment 2017/18 – January 2018 49
Boundary descriptions
Boundary B7a bisects England south of Teesside, across Lancashire and into the Mersey Ring area. It is characterised by three 400kV double circuits (two in the east, one in the west), one 275kV circuit and the new Western HVDC link. B7a is a modified version
of B7 in which the west side is brought south to below Penwortham. This move puts the group of generation around Heysham north of the boundary and allows closer monitoring of the circuit heading south from Penwortham.
3.2.10 Boundary B7a – Upper North
Figure B7a.1 Geographic representation of boundary B7a

Chapter three
To Ireland
Connah’s Quay
Middleton
SuttonBridge
Barrow
Rhyl Flats
Burbo Bank
Gwynt y Mor
West of Duddon
Westermost Rough
Humber Gateway
Sheringham Shoal
North Hoyle
Lynn
Inner Dowsing
Triton Knoll
Lincs
Race Bank Dudgeon
Scroby sands
B8
B8
Penn
Drax
Wylfa
Legacy
Stanah
Pentir
Kirkby
Elland
Keadby
Cottam
Kitwell
Walpole
Grendon
Padiham
Rugeley
Norwich Main
Enderby
Bredbury
Drakelow
Pitsmoor
Neepsend
Aldwarke
Sizewell
Thornton
Rochdale
Feckenham
Poppleton
Bicker Fen
Staythorpe
Ffestiniog
Penwortham
Shrewsbury
Willington
Cellarhead
Creyke Beck
Trawsfynydd
Grimsby West
Chesterfield
Burwell Main
Dinorwig
Rainhill
Capenhurst
Frodsham
WashwayFarm
South Manchester
Carrington
DainesFiddlersFerry
Macclesfield
Kearsley Whitegate
Stalybridge
Coventry
Nechells
Willenhall Bustleholm
Hams Hall
BerkswellOldbury
Ironbridge
Ocker Hill
SpaldingNorth
FerrybridgeEggborough
ThorpeMarsh
Thurcroft
Brinsworth
HighMarnham
TempleboroughWestMelton
Norton LeesJordanthorpe
Sheffield City
Winco BankStocksbridge West
Burton
SaltendNorth
Saltend South
SouthHumberBank
BradfordWest Kirkstall Skelton
Grange MonkFryston
Killingholme
Humber Refinery
Stoke Bardolph
Bushbury
Bodelwyddan
Hedon
To Ireland
Ratcliffeon Soar
Rocksavage
Necton
FlintshireBridge
Network Options Assessment 2017/18 – January 2018 50
The North-to-Midlands boundary B8 is one of the wider boundaries that intersects the centre of GB, separating the northern generation zones – including Scotland, Northern England and North Wales – from the Midlands and southern demand centres. The boundary
crosses four major 400kV double circuits, with two of these passing through the East Midlands, the other two passing through the West Midlands, and a limited 275kV connection to South Yorkshire.
3.2.11 Boundary B8 – North to Midlands
Figure B8.1 Geographic representation of boundary B8

Cha
pter
thre
e
To Ireland
Connah’s Quay
SuttonBridge
Rhyl Flats
Burbo Bank
Gunfleet Sands I&II
Gwynt y Mor
Greater Gabbard 500MW
Sheringham Shoal
North Hoyle
Lynn
Inner Dowsing
Triton Knoll
Lincs
Race Bank Dudgeon
Scroby sands
B9
B9
Penn
Wylfa
Sundon
Legacy
Pentir
Kirkby
Walham
Pelham
Keadby
Cowley
Rassau
Cottam
Kitwell
Walpole
Grendon
Rugeley
Norwich Main
Enderby
Bramford
Bredbury
Drakelow
Pitsmoor
Neepsend
Aldwarke
Sizewell
Pembroke
Rye House
Wymondley
Feckenham
Bicker Fen
Staythorpe
Ffestiniog
Shrewsbury
Willington
Cellarhead
EatonSocon
Trawsfynydd
Grimsby West
Chesterfield
Burwell Main
Dinorwig
Rainhill
Capenhurst
Frodsham
WashwayFarm
South Manchester
Carrington
DainesFiddlersFerry
Macclesfield
Kearsley Whitegate
Stalybridge
Braintree
WalthamCross
Swansea North
ImperialPark
Coventry
Nechells
Willenhall Bustleholm
Hams Hall
BerkswellOldbury
Bishops Wood
Ironbridge
Ocker Hill
SpaldingNorth
PatfordBridge
ThorpeMarsh
Thurcroft
Brinsworth
HighMarnham
TempleboroughWestMelton
Norton LeesJordanthorpe
Sheffield City
Winco BankStocksbridge West
Burton
SouthHumberBank
Killingholme
Humber Refinery
East Claydon
Watford Elstree
LeightonBuzzard
Amersham Main Hackney
Brimsdown
Stoke Bardolph
Bushbury
Bodelwyddan
To Ireland
Ratcliffeon Soar
Rocksavage
Necton
FlintshireBridge
Rhigos
Highbury
Network Options Assessment 2017/18 – January 2018 51
Boundary descriptions
The Midlands-to-South boundary B9 separates the northern generation zones and the Midlands from the southern demand centres. The boundary crosses five major
400kV double circuits, transporting power from the north over a long distance to the southern demand hubs, including London.
3.2.12 Boundary B9 – Midlands to South
Figure B9.1 Geographic representation of boundary B9

Chapter three
Network Options Assessment 2017/18 – January 2018 52
The South and East region includes East Anglia, London and stretches along the south coast to Devon and Cornwall. It has a high concentration of power demand and generation, with much of the demand found
in London and generation in the Thames Estuary. Interconnection to continental Europe is present on the south coast, and influences power flows in the region by being able to import and export power with Europe.
3.3 The South and East of England region
3.3.1 Introduction
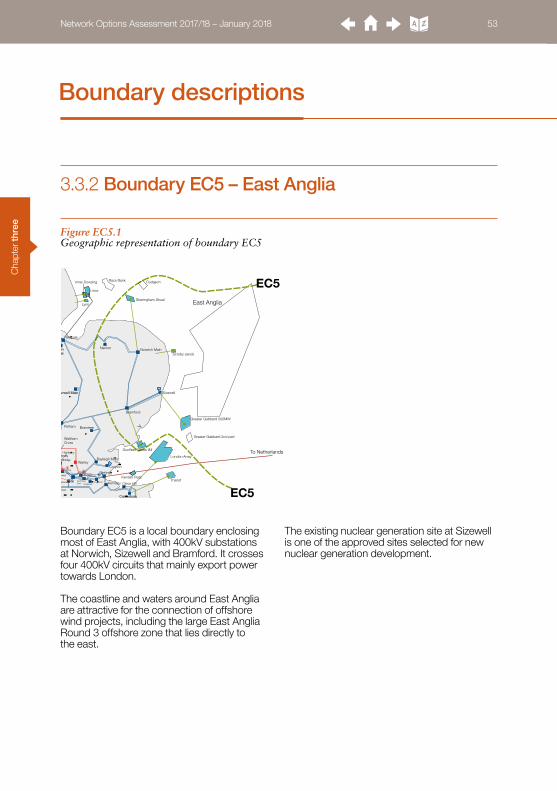
Cha
pter
thre
e
To Netherlands
East Anglia
Kentish Flats
Gunfleet Sands I&II
London Array
Thanet
Greater Gabbard 500MW
Sheringham Shoal
Greater Gabbard 2nd part
Lynn
Inner Dowsing
Lincs
Race Bank Dudgeon
Scroby sands
EC5
EC5
Grain
Pelham
Warley
Kemsley
Walpole
Norwich Main
Bramford
Sizewell
Braintree
WalthamCross
Rayleigh Main
Coryton
SinglewellKingsnorth
Barking
Tilbury
NorthfleetEast
West Thurrock
Cleve Hill
Necton
Highbury
Network Options Assessment 2017/18 – January 2018 53
Boundary descriptions
Boundary EC5 is a local boundary enclosing most of East Anglia, with 400kV substations at Norwich, Sizewell and Bramford. It crosses four 400kV circuits that mainly export power towards London.
The coastline and waters around East Anglia are attractive for the connection of offshore wind projects, including the large East Anglia Round 3 offshore zone that lies directly to the east.
The existing nuclear generation site at Sizewell is one of the approved sites selected for new nuclear generation development.
3.3.2 Boundary EC5 – East Anglia
Figure EC5.1 Geographic representation of boundary EC5

Chapter three
Iver
Fleet
Hurst
SundonPelham
Warley
Laleham
Rowdown
Rye House
WymondleyBraintree
WalthamCross
SinglewellLittlebrook
Beddington
Chessington
West Weybridge
St JohnsWood
Ealing
Willesden
Watford Elstree
Tottenham Redbridge
Barking
LeightonBuzzard
TilburyCity Rd
New Cross
Hackney
Brimsdown
West Ham
NorthfleetEast
West Thurrock
Mill Hill
B14
Kensal Green
Highbury
PuddingMill
Wimbledon
B14/B14e
HIGHBURY
DAMHEADCREEK
WESTHAM
CITY ROAD
KENSALGREEN
ST. JOHN’SWOOD
PUDDINGMILL
KEMSLEY
11 21 2
1
2
1 2
12
HACKNEY
1 1WIMBLEDON
22 LITTLEBROOKHURSTNEW CROSS
BARKING
1
2
2
2
1 1
1
BRAINTREE
22
2
EATONSOCON
BURWELLMAIN
PELHAM
RYE HOUSE
SUNDON WYMONDLEYMAIN
GRENDON
ENDERBY
1
2
2
1 1
1
1
1 1 1 1
1
11
1
11
1
2
21
W E
34
12
IVER WATFORDSOUTH
LALEHAM
EALINGWILLESDEN
2
1WESTWEYBRIDGE
MAINAMERSHAM
BRAMFORD
1
1
2
1
BEDDINGTON
CHESSINGTON1
22
ROWDOWN
22
2
2 2 2 2
2
2
2 2 2
1
TILBURY
2
22
2
REDBRIDGE
BRIMSDOWN
WALTHAMCROSS
WARLEY
ELSTREE
MILL HILL
PATFORDBRIDGE
EASTCLAYDON
LEIGHTONBUZZARD
NORTHFLEETEAST
1
1
SINGLEWELL
WESTTHURROCK
3 1
2
Network Options Assessment 2017/18 – January 2018 54
Boundary B14 encloses London, and is characterised by high local demand and a small amount of generation. The circuits entering from the north can be heavily loaded
during winter peak conditions. The circuits are further stressed when the European interconnectors export to the continent.
3.3.3 Boundary B14 – London
Figure B14.1 Geographic and single-line representation of boundary B14

Cha
pter
thre
e
To France
To Netherlands
Rampion
Kentish Flats
Gunfleet Sands I&II
London Array
Thanet
Greater Gabbard 500MW
Greater Gabbard 2nd part
Iver
Fleet
GrainHurst
SundonPelham
Warley
Cowley
Bolney
KemsleyLaleham
Grendon
Rowdown
NinfieldLovedean
Bramford
Sizewell
Rye House
Sellindge
Wymondley
EatonSocon
Burwell Main
Dungeness
CanterburyNorth
Braintree
WalthamCross
Culham
PatfordBridge
Rayleigh Main
Coryton
SinglewellKingsnorthLittlebrook
Beddington
Chessington
West Weybridge
St JohnsWood
Ealing
Willesden
Watford Elstree
Tottenham Redbridge
Barking
LeightonBuzzard
Amersham Main
TilburyCity Rd
New Cross
Hackney
Brimsdown
West Ham
NorthfleetEast
West Thurrock
Cleve Hill
Mill Hill
Kensal Green
Highbury
PuddingMill
Wimbledon
L 1E
L 1E
Network Options Assessment 2017/18 – January 2018 55
Boundary descriptions
Boundary LE1 covers London and the areas to the south and east of it. Within London there is high local demand and relatively small levels of generation. The south east part contains both high demand and relatively high levels of generation. In addition there are several
current and potential future interconnectors to mainland Europe. Six 400kV double circuits cross the boundary, and loadings on these circuits depend more and more on flows on interconnectors to or from GB.
3.3.4 Boundary LE1 – South East
Figure LE1.1 Geographic representation of boundary LE1
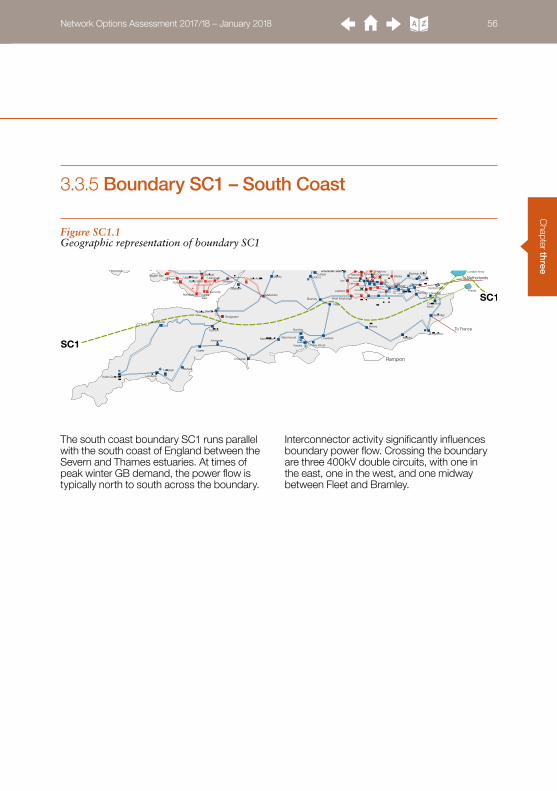
Chapter three
To France
To Netherlands
Rampion
Kentish Flats
London Array
Thanet
SC1
SC1
PyleIver
Fleet
Abham
GrainHurst
MargamWarley
Bolney
Minety
Exeter
Fawley
Didcot
Seabank
Taunton
Kemsley
Whitson
Laleham
Rowdown
NinfieldLovedean
Nursling
MelkshamAberthaw
Landulph
Sellindge
Cilfynydd
Axminster
Bridgwater
Mannington
Chickerell
Alverdiscott
Langage
Indian Queens
Hinkley Point
Dungeness
CanterburyNorth
Baglan Bay
CardiffEast
Tremorfa
Alpha SteelUpper Boat Uskmouth Iron Acton
Marchwood
Botley Wood
Bramley
Culham Rayleigh Main
Coryton
SinglewellKingsnorthLittlebrook
Beddington
Chessington
West Weybridge
St JohnsWood
Ealing
Willesden
Tottenham Redbridge
Barking
TilburyCity Rd
New Cross
Hackney
West Ham
NorthfleetEast
West Thurrock
Cleve Hill
Mill Hill
Kensal Green
PuddingMill
Wimbledon
Network Options Assessment 2017/18 – January 2018 56
The south coast boundary SC1 runs parallel with the south coast of England between the Severn and Thames estuaries. At times of peak winter GB demand, the power flow is typically north to south across the boundary.
Interconnector activity significantly influences boundary power flow. Crossing the boundary are three 400kV double circuits, with one in the east, one in the west, and one midway between Fleet and Bramley.
3.3.5 Boundary SC1 – South Coast
Figure SC1.1 Geographic representation of boundary SC1
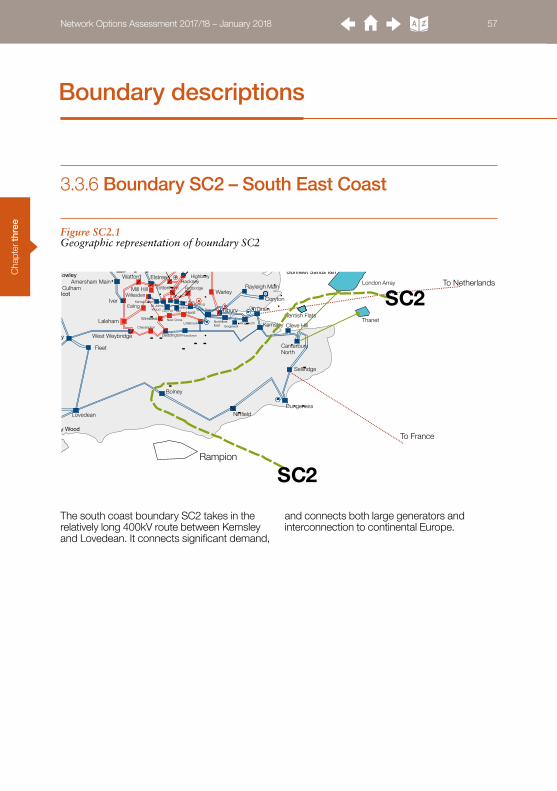
Cha
pter
thre
e
To France
To Netherlands
Rampion
Kentish Flats
London Array
Thanet
Iver
Fleet
GrainHurst
Warley
Bolney
KemsleyLaleham
Rowdown
NinfieldLovedean
Sellindge
Dungeness
CanterburyNorth
Culham Rayleigh Main
Coryton
SinglewellKingsnorthLittlebrook
Wimbledon
Beddington
Chessington
West Weybridge
St JohnsWood
Ealing
Willesden
Watford Elstree
Tottenham Redbridge
Barking
Amersham Main
TilburyCity Rd
New Cross
Hackney
West Ham
NorthfleetEast
West Thurrock
Cleve Hill
Mill Hill
S 2C
S 2C
Kensal Green
Highbury
PuddingMill
Network Options Assessment 2017/18 – January 2018 57
Boundary descriptions
The south coast boundary SC2 takes in the relatively long 400kV route between Kemsley and Lovedean. It connects significant demand,
and connects both large generators and interconnection to continental Europe.
3.3.6 Boundary SC2 – South East Coast
Figure SC2.1 Geographic representation of boundary SC2

Chapter three
B13
B13
Pyle
Abham
Exeter
Fawley
Seabank
Taunton
Whitson
Nursling
MelkshamAberthaw
Landulph
Axminster
Bridgwater
Mannington
Chickerell
Alverdiscott
Langage
Indian Queens
Hinkley Point
CardiffEast
Tremorfa
Alpha Steel
Marchwood
Botley Wood
Bramley
Network Options Assessment 2017/18 – January 2018 58
3.3.7 Boundary B13 – South West
Figure B13.1 Geographic representation of boundary B13
Wider boundary B13 is defined as the southernmost tip of GB, below the Severn Estuary, encompassing Hinkley Point in the south west and stretching as far east
as Mannington. The boundary crossing circuits are the Hinkley Point to Melksham 400kV double circuit, and the 400kV circuits from Mannington to Nursling and Fawley.

Cha
pter
thre
eNetwork Options Assessment 2017/18 – January 2018 59
Boundary descriptions
The Wales and West Midlands region is dominated by North Wales boundaries while other boundaries in the region aren’t active.
3.4 Wales and West Midlands region
3.4.1 Introduction

Chapter three
To Ireland
Connah’s Quay
MiddletonBarrow
Ormonde
Rhyl Flats
Burbo Bank
Gwynt y Mor
Walney I & II
West of Duddon
North Hoyle
NW2
NW3
NW2NW3
Penn
Wylfa
Legacy
Stanah
Pentir
Kirkby
Hutton
WalhamRassau
Kitwell
Padiham
Rugeley
Heysham
Bredbury
Rochdale
Ffestiniog
Penwortham
Shrewsbury
Trawsfynydd
Dinorwig
Rainhill
Capenhurst
Frodsham
WashwayFarm
South Manchester
Carrington
DainesFiddlersFerry
Kearsley Whitegate
ImperialPark
Quernmore
Bishops Wood
Ironbridge
Ocker Hill
Bodelwyddan
To Ireland
Rocksavage
FlintshireBridge
Rhigos
Network Options Assessment 2017/18 – January 2018 60
3.4.2 Boundary NW2 and NW3 North Wales
The onshore network in North Wales comprises a 400kV circuit ring that connects Pentir, Deeside/Connah’s Quay and Trawsfynydd substations. A short 400kV double-circuit cable spur from Pentir connects Dinorwig pumped-storage power station.
Pentir and Trawsfynydd are within the Snowdonia National Park, and are connected by a single 400kV circuit, which is the main limiting factor for capacity in this area. The two ‘NW’ boundaries are local boundaries.
Figure NW.1 Geographic representation of North Wales boundaries NW2 and NW3
Cha
pter
thre
e
Boundary NW2 – Anglesey and CaernarvonshireBoundary NW2 bisects the North Wales mainland close to Anglesey. It crosses through the Pentir to Deeside/Connah’s Quay 400kV double circuit and the Trawsfynydd 400kV single circuit.
Boundary NW3 – Anglesey, Caernarvonshire and MerionethshireBoundary NW3 provides capacity for further generation connections, in addition to those behind NW2. It is defined by a pair of 400kV double circuits from Pentir to Deeside/Connah’s Quay, and from Trawsfynydd to the Treuddyn Tee.
Network Options Assessment 2017/18 – January 2018 61
Boundary descriptions

Network Options Assessment 2017/18 – January 2018 62
Chapter fourProposed options 63
Network Options Assessment 2017/18 – January 2018 62
Cha
pter
four
Network Options Assessment 2017/18 – January 2018 63
We have included the options for connecting the Scottish islands, although radial rather than benefiting particular boundaries, because they are SWW. Appendix B includes options that have started the SWW process. For each option we have included the status of the option, whether it is build or reduced-build, and some background.
The NOA methodology gives more details about options that are classed as reduced-build, but these typically include operational solutions or asset-light options. Asset-light options are options that require little expenditure, and do not typically require the addition or replacement of large assets. Such options can include things like overhead line conductor re-profiling to increase operating temperature limits, or additional cooling on existing assets.
For NOA 2017/18 we have carried out assessments to identify options that could provide a benefit for boundary transfers. Because of the changes to generation and demand patterns this year, the reduced-build options are limited to the thermal uprating or re-profiling options that the TOs have submitted.
As SO, we also have a role in identifying any offshore options that may provide an alternative solution to onshore options to meet the identified boundary transfer requirements. The feasibility of introducing interconnection between offshore generation depends on the status and timing of such offshore connections. Any additional offshore works (regardless of whether developer associated or non-developer associated) will require the participation of relevant current Offshore Transmission System Development
User Works (OTSDUW) Users, as it will affect their design and construction programme. In addition to that, the technology used in offshore connections is still developing, and hence there is a level of uncertainty in the design of the connection. This makes it harder to finalise the works required for the Offshore Wider Works (OWW). The cost of establishing any OWW after generators have been connected incurs high cost and major modifications to the offshore transmission networks owned by multiple Offshore TOs (OFTOs). For these reasons, no offshore options have been identified this year. We are planning further consultations with relevant parties on potential offshore interconnected designs – based on cost–benefit analysis – as certainty on technology choices increase and integration opportunities arise.
Our methodology for the SO’s assessment of OWW is available for viewing and comment alongside the NOA methodology.
www.nationalgrid.com/noa
4.1 Introduction
This chapter lists the reinforcement options that could increase the NETS boundary capability as part of network planning.
Proposed options
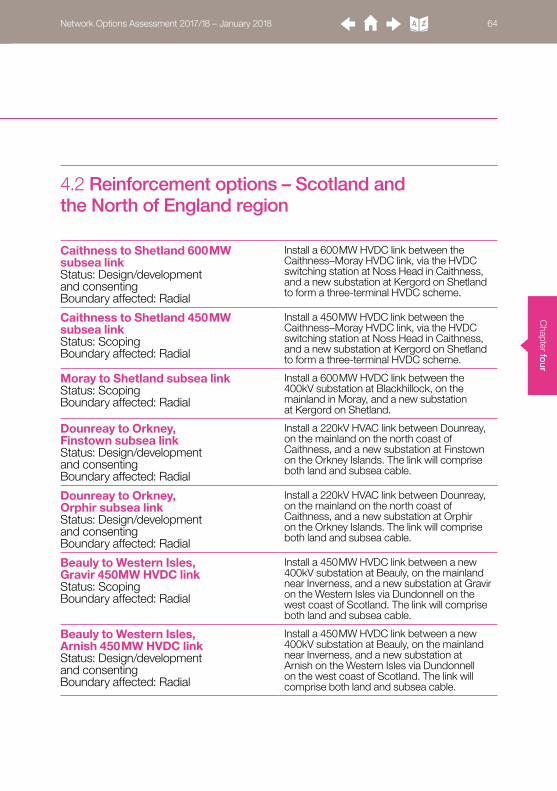
Chapter fo
ur
Caithness to Shetland 600 MW subsea linkStatus: Design/development and consentingBoundary affected: Radial
Install a 600 MW HVDC link between the Caithness–Moray HVDC link, via the HVDC switching station at Noss Head in Caithness, and a new substation at Kergord on Shetland to form a three-terminal HVDC scheme.
Caithness to Shetland 450 MW subsea linkStatus: ScopingBoundary affected: Radial
Install a 450 MW HVDC link between the Caithness–Moray HVDC link, via the HVDC switching station at Noss Head in Caithness, and a new substation at Kergord on Shetland to form a three-terminal HVDC scheme.
Moray to Shetland subsea linkStatus: ScopingBoundary affected: Radial
Install a 600 MW HVDC link between the 400kV substation at Blackhillock, on the mainland in Moray, and a new substation at Kergord on Shetland.
Dounreay to Orkney, Finstown subsea linkStatus: Design/development and consentingBoundary affected: Radial
Install a 220kV HVAC link between Dounreay, on the mainland on the north coast of Caithness, and a new substation at Finstown on the Orkney Islands. The link will comprise both land and subsea cable.
Dounreay to Orkney, Orphir subsea linkStatus: Design/development and consentingBoundary affected: Radial
Install a 220kV HVAC link between Dounreay, on the mainland on the north coast of Caithness, and a new substation at Orphir on the Orkney Islands. The link will comprise both land and subsea cable.
Beauly to Western Isles, Gravir 450MW HVDC linkStatus: ScopingBoundary affected: Radial
Install a 450 MW HVDC link between a new 400kV substation at Beauly, on the mainland near Inverness, and a new substation at Gravir on the Western Isles via Dundonnell on the west coast of Scotland. The link will comprise both land and subsea cable.
Beauly to Western Isles, Arnish 450 MW HVDC linkStatus: Design/development and consentingBoundary affected: Radial
Install a 450 MW HVDC link between a new 400kV substation at Beauly, on the mainland near Inverness, and a new substation at Arnish on the Western Isles via Dundonnell on the west coast of Scotland. The link will comprise both land and subsea cable.
Network Options Assessment 2017/18 – January 2018 64
4.2 Reinforcement options – Scotland and the North of England region
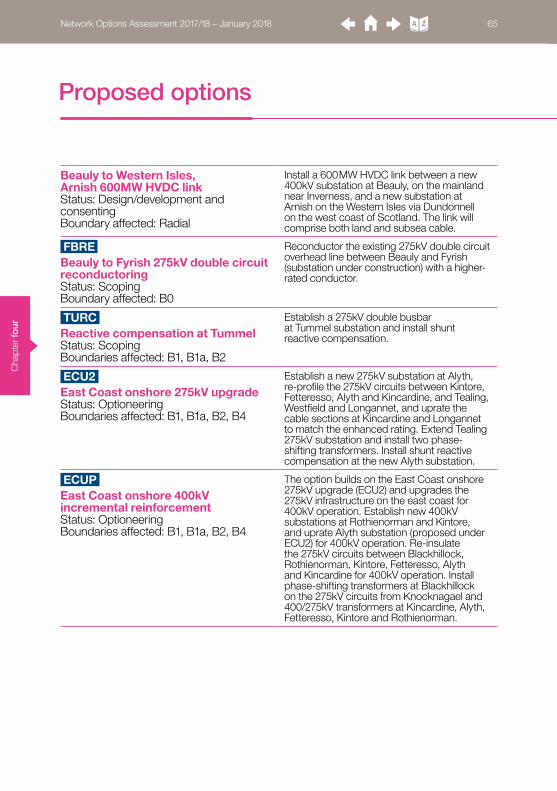
Cha
pter
four
Beauly to Western Isles, Arnish 600MW HVDC linkStatus: Design/development and consentingBoundary affected: Radial
Install a 600 MW HVDC link between a new 400kV substation at Beauly, on the mainland near Inverness, and a new substation at Arnish on the Western Isles via Dundonnell on the west coast of Scotland. The link will comprise both land and subsea cable.
FBRE Beauly to Fyrish 275kV double circuit reconductoringStatus: ScopingBoundary affected: B0
Reconductor the existing 275kV double circuit overhead line between Beauly and Fyrish (substation under construction) with a higher-rated conductor.
TURC Reactive compensation at TummelStatus: ScopingBoundaries affected: B1, B1a, B2
Establish a 275kV double busbar at Tummel substation and install shunt reactive compensation.
ECU2 East Coast onshore 275kV upgradeStatus: OptioneeringBoundaries affected: B1, B1a, B2, B4
Establish a new 275kV substation at Alyth, re-profile the 275kV circuits between Kintore, Fetteresso, Alyth and Kincardine, and Tealing, Westfield and Longannet, and uprate the cable sections at Kincardine and Longannet to match the enhanced rating. Extend Tealing 275kV substation and install two phase-shifting transformers. Install shunt reactive compensation at the new Alyth substation.
ECUP East Coast onshore 400kV incremental reinforcementStatus: OptioneeringBoundaries affected: B1, B1a, B2, B4
The option builds on the East Coast onshore 275kV upgrade (ECU2) and upgrades the 275kV infrastructure on the east coast for 400kV operation. Establish new 400kV substations at Rothienorman and Kintore, and uprate Alyth substation (proposed under ECU2) for 400kV operation. Re-insulate the 275kV circuits between Blackhillock, Rothienorman, Kintore, Fetteresso, Alyth and Kincardine for 400kV operation. Install phase-shifting transformers at Blackhillock on the 275kV circuits from Knocknagael and 400/275kV transformers at Kincardine, Alyth, Fetteresso, Kintore and Rothienorman.
Network Options Assessment 2017/18 – January 2018 65
Proposed options

Chapter fo
ur
ECU4 East Coast onshore 400kV reinforcementStatus: OptioneeringBoundaries affected: B1, B1a, B2, B4
Upgrade the 275kV infrastructure on the east coast for 400kV operation by establishing new 400kV substations at Rothienorman, Kintore and Alyth, and re-insulating the 275kV circuits between Blackhillock, Rothienorman, Kintore, Fetteresso, Alyth and Kincardine to 400kV. Install phase-shifting transformers at Blackhillock on the 275kV circuits from Knocknagael and 400/275kV transformers at Kincardine, Alyth, Fetteresso, Kintore and Rothienorman. Re-profile the 275kV circuits between Tealing, Westfield and Longannet, and uprate the cable sections at Longannet to match the enhanced rating.
WLTI Windyhill–Lambhill–Longannet 275kV circuit turn-in to Denny North 275kV substationStatus: DesignBoundary affected: B5
Turn the Windyhill–Lambhill–Longannet 275kV circuit into Denny North 275kV Substation to create a 275kV Windyhill–Lambhill–Denny North circuit and a Denny North–Longannet No.2 275kV circuit.
DNEU Denny North 400/275kV SuperGrid Transformer 2Status: ScopingBoundaries affected: B1, B1a, B2
Installation of a new 400/275kV 1000MVA supergrid transformer (SGT2) at Denny North 400kV substation.
DWNO Denny to Wishaw 400kV reinforcementStatus: OptioneeringBoundaries affected: B4, B5, B6
Construct a new 400kV double circuit overhead line from Bonnybridge to Newarthill, and reconfigure associated sites to establish a fourth north-to-south double circuit Supergrid route through the Scottish central belt. One side of the new overhead line will operate at 400kV, the other at 275kV. This reinforcement will establish Denny–Bonnybridge, Bonnybridge–Wishaw, Wishaw–Strathaven No.2 and Wishaw–Torness 400kV circuits, and a Denny–Newarthill– Easterhouse 275kV circuit.
HNNO Hunterston East–Neilston 400kV ReinforcementStatus: ScopingBoundary affected: B5
Modification of the Hunterston East–Devol Moor 400kV circuit to become the Hunterston East–Neilston 400kV double circuit overhead line (OHL), and development of a new 400/275kV supergrid transformer (SGT4) at Neilston 400kV substation.
EHRE Elvanfoot to Harker reconductoringStatus: ScopingBoundary affected: B6
Replace the double circuit conductors in the Elvanfoot to Harker circuits with a higher-rated conductor to increase their thermal ratings.
Network Options Assessment 2017/18 – January 2018 66

Cha
pter
four
E2DC Eastern subsea HVDC Link from Torness to Hawthorn PitStatus: ScopingBoundaries affected: B5, B6, B7, B7a, B8
Construct a new offshore 2 GW HVDC subsea link from the Torness area to Hawthorn Pit to provide additional transmission capacity. The onshore works involve the construction of AC/DC converter stations and the associated AC works at Torness and Hawthorn Pit.
TLNO Torness to north east England AC reinforcementStatus: ScopingBoundaries affected: B6, B7, B7a, B8
This option provides additional transmission capacity by installing a double circuit from a new 400kV substation in the Torness area to a suitable connection point in north east England.
E4DC Eastern subsea HVDC Link from Peterhead to Hawthorn PitStatus: ScopingBoundaries affected: B1, B1a, B2, B4, B5, B6, B7, B7a, B8
Construct a new offshore 2GW HVDC subsea link from Peterhead in the north east of Scotland to Hawthorn Pit in the north of England. The onshore works involve the construction of AC/DC converter stations at Peterhead and Hawthorn Pit, and the associated AC works. In Scotland, the onshore works include the construction of new 400kV substations at Peterhead and Rothienorman and the reinsulation of the Peterhead to Blackhillock 275kV route to 400kV.
WHTI/WHT2 Turn-in of West Boldon to Hartlepool circuit at Hawthorn PitStatus: ScopingBoundaries affected: B6, B7, B7a
Turn-in the West Boldon to Hartlepool circuit, which currently passes the Hawthorn Pit site to connect to it. This would create new West Boldon to Hawthorn Pit and Hawthorn Pit to Hartlepool circuits. This would ensure better load flow sharing and increased connectivity in the north east 275kV ring. The two options have different delivery years.
HAE2 Harker SuperGrid Transformer 5 replacementStatus: Project not startedBoundaries affected: B6, B7, B7a
Replacing an existing transformer at Harker substation with a new one of higher rating to prevent overloading following transmission system faults.
HAEU Harker SuperGrid Transformer 6 replacementStatus: Project not startedBoundaries affected: B6, B7, B7a
Replacing an existing transformer at Harker substation with a new one of higher rating to prevent overloading following transmission system faults.
Network Options Assessment 2017/18 – January 2018 67
Proposed options
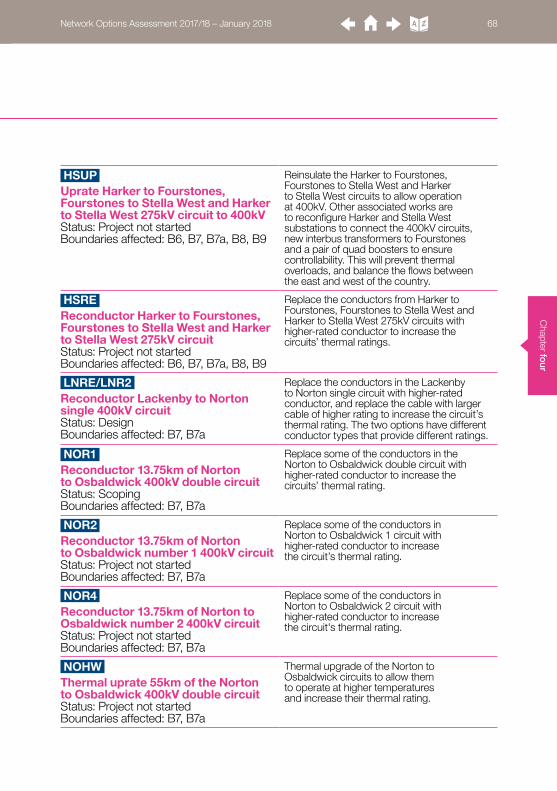
Chapter fo
ur
HSUP Uprate Harker to Fourstones, Fourstones to Stella West and Harker to Stella West 275kV circuit to 400kVStatus: Project not startedBoundaries affected: B6, B7, B7a, B8, B9
Reinsulate the Harker to Fourstones, Fourstones to Stella West and Harker to Stella West circuits to allow operation at 400kV. Other associated works are to reconfigure Harker and Stella West substations to connect the 400kV circuits, new interbus transformers to Fourstones and a pair of quad boosters to ensure controllability. This will prevent thermal overloads, and balance the flows between the east and west of the country.
HSRE Reconductor Harker to Fourstones, Fourstones to Stella West and Harker to Stella West 275kV circuit Status: Project not startedBoundaries affected: B6, B7, B7a, B8, B9
Replace the conductors from Harker to Fourstones, Fourstones to Stella West and Harker to Stella West 275kV circuits with higher-rated conductor to increase the circuits’ thermal ratings.
LNRE/LNR2 Reconductor Lackenby to Norton single 400kV circuit Status: DesignBoundaries affected: B7, B7a
Replace the conductors in the Lackenby to Norton single circuit with higher-rated conductor, and replace the cable with larger cable of higher rating to increase the circuit’s thermal rating. The two options have different conductor types that provide different ratings.
NOR1 Reconductor 13.75km of Norton to Osbaldwick 400kV double circuitStatus: ScopingBoundaries affected: B7, B7a
Replace some of the conductors in the Norton to Osbaldwick double circuit with higher-rated conductor to increase the circuits’ thermal rating.
NOR2 Reconductor 13.75km of Norton to Osbaldwick number 1 400kV circuitStatus: Project not startedBoundaries affected: B7, B7a
Replace some of the conductors in Norton to Osbaldwick 1 circuit with higher-rated conductor to increase the circuit’s thermal rating.
NOR4 Reconductor 13.75km of Norton to Osbaldwick number 2 400kV circuit Status: Project not startedBoundaries affected: B7, B7a
Replace some of the conductors in Norton to Osbaldwick 2 circuit with higher-rated conductor to increase the circuit's thermal rating.
NOHW Thermal uprate 55km of the Norton to Osbaldwick 400kV double circuit Status: Project not startedBoundaries affected: B7, B7a
Thermal upgrade of the Norton to Osbaldwick circuits to allow them to operate at higher temperatures and increase their thermal rating.
Network Options Assessment 2017/18 – January 2018 68

Cha
pter
four
LTR3 Lackenby to Thornton 1 circuit thermal upgrade Status: Project not startedBoundaries affected: B7, B7a
Thermal upgrade of the Lackenby to Thornton 1 circuit to allow it to operate at higher temperatures and increase its thermal rating.
SPDC Stella West to Padiham HVDC Link Status: Project not startedBoundaries affected: B6, B7, B7a, B8, B9
Construct a new onshore 1 GW HVDC Link from Stella West to Padiham to improve the power flow around the eastern side of the network. The works involve the construction of AC/DC converter stations, and reconfiguration of Stella West and Padiham substations.
HPNO New east–west circuit between the north east and Lancashire Status: Project not startedBoundary affected: B8
Construct a new 400kV double circuit in the north of England, to increase power export capability from the north of England into the rest of the transmission system. At this time the exact landing points are to be determined. This is the first of two outline options.
NPNO New east–west circuit between the north east and Lancashire Status: Project not startedBoundary affected: B8
Construct a new 400kV double circuit in the north of England, to increase power export capability from the north of England into the rest of the transmission system. At this time the exact landing points are to be determined. This is the second of two outline options.
CPRE Reconductor sections of Penwortham to Padiham and Penwortham to Carrington Status: Project not startedBoundary affected: B7a
Replace some of the conductor sections in the Penwortham to Padiham and Penwortham to Carrington circuits with higher-rated conductor to increase the circuits’ thermal rating.
CPR2 Reconductor the remaining sections of Penwortham to Padiham and Penwortham to Carrington Status: Project not startedBoundary affected: B7a
Replace the remaining conductor sections on the Penwortham to Padiham and Penwortham to Carrington circuits with higher-rated conductor to increase the circuits’ thermal rating. This follows another scheme (CPRE) to uprate the circuits.
OTHW Osbaldwick to Thornton 1 circuit thermal upgrade Status: Project not startedReduced build optionBoundaries affected: B7, B7a, B8
Thermal upgrade of the Osbaldwick to Thornton 1 circuit to allow it to operate at higher temperatures and increase its thermal rating.
LDQB Lister Drive quad booster Status: DesignBoundary affected: B7a
Replacing the series reactor at Lister Drive with a quad booster to allow better control of power flows through the single cable to Birkenhead and avoid thermal overloads in the Mersey Ring area.
Network Options Assessment 2017/18 – January 2018 69
Proposed options
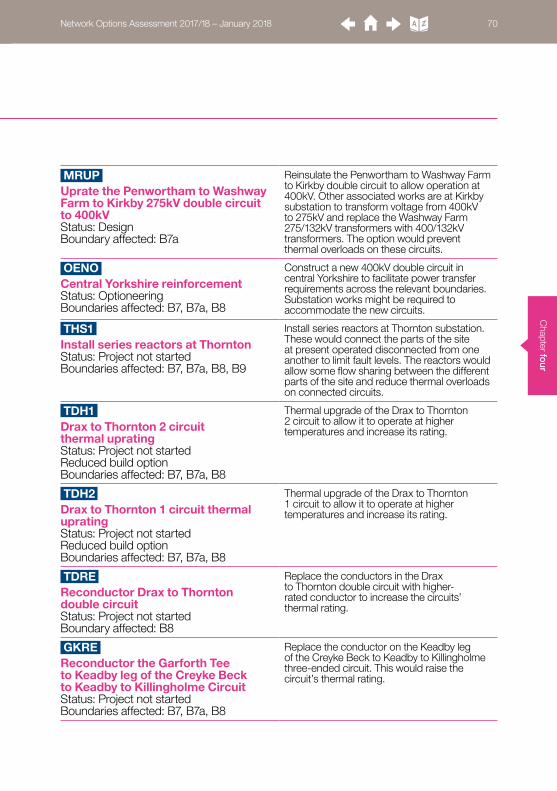
Chapter fo
ur
MRUP Uprate the Penwortham to Washway Farm to Kirkby 275kV double circuit to 400kV Status: DesignBoundary affected: B7a
Reinsulate the Penwortham to Washway Farm to Kirkby double circuit to allow operation at 400kV. Other associated works are at Kirkby substation to transform voltage from 400kV to 275kV and replace the Washway Farm 275/132kV transformers with 400/132kV transformers. The option would prevent thermal overloads on these circuits.
OENO Central Yorkshire reinforcement Status: OptioneeringBoundaries affected: B7, B7a, B8
Construct a new 400kV double circuit in central Yorkshire to facilitate power transfer requirements across the relevant boundaries. Substation works might be required to accommodate the new circuits.
THS1 Install series reactors at Thornton Status: Project not startedBoundaries affected: B7, B7a, B8, B9
Install series reactors at Thornton substation. These would connect the parts of the site at present operated disconnected from one another to limit fault levels. The reactors would allow some flow sharing between the different parts of the site and reduce thermal overloads on connected circuits.
TDH1 Drax to Thornton 2 circuit thermal uprating Status: Project not startedReduced build optionBoundaries affected: B7, B7a, B8
Thermal upgrade of the Drax to Thornton 2 circuit to allow it to operate at higher temperatures and increase its rating.
TDH2 Drax to Thornton 1 circuit thermal upratingStatus: Project not startedReduced build optionBoundaries affected: B7, B7a, B8
Thermal upgrade of the Drax to Thornton 1 circuit to allow it to operate at higher temperatures and increase its rating.
TDRE Reconductor Drax to Thornton double circuitStatus: Project not startedBoundary affected: B8
Replace the conductors in the Drax to Thornton double circuit with higher- rated conductor to increase the circuits’ thermal rating.
GKRE Reconductor the Garforth Tee to Keadby leg of the Creyke Beck to Keadby to Killingholme CircuitStatus: Project not startedBoundaries affected: B7, B7a, B8
Replace the conductor on the Keadby leg of the Creyke Beck to Keadby to Killingholme three-ended circuit. This would raise the circuit’s thermal rating.
Network Options Assessment 2017/18 – January 2018 70

Cha
pter
four
DREU Generator circuit breaker replacement to allow Thornton to run a two-way splitStatus: Project not startedBoundaries affected: B7, B7a, B8, B9
This reinforcement is to replace generator-owned circuit breakers with higher-rated equivalents including substation equipment. This would allow higher fault levels, which in turn improves load sharing on circuits connecting to the substation.
CDRE Cellarhead to Drakelow reconductoringStatus: Project not startedBoundaries affected: B8/B9/NW4/B17
Replace the conductors on the existing double circuit from Cellarhead to Drakelow with higher-rated conductor to increase their thermal rating.
RYEU Substation reconfiguration and 225MVAr MSC at RyhallStatus: Project not startedBoundary affected: B9
Reconfigure Ryhall 400kV substation and install a 225MVAr switched capacitor (MSC) and associated circuit breakers to provide voltage support across the Midlands area as system flows increase in the future.
Network Options Assessment 2017/18 – January 2018 71
Proposed options

Chapter fo
ur
BMMS 225MVAr MSCs at Burwell MainStatus: ScopingBoundary affected: EC5
Three new 225 MVAr switched capacitors (MSCs) at Burwell Main would provide voltage support to the East Anglia area as system flows increase in future.
BRRE Reconductor remainder of Bramford to Braintree to Rayleigh routeStatus: Project not startedBoundary affected: EC5
Replace the conductors in the parts of the existing Bramford to Braintree to Rayleigh overhead line that have not already been reconductored with higher-rated conductor, to increase the circuits’ thermal rating.
NBRE Reconductor Bramford to Norwich double circuitStatus: Project not startedBoundary affected: EC5
The double circuit that runs from Norwich to Bramford would be reconductored with a higher-rated conductor.
BTNO A new 400kV double circuit between Bramford and TwinsteadStatus: Project not startedBoundary affected: EC5
Construct a new 400kV double circuit between Bramford substation and Twinstead tee point to create double circuits that run between Bramford to Pelham and Bramford to Braintree to Rayleigh Main. It would increase power export capability from East Anglia into the rest of the transmission system.
CTRE Reconductor remainder of Coryton South to Tilbury circuitStatus: Project not startedBoundary affected: EC5
Replace the conductors on the remaining sections of the Coryton South to Tilbury circuit, which have not recently been reconductored with higher-rated conductor. These would increase the circuit’s thermal rating.
RTRE Reconductor remainder of Rayleigh to Tilbury circuitStatus: Project not startedBoundaries affected: EC5, B15
Replace the conductors on the remaining sections of the Rayleigh to Tilbury circuit, which have not recently been reconductored with higher-rated conductor. These would increase the circuit’s thermal rating.
TKRE Tilbury to Grain and Tilbury to Kingsnorth UpgradeStatus: Project not startedBoundary affected: B15
Replace the conductors in the Tilbury to Grain and Tilbury to Kingsnorth with higher-rated conductors, and replace the associated cables with larger cables of higher rating, including Tilbury, Grain and Kingsnorth substation equipment. This will increase the circuits’ thermal rating.
Network Options Assessment 2017/18 – January 2018 72
4.3 Reinforcement options – the South and East of England region

Cha
pter
four
GKEU Thermal upgrade for Grain and Kingsnorth 400kV SubstationStatus: Project not startedBoundaries affected: SC1, B15
Thermal upgrade of the 400kV Grain and Kingsnorth substation equipment to increase its thermal capacity, supporting future load flow within the area.
COSC Series Compensation south of CottamStatus: Project not startedBoundaries affected: LE1, B14e
Install series capacitors at Cottam feeder circuits connecting to Grendon, Ryhall and Staythorpe. This will increase the stability when the circuits are highly loaded.
COVC Two hybrid STATCOMS at CottamStatus: Project not startedBoundary affected: LE1
Install two hybrid STATCOMs at Cottam. This will increase the voltage stability when the circuits are highly loaded.
ESC1 Second Elstree to St John’s Wood 400kV circuit Status: Project not startedBoundaries affected: B14, B14e, LE1
New second 400kV cable transmission circuit from Elstree to St. Johns Wood in the existing tunnel, and carry out associated work, including modifying Elstree 400kV and St. John’s Wood 400kV substations. This will improve the power flow into London.
SER1 Elstree to Sundon reconductoring Status: Project not startedBoundaries affected: B14, B14e, LE1
Replace the conductors from Elstree to Sundon circuit 1 with higher-rated conductor to increase their thermal rating.
SER2 Elstree–Sundon 2 circuit turn-in and reconductoring Status: Project not startedBoundaries affected: B14, B14e, LE1
Turn-in the Elstree to Sundon circuit 2, which currently passes the Elstree 400kV substation, to connect to it and replace the conductor with higher-rated conductor. This would ensure better load flow sharing and increase the thermal rating.
HWUP Uprate Hackney, Tottenham and Waltham Cross 275kV to 400kV Status: Project not startedBoundaries affected: B14, B14e, LE1
Hackney, Tottenham and Waltham Cross substation uprate from 275kV to 400kV, and the double circuit route connecting them. This will strengthen the power flow into London, via Rye House, down to Hackney.
WYTI Wymondley turn-in Status: Project not startedBoundaries affected: B14, B14e, LE1
Modify the existing circuit that runs from Pelham to Sundon. Turn-in the circuit at Wymondley to create two separate circuits that run from Pelham to Wymondley and from Wymondley to Sundon to improve the balance of flows.
Network Options Assessment 2017/18 – January 2018 73
Proposed options

Chapter fo
ur
WYQB Wymondley quad boosters Status: Project not startedBoundaries affected: B14, B14e, LE1
Install a pair of quad boosters on the double circuits running from Wymondley to Pelham at the Wymondley 400kV substation. The quad boosters would improve the capability to control the power flows on the North London circuits.
BFHW Bramley to Fleet circuits thermal uprating Status: Project not startedReduced build optionBoundary affected: SC1
Thermal upgrade of the Bramley to Fleet circuits to allow them to operate at higher temperatures, and increase their thermal rating.
BFRE Bramley to Fleet reconductoring Status: Project not startedBoundary affected: SC1
Replace the conductors in the Bramley to Fleet circuits with a higher-rated conductor to increase their thermal ratings.
SCRC South East coast reactive compensation Status: ScopingBoundaries affected: SC1, SC2, B15
Install dynamic voltage support (SVC) on the south east coast. This would provide reactive post-fault power to help maintain voltage stability on the south east coast.
BNRC Bolney and Ninfield additional reactive compensation Status: Project not startedBoundaries affected: SC1, SC2, B10, B12
Provide additional reactive compensation equipment at Bolney and Ninfield substations, to maintain voltages within acceptable operational limits in future network operating conditions.
SEEU Reactive compensation protective switching scheme Status: DesignBoundaries affected: SC1, SC2, B10, B12
Provide a new communications system, and other equipment, to allow existing reactive equipment to be switched in or out of service very quickly following transmission system faults. This would allow better control of system voltages following faults.
SCN1/SCN2 New 400kV transmission route between south London and the South Coast (there are two alternative designs for this option) Status: Project not startedBoundaries affected: SC1, SC2, B10, B12, B15
Construct a new transmission route from the south coast to south London, and carry out associated work. These works would provide additional transmission capacity between the south of London and the south coast.
FLRE/FLR2 Fleet to Lovedean reconductoring Status: Design/developmentBoundaries affected: SC1, SC2, B10, B12
Replace the conductors in the Fleet to Lovedean circuits with a higher-rated conductor to increase their thermal ratings. The two options have different conductor types that provide different ratings.
Network Options Assessment 2017/18 – January 2018 74

Cha
pter
four
KLRE Kemsley to Littlebrook circuits uprating Status: Design/developmentBoundaries affected: B15, SC1, B14
The 400kV circuits running from Kemsley via Longfield Tee to Littlebrook would be reconductored with higher-rated conductor.
HMHW Hinkley Point to Melksham circuits thermal uprating Status: Project not startedReduced build optionBoundary affected: B13
Thermal upgrade of the Hinkley Point to Melksham circuits to allow them to operate at higher temperatures, and increase their thermal rating.
THRE Reconductor Hinkley Point to Taunton double circuit Status: Project not startedBoundaries affected: B13, SC1
Replace the conductors in the Hinkley Point to Taunton circuits with higher-rated conductor to increase the circuits’ thermal rating.
Network Options Assessment 2017/18 – January 2018 75
Proposed options
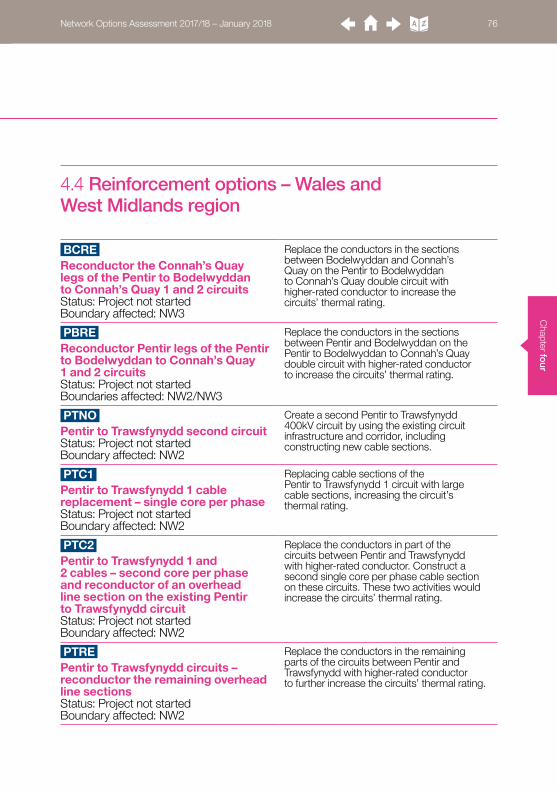
Chapter fo
ur
BCRE Reconductor the Connah’s Quay legs of the Pentir to Bodelwyddan to Connah’s Quay 1 and 2 circuitsStatus: Project not startedBoundary affected: NW3
Replace the conductors in the sections between Bodelwyddan and Connah’s Quay on the Pentir to Bodelwyddan to Connah’s Quay double circuit with higher-rated conductor to increase the circuits’ thermal rating.
PBRE Reconductor Pentir legs of the Pentir to Bodelwyddan to Connah’s Quay 1 and 2 circuitsStatus: Project not startedBoundaries affected: NW2/NW3
Replace the conductors in the sections between Pentir and Bodelwyddan on the Pentir to Bodelwyddan to Connah’s Quay double circuit with higher-rated conductor to increase the circuits’ thermal rating.
PTNO Pentir to Trawsfynydd second circuitStatus: Project not startedBoundary affected: NW2
Create a second Pentir to Trawsfynydd 400kV circuit by using the existing circuit infrastructure and corridor, including constructing new cable sections.
PTC1 Pentir to Trawsfynydd 1 cable replacement – single core per phaseStatus: Project not startedBoundary affected: NW2
Replacing cable sections of the Pentir to Trawsfynydd 1 circuit with large cable sections, increasing the circuit’s thermal rating.
PTC2 Pentir to Trawsfynydd 1 and 2 cables – second core per phase and reconductor of an overhead line section on the existing Pentir to Trawsfynydd circuitStatus: Project not startedBoundary affected: NW2
Replace the conductors in part of the circuits between Pentir and Trawsfynydd with higher-rated conductor. Construct a second single core per phase cable section on these circuits. These two activities would increase the circuits’ thermal rating.
PTRE Pentir to Trawsfynydd circuits – reconductor the remaining overhead line sectionsStatus: Project not startedBoundary affected: NW2
Replace the conductors in the remaining parts of the circuits between Pentir and Trawsfynydd with higher-rated conductor to further increase the circuits’ thermal rating.
Network Options Assessment 2017/18 – January 2018 76
4.4 Reinforcement options – Wales and West Midlands region
Cha
pter
four
Network Options Assessment 2017/18 – January 2018 77

Network Options Assessment 2017/18 – January 2018 78
Chapter fiveInvestment recommendations 79
Network Options Assessment 2017/18 – January 2018 78

Cha
pter
five
Investment recommendations
Chapter 5 presents our investment recommendations from our economic analysis. The results give the most economic investment strategy for each scenario, and enable us to identify our preferred options and the recommended next steps for works required in each region.
5.1 Introduction
Key statistics
In 2018/19 the TOs are recommended to invest £21.57 million on reinforcement options that have a total investment of almost £3.24 billion over their lifetime. Of the 76 options submitted for evaluation, 22 options have a Proceed recommendation. Our analysis considered what is truly necessary as the energy landscape changes and, as a result, significant savings are possible from deferring expenditure. We recommend deferring the delivery of
four projects that may have committed over £8.55 million of spend this investment year. Our NOA 2017/18 recommendations are based on robust economic analysis results which have been subject to further scrutiny by our newly established NOA Committee1. This will ensure that development of the GB transmission network can continue supporting the transition to the future energy landscape in an efficient, economical and coordinated way.
Investing £21.57m this year Total worth of £3.24bn£21.57m £3.24bn
Through 22 options22
Network Options Assessment 2017/18 – January 2018 79
1 For more information about the NOA Committee, please refer to Chapter 2 – Methodology.

Chapter five
Figure 5.1 How the options went through the process
76 options submitted for economic analysis
53 options optimal under at least one scenario
22 options’ decisions
considered critical
Proceed with the delivery of 20 options
Delay the delivery of two options
Proceed with the delivery of one option
30 options be put on hold
31 options’ decisions
considered non-critical
Proceed with the delivery
of one option
One option to be put on hold
for SWW assessment
Stop progressing with one option that is no longer optimal
Do not start with the remaining 20 non-optimal options
23 options non-optimal
Network Options Assessment 2017/18 – January 2018 80

Cha
pter
five
Investment recommendations
This section explains how to interpret the NOA outcomes including the economic analysis results and our investment recommendations underpinned by the results.
5.2 Interpretation of the NOA outcomes
Network Options Assessment 2017/18 – January 2018 81
Optimal path and optimum delivery dateThe cost–benefit analysis investigates the benefits of transmission network solutions in economic terms with respect to different combinations of reinforcement options across four future energy scenarios. Under each scenario, an optimal investment strategy is found in the form of an optimal path, where a selection of options should be delivered in a certain sequence to maximise the benefits for GB consumers. An option is only deemed optimal if it is included in the optimal path of at least one scenario. In contrast it is non-optimal at this time if it does not appear in any optimal paths.
The optimal path not only shows which options are considered to be the most economic under that scenario, but also when their optimum completion years are. If an option’s optimum delivery date is its current Earliest In Service Date (EISD) in at least one scenario then it is considered a critical option. This is because an investment decision must be made by the TOs this year to be able to meet the optimum delivery date. If under all scenarios the optimum delivery dates of an option are later than its EISD then the option is non-critical and a decision can be put on hold until there is greater certainty in the future.
Critical options’ single year least regret analysis All critical options must have a decision made this year and so advance onto our single year least regret analysis. This measures and compares the regret associated with delivering each critical option against the regret of not delivering it. If a region has multiple critical options then we compare the regret associated with delivering different combinations of critical options. For each region, we will always recommend the option, or combination of options, that minimises the levels of regret across all scenarios. If an option is being driven by a single scenario then we will investigate the drivers behind that option further to ensure that the right recommendation really is being made.
Investment recommendationsFollowing the cost–benefit analysis and single year least regret analysis, the results are presented to the NOA Committee for additional scrutiny. Attention is focused on the marginal options where recommendations indicated by the economic analysis, are driven by a single scenario or factor, or are considered to be sensitive.
Economic regret
In economic analysis the ‘regret’ of an investment strategy is defined as the difference in benefit for that strategy against the benefit of the best strategy for that scenario. Therefore in each scenario the best strategy will have a regret of zero,
and the other strategies will have different levels of regret depending how they compare to the best strategy. We always choose the strategy with the least regret across all scenarios. For more information, please see Chapter 2 – Methodology.

Chapter five
Network Options Assessment 2017/18 – January 2018 82
The NOA Committee brings expertise from across the SO, including knowledge on operability challenges, network capability development, commercial operations and insight into future energy landscapes. It then provides a final set of recommendations for the marginal options. With the endorsement from the NOA Committee, we are in a position to recommend a decision for each option. All options will be allocated to one of the following outcomes:• Proceed: Work should continue or
commence in order to maintain the EISD.• Delay: The option is optimal and critical,
but it is not economical to be delivered by its EISD. Delivery of this option should be delayed by one year.
• Hold: The option is optimal but not critical and so an investment decision should be put on hold. Delivery of this option should be delayed by at least one year.
• Stop: The option is non-optimal at this time. Delivery of this option should not be continued.
• Do not start: The option is non-optimal at this time. Delivery of this option should not commence.
It should be noted that an option we don’t recommend to proceed with can still be considered in the SWW assessment.
As our energy landscape is changing, our recommendations for an option may adapt accordingly. This means that an option that we recommended to proceed last year may be recommended to be delayed this year, and vice versa. The benefit of the single year least regret analysis is that an ongoing project is revaluated each year to ensure that its planned completion date remains best for the consumer.
Eligibility for onshore competitionOfgem published their decision on ‘Extending Competition In Transmission’ (ECIT2) in November 2016 which set the future direction of travel for competition in onshore electricity transmission under the Competitively Appointed Transmission Owner (CATO) model. However, following Ofgem’s latest update on ECIT in June 20173, the development of the CATO regime has now been deferred due to a delay in introducing relevant legislation. Ofgem is pursuing competition in alternative forms during the RIIO-T1 period, but it has indicated that it still intends to develop long-term arrangements for introducing competition in onshore electricity transmission along with other broader regulatory frameworks for the RIIO-T2 period.
Therefore we believe it is sensible and pragmatic to continue to include an assessment for competition in this NOA for major network reinforcement options. This includes options we recommend to proceed this year and SWW projects with Needs Case initiated, as the timescales for delivery of many of these investments now fall into the RIIO-T2 timeframe.
In the competition assessment, we use three criteria: ‘new’, ‘separable’ and ‘high value’, proposed by Ofgem in the November 2016 ECIT publication, as indicators that an option is eligible for onshore competition. The option must fulfil all criteria in order to be considered.• To assess whether the option meets the
‘new’ criterion, we test the options against whether they involve the implementation of completely new assets or the complete replacement of an existing transmission asset.
• To assess whether the option meets the ‘separable’ criterion, we test the options against whether the new assets can be clearly delineated from other (existing) assets.
• To assess whether the option meets the ‘high value’ criterion, we assess whether the capex for the assets which meet the new and separable criteria is £100 million or more. We use the costs that the TO(s) have provided, which are scrutinised as part of our NOA process.
2 https://www.ofgem.gov.uk/system/files/docs/2016/11/ecit_november_2016_decision.pdf3 https://www.ofgem.gov.uk/system/files/docs/2017/06/update_on_extending_competition_in_transmission.pdf

Cha
pter
five
Investment recommendations
This section presents the results of the economic analysis followed by investment recommendations and eligibility for onshore competition.
5.3 NOA outcomes
Network Options Assessment 2017/18 – January 2018 83
In the economic analysis, the GB network was separated into three distinct regions: Scotland and the North of England; the South and East of England, and Wales and West Midlands, where reinforcement options proposed for one region have little or no impact with the other two. The economic analysis results are presented on this basis for the best view of the outcomes. For each region we focus on the following aspects, ultimately leading to our final investment recommendations: • The optimal paths by scenario, which
highlight optimal options and their optimum delivery dates.
• Critical options from the optimal paths and associated single year least regret analysis, which produces the ‘Proceed’ and ‘Delay’ recommendations.
• Drivers behind our recommendations such as system needs or changes to the energy landscape and network.
The main outputs of the economic analysis, including optimal paths and initial investment recommendations, are illustrated in Tables 5.1 to 5.3 with respect to the three regions. The optimal options are listed in four-letter codes (as detailed in Chapter 4) with the optimum delivery dates for those options highlighted with different colours for different scenarios or sensitivities. If an option is not in the optimal path of a scenario or sensitivity, then no optimum delivery year for that scenario or sensitivity will be highlighted.
As there are a number of critical options that could be progressed this year, there are several combinations, one of which will have the lowest value of regret across all scenarios. The options that make up this combination will be recommended to proceed.

Chapter five
Network Options Assessment 2017/18 – January 2018 84
The initial recommendations for optimal options from our economic analysis are indicated by different shadings in Tables 5.1 to 5.3 where green is ‘Proceed’, amber is ‘Delay’ and blue is ‘Hold’. We also found 23 options that were not optimal under any of the scenarios at this time and are therefore not included in those tables. The initial recommendation for those non-optimal options is either ‘Do not start’ or ‘Stop’ depending on whether there is any associated work already in progress.
The economic analysis results and initial recommendations were then further scrutinised by the NOA Committee and the final recommendation for each of the options is available to view in Tables 5.4 to 5.6. You will find differences between initial and final recommendations for some options. Explanations for those are included as part of our regional narratives. In the interests of transparency, minutes from the NOA Committee meetings will be published on our website.
A full list of optimal options for each region with descriptions and optimum delivery dates can be found in Appendix A.1-3. Critical options are in bold. Some options are marked as ‘N/A’ as they are not optimal under that particular scenario or sensitivity.
Results for the top performing combinations from our single year least regret analysis can be found in Appendix A.4-5. The worst regret for each combination is in bold and the combination with the smallest worst regret across the energy scenarios is highlighted in green.

Cha
pter
five
Optimum Delivery Date
Reinforcement 2019 2020 2021 2022 2023 2024 2025 2026 2027 2028 2029 2030
TDH1
LDQB4
CPRE
NOR1
WHTI
WHT2
HAEU
WLTI
ECU2
HNNO
THS1
NOHW
TDH2
ECUP
DNEU
TURC
LNRE
OENO
HAE2
E2DC
E4DC
HPNO
CDRE
EHRE
DWNO
Table 5.1 Scotland and the North of England region
Investment recommendations
5.3.1 Scotland and the North of England region
Key
Optimum year indicator for Two Degrees Optimum year indicator for Slow Progression Optimum year indicator for Consumer Power Optimum year indicator for Steady State
EISD not yet reached Critical option to ‘Proceed’ Critical option to ‘Delay’ Non-critical option to ‘Hold’
Network Options Assessment 2017/18 – January 2018 85

Chapter five
Network Options Assessment 2017/18 – January 2018 86
For Scotland and the North of England region, we identified 25 optimal options as illustrated in Table 5.1. The optimum delivery dates for those options are highlighted in different colours for different scenarios, where ‘Green’ is for Two Degrees, ‘Blue’ is for Consumer Power, ‘Purple’ is for Slow Progression and ‘Amber’ is for Steady State. Among the 25 optimal options, 12 are critical and they could present 4096 different possible combinations of ‘Proceed’ and ‘Delay’ recommendations. The options ‘East Coast onshore 275kV upgrade’ (ECU2), ‘East Coast onshore 400kV incremental reinforcement’ (ECUP), ‘Eastern subsea HVDC Link from Peterhead to Hawthorn Pit’ (E4DC) and ‘Hunterston East–Neilston 400kV Reinforcement’ (HNNO) have optimum years of delivery that are the same as their EISDs for all scenarios. This means that there is no requirement to perform single year least regret analysis for these four options, as progressing them to maintain their EISDs is the optimum course of action under all scenarios. Having taken account of ECU2, ECUP, E4DC and HNNO, this leaves this region with eight critical options and therefore 256 different possible combinations of the following reinforcements:• Drax to Thornton 2 circuit thermal
uprating (TDH1).• Turn-in of West Boldon to Hartlepool
circuit at Hawthorn Pit (WHTI).• Turn-in of West Boldon to Hartlepool
circuit at Hawthorn Pit (WHT2)5. • Reconductor sections of Penwortham
to Padiham and Penwortham to Carrington (CPRE).
• Reconductor 13.75km of Norton to Osbaldwick 400kV double circuit (NOR1)
• Harker SuperGrid Transformer 6 replacement (HAEU).
• Eastern subsea HVDC Link from Torness to Hawthorn Pit (E2DC).
• Denny to Wishaw 400kV reinforcement (DWNO).
We performed the single year least regret analysis on all 256 combinations. The least regret strategy is to proceed with all critical options in Scotland and the North of England region with the exception of WHT2. The top 10 performing combinations for this region are listed in Appendix A.4. The above results are explained in more detail as follows:• This year the TOs have reviewed the
Eastern Link options, including E2DC, E4DC and TLNO. These options involve large infrastructure construction onshore and/or offshore which will trigger the SWW process. Following a more detailed programme review and building on learned experience from delivering similar programmes, it is now recognised that the delivery of these options will come later than anticipated in the last NOA. The agreed EISDs of E2DC, E4DC and TLNO are now 2027, 2028 and 2030 respectively; whereas in the last NOA they were 2024, 2024 and 2028.
• From our economic analysis, we still see the need to have E2DC and E4DC delivered as early as possible. TLNO is no longer optimal as its EISD is too late.
• Some development work has been carried out in the past on ECU2 and ECUP options and neither project was recommended to proceed because the timing for their delivery was not optimal in NOA 2016/17. These projects, which involve upgrades to existing routes, are now both recommended to proceed for delivery in 2023 and 2026 respectively. This is because they are now critical and progressing with them delivers the most benefit.
4The NOA Committee concluded the final recommendation for LDQB to be ‘Proceed’.5 The EISD and spend profile of option WHT2 are different to that of WHTI although the scope of work for the two options is exactly the same; hence they are treated as alternative options in the economic analysis.
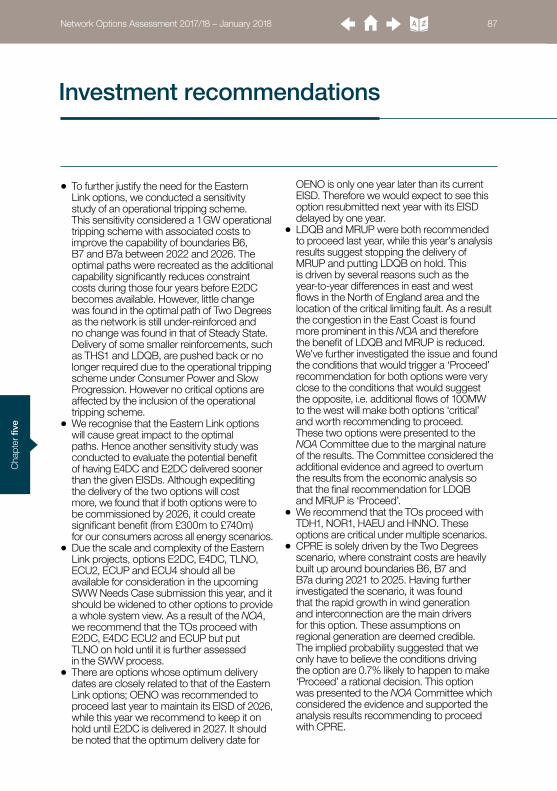
Cha
pter
five
Investment recommendations
Network Options Assessment 2017/18 – January 2018 87
• To further justify the need for the Eastern Link options, we conducted a sensitivity study of an operational tripping scheme. This sensitivity considered a 1 GW operational tripping scheme with associated costs to improve the capability of boundaries B6, B7 and B7a between 2022 and 2026. The optimal paths were recreated as the additional capability significantly reduces constraint costs during those four years before E2DC becomes available. However, little change was found in the optimal path of Two Degrees as the network is still under-reinforced and no change was found in that of Steady State. Delivery of some smaller reinforcements, such as THS1 and LDQB, are pushed back or no longer required due to the operational tripping scheme under Consumer Power and Slow Progression. However no critical options are affected by the inclusion of the operational tripping scheme.
• We recognise that the Eastern Link options will cause great impact to the optimal paths. Hence another sensitivity study was conducted to evaluate the potential benefit of having E4DC and E2DC delivered sooner than the given EISDs. Although expediting the delivery of the two options will cost more, we found that if both options were to be commissioned by 2026, it could create significant benefit (from £300m to £740m) for our consumers across all energy scenarios.
• Due the scale and complexity of the Eastern Link projects, options E2DC, E4DC, TLNO, ECU2, ECUP and ECU4 should all be available for consideration in the upcoming SWW Needs Case submission this year, and it should be widened to other options to provide a whole system view. As a result of the NOA, we recommend that the TOs proceed with E2DC, E4DC ECU2 and ECUP but put TLNO on hold until it is further assessed in the SWW process.
• There are options whose optimum delivery dates are closely related to that of the Eastern Link options; OENO was recommended to proceed last year to maintain its EISD of 2026, while this year we recommend to keep it on hold until E2DC is delivered in 2027. It should be noted that the optimum delivery date for
OENO is only one year later than its current EISD. Therefore we would expect to see this option resubmitted next year with its EISD delayed by one year.
• LDQB and MRUP were both recommended to proceed last year, while this year’s analysis results suggest stopping the delivery of MRUP and putting LDQB on hold. This is driven by several reasons such as the year-to-year differences in east and west flows in the North of England area and the location of the critical limiting fault. As a result the congestion in the East Coast is found more prominent in this NOA and therefore the benefit of LDQB and MRUP is reduced. We’ve further investigated the issue and found the conditions that would trigger a ‘Proceed’ recommendation for both options were very close to the conditions that would suggest the opposite, i.e. additional flows of 100MW to the west will make both options ‘critical’ and worth recommending to proceed. These two options were presented to the NOA Committee due to the marginal nature of the results. The Committee considered the additional evidence and agreed to overturn the results from the economic analysis so that the final recommendation for LDQB and MRUP is ‘Proceed’.
• We recommend that the TOs proceed with TDH1, NOR1, HAEU and HNNO. These options are critical under multiple scenarios.
• CPRE is solely driven by the Two Degrees scenario, where constraint costs are heavily built up around boundaries B6, B7 and B7a during 2021 to 2025. Having further investigated the scenario, it was found that the rapid growth in wind generation and interconnection are the main drivers for this option. These assumptions on regional generation are deemed credible. The implied probability suggested that we only have to believe the conditions driving the option are 0.7% likely to happen to make ‘Proceed’ a rational decision. This option was presented to the NOA Committee which considered the evidence and supported the analysis results recommending to proceed with CPRE.

Chapter five
Network Options Assessment 2017/18 – January 2018 88
• WHTI although supported by Two Degrees and Slow Progression has a single driving factor. The low front end cost and high regret values under the Two Degrees scenario resulted in the implied probability of this factor only having to be 0.5% likely to happen to make ‘Proceed’ a rational decision. This option was presented to the NOA Committee for additional scrutiny, which endorsed the recommendation to proceed with WHTI.
In conclusion, we recommend that the TOs progress with the following reinforcements in Scotland and the North of England region.• TDH1 to meet its EISD of 2019.• LDQB to meet its EISD of 2020.• WHTI to meet its EISD of 2021.• CPRE to meet its EISD of 2021.• NOR1 to meet its EISD of 2021.• HAEU to meet its EISD of 2021.• ECU2 to meet its EISD of 2023.• HNNO to meet its EISD of 2023.• MRUP to meet its EISD of 2023.• ECUP to meet its EISD of 2026.• E2DC to meet its EISD of 2027.• E4DC to meet its EISD of 2028.• DWNO to meet its EISD of 2028.
We believe that there could be significant benefit of the use of an operational tripping scheme to mitigate the constraint costs ahead of reinforcements. We request the TOs to bring forward tripping schemes to address this need and to review the possibility of accelerating the asset investment programmes.
Following the above results, we conducted eligibility assessment for onshore competition for all reinforcements that we recommended to proceed this year in Scotland and the North of England region. We identified the following options meet the competition criteria proposed by Ofgem in the November 2016 ECIT publication:• Eastern subsea HVDC Link from
Peterhead to Hawthorn Pit (E4DC).• Eastern subsea HVDC Link from Torness
to Hawthorn Pit (E2DC).• East Coast onshore 400kV incremental
reinforcement (ECUP).• Orkney link5.• Western Isles link5.• Shetland link5.
The East Coast onshore 400kV incremental reinforcement (ECUP) would have to be split up to meet the competition criterion for separability. It also includes some new assets that might be built earlier for one or more other projects. As a result this could affect the value of ECUP and its eligibility for competition. We will review this as the plans for the network are developed.
5 In addition to the NOA reinforcements, projects to connect to the Scottish islands were also assessed for onshore competition.
Following feedback about NOA 2016/17, we restructured chapter 5 so that it contained more narrative and less raw data. This data has moved to a new Appendix A. Please tell us your views on how we’ve changed chapter 5.
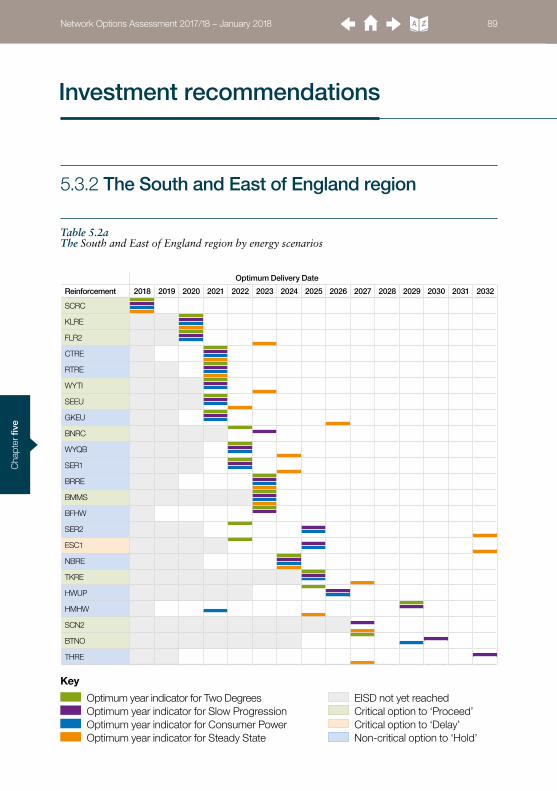
Cha
pter
five
Optimum Delivery Date
Reinforcement 2018 2019 2020 2021 2022 2023 2024 2025 2026 2027 2028 2029 2030 2031 2032
SCRC
KLRE
FLR2
CTRE
RTRE
WYTI
SEEU
GKEU
BNRC
WYQB
SER1
BRRE
BMMS
BFHW
SER2
ESC1
NBRE
TKRE
HWUP
HMHW
SCN2
BTNO
THRE
Table 5.2a The South and East of England region by energy scenarios
Investment recommendations
5.3.2 The South and East of England region
Key
Optimum year indicator for Two Degrees Optimum year indicator for Slow Progression Optimum year indicator for Consumer Power Optimum year indicator for Steady State
EISD not yet reached Critical option to ‘Proceed’ Critical option to ‘Delay’ Non-critical option to ‘Hold’
Network Options Assessment 2017/18 – January 2018 89

Chapter five
Table 5.2b The South and East of England region by local sensitivities
Optimum Delivery Date
Reinforcement 2018 2019 2020 2021 2022 2023 2024 2025 2026 2027 2028 2029 2030 2031 2032
SCRC
KLRE
FLR2
CTRE
RTRE
WYTI
SEEU
GKEU
BNRC
WYQB
SER1
BRRE
BMMS
BFHW
SER2
ESC1
NBRE
TKRE
HWUP
HMHW
SCN2
BTNO
THRE
Key
Optimum year indicator for LoCon A Optimum year indicator for LoCon B Optimum year indicator for NoCon A Optimum year indicator for NoCon B
EISD not yet reached Critical option to ‘Proceed’ Critical option to ‘Delay’ Non-critical option to ‘Hold’
Network Options Assessment 2017/18 – January 2018 90

Cha
pter
five
Investment recommendations
Network Options Assessment 2017/18 – January 2018 91
For the South and East of England region, we identified 23 optimal options as shown in the optimal paths in Table 5.2. Among these, 11 are critical and they could present 2048 different possible combinations of ‘Proceed’ and ‘Delay’ recommendations. The options ‘South East coast reactive compensation’ (SCRC), ‘Kemsley to Littlebrook circuits uprating’ (KLRE) and ‘225MVAr MSCs at Burwell Main’ (BMMS) have optimum years of delivery that are the same as their EISDs for all scenarios. This means that there is no requirement to perform single year least regret analysis for these three options, as progressing them to maintain their EISDs is the optimum course of action under all scenarios.
Having taken account of SCRC, KLRE and BMMS this leaves this region with eight critical options and therefore 256 different possible combinations of the following reinforcements:• Fleet to Lovedean reconductoring
(option 2) (FLR2).• Reactive compensation protective
switching scheme (SEEU).• Wymondley turn-in (WYTI)• Tilbury to Grain and Tilbury to
Kingsnorth Upgrade (TKRE).• Second Elstree to St John’s Wood 400kV
circuit (ESC1).• Bolney and Ninfield additional reactive
compensation (BNRC).• A new 400kV double circuit between
Bramford and Twinstead (BTNO).• New 400kV transmission route between
south London and the South Coast (option 2) (SCN2).
We performed the single year least regret analysis on all 256 combinations. The least regret strategy is to proceed with all critical options in the South and East of England region except ESC1. The top 10 performing combinations for this region are listed in Appendix A.5.
The above results are explained in more detail as follows:• This year we’ve combined ‘the South’ and
‘the East’ into one region. We have several reinforcement options which benefit multiple boundaries across those two regions; hence they have to be considered in a single combined region to avoid getting two sets of results.
• In addition to the four energy scenarios, we’ve also included two sets of ‘Local contracted’ and ‘No local contracted’ sensitivities. The first set of sensitivities are named ‘LoCon A’ and ‘NoCon A’, representing the ‘Local Contracted’ and ‘No Local Contracted’ backgrounds around the East Anglia area; the second set of sensitivities are named ‘LoCon B’ and ‘NoCon B’, representing the ‘Local Contracted’ and ‘No Local Contracted’ backgrounds along the South East Coast. This was because there is potential for a large amount of local generation and interconnection that could significantly alter the investment recommendations.
• We recommend SCRC, FLR2 (alternative to FLRE), SEEU and KLRE to proceed this year which is the same as our recommendation last year. These options are required on the South East Coast where a large amount of interconnector capacity is due to connect. The EISD of KLRE has been reviewed by the TO so it can now be delivered in 2020 instead of 2021 to achieve maximum benefit.
• The recommendation for WYTI was ‘Delay’ in the NOA 2016/17. As a result, its EISD has slipped from 2020 to 2021 this year. This year we recommend WYTI to proceed as it is driven by exporting conditions on B14, which is consistent with what we observed last year.
Chapter five
Network Options Assessment 2017/18 – January 2018 92
• BTNO has an EISD of 2025, and our analysis recommends that the TO proceed with the option as delaying it under the Local Contracted sensitivity of the East Anglia area will result in significant regret of £148m. The option is optimal under Two Degrees, Consumer Power and Slow Progression, however non-critical for any of them. The Local Contracted sensitivity is a modification of the Two Degrees scenario which includes an additional 7.4GW of offshore wind from today’s level by 2025, whereas the Two Degrees scenario only has an additional 1.25GW. Together with other local generation, the total installed capacity in the Local Contracted sensitivity is over 10GW by 2025. Because of the significant differences between the Local Contracted sensitivity and the Two Degrees scenario, the sensitivity driving the option seems less credible. Further investigations were then conducted to find out the exact amount of additional generation needed to trigger a ‘Proceed’ recommendation, and that is 500MW above the level in Two Degrees by 2025. We regarded this as too high to be credible in this timeframe. This option was referred to the NOA Committee due to its marginal nature, and considering the evidence presented about the generation mix the Committee agreed that the final recommendation for BTNO is ‘Delay’.
• BNRC has an EISD of 2021 and is only required to be delivered on its EISD under the Two Degrees scenario. The option is mainly triggered by importing conditions of the interconnectors connected to the South Coast in 2022 which significantly contribute to the constraints build up on boundaries SC1 and SC2. We believe the interconnector assumptions are credible. The low front end cost and considerably large regret of delaying the option indicate that we only have to believe the conditions driving the option are 0.5% likely to happen to make ‘Proceed’ a rational decision. This was another marginal option presented to the NOA Committee who, based on the evidence provided, endorsed the recommendation to proceed with BNRC.
• SCN2 has an EISD of 2027 and is required to be delivered by its EISD under Slow Progression and Steady State. Following significant changes in generation mix in the FES 2017, the requirement for this option is mainly driven by the constraints build up in the Thames estuary area as early as 2023. No effective reinforcement is available with an earlier EISD to alleviate the congestion in that part of the network. Delaying the option could result in significant regret under Slow Progression and Steady State up to £103m, while the regret to proceed with the option this year of less than £1m is much lower due to the low front end cost. We only have to believe the conditions under Slow Progression and Steady State are 1.2% and 0.7% likely to happen to make ‘Proceed’ a rational decision for this option. This option involves large infrastructure construction which triggers the SWW process. Due to the scale and complexity of this option, it was referred to the NOA Committee for additional scrutiny. They supported the recommendation to proceed with SCN2 this year for SWW submission.
• TKRE is found critical under multiple scenarios. The reinforcement benefits multiple boundaries along the South Coast once SCN2 is built. Therefore we recommend that the TO proceed with TKRE.
• Hinkley Point to Seabank new double circuit (HSNO) was assessed in the NOA 2016/17 and recommended to proceed. This year the option has progressed sufficiently far through the SWW process and Ofgem’s decision published in January 20186 confirmed their view that there is a clear economic and technical case that it is beneficial for GB consumers for the project to progress. The project is therefore no longer assessed in the NOA. Instead, we have included the option in the base network for our analysis.
6 https://www.ofgem.gov.uk/system/files/docs/2018/01/decision_on_hsb_final_needs_case.pdf
Cha
pter
five
Investment recommendations
Network Options Assessment 2017/18 – January 2018 93
In conclusion, we recommend progressing with the following reinforcements in the South and East of England region:• SCRC to meet its EISD of 2018.• BMMS to meet its EISD of 2023.• TKRE to meet its EISD of 2025.• SCN2 to meet its EISD of 2027.• WYTI to meet its EISD of 2021.• BNRC to meet its EISD of 2021.• KLRE to meet its EISD of 2020.• FLR2 to meet its EISD of 2020.• SEEU to meet its EISD of 2021.
Following the above results, we conducted eligibility assessment for onshore competition for all reinforcements that we recommended to proceed this year in the South and East of England region. We identified one option which meets the competition criteria proposed by Ofgem in the November 2016 ECIT publication:• New 400kV transmission route between
south London and the south coast (option 2 ) (SCN2)

Chapter five
Optimum Delivery Date
Reinforcement 2020 2021 2022 2023 2024 2025 2026 2027 2028 2029 2030 2031 2032
PTNO
PTC1
PTC2
BCRE
PTRE
PBRE
Table 5.3 Wales and West Midlands region
5.3.3 Wales and West Midlands region
Key
Optimum year indicator for Two Degrees Optimum year indicator for Slow Progression Optimum year indicator for Consumer Power Optimum year indicator for Steady State
EISD not yet reached Non-critical option to ‘Hold’
Network Options Assessment 2017/18 – January 2018 94
For Wales and West Midlands region, we identified six optimal options as shown in the four optimal paths in Table 5.3; however none of them are critical this year. The results are similar to that of last year, where no significant
constraints are found in the early 2020s. Therefore we recommend that the TO hold any investment decisions in this region until we have more information in later years.
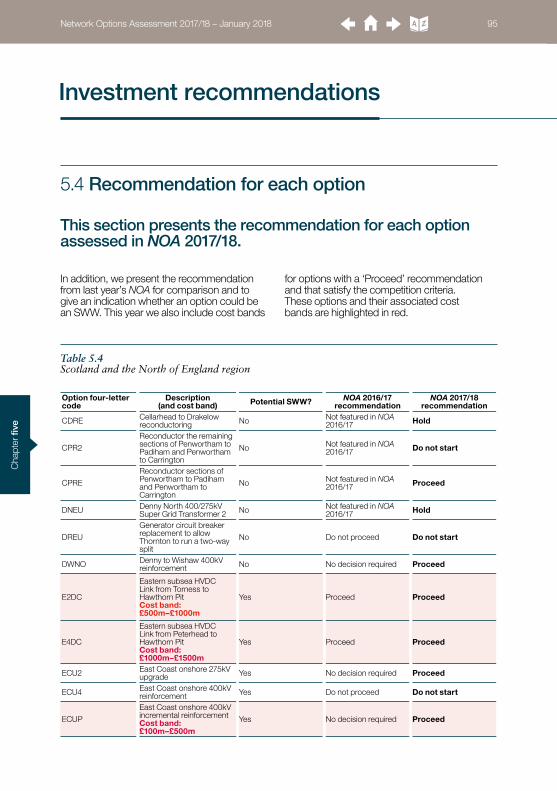
Cha
pter
five
Investment recommendations
Network Options Assessment 2017/18 – January 2018 95
In addition, we present the recommendation from last year’s NOA for comparison and to give an indication whether an option could be an SWW. This year we also include cost bands
for options with a ‘Proceed’ recommendation and that satisfy the competition criteria. These options and their associated cost bands are highlighted in red.
This section presents the recommendation for each option assessed in NOA 2017/18.
5.4 Recommendation for each option
Table 5.4 Scotland and the North of England region
Option four-letter code
Description (and cost band) Potential SWW? NOA 2016/17
recommendationNOA 2017/18
recommendation
CDRE Cellarhead to Drakelow reconductoring No Not featured in NOA
2016/17 Hold
CPR2
Reconductor the remaining sections of Penwortham to Padiham and Penwortham to Carrington
No Not featured in NOA 2016/17 Do not start
CPRE
Reconductor sections of Penwortham to Padiham and Penwortham to Carrington
No Not featured in NOA 2016/17 Proceed
DNEU Denny North 400/275kV Super Grid Transformer 2 No Not featured in NOA
2016/17 Hold
DREU
Generator circuit breaker replacement to allow Thornton to run a two-way split
No Do not proceed Do not start
DWNO Denny to Wishaw 400kV reinforcement No No decision required Proceed
E2DC
Eastern subsea HVDC Link from Torness to Hawthorn Pit Cost band: £500m–£1000m
Yes Proceed Proceed
E4DC
Eastern subsea HVDC Link from Peterhead to Hawthorn PitCost band: £1000m–£1500m
Yes Proceed Proceed
ECU2 East Coast onshore 275kV upgrade Yes No decision required Proceed
ECU4 East Coast onshore 400kV reinforcement Yes Do not proceed Do not start
ECUP
East Coast onshore 400kV incremental reinforcement Cost band: £100m–£500m
Yes No decision required Proceed

Chapter five
Network Options Assessment 2017/18 – January 2018 96
Table 5.4 Scotland and the North of England region continued
Option four-letter code
Description (and cost band) Potential SWW? NOA 2016/17
recommendationNOA 2017/18
recommendation
EHRE Elvanfoot to Harker reconductoring No Not featured in NOA
2016/17 Hold
FBREBeauly to Fyrish 275kV double circuit reconductoring
No Do not proceed Do not start
GKRE
Reconductor the Garforth Tee to Keadby leg of the Creyke Beck to Keadby to Killingholme Circuit
No Do not proceed Do not start
HAE2 Harker SuperGrid Transformer 5 replacement No Not featured in NOA
2016/17 Hold
HAEU Harker SuperGrid Transformer 6 replacement No Do not proceed Proceed
HNNO Hunterston East–Neilston 400kV Reinforcement No Not featured in NOA
2016/17 Proceed
HPNONew east–west circuit between the north east and Lancashire
Yes No decision required Hold
HSRE
Reconductor Harker to Fourstones, Fourstones to Stella West and Harker to Stella West 275kV circuit
No Not featured in NOA 2016/17 Do not start
HSUP
Uprate Harker to Fourstones, Fourstones to Stella West and Harker to Stella West 275kV circuit to 400kV
Yes Not featured in NOA 2016/17 Do not start
LDQB Lister Drive quad booster No Proceed Proceed
LNR2
Reconductor Lackenby to Norton single 400kV circuit (with a different conductor type to LNRE)
No Not featured in NOA 2016/17 Do not start
LNRE
Reconductor Lackenby to Norton single 400kV circuit (with a different conductor type to LNR2)
No Delay Hold
LTR3 Lackenby to Thornton 1 circuit thermal upgrade No Not featured in NOA
2016/17 Do not start
MRUP
Uprate the Penwortham to Washway Farm to Kirkby 275kV double circuit to 400kV
No Proceed Proceed
NOHWThermal uprate 55km of the Norton to Osbaldwick 400kV double circuit
No Do not proceed Hold
NOR1Reconductor 13.75km of Norton to Osbaldwick 400kV double circuit
No Proceed Proceed
NOR2Reconductor 13.75km of Norton to Osbaldwick number 1 400kV circuit
No No decision required Do not start
NOR4Reconductor 13.75km of Norton to Osbaldwick number 2 400kV circuit
No Not featured in NOA 2016/17 Do not start
NPNONew east–west circuit between the north east and Lancashire
Yes No decision required Do not start
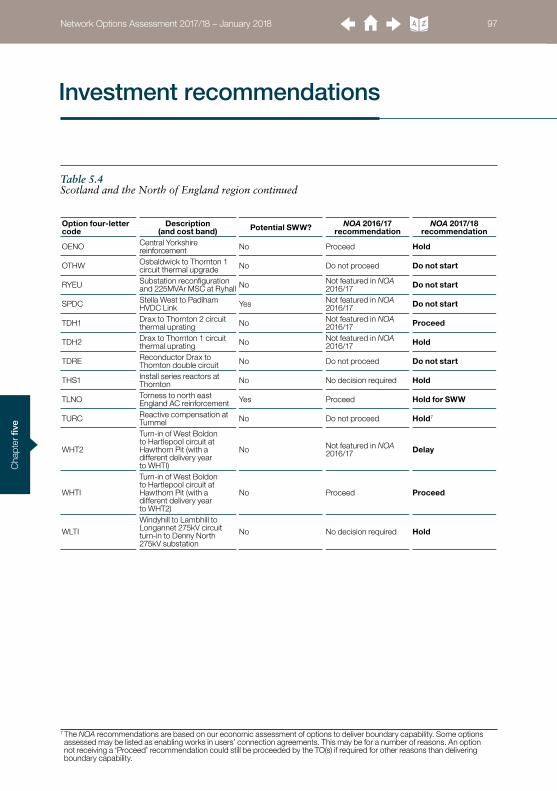
Cha
pter
five
Investment recommendations
Network Options Assessment 2017/18 – January 2018 97
Option four-letter code
Description (and cost band) Potential SWW? NOA 2016/17
recommendationNOA 2017/18
recommendation
OENO Central Yorkshire reinforcement No Proceed Hold
OTHW Osbaldwick to Thornton 1 circuit thermal upgrade No Do not proceed Do not start
RYEU Substation reconfiguration and 225MVAr MSC at Ryhall No Not featured in NOA
2016/17 Do not start
SPDC Stella West to Padiham HVDC Link Yes Not featured in NOA
2016/17 Do not start
TDH1 Drax to Thornton 2 circuit thermal uprating No Not featured in NOA
2016/17 Proceed
TDH2 Drax to Thornton 1 circuit thermal uprating No Not featured in NOA
2016/17 Hold
TDRE Reconductor Drax to Thornton double circuit No Do not proceed Do not start
THS1 Install series reactors at Thornton No No decision required Hold
TLNO Torness to north east England AC reinforcement Yes Proceed Hold for SWW
TURC Reactive compensation at Tummel No Do not proceed Hold7
WHT2
Turn-in of West Boldon to Hartlepool circuit at Hawthorn Pit (with a different delivery year to WHTI)
No Not featured in NOA 2016/17 Delay
WHTI
Turn-in of West Boldon to Hartlepool circuit at Hawthorn Pit (with a different delivery year to WHT2)
No Proceed Proceed
WLTI
Windyhill to Lambhill to Longannet 275kV circuit turn-in to Denny North 275kV substation
No No decision required Hold
Table 5.4 Scotland and the North of England region continued
7 The NOA recommendations are based on our economic assessment of options to deliver boundary capability. Some options assessed may be listed as enabling works in users’ connection agreements. This may be for a number of reasons. An option not receiving a ‘Proceed’ recommendation could still be proceeded by the TO(s) if required for other reasons than delivering boundary capability.
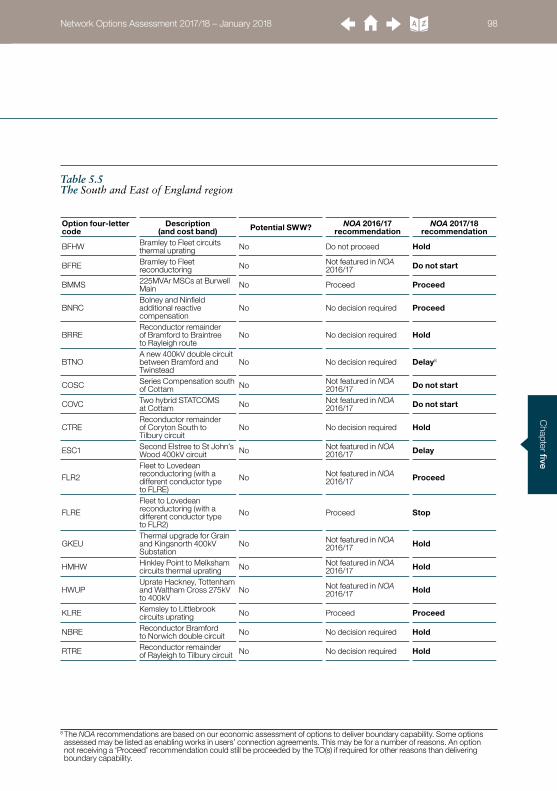
Chapter five
Network Options Assessment 2017/18 – January 2018 98
Option four-letter code
Description (and cost band) Potential SWW? NOA 2016/17
recommendationNOA 2017/18
recommendation
BFHW Bramley to Fleet circuits thermal uprating No Do not proceed Hold
BFRE Bramley to Fleet reconductoring No Not featured in NOA
2016/17 Do not start
BMMS 225MVAr MSCs at Burwell Main No Proceed Proceed
BNRCBolney and Ninfield additional reactive compensation
No No decision required Proceed
BRREReconductor remainder of Bramford to Braintree to Rayleigh route
No No decision required Hold
BTNOA new 400kV double circuit between Bramford and Twinstead
No No decision required Delay8
COSC Series Compensation south of Cottam No Not featured in NOA
2016/17 Do not start
COVC Two hybrid STATCOMS at Cottam No Not featured in NOA
2016/17 Do not start
CTREReconductor remainder of Coryton South to Tilbury circuit
No No decision required Hold
ESC1 Second Elstree to St John’s Wood 400kV circuit No Not featured in NOA
2016/17 Delay
FLR2
Fleet to Lovedean reconductoring (with a different conductor type to FLRE)
No Not featured in NOA 2016/17 Proceed
FLRE
Fleet to Lovedean reconductoring (with a different conductor type to FLR2)
No Proceed Stop
GKEUThermal upgrade for Grain and Kingsnorth 400kV Substation
No Not featured in NOA 2016/17 Hold
HMHW Hinkley Point to Melksham circuits thermal uprating No Not featured in NOA
2016/17 Hold
HWUPUprate Hackney, Tottenham and Waltham Cross 275kV to 400kV
No Not featured in NOA 2016/17 Hold
KLRE Kemsley to Littlebrook circuits uprating No Proceed Proceed
NBRE Reconductor Bramford to Norwich double circuit No No decision required Hold
RTRE Reconductor remainder of Rayleigh to Tilbury circuit No No decision required Hold
Table 5.5 The South and East of England region
8 The NOA recommendations are based on our economic assessment of options to deliver boundary capability. Some options assessed may be listed as enabling works in users’ connection agreements. This may be for a number of reasons. An option not receiving a ‘Proceed’ recommendation could still be proceeded by the TO(s) if required for other reasons than delivering boundary capability.

Cha
pter
five
Investment recommendations
Network Options Assessment 2017/18 – January 2018 99
Table 5.5 The South and East of England region continued
Option four-letter code
Description (and cost band) Potential SWW? NOA 2016/17
recommendationNOA 2017/18
recommendation
SCN1
New 400kV transmission route between south London and the south coast (an alternative design to SCN2)
Yes Do not proceed Do not start9
SCN2
New 400kV transmission route between south London and the south coast (an alternative design to SCN1)Cost band: £500m–£1000m
Yes Do not proceed Proceed
SCRC South East coast reactive compensation No Proceed Proceed
SEEUReactive compensation protective switching scheme
No Proceed Proceed
SER1 Elstree to Sundon reconductoring No Not featured in NOA
2016/17 Hold
SER2 Elstree–Sundon 2 circuit turn-in and reconductoring No Not featured in NOA
2016/17 Hold
THRE Reconductor Hinkley Point to Taunton double circuit No Do not proceed Hold
TKRE Tilbury to Grain and Tilbury to Kingsnorth Upgrade No Not featured in NOA
2016/17 Proceed
WYQB Wymondley quad boosters No No decision required HoldWYTI Wymondley turn-in No Delay Proceed
9 The NOA recommendations are based on our economic assessment of options to deliver boundary capability. Some options assessed may be listed as enabling works in users’ connection agreements. This may be for a number of reasons. An option not receiving a ‘Proceed’ recommendation could still be proceeded by the TO(s) if required for other reasons than delivering boundary capability.
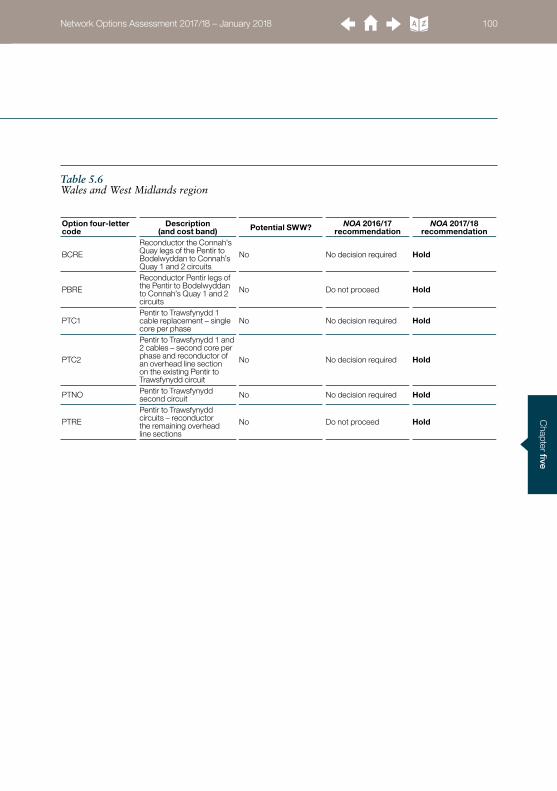
Chapter five
Network Options Assessment 2017/18 – January 2018 100
Table 5.6 Wales and West Midlands region
Option four-letter code
Description (and cost band) Potential SWW? NOA 2016/17
recommendationNOA 2017/18
recommendation
BCRE
Reconductor the Connah's Quay legs of the Pentir to Bodelwyddan to Connah’s Quay 1 and 2 circuits
No No decision required Hold
PBRE
Reconductor Pentir legs of the Pentir to Bodelwyddan to Connah’s Quay 1 and 2 circuits
No Do not proceed Hold
PTC1Pentir to Trawsfynydd 1 cable replacement – single core per phase
No No decision required Hold
PTC2
Pentir to Trawsfynydd 1 and 2 cables – second core per phase and reconductor of an overhead line section on the existing Pentir to Trawsfynydd circuit
No No decision required Hold
PTNO Pentir to Trawsfynydd second circuit No No decision required Hold
PTRE
Pentir to Trawsfynydd circuits – reconductor the remaining overhead line sections
No Do not proceed Hold

Cha
pter
five
Network Options Assessment 2017/18 – January 2018 101

Network Options Assessment 2017/18 – January 2018 102
Chapter sixInterconnection analysis 103
Network Options Assessment 2017/18 – January 2018 102
Cha
pter
six
Network Options Assessment 2017/18 – January 2018 103
Interconnection analysis
Chapter 6 presents our latest interconnection analysis, which aims to facilitate the development of interconnector capacity as part of an efficient, coordinated and economical electricity transmission system.
6.1 Introduction
The analysis is undertaken to inform the industry of the potential benefits of future interconnection, with the goal of providing a market signal to facilitate the development of efficient interconnector capacity with the GB market. The analysis provides an indication as to socioeconomic benefits of interconnection; it does not provide any project-specific information and the output of the analysis does not determine or have any impact on a project’s viability.
The NOA for Interconnectors (NOA IC) is a market and network assessment of the optimal level of interconnection based on Social Economic Welfare (SEW), capex costs of both the interconnection capacity and network reinforcements, and constraint costs. To achieve this market signal it is necessary
to establish a base case which can then be incrementally adjusted to identify potential interconnection capacities, network connection locations and reinforcement requirements. As the output concentrates on optimal capacities, it will generate the greatest balance of socioeconomic welfare, system constraints and capex costs. The final insights are largely independent of specific current and future projects.
The purpose of the NOA IC is to inform and facilitate discussion: National Grid does not make any investment decisions based on the outcome of this interconnector analysis.
6.1.1 The purpose of this analysis

Chapter six
Network Options Assessment 2017/18 – January 2018 104
Key statistics
• �This year’s interconnection analysis suggests that a total interconnection capacity of 17.4 GW between GB and European markets by 2030 would provide the lowest risk for GB consumers.
• The analysis demonstrates that the GB consumer can benefit from more interconnection beyond the Cap and Floor window 2 projects.
• Additional interconnection to Ireland and Norway over and above that included within the base case provides the least regret opportunity for GB and European consumers.
• Europe and GB would benefit both economically and environmentally from increased interconnection.
For this year’s analysis we have undertaken further improvements to the methodology, which were approved by Ofgem. We have included locational impacts on the GB transmission network in addition to the welfare and capital cost implications considered last year.
We have also used the output from this year’s NOA as the baseline network reinforcement assumptions for the NOA IC analysis: this provides greater consistency between the NOA and NOA IC analysis which we believe will be of added value to our stakeholders.
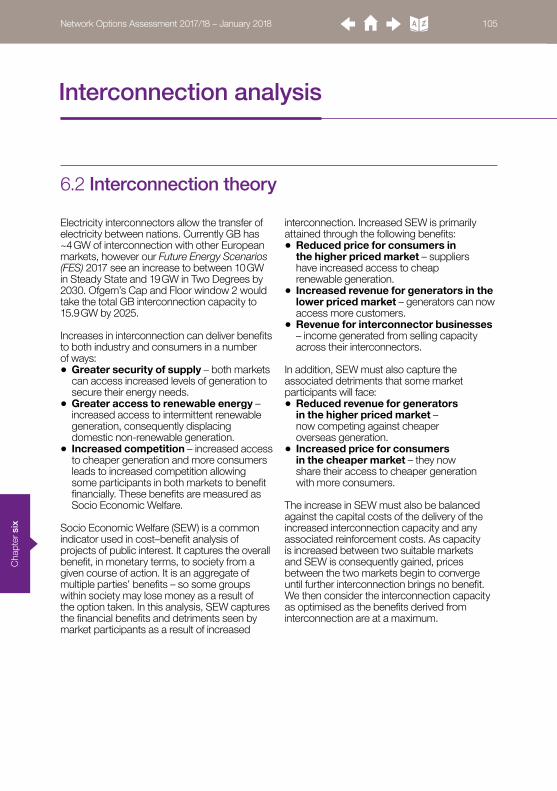
Cha
pter
six
Network Options Assessment 2017/18 – January 2018 105
Interconnection analysis
6.2 Interconnection theory
Electricity interconnectors allow the transfer of electricity between nations. Currently GB has ~4 GW of interconnection with other European markets, however our Future Energy Scenarios (FES) 2017 see an increase to between 10 GW in Steady State and 19 GW in Two Degrees by 2030. Ofgem’s Cap and Floor window 2 would take the total GB interconnection capacity to 15.9 GW by 2025.
Increases in interconnection can deliver benefits to both industry and consumers in a number of ways:• Greater security of supply – both markets
can access increased levels of generation to secure their energy needs.
• Greater access to renewable energy – increased access to intermittent renewable generation, consequently displacing domestic non-renewable generation.
• Increased competition – increased access to cheaper generation and more consumers leads to increased competition allowing some participants in both markets to benefit financially. These benefits are measured as Socio Economic Welfare.
Socio Economic Welfare (SEW) is a common indicator used in cost–benefit analysis of projects of public interest. It captures the overall benefit, in monetary terms, to society from a given course of action. It is an aggregate of multiple parties’ benefits – so some groups within society may lose money as a result of the option taken. In this analysis, SEW captures the financial benefits and detriments seen by market participants as a result of increased
interconnection. Increased SEW is primarily attained through the following benefits:• Reduced price for consumers in
the higher priced market – suppliers have increased access to cheap renewable generation.
• Increased revenue for generators in the lower priced market – generators can now access more customers.
• Revenue for interconnector businesses – income generated from selling capacity across their interconnectors.
In addition, SEW must also capture the associated detriments that some market participants will face:• Reduced revenue for generators
in the higher priced market – now competing against cheaper overseas generation.
• Increased price for consumers in the cheaper market – they now share their access to cheaper generation with more consumers.
The increase in SEW must also be balanced against the capital costs of the delivery of the increased interconnection capacity and any associated reinforcement costs. As capacity is increased between two suitable markets and SEW is consequently gained, prices between the two markets begin to converge until further interconnection brings no benefit. We then consider the interconnection capacity as optimised as the benefits derived from interconnection are at a maximum.
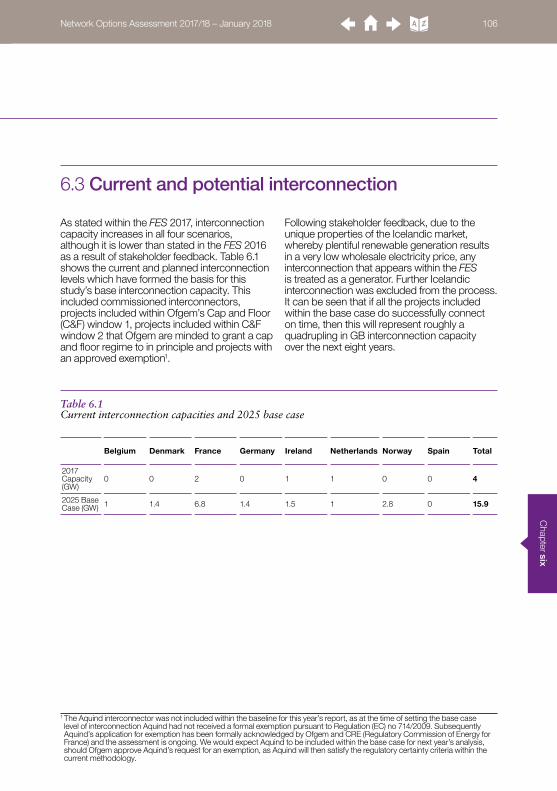
Chapter six
Network Options Assessment 2017/18 – January 2018 106
As stated within the FES 2017, interconnection capacity increases in all four scenarios, although it is lower than stated in the FES 2016 as a result of stakeholder feedback. Table 6.1 shows the current and planned interconnection levels which have formed the basis for this study’s base interconnection capacity. This included commissioned interconnectors, projects included within Ofgem’s Cap and Floor (C&F) window 1, projects included within C&F window 2 that Ofgem are minded to grant a cap and floor regime to in principle and projects with an approved exemption1.
Following stakeholder feedback, due to the unique properties of the Icelandic market, whereby plentiful renewable generation results in a very low wholesale electricity price, any interconnection that appears within the FES is treated as a generator. Further Icelandic interconnection was excluded from the process. It can be seen that if all the projects included within the base case do successfully connect on time, then this will represent roughly a quadrupling in GB interconnection capacity over the next eight years.
6.3 Current and potential interconnection
Table 6.1 Current interconnection capacities and 2025 base case
Belgium Denmark France Germany Ireland Netherlands Norway Spain Total
2017 Capacity (GW)
0 0 2 0 1 1 0 0 4
2025 Base Case (GW) 1 1.4 6.8 1.4 1.5 1 2.8 0 15.9
1 The Aquind interconnector was not included within the baseline for this year’s report, as at the time of setting the base case level of interconnection Aquind had not received a formal exemption pursuant to Regulation (EC) no 714/2009. Subsequently Aquind’s application for exemption has been formally acknowledged by Ofgem and CRE (Regulatory Commission of Energy for France) and the assessment is ongoing. We would expect Aquind to be included within the base case for next year’s analysis, should Ofgem approve Aquind’s request for an exemption, as Aquind will then satisfy the regulatory certainty criteria within the current methodology.

Cha
pter
six
Network Options Assessment 2017/18 – January 2018 107
Interconnection analysis
6.4 Methodology
6.4.1 Developments to methodology
The methodology was developed in consultation with our stakeholders. The interconnection analysis aims to identify the optimal level of interconnection capacity across the eight European markets shown in Table 6.1 for
a selection of study years. Details of the choice of markets, study years and further details of the methodology and the rationale for the approach taken are available on the NOA website2.
This year, in addition to the welfare and capital cost implications considered last year, we have modelled the impact of location of the interconnector on the GB network and the level of onshore reinforcement required to be built to accommodate the interconnector. We have also used the recommendations from this year’s NOA as the baseline network reinforcement assumptions for the NOA IC analysis: this provides greater consistency between the NOA and NOA IC analysis. Last year’s methodology produced the optimal interconnection development path for each future energy scenario: this year we have used least worst regret after each iteration to identify
which option should be taken forward. This results in a single path. For this year’s NOA IC, like last year, we modelled GB interconnection levels using studies within our electricity market modelling software BID3. The studies involved a step-by-step process, where the market was modelled with a base level of interconnection, including current interconnection levels and projects with regulatory certainty totalling 15.9 GW. An iterative process then directed where the additional interconnection should be implemented. Figure 6.1 provides a high-level overview of the process.
2 https://www.nationalgrid.com/sites/default/files/documents/NOA%20for%20IC%20methodology%20final.pdf

Chapter six
1. Set base level interconnection
4. Calculate net benefit of each option
= SEW - capital costs + reduction in
constraint costs
5. Identify optimal interconnector solution
by performing Least Worst Regret
3. Simulate European markets for all four FES,
running each interconnector option sequentially
2. Create test cases
6. Update base level interconnection to include
optimal interconnector and reinforcement
(if included)
Network Options Assessment 2017/18 – January 2018 108
The selected method of arriving at a recommendation for capacity development is an iterative optimisation including a ‘least worst regret’ calculation across all four scenarios. The iterative optimisation approach attempts to maximise the present value, equal to SEW less CAPEX less Attributable Constraint Costs (ACC). The iterative process is as follows:
1) Set base level of interconnection The base level of interconnection was the
total capacity GB has with each of the eight studied markets at the start of the iteration. All interconnectors that are in the NOA IC baseline are included within the model.
2) Create test cases To test the effect of additional capacity for
each market, 1 GW of interconnection was added in each of the European markets to the base level of interconnection. For each country’s additional interconnector, a small number of zones and reinforcement combinations were studied. In total 30 options of country, GB connection zone and reinforcement were modelled. In options where a reinforcement upgrade is selected, an additional 1 GW of capability is added to the relevant boundary. These options are shown in table 6.2. Additional interconnection is modelled to connect in 2025, 2027 and 2030, in order to understand the effects of varying commissioning dates on SEW and attributable constraint costs.
Figure 6.1 Iterative process for interconnection optimisation

Cha
pter
six
Network Options Assessment 2017/18 – January 2018 109
Interconnection analysis
Table 6.2 Interconnector connecting country, zone and reinforcement options
Interconnected Country GB connection zone Reinforcement on boundary
None (base) None None
Belgium 4 EC5
Belgium 4 NoneBelgium 6 NoneBelgium 6 SC1+B15Denmark 4 EC5Denmark 4 NoneDenmark 7 NoneFrance 5 NoneFrance 5 SC1France 5 SC1+B15France 6 NoneFrance 6 SC1Germany 4 EC5Germany 4 NoneGermany 7 NoneIreland 2 B8Ireland 2 NoneIreland 3 NoneIreland 3 SW1Norway 1 B6+B8Norway 1 NoneNorway 2 B8Norway 2 NoneSpain 5 NoneSpain 5 SC1The Netherlands 4 EC5The Netherlands 4 NoneThe Netherlands 6 NoneThe Netherlands 6 SC1+B15
3) Simulate European markets Run all 30 combinations for each 2017 FES
for all European countries then calculate SEW and attributable constraint costs.
4) Calculate net benefit of each combination
Calculate PV = SEW – CAPEX – Attributable Constraint Costs for each option of country, GB connection zone, reinforcement and connecting year for each scenario.
5) Identify optimal solution Perform Least Worst Regret for all 30
options of country, GB connection zone
and reinforcement across all four FES and across three time periods (interconnectors commissioning in 2025, 2027 and 2030).
6) Update base level interconnection Add optimal solution to base level of
interconnection and repeat steps 3 to 6.
The iterative process finishes when it is deemed to have converged, that is when ‘None’ is the option with the least worst regret. Once this result is achieved, the incremental capacity will be reduced to 500 MW to analyse whether there is any benefit of a further 500 MW of interconnection.

Chapter six
Network Options Assessment 2017/18 – January 2018 110
The baseline boundary capabilities were determined by using the outputs published in this NOA. Generic reinforcements were created for each boundary, using costs from NOA 2016/17 and ACER as a guide.
Estimation of interconnection construction costs
The cost of building interconnection capacity varies significantly between different projects, with key drivers including converter technology, cable length and capacity of cable. Estimating costs for generic interconnectors between European markets and GB is therefore challenging. The capital costs were derived from a publicly available ACER (Agency for the Cooperation of Energy Regulators) document3, based on surveys carried out on a range of European projects, and approximations of median possible cable lengths.
Estimation of network reinforcement costs
The network has been divided into seven high level zones which have been determined by areas of significant constraints on the network or areas of high interconnection. These are illustrated in Figure 6.2.
Figure 6.2 GB network high level zones and boundaries
B6
B8
B15
NW
SC1
3
5 6
2
7 4
1
EC5
3 http://www.acer.europa.eu/Official_documents/Acts_of_the_Agency/Publication/UIC%20Report%20%20-%20Electricity%20infrastructure.pdf
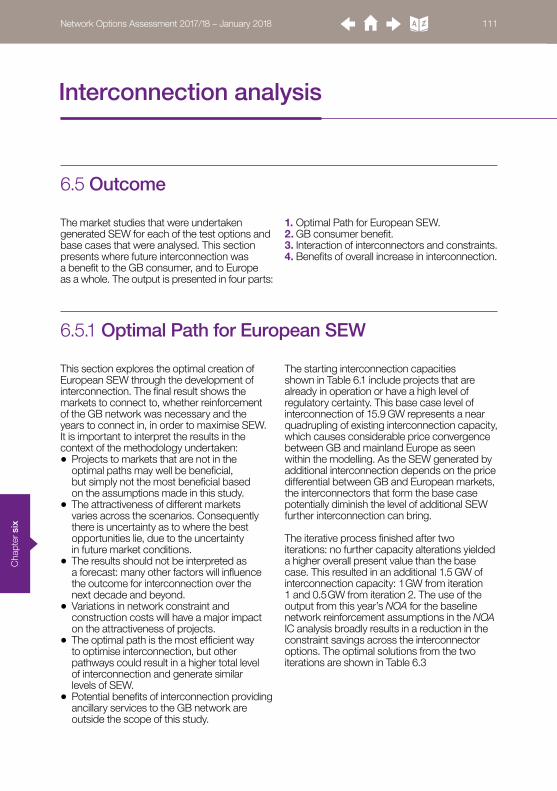
Cha
pter
six
Network Options Assessment 2017/18 – January 2018 111
Interconnection analysis
6.5 Outcome
6.5.1 Optimal Path for European SEW
The market studies that were undertaken generated SEW for each of the test options and base cases that were analysed. This section presents where future interconnection was a benefit to the GB consumer, and to Europe as a whole. The output is presented in four parts:
1. Optimal Path for European SEW.2. GB consumer benefit.3. Interaction of interconnectors and constraints.4. Benefits of overall increase in interconnection.
This section explores the optimal creation of European SEW through the development of interconnection. The final result shows the markets to connect to, whether reinforcement of the GB network was necessary and the years to connect in, in order to maximise SEW. It is important to interpret the results in the context of the methodology undertaken:• Projects to markets that are not in the
optimal paths may well be beneficial, but simply not the most beneficial based on the assumptions made in this study.
• The attractiveness of different markets varies across the scenarios. Consequently there is uncertainty as to where the best opportunities lie, due to the uncertainty in future market conditions.
• The results should not be interpreted as a forecast: many other factors will influence the outcome for interconnection over the next decade and beyond.
• Variations in network constraint and construction costs will have a major impact on the attractiveness of projects.
• The optimal path is the most efficient way to optimise interconnection, but other pathways could result in a higher total level of interconnection and generate similar levels of SEW.
• Potential benefits of interconnection providing ancillary services to the GB network are outside the scope of this study.
The starting interconnection capacities shown in Table 6.1 include projects that are already in operation or have a high level of regulatory certainty. This base case level of interconnection of 15.9 GW represents a near quadrupling of existing interconnection capacity, which causes considerable price convergence between GB and mainland Europe as seen within the modelling. As the SEW generated by additional interconnection depends on the price differential between GB and European markets, the interconnectors that form the base case potentially diminish the level of additional SEW further interconnection can bring.
The iterative process finished after two iterations: no further capacity alterations yielded a higher overall present value than the base case. This resulted in an additional 1.5 GW of interconnection capacity: 1 GW from iteration 1 and 0.5 GW from iteration 2. The use of the output from this year’s NOA for the baseline network reinforcement assumptions in the NOA IC analysis broadly results in a reduction in the constraint savings across the interconnector options. The optimal solutions from the two iterations are shown in Table 6.3

Chapter six
Network Options Assessment 2017/18 – January 2018 112
The additional 1.5 GW interconnection capacity from the two iterations, combined with the base case interconnection capacity of 15.9 GW, results in a combined optimal level
of interconnection of 17.4 GW between GB and European markets by 2030. Figure 6.3 presents the optimal level of interconnection to each European market for the optimal path.
The optimisation analysis for iteration 1 resulted in Ireland representing the most beneficial market for increased interconnection. The average Irish wholesale price is modelled as generally higher than GB. A second mechanism which generates welfare is the alleviation of Ireland’s synchronous generation constraint,
where there is an imposed limit on how much Irish demand can be met by wind. These effects result in Irish exports to Britain to avoid wind curtailment, and British exports to Ireland to exploit arbitrage. Both sets of flows generate welfare.
Table 6.3 Optimal interconnection in addition to the base case level
Figure 6.3 Optimal level of interconnection to each European market
Iteration Capacity Country Reinforcement Connecting Zone Connection Year
1 1000 MW Ireland None Zone 2 2030
2 500 MW Norway B6 + B8 Zone 1 2025
Cap
acit
y o
f In
terc
onn
ecti
on
(GW
)
Belgium
0
6
7
4
5
3
1
2
8
Denmark France Germany Ireland Netherlands Norway Spain
Current + Planned + Optimal Current

Cha
pter
six
Network Options Assessment 2017/18 – January 2018 113
Interconnection analysis
Figure 6.4 shows a sample of the results of iteration 1 for one scenario only, that is
Two Degrees and for the interconnector options connecting in 2030.
Figure 6.4 Net Present Value relative to base case for Iteration 1, for Two Degrees scenario and interconnector options connecting in 2030
The results have been ordered by highest to lowest net present value for each option. It can be seen from Figure 6.4 that for this particular scenario and connection year Ireland is the only market that clearly shows welfare benefits outweighing estimated costs, although two of the Belgium options are also marginally positive.
The optimisation analysis for iteration 2 resulted in Norway representing the most beneficial market for increased interconnection.
However a number of other markets show positive attributable welfare and constraint costs benefits relative to the base case. The chart also shows the impact of GB interconnection zone and associated boundary reinforcements on attributable constraint costs.
Mill
ions
(£)
-3,000
0
-1,000
-2,000
1,000
2,000
3,000
TD
-Non
e-Ire
land
Zon
e 2
TD
-B8-
Irela
nd Z
one
2 T
D-N
one-
Irela
nd Z
one
3 T
D-S
W1-
Irela
nd Z
one
3 T
D-N
one-
Bel
gium
Zon
e 4
TD
-EC
5-B
elgi
um Z
one
4TD
-Bas
eTD
-B6+
B8-
Nor
way
Zon
e 1
TD
-EC
5-Th
e N
ethe
rland
s Zo
ne 4
TD-N
one-
The
Net
herla
nds
Zone
4TD
-Non
e-N
orw
ay Z
one
1TD
-SC
1+B
15-F
ranc
e Zo
ne 6
TD-S
C1-
Fran
ce Z
one
5TD
-SC
1+B
15-T
he N
ethe
rland
s Zo
ne 6
TD-S
C1-
Fran
ce Z
one
6TD
-Non
e-G
erm
any
Zone
4TD
-EC
5-G
erm
any
Zone
4TD
-EC
5-D
enm
ark
Zone
4TD
-Non
e-D
enm
ark
Zone
4TD
-SC
1-Sp
ain
Zone
5TD
-SC
1+B
15-B
elgi
um Z
one
6TD
-Non
e-G
erm
any
Zone
7TD
-Non
e-D
enm
ark
Zone
7TD
-Non
e-N
orw
ay Z
one
2TD
-B8-
Nor
way
Zon
e 2
TD-N
one-
Fran
ce Z
one
5TD
-Non
e-Fr
ance
Zon
e 6
TD-N
one-
The
Net
herla
nds
Zone
6TD
-Non
e-Sp
ain
Zone
5TD
-Non
e-B
elgi
um Z
one
6
Capex 2030 Attributable Constraints 2030Attributable Welfare 2030 NPV 2030

Chapter six
Network Options Assessment 2017/18 – January 2018 114
Figure 6.5 shows a sample of the results of iteration 2 for one scenario only, that is Slow
Progression and for the interconnector options connecting in 2025.
Figure 6.5 Net Present Value relative to base case for Iteration 2, Slow Progression scenario and interconnector options connecting in 2025
Although the option of Norway interconnector with additional reinforcement of the B6 and B8 boundaries results in the largest capex costs, this is more than offset by the significant increase in constraint savings that the interconnector offers.
The chart also shows that apart from the option of Norway interconnector with additional reinforcement of the B6 and B8 boundaries, the constraint savings relative to the base case are often very small, and for some
options negative. This is because this year’s NOA IC analysis uses the recommendations from this year’s NOA as the baseline network reinforcement assumptions, leading to lower additional constraint savings from additional interconnection. Figure 6.5 also shows that for the majority of cases the attributable welfare relative to the base case is negative, indicating that there is no additional welfare benefit for adding an additional interconnector in those particular options.
Mill
ions
(£)
-2,000
£0
-1,000
2,000
1,000
3,000
SP
-B6+
B8-
Nor
way
Zon
e 1
SP-
SC1+
B15
-Bel
gium
Zon
e 6
SP-
Bas
e S
P-SC
1+B
15-T
he N
ethe
rland
s Zo
ne 6
SP-S
C1+
B15
-Fra
nce
Zone
6SP
-Non
e-Ire
land
Zon
e 3
SP-N
one-
Irela
nd Z
one
2SP
-SW
1-Ire
land
Zon
e 3
SP-N
one-
Nor
way
Zon
e 1
SP-N
one-
Bel
gium
Zon
e 4
SP-S
C1-
Fran
ce Z
one
5SP
-EC
5-B
elgi
um Z
one
4SP
-Non
e-Fr
ance
Zon
e 5
SP-N
one-
The
Net
herla
nds
Zone
4SP
-B8-
Irela
nd Z
one
2SP
-SC
1-Sp
ain
Zone
5SP
-EC
5-Th
e N
ethe
rland
s Zo
ne 4
SP-N
one-
Spai
n Zo
ne 5
SP-N
one-
Ger
man
y Zo
ne 4
SP-E
C5-
Ger
man
y Zo
ne 4
SP-N
one-
Den
mar
k Zo
ne 4
SP-N
one-
Ger
man
y Zo
ne 7
SP-N
one-
Den
mar
k Zo
ne 7
SP-E
C5-
Den
mar
k Zo
ne 4
SP-N
one-
Nor
way
Zon
e 2
SP-S
C1-
Fran
ce Z
one
6SP
-Non
e-Th
e N
ethe
rland
s Zo
ne 6
SP-N
one-
Bel
gium
Zon
e 6
SP-N
one-
Fran
ce Z
one
6SP
-B8-
Nor
way
Zon
e 2
Capex 2025 Attributable Constraints 2025Attributable Welfare 2025 NPV 2025

Cha
pter
six
Network Options Assessment 2017/18 – January 2018 115
Interconnection analysis
Figure 6.6 SEW for GB and connecting country only for Iteration 1, Consumer Power scenario
Figure 6.6 shows the levels of welfare for only GB and the connecting country for each interconnector, relative to the base case. It shows there is additional welfare for GB and the connecting country in nearly all instances. It clearly shows the consumer welfare benefit of Ireland being able to access
cheaper electricity within the GB market and shows the producer welfare benefit of cheaper Norwegian and Spanish generation being able to access the GB market. This shows that the negative welfare values in Figure 6.5 are being driven by markets other than GB.
To
tal W
elfa
re (£
mill
ions
)
Norway
-1,500
1,000
1,500
0
500
-500
-1,000
2,000
Ireland Belgium Denmark Germany Netherlands France Spain
Sum of IC Sum of Consumer Sum of Producer Total welfare
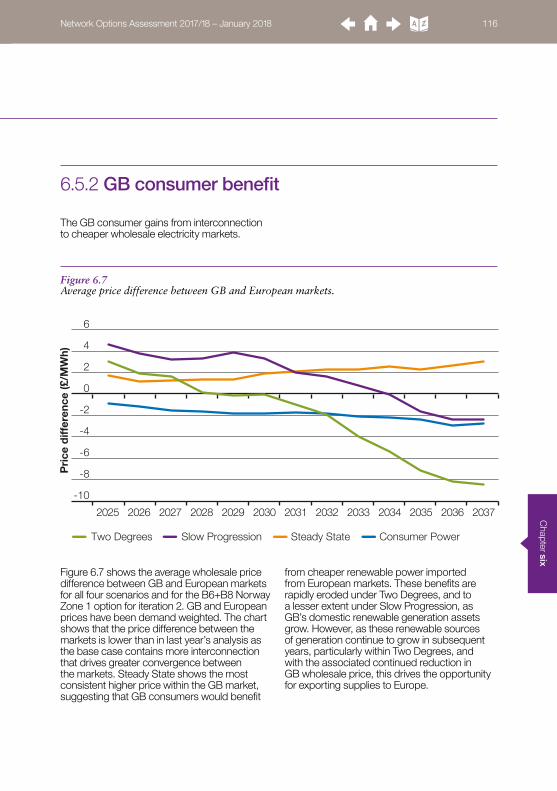
Chapter six
Network Options Assessment 2017/18 – January 2018 116
Figure 6.7 Average price difference between GB and European markets.
6.5.2 GB consumer benefit
The GB consumer gains from interconnection to cheaper wholesale electricity markets.
Figure 6.7 shows the average wholesale price difference between GB and European markets for all four scenarios and for the B6+B8 Norway Zone 1 option for iteration 2. GB and European prices have been demand weighted. The chart shows that the price difference between the markets is lower than in last year’s analysis as the base case contains more interconnection that drives greater convergence between the markets. Steady State shows the most consistent higher price within the GB market, suggesting that GB consumers would benefit
from cheaper renewable power imported from European markets. These benefits are rapidly eroded under Two Degrees, and to a lesser extent under Slow Progression, as GB’s domestic renewable generation assets grow. However, as these renewable sources of generation continue to grow in subsequent years, particularly within Two Degrees, and with the associated continued reduction in GB wholesale price, this drives the opportunity for exporting supplies to Europe.
Pri
ce d
iffer
ence
(£/M
Wh)
-10
2
4
-2
0
-4
-8
-6
6
2025 2026 2027 2028 2029 2030 2031 2032 2033 2034 2035 2036 2037
Two Degrees Slow Progression Steady State Consumer Power

Cha
pter
six
Network Options Assessment 2017/18 – January 2018 117
Interconnection analysis
6.5.4 Benefits of overall increase in interconnection
6.5.4.1 Overall impact on wholesale prices
Increased levels of interconnection bring significant benefits to GB and European consumers, both in terms of lower wholesale energy prices and greater use of renewable power.
The additional interconnection drives down the average European price as cheaper generation is able to displace more expensive generation.
6.5.3 Interaction of interconnectors and constraints
The impact on GB constraints costs is dependent on the location of the interconnector on the GB network and the level of onshore reinforcement built to accommodate the interconnector. Constraint costs are incurred on the network when power within the merit order is limited from outputting due to network restrictions. In this event, the System Operator will incur balancing mechanism costs to turn down the generation which is not able to output and offer on generation elsewhere on the system to alleviate the constraint. Interconnection to different markets provides the System Operator with another balancing option. The inclusion of additional interconnection to GB may either help or hinder
system balancing, as balancing mechanism costs increase or decrease as network boundaries are further strained or relieved. This can be seen in Figures 6.4 and 6.5 by the wide range of positive and negative attributable constraint costs relative to the base case. Flows across the GB network can be summarised as flowing from high levels of generation in the north to high levels of demand in the south. Interconnectors connected in the north may help alleviate constraints when exporting from GB and increase constraints when importing to GB. Conversely interconnectors connected to the south of England may reduce network constraints when importing and exacerbate constraints when exporting.

Chapter six
Network Options Assessment 2017/18 – January 2018 118
Figure 6.8 Combined increases in welfare for all years, all Europe
These price changes drive increases in European welfare. However as stated previously, as capacity is increased, prices between the two markets converge and
additional SEW benefits are reduced. This is shown in Figure 6.8, which shows increase in welfare for all interconnector options and scenarios, relative to the base case.
Figure 6.8 shows the total European welfare relative to the base case for all 29 interconnector options for all four scenarios, with the interconnector options connecting in 2025. The horizontal axis shows the 29 interconnector options from Table 6.2 (excluding the base case). The results have been ordered from
highest to lowest in each scenario. It can be seen that while some options produce significant positive welfare relative to the base case, the majority produce less. This is a result of the high level of interconnection already included within the base case.
Att
rib
utab
le W
elfa
re (£
mill
ions
)
-300
200
300
100
0
-200
-100
400
Interconnector options1 2 3 4 5 6 7 8 9 10 11 12 13 14 15 16 17 18 19 20 21 22 23 24 25 26 2728 29
Two Degrees Slow Progression Steady State Consumer Power

Cha
pter
six
Network Options Assessment 2017/18 – January 2018 119
Interconnection analysis
Figure 6.9 Reduction in CO2 output over the optimal path
6.5.4.2 Environmental implications
Interconnectors can also increase access to renewable sources of power. Interconnection allows surplus power to be exported, rather than curtailed. The exported power may replace more expensive sources of generation, which may well use fossil fuels. Figure 6.9 shows how
there is a reduction in the level of carbon dioxide output over the length of the study, as the requirement to curtail clean renewable energy sources is reduced as interconnection capacity increases.
Figure 6.9 shows the annual CO2 emissions for the optimal path from iteration 2 with the inclusion of the additional interconnectors to Ireland and Norway, and for the base case for
iteration 1 that includes neither. The additional interconnection results in an increased reduction in CO2 emissions of over 550 million tonnes over the thirteen-year period modelled.
CO
2 (m
illio
ns o
f to
nnes
)
2025 2026 2027 2028 2029 2030 2031 2032 2033 2034 2035 2036 2037
0
600
700
800
900
400
500
300
100
200
1000
SS It1 Base case SS It 2 B6+B8 Norway Zone 1
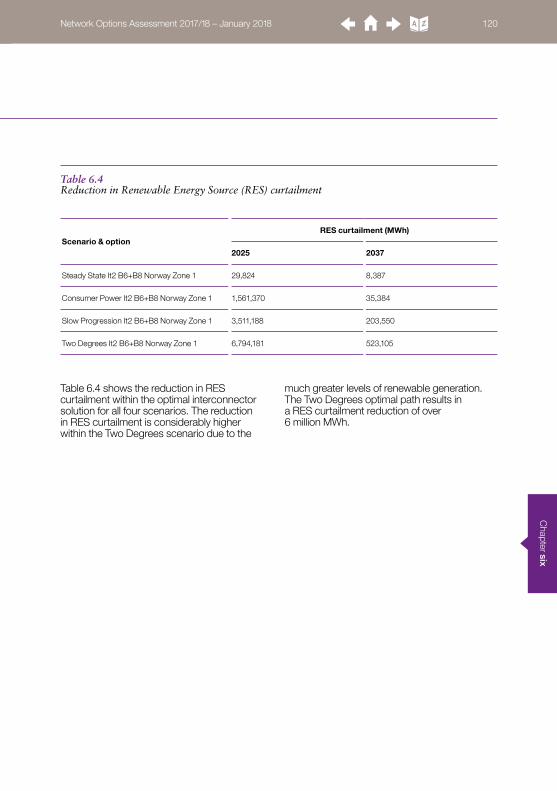
Chapter six
Network Options Assessment 2017/18 – January 2018 120
Table 6.4 Reduction in Renewable Energy Source (RES) curtailment
Table 6.4 shows the reduction in RES curtailment within the optimal interconnector solution for all four scenarios. The reduction in RES curtailment is considerably higher within the Two Degrees scenario due to the
much greater levels of renewable generation. The Two Degrees optimal path results in a RES curtailment reduction of over 6 million MWh.
Scenario & optionRES curtailment (MWh)
2025 2037
Steady State It2 B6+B8 Norway Zone 1 29,824 8,387
Consumer Power It2 B6+B8 Norway Zone 1 1,561,370 35,384
Slow Progression It2 B6+B8 Norway Zone 1 3,511,188 203,550
Two Degrees It2 B6+B8 Norway Zone 1 6,794,181 523,105

Cha
pter
six
Network Options Assessment 2017/18 – January 2018 121
Interconnection analysis
6.6 Summary
The analysis shows that increased levels of interconnection continue to present an opportunity for creating value for GB and Europe, both economically and environmentally. Interconnection enables the more efficient dispatch of generation across Europe, leading to savings for consumers, increased profits for generators and income for interconnector developers. The analysis added an additional 1.5 GW of interconnection capacity to the 15.9 GW already included within the interconnection base case, resulting in a total interconnection capacity of 17.4 GW. This is more than a quadrupling of existing GB interconnection capacity of 4 GW. It is important to restate that this is not a forecast, as many other factors outside the scope of this analysis will influence the outcome for
GB interconnection over the next decade and beyond. Uncertainty in future market conditions, variations in network constraint and construction costs and potential additional benefits of interconnection providing ancillary services to the GB network are just some of the variables which will have an impact on future interconnection.
Uncertainty regarding developments in the physical network, the make-up of Europe’s energy landscape and further opportunities for creating value from interconnection mean this study can only represent a partial snapshot of the future of GB interconnection, but the analysis does show that potential opportunities still remain for additional GB interconnection.
This year we developed the NOA for Interconnectors methodology based on stakeholder feedback. We want to hear your feedback on this year’s analysis. We also want to know how we can continue to improve this analysis to increase its value to you. For NOA for Interconnectors 2018/19 we intend to investigate the operability challenges and solutions interconnectors can offer, including the provision of ancillary services. We look forward to your involvement in the NOA for Interconnectors consultation in 2018.

Chapter sevenStakeholder engagement 123
Network Options Assessment 2017/18 – January 2018 122

Cha
pter
sev
enNetwork Options Assessment 2017/18 – January 2018 123
7.1 Introduction
We’d like your feedback and comments on this NOA publication, and your help to improve it. Please take part in our 2018 stakeholder engagement programme so we know what you need.
Stakeholder engagement

Chapter seven
Network Options Assessment 2017/18 – January 2018 124
Your feedback is an important part of the way we continue revising and developing the NOA and the ETYS. And because the two documents are closely related, we’ll make sure that the way we communicate and consult with you reflects this. We’ll make sure that the NOA publication continues to add value by:• identifying and understanding our
stakeholders’ views and opinions • providing opportunities for constructive
debate throughout the process• creating open and two-way communication
with our stakeholders to discuss assumptions, drivers and outputs; and
• telling you how your views have been considered, and reporting back on the engagement process.
The NOA annual review process will help us to develop the publication. We’ll encourage all interested parties to get involved, which will help us improve the publication every year. After we published the first NOA in March 2016 we received some very helpful feedback. We used this to make changes to the second NOA, and since then feedback has been very specialised and less about the report’s design. Having explained more about the cost–benefit process in our methodology chapter we have looked to improve this area further.
We would like to hear more about how we can improve the NOA publication. As mentioned in Chapter 1, we have a number of developments planned to drive further value from the NOA. We will be
publishing a long-term roadmap in the spring and your views will be important in shaping that before and after the publication. We will also publish results of the trials throughout the year as they emerge and your views will help shape how the extended approach is built into the annual NOA process. We will be sharing and testing the developments with a wide range of industry participants. If you would like to get involved or for a member of the team to attend an event to talk about them please get in contact via the email address on the following page.
We have sought your views at various points through this NOA which we list again here:• We’ve brought in the NOA Committee
and use implied probabilities to strengthen the methodology. How did you find the explanations for these new parts of the NOA process?
• Following feedback about NOA 2016/17, we restructured chapter 5 so that it contained more narrative and less raw data. This data has moved to a new appendix A. Please tell us your views on how we’ve changed chapter 5.
• This year we developed the NOA for Interconnectors methodology based on stakeholder feedback. We want to hear your feedback on this year’s analysis. We also want to know how we can continue to improve this analysis to increase its value to you.
7.2 Continuous development
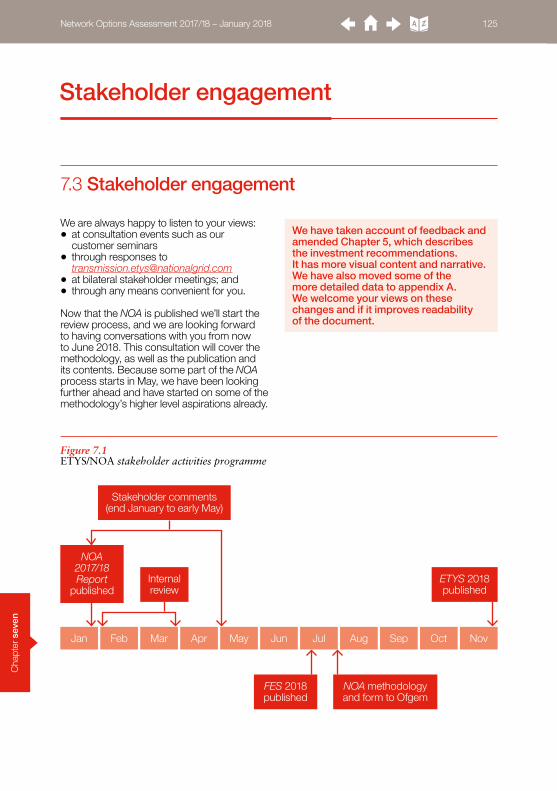
Cha
pter
sev
en
Jan
NOA 2017/18 Report
published
FES 2018 published
NOA methodology and form to Ofgem
Stakeholder comments (end January to early May)
ETYS 2018 published
Internal review
MayMar Jul SepFeb JunApr Aug Oct Nov
Network Options Assessment 2017/18 – January 2018 125
Stakeholder engagement
We are always happy to listen to your views:• at consultation events such as our
customer seminars• through responses to
[email protected]• at bilateral stakeholder meetings; and• through any means convenient for you.
Now that the NOA is published we’ll start the review process, and we are looking forward to having conversations with you from now to June 2018. This consultation will cover the methodology, as well as the publication and its contents. Because some part of the NOA process starts in May, we have been looking further ahead and have started on some of the methodology’s higher level aspirations already.
7.3 Stakeholder engagement
We have taken account of feedback and amended Chapter 5, which describes the investment recommendations. It has more visual content and narrative. We have also moved some of the more detailed data to appendix A. We welcome your views on these changes and if it improves readability of the document.
Figure 7.1 ETYS/NOA stakeholder activities programme

Network Options Assessment 2017/18 – January 2018 126
Chapter eightAppendix A – Economic analysis results
Appendix B – SWW projects
Appendix C – List of four-letter codes
Appendix D – Meet the team
Appendix E – Glossary
Disclaimer
Network Options Assessment 2017/18 – January 2018 126

C
hapt
er e
ight
Network Options Assessment 2017/18 – January 2018 127
Appendix A Economic analysis results
Table A.1 Optimum Delivery Dates – Scotland and the North of England region
OptionCode Description EISD
Optimum Delivery Date
Two Degrees
Slow Progression
Consumer Power
Steady State
CDRE Cellarhead to Drakelow reconductoring 2021 2028 2028 2028 N/A
CPRE Reconductor sections of Penwortham to Padiham and Penwortham to Carrington 2021 2021 N/A N/A N/A
DNEU Denny North 400/275kV Super Grid Transformer 2 2021 2026 N/A N/A N/A
DWNO Denny to Wishaw 400kV reinforcement 2028 2028 2028 2028 2030
E2DC Eastern subsea HVDC Link from Torness to Hawthorn Pit 2027 2027 2027 2027 N/A
E4DC Eastern subsea HVDC Link from Peterhead to Hawthorn Pit 2028 2028 2028 2028 2028
ECU2 East Coast onshore 275kV upgrade 2023 2023 2023 2023 2023
ECUP East Coast onshore 400kV incremental reinforcement 2026 2026 2026 2026 2026
EHRE Elvanfoot to Harker reconductoring 2023 2029 2028 2028 N/A
HAE2 Harker SuperGrid Transformer 5 replacement 2022 2027 2027 2027 N/A
HAEU Harker SuperGrid Transformer 6 replacement 2021 2029 2021 2021 2021
HNNO Hunterston East–Neilston 400kV reinforcement 2023 2023 2023 2023 2023
HPNO New east–west circuit between the north east and Lancashire 2027 2028 2028 2028 N/A
LDQB Lister Drive quad booster 2020 N/A 2021 N/A N/A
LNRE Reconductor Lackenby to Norton single 400kV circuit 2021 2025 2026 2026 2028
NOHW Thermal uprate 55km of the Norton to Osbaldwick 400kV double circuit 2019 2024 2025 2025 N/A
NOR1 Reconductor 13.75km of Norton to Osbaldwick 400kV double circuit 2021 2021 2021 2021 2023
OENO Central Yorkshire reinforcement 2026 2027 2027 2027 N/A
TDH1 Drax to Thornton 2 circuit thermal uprating 2019 2019 2019 2020 N/A
TDH2 Drax to Thornton 1 circuit thermal uprating 2019 2025 2026 2026 N/A
THS1 Install series reactors at Thornton 2022 2023 2023 2023 2028
TURC Reactive compensation at Tummel 2022 2026 N/A N/A N/A
WHT2Turn-in of West Boldon to Hartlepool circuit at Hawthorn Pit (with a different delivery year to WHTI)
2022 N/A N/A 2022 2023
WHTI Turn-in of West Boldon to Hartlepool circuit at Hawthorn Pit 2021 2021 2021 N/A N/A
WLTI Windyhill to Lambhill to Longannet 275kV circuit turn-in to Denny North 275kV substation 2021 2023 2023 2023 2023
Tables A.1–3 present the results from our cost–benefit analysis. The results highlight optimal options with optimum delivery dates across different scenarios and sensitivities.
Options with an optimum delivery date that is the same as their EISD are deemed 'critical'. Critical options are in bold.

C
hapter eight
Network Options Assessment 2017/18 – January 2018 128
Table A.2 Optimum Delivery Dates – the South and East of England region
OptionCode Description EISD
Optimum Delivery DateTw
o D
egre
es
Slo
w
Pro
gre
ssio
n
Co
nsu
mer
P
ow
er
Ste
ady
Sta
te
Loca
l C
ont
ract
ed A
Loca
l C
ont
ract
ed B
No
Loca
l C
ont
ract
ed A
No
Loca
l C
ont
ract
ed B
BFHW Bramley to Fleet circuits thermal uprating 2019 2023 2023 N/A N/A 2023 2023 2023 2023
BMMS 225MVAr MSCs at Burwell Main 2023 2023 2023 2023 2023 2023 2023 2023 2023
BNRCBolney and Ninfield additional reactive compensation
2022 2022 2023 N/A N/A 2022 2022 2022 2022
BRREReconductor remainder of Bramford to Braintree to Rayleigh route
2020 2023 2023 2023 2023 2022 2023 2023 2023
BTNOA new 400kV double circuit between Bramford and Twinstead
2025 2027 2030 2029 N/A 2025 2028 2027 2027
CTREReconductor remainder of Coryton South to Tilbury circuit
2019 2021 2021 2021 2021 2021 2021 2021 2021
ESC1Second Elstree to St John's Wood 400kV circuit
2022 2022 2025 2025 2032 2022 2022 2022 2022
FLR2Fleet to Lovedean reconductoring (with a different conductor type to FLRE)
2020 2020 2020 2020 2023 2020 2020 2020 2020
GKEUThermal upgrade for Grain and Kingsnorth 400kV substation
2020 2021 2021 2021 2026 2021 2021 2021 2021
HMHWHinkley Point to Melksham circuits thermal uprating
2019 2029 2029 2021 2025 2027 2029 2028 2028
HWUPUprate Hackney, Tottenham and Waltham Cross 275kV to 400kV
2023 2025 2026 2026 N/A 2025 2025 2025 2025
KLREKemsley to Littlebrook circuits uprating
2020 2020 2020 2020 2020 2020 2020 2020 2020
NBREReconductor Bramford to Norwich double circuit
2021 2024 2024 2024 2024 2024 2024 2024 2024
RTREReconductor remainder of Rayleigh to Tilbury circuit
2020 2021 2021 2021 2021 2021 2021 2021 2021
SCN2
New 400kV transmission route between south London and the south coast ( an alternative design to SCN1 )
2027 N/A 2027 N/A 2027 2027 2027 N/A N/A
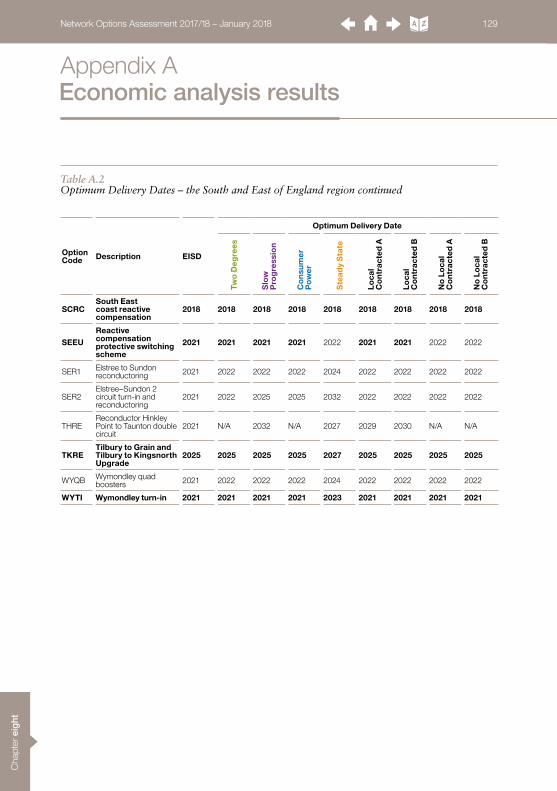
C
hapt
er e
ight
Network Options Assessment 2017/18 – January 2018 129
OptionCode Description EISD
Optimum Delivery DateTw
o D
egre
es
Slo
w
Pro
gre
ssio
n
Co
nsu
mer
P
ow
er
Ste
ady
Sta
te
Loca
l C
ont
ract
ed A
Loca
l C
ont
ract
ed B
No
Loca
l C
ont
ract
ed A
No
Loca
l C
ont
ract
ed B
SCRCSouth East coast reactive compensation
2018 2018 2018 2018 2018 2018 2018 2018 2018
SEEUReactive compensation protective switching scheme
2021 2021 2021 2021 2022 2021 2021 2022 2022
SER1 Elstree to Sundon reconductoring 2021 2022 2022 2022 2024 2022 2022 2022 2022
SER2Elstree–Sundon 2 circuit turn-in and reconductoring
2021 2022 2025 2025 2032 2022 2022 2022 2022
THREReconductor Hinkley Point to Taunton double circuit
2021 N/A 2032 N/A 2027 2029 2030 N/A N/A
TKRETilbury to Grain and Tilbury to Kingsnorth Upgrade
2025 2025 2025 2025 2027 2025 2025 2025 2025
WYQB Wymondley quad boosters 2021 2022 2022 2022 2024 2022 2022 2022 2022
WYTI Wymondley turn-in 2021 2021 2021 2021 2023 2021 2021 2021 2021
Table A.2 Optimum Delivery Dates – the South and East of England region continued
Appendix A Economic analysis results
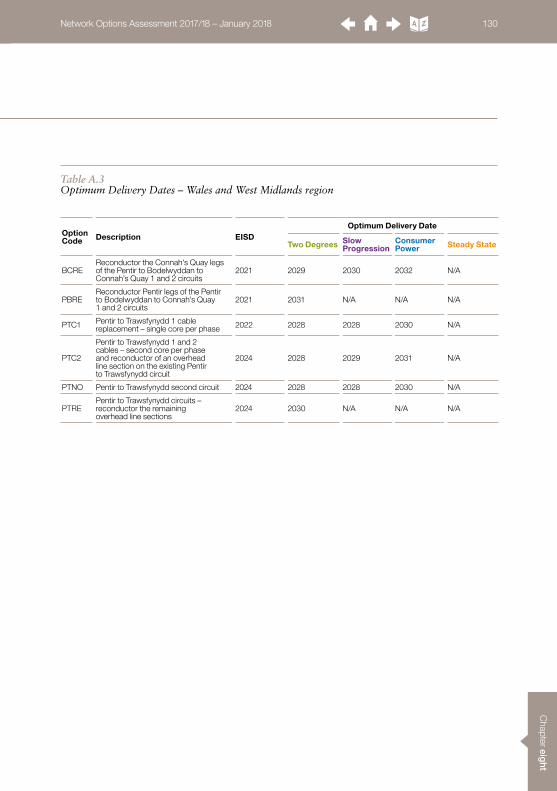
C
hapter eight
Network Options Assessment 2017/18 – January 2018 130
Table A.3 Optimum Delivery Dates – Wales and West Midlands region
OptionCode Description EISD
Optimum Delivery Date
Two Degrees Slow Progression
Consumer Power Steady State
BCREReconductor the Connah's Quay legs of the Pentir to Bodelwyddan to Connah’s Quay 1 and 2 circuits
2021 2029 2030 2032 N/A
PBREReconductor Pentir legs of the Pentir to Bodelwyddan to Connah’s Quay 1 and 2 circuits
2021 2031 N/A N/A N/A
PTC1 Pentir to Trawsfynydd 1 cable replacement – single core per phase 2022 2028 2028 2030 N/A
PTC2
Pentir to Trawsfynydd 1 and 2 cables – second core per phase and reconductor of an overhead line section on the existing Pentir to Trawsfynydd circuit
2024 2028 2029 2031 N/A
PTNO Pentir to Trawsfynydd second circuit 2024 2028 2028 2030 N/A
PTREPentir to Trawsfynydd circuits –reconductor the remaining overhead line sections
2024 2030 N/A N/A N/A

C
hapt
er e
ight
Network Options Assessment 2017/18 – January 2018 131
Table A.4 Regrets for Scotland and the North of England region options
Combination Two Degrees Slow Progression
Consumer Power Steady State Worst regret
(1) Progress all critical options except WHT2 £0.05m £1.12m £0.22m £3.47m £3.47m
(2) Progress all critical options except WHT2 and TDH1 £0.71m £1.11m £6.18m £3.36m £6.18m
(3) Progress all critical options except TDH1 £0.74m £0.81m £6.20m £3.36m £6.20m
(4) Progress all critical options except HAEU £0.03m £15.58m £6.10m £10.66m £15.58m
(5) Progress all critical options except HAEU and TDH1 £0.69m £15.58m £12.06m £10.55m £15.58m
(6) Progress all critical options except HAEU, CPRE and WHT2 £30.73m £15.67m £5.86m £10.44m £30.73m
(7) Progress all critical options except HAEU and CPRE £30.76m £15.37m £5.89m £10.45m £30.76m
(8) Progress all critical options except CPRE £30.81m £0.59m £0.03m £3.25m £30.81m
(9) Progress all critical options except HAEU, TDH1, CPRE and WHT2 £31.39m £15.67m £11.82m £10.33m £31.39m
(10) Progress all critical options except HAEU, TDH1 and CPRE £31.42m £15.36m £11.84m £10.33m £31.42m
Appendix A Economic analysis results
Tables A.4–5 present the results from our single year least regret analysis. The top 10 investment strategies are listed with their economic regrets across different scenarios and sensitivities. The best strategy with the
least worst regret is highlighted in green. There is no critical option found for the Wales and West Midlands region, hence no result for the region is presented.
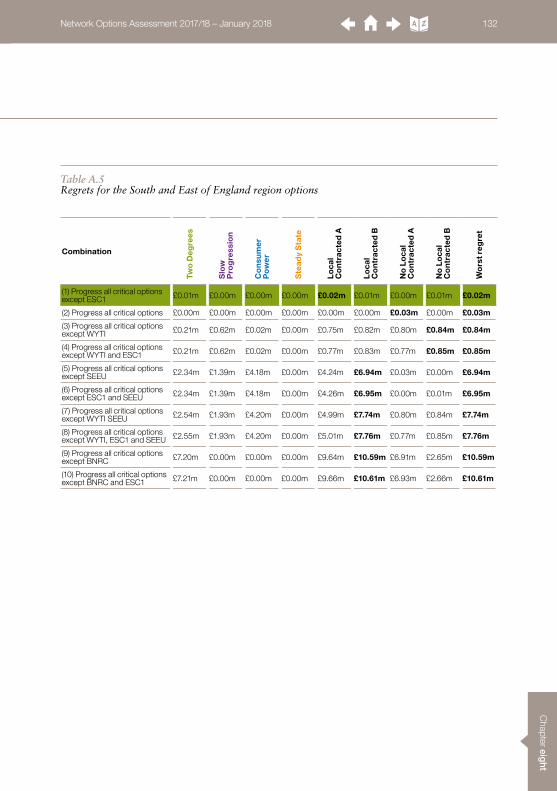
C
hapter eight
Network Options Assessment 2017/18 – January 2018 132
Table A.5 Regrets for the South and East of England region options
Combination
Two
Deg
rees
Slo
w
Pro
gre
ssio
n
Co
nsu
mer
P
ow
er
Ste
ady
Sta
te
Loca
l C
ont
ract
ed A
Loca
l C
ont
ract
ed B
No
Loca
l C
ont
ract
ed A
No
Loca
l C
ont
ract
ed B
Wo
rst r
egre
t
(1) Progress all critical options except ESC1 £0.01m £0.00m £0.00m £0.00m £0.02m £0.01m £0.00m £0.01m £0.02m
(2) Progress all critical options £0.00m £0.00m £0.00m £0.00m £0.00m £0.00m £0.03m £0.00m £0.03m
(3) Progress all critical options except WYTI £0.21m £0.62m £0.02m £0.00m £0.75m £0.82m £0.80m £0.84m £0.84m
(4) Progress all critical options except WYTI and ESC1 £0.21m £0.62m £0.02m £0.00m £0.77m £0.83m £0.77m £0.85m £0.85m
(5) Progress all critical options except SEEU £2.34m £1.39m £4.18m £0.00m £4.24m £6.94m £0.03m £0.00m £6.94m
(6) Progress all critical options except ESC1 and SEEU £2.34m £1.39m £4.18m £0.00m £4.26m £6.95m £0.00m £0.01m £6.95m
(7) Progress all critical options except WYTI SEEU £2.54m £1.93m £4.20m £0.00m £4.99m £7.74m £0.80m £0.84m £7.74m
(8) Progress all critical options except WYTI, ESC1 and SEEU £2.55m £1.93m £4.20m £0.00m £5.01m £7.76m £0.77m £0.85m £7.76m
(9) Progress all critical options except BNRC £7.20m £0.00m £0.00m £0.00m £9.64m £10.59m £6.91m £2.65m £10.59m
(10) Progress all critical options except BNRC and ESC1 £7.21m £0.00m £0.00m £0.00m £9.66m £10.61m £6.93m £2.66m £10.61m
C
hapt
er e
ight
Network Options Assessment 2017/18 – January 2018 133
Appendix B SWW Projects
1. BackgroundShetland possesses attractive renewable resources that developers have targeted, seeking to invest in onshore wind projects. At present, there is no connection between Shetland and the GB Main Interconnected Transmission System (MITS). There is a total of 496 MW of generation connected and contracted for connection. This excludes 67 MW of diesel generation at Lerwick Power Station and 15 MW of export from the Sullom Voe Terminal. There are further interests from developers of onshore wind energy projects of up to 105 MW.
As a consequence of these projects a link to the Scottish mainland will be required to facilitate export into the GB MITS.
2. Option developmentA number of reinforcement options have been considered to provide transmission capacity between Shetland and the Scottish mainland to facilitate the connection of the island generation. The Shetland link reinforcement would also help to improve the security of supply on the Shetland Island. The factors taken into account in developing the options include:• Corridor (the geographical route between
Shetland and the MITS on the UK mainland).• Technology (High Voltage Direct Current
(HVDC) technology versus Alternating Current (AC) technology).
• Capacity (MW rating including the potential for future growth in renewables on the island).
Details of the options considered are given below.
2.1 Options(a) Caithness to Shetland 600 MW subsea linkConstruct a 278km, 600 MW Voltage Sourced Converter (VSC) HVDC connection between Shetland (at Kergord) and the Caithness to Moray HVDC link due to be completed in 2018 via the HVDC Switching Station at Noss Head (in Caithness) to form a three-terminal HVDC scheme. The work includes a 132kV AC Gas Insulated Switchgear (GIS) substation and a 600 MW VSC HVDC converter at Kergord.
(b) Caithness to Shetland 450 MW subsea linkConstruct a 278km, 450 MW VSC HVDC connection between Shetland (at Kergord) and the Caithness to Moray HVDC link due to be completed in 2018 via the HVDC Switching Station at Noss Head (in Caithness) to form a three-terminal HVDC scheme. The work includes a 132kV AC GIS substation and a 450 MW VSC HVDC converter at Kergord.
(c) Moray to Shetland 600 MW subsea linkConstruct a 343km, 600 MW VSC HVDC connection between Shetland (at Kergord) and the Blackhillock substation in Moray. The work includes a 132kV AC GIS substation and a 600 MW VSC HVDC converter at Kergord and a 600 MW converter at Blackhillock.
8.1 Shetland Link

C
hapter eight
Network Options Assessment 2017/18 – January 2018 134
2.2 Current lead option Following an optioneering exercise that was undertaken to identify the most economic, efficient and coordinated option, the Caithness to Shetland 600 MW HVDC subsea link option was identified as the lead option. This is because there are high wind load factors on Shetland and the 450 MW HVDC link option would leave too much generation being constrained when there is a large penetration of wind on the islands. The additional cost of the 600 MW HVDC link reinforcement is more than recovered by reductions in constraint costs under the high wind penetration scenario and therefore the 600 MW HVDC link is identified as the least worst regret option.
2.3 StatusOn 12 October 2017, the UK Government confirmed the intention to include remote Scottish Island generation schemes in the next emerging technologies Contracts for Difference auction in 2019. It is expected that the results of this auction will be known by October 2019, allowing approval of the Needs Case and award of the construction contract in the first quarter of 2020. Construction would be expected to be complete towards the end of 2023, and the option in service by the first quarter of 2024. Over the next six months the key activities on this project include:• Progression of key planning and
consenting activities.• Preparation of a Needs Case submission.• Continuation of stakeholder engagement.• Completion of engineering design.• Commencement of outstanding
procurement.

C
hapt
er e
ight
Network Options Assessment 2017/18 – January 2018 135
Appendix B SWW Projects
1. BackgroundThe Orkney archipelago is rich in renewable resources with developers seeking to invest in particular in marine and onshore wind projects. At present there is no transmission infrastructure on Orkney and the island is supplied by Scottish Hydro Electric Power Distribution (SHEPD) via two 33kV subsea cable connections from Thurso Grid Supply Point on the GB Main Interconnected Transmission System (MITS). SHEPD operates a flexible solution on the island through an Active Network Management (ANM) scheme. This has enabled connection of additional generation beyond the 'firm' limit of the 33kV cables. The ANM scheme is now operating at full capacity. There is a total of 461 MW of generation that is contracted for connection to the MITS. In addition, there have been a number of embedded generators that have applied to SHEPD for connection as a consortia.
As a consequence of this commitment, SHE Transmission is proposing a new transmission link from Orkney to the Scottish mainland to facilitate the connection and export of the generation to the MITS.
2. Option developmentSeveral reinforcement options have been considered to provide additional transmission capacity between Orkney and the Scottish mainland to facilitate the connection of the islands’ generation. The Orkney Link reinforcement, while providing connection and export of new generation from the island, would also help to improve the security of power supply to the island. The criteria considered in developing the options include:• Stakeholder Engagement.• Alternative commercial arrangements.• Corridor (the geographical route between
Orkney and the MITS on the UK mainland).• Environmental considerations and planning
consent (this include both onshore and offshore considerations).
• Technology (High Voltage Direct Current (HVDC) technology versus Alternating Current (AC) technology).
• Capacity (MW rating including the potential for future growth in renewables on the islands).
8.2 Orkney Link
C
hapter eight
Network Options Assessment 2017/18 – January 2018 136
Details of the preferred options considered are given below.
2.1 Options(a) Dounreay to Orkney, Finstown subsea linkInstall a 220 MW 220kV HVAC cable link approximately 70km in length (55km subsea and 15km land) between Dounreay and Finstown in the Orkney Island with landfall around Billia Croo on the west cost of Orkney. At Dounreay the 220kV cable is proposed to connect on the 275kV busbar via a 275/220kV SuperGrid Transformer (SGT) and similarly at Finstown the cable will connect to a new 132kV double busbar via a 220/132kV SGT. The Finstown substation 132kV double busbar will interface with the new 132kV local transmission infrastructure to facilitate generation connection and export from the island.
(b) Dounreay to Orkney, Orphir subsea linkInstall a 220 MW 220kV HVAC cable link approximately 60km in length (46km subsea and 14km land) between Dounreay and Orphir in the Orkney Island with landfall around Rackwick Bay on Hoy. At Dounreay the 220kV cable is proposed to connect on the 275kV busbar via a 275/220kVSGT and similarly at Orphir the cable will connect to a new 132kV double busbar via a 220/132kV SGT. The Orphir substation 132kV double busbar will interface with the new 132kV local transmission infrastructure to facilitate generation connection and export from the island.
2.2 Current lead optionAfter carrying out the route assessment the SHE Transmission preference is for the Dounreay to Orkney, Finstown subsea link route option. A further optioneering exercise is being carried out to investigate the impact of the design, timing and capacity of the proposed link.
2.3 StatusIn order to meet the Orkney link target completion date of 2022, it is expected that the submission of the SWW Needs Case will be in Q1 2018 followed by a Project Assessment in Q3. The construction work would be expected to start in 2020. Over the next six months the key activities include:• Continuation of stakeholder engagement.• Conclusion of cost–benefit analysis
with the SO.• Submission of the SWW Needs Case
in Q1 2018.• Public consultation on alternative
commercial arrangements in Q1 2018.• Continuation of key planning and
consenting activities.• SWW Project Assessment submission
in Q2 2018.

C
hapt
er e
ight
Network Options Assessment 2017/18 – January 2018 137
Appendix B SWW Projects
1. BackgroundThe Western Isles possess attractive renewable resources which developers have targeted, seeking to invest in wind and marine generation projects. At present the existing Western Isles system operates with a restricted 132kV connection to the Scottish mainland1. A total generation capacity of 431 MW is made up of generation either connected or contracted for connection.
As a consequence of these generation projects a higher capacity link to the Scottish mainland will be required to facilitate export onto the GB Main Interconnected Transmission System (MITS).
2. Option developmentA number of reinforcement options have been developed to provide additional transmission capacity between the Western Isles and the Scottish mainland in order to facilitate the connection of the island generation. The Western Isles link reinforcement would also help to improve the security of supply on the Western Isles and reduce the requirement on two diesel stand-by generation facilities currently in place. The factors taken into account in developing the link reinforcement options include:• Corridor (the geographical route between
Western Isles and the MITS on the UK mainland).
• Technology (High Voltage Direct Current (HVDC) technology versus Alternating Current (AC) technology).
• Capacity (MW rating including the potential for future growth in renewables on the island).
Details of the options considered are given below.
2.1 Options(a) Beauly to Western Isles, Gravir 450 MW HVDC LinkConstruct a 450 MW Voltage Sourced Converter (VSC) HVDC connection between Beauly on the Scottish mainland (located north west of Inverness) and Gravir on the east coast of the Isle of Lewis via Dundonnell on the west coast of Scotland. The circuit will be a mix of onshore cable (77km between Beauly and Dundonnell) and offshore cable (80km between Dundonnell and Gravir). The 450 MW converter stations will be located at Beauly and Gravir. At Beauly, the circuit will interface with the GB MITS via a 400kV GIS substation. At Gravir the circuit will interface with the local Lewis infrastructure via a 132kV GIS substation.
(b) Beauly to Western Isles, Arnish 450 MW HVDC LinkConstruct a 450 MW VSC HVDC connection between Beauly on the Scottish mainland (located north west of Inverness) and Arnish on the east coast of the Isle of Lewis via Dundonnell on the west coast of Scotland. The circuit will be a mix of onshore cable (77km between Beauly and Dundonnell) and offshore cable (79km between Dundonnell and Arnish) cable. The 450 MW converter stations will be located at Beauly and Arnish. At Beauly, the circuit will interface with the GB Main Interconnected Transmission System (MITS) via a 400kV GIS substation. At Arnish the circuit will interface with the local Lewis infrastructure via a 132kV GIS substation.
8.3 Western Isles Link
1 Single circuit connection from Fort Augustus which includes a 33kV subsea cable section between Ardmore and Harris.
C
hapter eight
Network Options Assessment 2017/18 – January 2018 138
(c) Beauly to Western Isles, Arnish 600 MW HVDC LinkConstruct a 600 MW VSC HVDC connection between Beauly on the Scottish mainland (located north west of Inverness) and Arnish on the east coast of the Isle of Lewis via Dundonnell on the west coast of Scotland. The circuit will be a mix of onshore cable (77km between Beauly and Dundonnell) and offshore cable (79km between Dundonnell and Arnish). The 600 MW converter stations will be located at Beauly and Arnish. At Beauly, the circuit will interface with the GB MITS via a 400kV GIS substation. At Arnish the circuit will interface with the local Lewis infrastructure via a 132kV GIS substation.
2.2 Current lead optionAn optioneering exercise was undertaken to identify the most economic, efficient and coordinated development option. Based on the initial cost–benefit analysis, the current lead option is the 450 MW HVDC Link to Arnish. The TO is currently progressing a retender exercise for provision of the HVDC Link. The optioneering work will need to be revisited when this is concluded. This may result in an alternative least worst regret option.
2.3 StatusOn 12 October 2017, the UK Government confirmed the intention to include remote Scottish Island generation schemes in the next emerging technologies Contracts for Difference auction in 2019. It is expected that the results of this auction will be known by October 2019, allowing approval of the Needs Case and award of the construction contract in the first quarter of 2020. Construction would be expected to be complete in early 2023, and the option in service by the end of that year. Over the next six months the key activities include:• Conclusion of tender negotiations and
appointment of a Preferred Contractor.• Progression of key planning and
consenting activities.• Preparation of Needs Case submission.• Continuation of stakeholder engagement.
C
hapt
er e
ight
Network Options Assessment 2017/18 – January 2018 139
Appendix B SWW Projects
1. BackgroundThe scope of the reinforcements included for the eastern network in the northern region includes offshore HVDC links as well as onshore reinforcement. These reinforcement projects increase capability on one or multiple of the MITS boundaries B1, B1a, B2, B4, B5, B6, B7, B7a. The objective is to increase the north to south transfer capability on the east coast of the Scottish and northern England Transmission system between boundaries B1 in the Scottish Hydro Electric Transmission (SHE Transmission) area and B7a in the National Grid Electricity Transmission (NGET) area arising from predominantly new renewable generation in Scotland. This includes key boundaries between SHE Transmission and SP Transmission (B4) and between SP Transmission (SPT) and NGET (B6).
A number of reinforcements are proposed to improve the transfer capability in accordance with the NETS SQSS2 and pursuant to the Transmission Owners’ obligations in their transmission licences. Of these reinforcements, there are two offshore eastern subsea HVDC links – one from Peterhead in north east Scotland to Hawthorn Pit in north east England (E4DC), the other from Torness in south east Scotland to Hawthorn Pit (E2DC). Both options involve the construction of a 2 GW HVDC link and associated AC onshore works on either end of the link. E4DC increases transfer capability on boundaries B1 down to B7a. E2DC increases transfer capability on boundaries B6 down to B7a.
The scope of the eastern onshore reinforcements involves increasing the capacity of the eastern onshore circuits between Blackhillock and Kincardine that cross B1a, B2 and B4 by initially augmenting their capability at 275kV. Further uplift in capacity will be delivered by uprating these circuits to operate at 400kV.
The recommendation from the 2017 NOA process is to progress the following reinforcements for the eastern network in the northern region this year to maintain the earliest in-service date (EISD):• East Coast onshore 275kV upgrade (ECU2) –
EISD of 2023.• East Coast onshore 400kV incremental
reinforcement (ECUP) – EISD of 2026.• E2DC – EISD of 2027.• E4DC – EISD of 2028.
The requirement to reinforce the transmission network is driven fundamentally by the growth of predominantly renewable generation in the SHE Transmission and SPT areas, including offshore windfarms situated in the Moray Firth and in the Firth of Forth. Figure 8.1 and Figure 8.2 show the Required Transfers3 for boundaries B4 and B6 for the four scenarios in the 2016 and 2017 Future Energy Scenarios (FES). The figures also show the current network capabilities across the two boundaries as well as capability increases for approved reinforcements. The difference between the Required Transfers and the network capability shows a requirement for further network reinforcement.
8.4 Eastern Network Reinforcement
2 The NETS SQSS is the National Electricity Transmission System Security and Quality of Supply Standard. GB Transmission Owners have licence obligations to develop their transmission systems in accordance with the NETS SQSS.
3 The Required Transfer figures shown take into account interconnectors connecting to the GB Transmission system in the 2016 and 2017 Future Energy Scenarios.

C
hapter eight
Network Options Assessment 2017/18 – January 2018 140
Figure 8.1 Boundary B4 (SHE Transmission/ SPT) required transfer and capability
Figure 8.2 Boundary B6 (SPT/NGET) required transfer and capability
MW
0
10,000
8,000
6,000
4,000
2,000
12,000
2017 2019 2021 2023 2025 2027 2029 2031 2033 2035 2037 2039 2041Gone Green 2016Consumer Power 2016Steady State 2017 Base CapabilityConsumer Power 2017
Two Degrees 2017 Slow Progression 2017Slow Progression 2016 No Progression 2016
MW
0
14,000
12,000
10,000
8,000
6,000
4,000
2,000
16,000
2017 2019 2021 2023 2025 2027 2029 2031 2033 2035 2037 2039 2041Gone Green 2016Consumer Power 2016Steady State 2017
Two Degrees 2017 Slow Progression 2017Slow Progression 2016 No Progression 2016
Base CapabilityConsumer Power 2017

C
hapt
er e
ight
Network Options Assessment 2017/18 – January 2018 141
2. Option developmentA number of reinforcement options have been developed for the eastern network in the northern region to improve boundary capability across boundaries B1 to B7a. These options consider onshore and offshore solutions.
2.1 Options(a) East Coast onshore 275kV upgrade (ECU2) Establish a new 275kV substation at Alyth, including shunt reactive compensation at Alyth, extend Tealing 275kV substation and install two phase-shifting transformers, re-profile the 275kV circuits between Kintore, Alyth and Kincardine, and Tealing, Westfield and Longannet, and uprate the cable sections at Kincardine and Longannet. This reinforcement option provides additional transmission capacity across boundaries B1, B1a, B2 and B4.
(b) East Coast onshore 400kV incremental reinforcement (ECUP)Following ECU2, establish new 400kV substations at Rothienorman and Kintore, uprate Alyth substation for 400kV operation, re-insulate the 275kV circuits between Blackhillock, Rothienorman, Kintore, Fetteresso, Alyth and Kincardine for 400kV operation and install phase-shifting transformers at Blackhillock. This reinforcement option provides additional transmission capacity across boundaries B1, B1a, B2 and B4.
(c) East Coast onshore 400kV reinforcement (ECU4)Establish new 400kV substations at Rothienorman, Kintore and Alyth, re-insulate the 275kV circuits between Blackhillock, Rothienorman, Kintore, Fetteresso, Alyth and Kincardine for 400kV operation, install phase-shifting transformers at Blackhillock, re-profile the 275kV circuits between Tealing, Westfield and Longannet, and uprate the cable sections at Longannet. This reinforcement option provides additional transmission capacity across boundaries B1, B1a, B2 and B4.
(d) Eastern subsea HVDC Link from Peterhead to Hawthorn Pit (E4DC)Construct a new offshore 2 GW HVDC subsea link from Peterhead (north east of Scotland) to Hawthorn Pit (north of England), including AC/DC converter stations and associated AC onshore works at the Peterhead and Hawthorn Pit ends of the link. The AC onshore works at the Peterhead end include the upgrade of the 275kV circuits along the Blackhillock–Rothienorman–Peterhead route to 400kV operation. The AC onshore works at Hawthorn Pit include a new 400kV Hawthorn Pit GIS substation, uprating of the Hawthorn Pit–Norton circuit and associated circuit reconfiguration works in the area. This reinforcement option provides additional transmission capacity across boundaries B1, B1a, B2, B4, B5, B6, B7, and B7a.
(e) Eastern Scotland to England Link: Torness to Hawthorn Pit Offshore HVDC (E2DC)Construct a new offshore 2 GW HVDC subsea link from the Torness area to Hawthorn Pit, including AC/DC converter stations and associated AC works at Torness and Hawthorn Pit. The AC onshore works in the vicinity of the Torness end include extension of the pre-existing ‘Branxton 400kV substation’ by two 400kV GIS bays to provide connection to the ‘Branxton Converter Station’. The AC onshore works at Hawthorn Pit include a new 400kV Hawthorn Pit GIS substation, uprating of the Hawthorn Pit–Norton circuit and associated circuit reconfiguration works in the area. This reinforcement option provides additional transmission capacity across boundaries B6, B7 and B7a.
(f) Eastern Scotland to England Link: Torness to north east England AC reinforcement (TLNO)Install a new double circuit from a new 400kV substation in the Torness area to a connection point on the transmission system in north east England. Construct a new 400kV double circuit from the Torness area to the SPT/NGET border. Continue construction of the double circuit into a suitable connection point in north east England, providing additional substation equipment where required. This reinforcement option provides additional thermal capacity across boundaries B6, B7 and B7a.
Appendix B SWW Projects

C
hapter eight
Network Options Assessment 2017/18 – January 2018 142
2.2 Current lead optionsIn the NOA3, E4DC, E2DC, ECUP, ECU2 and DWNO have been identified as the most efficient and economical reinforcements.
(a) Eastern subsea HVDC Link from Peterhead to Hawthorn Pit (E4DC)Based on FES 2017 generation background, E4DC is identified in the optimal path and critical in all four scenarios. It can provide boundary capabilities across B1 to B7a, which helps transfer renewable energy surplus to north east England. It has a 'proceed' recommendation.
(b) Eastern Scotland to England Link: Torness to Hawthorn Pit Offshore HVDC (E2DC)E2DC is in optimal path for Two Degrees, Slow Progression and Consumer Power. As required from the EISD 2027, it is critical and has a 'proceed' recommendation. It unlocks transmission constraints across boundary B5 to B7a, working together with other reinforcements in the B7a and B8 area.
(c) East Coast onshore 275kV upgrade (ECU2) ECU2 has a 'proceed' recommendation in NOA3. It is justified reinforcement in all four FES scenarios this year and it is critical. It reinforces boundary B1 to B6, especially working well in B4.
(d) East Coast onshore 400kV incremental reinforcement (ECUP)ECUP is in the optimal path and critical in all four scenarios. It unlocks system constraints from B1 to B6, especially meeting the needs for the B4 boundary. As per regret analysis, ECUP has a 'proceed' recommendation.
Other options that feature in the NOA 2017/18 analysis for Scotland and the north of England region but that fall below the SWW threshold are likely to be considered in the SWW analysis. This is because they are interdependent to meet the common need of improving boundary transfer capability.
3. StatusA joint team has been established among the three onshore TOs to take the NOA options and examine them in more detail as part of the preparation of a SWW initial Needs Case submission to the regulator. This team has been organised initially to consider system requirements and project delivery. The TOs are working with the SO, who will undertake a cost–benefit analysis of the reinforcement options in more detail, to help identify optimum sequence and delivery dates for the reinforcements.
Current plans are for preliminary subsea cable routeing and survey work carried out some time ago to be refreshed. Further technical and environmental surveys will be required. For E4DC, planning permission for the 400kV substation at Peterhead has been granted and a preferred location for the convertor station at Peterhead has been identified. Design checks will be required for increasing the operating voltage of the overhead line between Peterhead and Blackhillock. For E4DC and E2DC, further preliminary works at the Hawthorn Pit end of the link will be required to establish the details of requirements in the area. It is expected in this NOA that the construction of the HVDC projects will take place between 2025 and 2028. The onshore projects in the SHE Transmission and SPT areas are scheduled for earlier delivery in the period 2023 for the 275kV works and 2026 for the 400kV uprate.

C
hapt
er e
ight
Network Options Assessment 2017/18 – January 2018 143
Appendix B SWW Projects
1. BackgroundThe South East region has a high concentration of both power demand and generation, with much of the demand found in London and generation in the Thames Estuary. Interconnection to Europe is present along the South East Coast and influences power flows in the region by importing and exporting power with continental Europe. The relevant boundaries are SC1, SC2, B10, B12, B15 and LE1. The South Coast boundary SC1 runs parallel with the South Coast of England between the Severn and Thames Estuaries. It is connected to the rest of the GB system by three double circuits and currently connects one interconnector. In the next 10 years, the capacity of interconnectors connecting along this transmission route is forecast to reach circa 7 GW, with a further 4 GW at Grain and Kingsnorth.
As the number of interconnectors as well as other new generation capacity increases over time, the losses in these long circuits at high transfer level will lead to low voltage and system collapse should certain faults occur unless the SO constrains generation and/or interconnectors. This limits the boundary transfer capacity.
Reinforcements are therefore required to develop the network in order to maintain the voltage in the South Coast at compliance levels, and to increase the thermal capability of the circuits connecting the region for the forecast increase in generation and interconnectors. Further increases in capacity will be delivered by new reactive compensation and circuit uprating, as recommended by NOA3 in the South Coast area.
2. Option developmentA number of reinforcement options have been developed for the South East Coast network in the South East region to improve boundary capability across boundaries SC1, SC2, B10, B12, B15 and LE1. These options consider a new transmission route, uprating existing route and reactive compensations.
2.1 OptionsWhile the consideration of a new double circuit is at a very early stage, other recommendations from the NOA process include progressing the following reinforcements for the South Coast region this year to maintain the earliest in-service date (EISD):• South East Coast reactive compensation
(SCRC) – EISD: 2018.• Kemsley to Littlebrook circuits uprating
(KLRE) – EISD: 2020. • Fleet to Lovedean reconductoring
(FLRE/FLR2) – EISD: 2020. • Tilbury to Grain and Tilbury to Kingsnorth
Upgrade (TKRE) – EISD: 2025.
These options apart from TKRE are sufficiently developed. The SO and TO will continue to investigate alternative options including operational intertrip schemes.
8.5 South East Network Reinforcement

C
hapter eight
Network Options Assessment 2017/18 – January 2018 144
2.2 Current lead optionA new cost-effective transmission route between south London and the South East (option 2, SCN2) has been recommended to improve the voltage depression and thermal capacity in accordance with the NETS SQSS and pursuant to the Transmission Owner’s obligations. The reinforcement consists of constructing a new 400kV double circuit from the South Coast area to south London. SCN2 will increase the transfer capability on boundaries SC1, SC2, B10, B12, B15 and LE1.
3. StatusThere has been limited work carried out for the new transmission route between south London and the South East Coast (option 2, SCN2). National Grid will work with stakeholders in advance of an SWW Initial Needs Case submission.

C
hapt
er e
ight
The list below is of the options assessed in this NOA publication together with their four-letter codes. The four-letter codes appear throughout the report in tables and charts. The list below is in alphabetical order. We’ve included the scheme number where it is available. Some options do not have scheme numbers, for instance if the option is new and/or has never been given the recommendation
to proceed in previous assessments. Other options have more than one scheme number where schemes have been combined for an option. Some options that might have scheme numbers are omitted if they do not provide a boundary benefit for NOA. The TORI number is the Transmission Owner Reinforcement Instruction number and applies in Scotland.
Four-letter code
Description TORI or scheme number
BCRE Reconductor the Connah's Quay legs of the Pentir to Bodelwyddan to Connah’s Quay 1 and 2 circuits
32018L1
BFHW Bramley to Fleet circuits thermal uprating
BFRE Bramley to Fleet reconductoring
BMMS 225MVAr MSCs at Burwell Main 33452
BNRC Bolney and Ninfield additional reactive compensation 33698, 33699
BRRE Reconductor remainder of Bramford to Braintree to Rayleigh route 33458
BTNO A new 400kV double circuit between Bramford and Twinstead 21847, 20834-1, 20834-4, 20834-3, 20834-5, 20834-6, 20834-2, 20834-2C, 20834_2A, 20834-2Q
CDRE Cellarhead to Drakelow reconductoring
COSC Series Compensation South of Cottam
COVC Two hybrid STATCOMS at Cottam
CPRE Reconductor sections of Penwortham to Padiham and Penwortham to Carrington
CPR2 Reconductor the remaining sections of Penwortham to Padiham and Penwortham to Carrington
CTRE Reconductor remainder of Coryton South to Tilbury circuit 21850-1
DNEU Denny North 400/275kV SuperGrid Transformer 2
DREU Generator circuit breaker replacement to allow Thornton to run two-way split
DWNO Denny to Wishaw 400kV reinforcement SPT-RI-003
E2DC Eastern subsea HVDC Link from Torness to Hawthorn Pit SPT-RI-126
E4DC Eastern subsea HVDC Link from Peterhead to Hawthorn Pit SHET-RI-025a, SHET-RI-025b, SHET-RI-025c, SHET-RI-025d
ECU2 East Coast onshore 275kV upgrade SHET-RI-009
ECU4 East Coast onshore 400kV reinforcement Variant of SHET-RI-093, SHET-RI-026
ECUP East Coast onshore 400kV incremental reinforcement SHET-RI-093, SHET-RI-026
EHRE Elvanfoot to Harker reconductoring SPT-RI-231
ESC1 Second Elstree to St John's Wood 400kV circuit
FBRE Beauly to Fyrish 275kV double circuit reconductoring Alternative to SHET-RI-058
Network Options Assessment 2017/18 – January 2018 145
Appendix CList of four-letter codes

C
hapter eight
Four-letter code
Description TORI or scheme number
FLRE Fleet to Lovedean reconductoring 31671-2
FLR2 Fleet to Lovedean reconductoring (alternative conductor)
GKEU Thermal upgrade for Grain and Kingsnorth 400kV substation
GKRE Reconductor Garforth Tee to Keadby leg of the Creyke Beck to Keadby to Killingholme Circuit
HAE2 Harker SuperGrid Transformer 5 replacement
HAEU Harker SuperGrid Transformer 6 replacement
HMHW Hinkley Point to Melksham circuits thermal uprating
HNNO Hunterston East–Neilston 400kV reinforcement
HPNO New east–west circuit between the north east and Lancashire
HSRE Reconductor Harker to Fourstones, Fourstones to Stella West and Harker to Stella West 275kV circuit
HSUP Uprate Harker to Fourstones, Fourstones to Stella West and Harker to Stella West 275kV circuit to 400kV
HWUP Uprate Hackney, Tottenham and Waltham Cross 275kV to 400kV
KLRE Kemsley to Littlebrook circuits uprating 20846-4
LDQB Lister Drive quad booster 21590
LNRE Reconductor Lackenby to Norton single 400kV circuit 20669
LNR2 Reconductor Lackenby to Norton single 400kV circuit (alternative conductor)
LTR3 Lackenby to Thornton 1 circuit thermal upgrade
MRUP Uprate the Penwortham to Washway Farm to Kirkby 275kV double circuit to 400kV
NBRE Reconductor Bramford to Norwich double circuit 11630, 11630I, 11630F
NOHW Thermal uprate 55km of the Norton to Osbaldwick 400kV double circuit
NOR1 Reconductor 13.75km of Norton to Osbaldwick 400kV double circuit 20640
NOR2 Reconductor 13.75km of Norton to Osbaldwick number 1 400kV circuit 33705
NOR4 Reconductor 13.75km of Norton to Osbaldwick number 2 400kV circuit
NPNO New east–west circuit between the north east and Lancashire
OENO Central Yorkshire reinforcement
OTHW Osbaldwick to Thornton 1 circuit thermal upgrade
PBRE Reconductor Pentir legs of the Pentir to Bodelwyddan to Connah’s Quay 1 and 2 circuits
32018L2
PTC1 Pentir to Trawsfynydd 1 cable replacement – single core per phase 33711
PTC2 Pentir to Trawsfynydd 1 and 2 cables – second core per phase and reconductor of an overhead line section on the existing Pentir to Trawsfynydd circuit
33708
PTNO Pentir to Trawsfynydd second circuit 30311, 30311-1L, 30311-1S, 30311-2, 30311-3C, 30311-6
PTRE Pentir to Trawsfynydd circuits – reconductor the remaining overhead line sections 33712
RTRE Reconductor remainder of Rayleigh to Tilbury circuit 21850-1
RYEU Substation reconfiguration and 225MVAr MSC at Ryhall
SCN1 New 400kV transmission route between south London and the south coast (there are two alternative designs for this option)
31832-2, 31832-3
SCN2 New 400kV transmission route between south London and the south coast (outline option 2 )
SCRC South East coast reactive compensation 31338, 31339, 21497-5
Network Options Assessment 2017/18 – January 2018 146

C
hapt
er e
ight
Four-letter code
Description TORI or scheme number
SEEU Reactive compensation protective switching scheme 33702
SER1 Elstree to Sundon reconductoring
SER2 Elstree–Sundon 2 circuit turn-in and reconductoring
SPDC Stella West to Padiham HVDC Link
TDH1 Drax to Thornton 2 circuit thermal uprating
TDH2 Drax to Thornton 1 circuit thermal uprating
TDRE Reconductor Drax to Thornton double circuit
THRE Reconductor Hinkley Point to Taunton double circuit
THS1 Install series reactors at Thornton 33506
TKRE Tilbury to Grain and Tilbury to Kingsnorth Upgrade
TLNO Torness to north east England AC reinforcement
TURC Reactive compensation at Tummel SHET-RI-69
WHTI Turn-in of West Boldon to Hartlepool circuit at Hawthorn Pit 21898-1
WHT2 Turn-in of West Boldon to Hartlepool circuit at Hawthorn Pit (delivered a year later than WHTI)
WLTI Windyhill to Lambhill to Longannet 275kV circuit turn-in to Denny North 275kV substation
SPT-RI-004
WYQB Wymondley quad boosters 32581S
WYTI Wymondley turn-in 32586S
Network Options Assessment 2017/18 – January 2018 147
Appendix CList of four-letter codes
C
hapter eight
Appendix DMeet the NOA team
Julian LeslieHead of Network Capability, [email protected]
The Network Capability (Electricity) team addresses the engineering challenges of electricity network operability by studying from the investment options stage in a changing energy landscape through to network access just a day ahead of real time.
Nicholas HarveyHead of Network [email protected]
The Network Development team is to ensure the development of an efficient and operable GB and offshore electricity transmission system by understanding present capabilities and working out the best options to meet the possible requirements that future energy scenarios show might happen.
In addition to publishing the NOA we are responsible for developing a holistic strategy for the NETS. This includes performing the following key activities:• Testing the FES against models of the GB
NETS to identify potential transmission requirements and publish in the ETYS.
• Supporting Needs Case studies of reinforcement options as part of the SWW process.
• Supporting cost–benefit studies of different connections designs.
• Developing strategies to enable a secure and operable GB transmission network in the long term against the network development and industry evolution background.
You can contact us to discuss about:The Network Options Assessment
Hannah Kirk-WilsonTechnical Economic Assessment [email protected]
Cost–benefit analysis and the Network Options Assessment
Marc VincentEconomics Team [email protected]
Network requirements and the Electricity Ten Year Statement
James WhitefordGB System Capability [email protected]
Network Development
Strategic network planning and production of the NOA requires support and information from many people. Parties who provide support and information that makes our work possible include:• National Grid Electricity Transmission
Asset Management
• SHE Transmission• SP Transmission• our customers.
Don’t forget you can also email us with your views on NOA at: [email protected]
Supporting parties
Network Options Assessment 2017/18 – January 2018 148

C
hapt
er e
ight
Acronym Word Description
ACS Average cold spell Average cold spell is defined as a particular combination of weather elements which gives rise to a level of winter peak demand which has a 50% chance of being exceeded as a result of weather variation alone. There are different definitions of ACS peak demand for different purposes.
BEIS Department of Business, Energy & Industrial Strategy
A UK government department. The Department of Business, Energy & Industrial Strategy (BEIS) works to make sure the UK has secure, clean, affordable energy supplies and promote international action to mitigate climate change. These activities were formerly the responsibility of the Department of Energy and Climate Change (DECC) which closed in July 2016.
BID3 BID3 is an economic dispatch optimisation model supplied by Pöyry Management Consulting. It can simulate all European power markets simultaneously including the impact of interconnection between markets. BID3 has been specifically developed for National Grid to model the impact of electricity networks in GB, allowing the System Operator to calculate constraint costs it would incur to balance the system, post-gate closure.
Boundary allowance An allowance in MW to be added in whole or in part to transfers arising out of the NETS SQSS economy planned transfer condition, to take some account of year-round variations in levels of generation and demand. This allowance is calculated by an empirical method described in Appendix F of the security and quality of supply standards (SQSS).
Boundary transfer capacity
The maximum pre-fault power that the transmission system can carry from the region on one side of a boundary to the region on the other side of the boundary while ensuring acceptable transmission system operating conditions will exist following one of a range of different faults.
CBA Cost–benefit analysis A method of assessing the benefits of a given project in comparison to the costs. This tool can help to provide a comparative base for all projects to be considered.
Contracted generation A term used to reference any generator who has entered into a contract to connect with the National Electricity Transmission System (NETS) on a given date while having a transmission entry capacity (TEC) figure as a requirement of said contract.
Double circuit overhead line
In the case of the onshore transmission system, this is a transmission line which consists of two circuits sharing the same towers for at least one span in SHE Transmission's system or NGET’s transmission system or for at least two miles in SP Transmission system. In the case of an offshore transmission system, this is a transmission line which consists of two circuits sharing the same towers for at least one span.
DNO Distribution Network Operator
Distribution network operators own and operate electricity distribution networks.
EISD Earliest In Service Date The earliest date when the project could be delivered and put into service, if investment in the project was started immediately.
Embedded generation Power generating stations/units that don’t have a contractual agreement with the National Electricity Transmission System Operator (NETSO). They reduce electricity demand on the National Electricity Transmission System.
ETYS Electricity Ten Year Statement
The Electricity Ten Year Statement is an annual publication by National Grid illustrating National Electricity Transmission System capability, future needs and opportunities.
FES Future Energy Scenarios
The FES is a range of credible futures which has been developed in conjunction with the energy industry. They are a set of scenarios covering the period from now to 2050, and are used to frame discussions and perform stress tests. They form the starting point for all transmission network and investment planning, and are used to identify future operability challenges and potential solutions.
GW Gigawatt 1,000,000,000 watts, a measure of power
GWh Gigawatt hour 1,000,000,000 watt hours, a unit of energy
GB Great Britain A geographical, social and economic grouping of countries that contains England, Scotland and Wales.
Network Options Assessment 2017/18 – January 2018 149
Appendix EGlossary
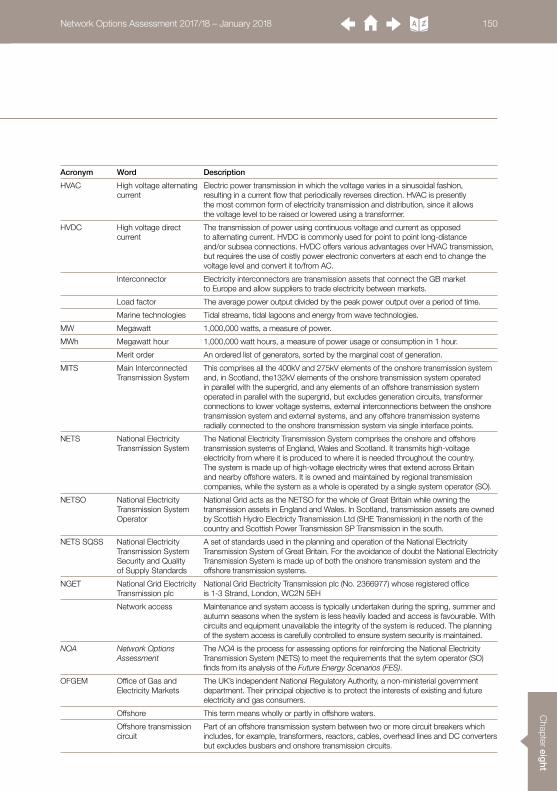
C
hapter eight
Acronym Word Description
HVAC High voltage alternating current
Electric power transmission in which the voltage varies in a sinusoidal fashion, resulting in a current flow that periodically reverses direction. HVAC is presently the most common form of electricity transmission and distribution, since it allows the voltage level to be raised or lowered using a transformer.
HVDC High voltage direct current
The transmission of power using continuous voltage and current as opposed to alternating current. HVDC is commonly used for point to point long-distance and/or subsea connections. HVDC offers various advantages over HVAC transmission, but requires the use of costly power electronic converters at each end to change the voltage level and convert it to/from AC.
Interconnector Electricity interconnectors are transmission assets that connect the GB market to Europe and allow suppliers to trade electricity between markets.
Load factor The average power output divided by the peak power output over a period of time.
Marine technologies Tidal streams, tidal lagoons and energy from wave technologies.
MW Megawatt 1,000,000 watts, a measure of power.
MWh Megawatt hour 1,000,000 watt hours, a measure of power usage or consumption in 1 hour.
Merit order An ordered list of generators, sorted by the marginal cost of generation.
MITS Main Interconnected Transmission System
This comprises all the 400kV and 275kV elements of the onshore transmission system and, in Scotland, the132kV elements of the onshore transmission system operated in parallel with the supergrid, and any elements of an offshore transmission system operated in parallel with the supergrid, but excludes generation circuits, transformer connections to lower voltage systems, external interconnections between the onshore transmission system and external systems, and any offshore transmission systems radially connected to the onshore transmission system via single interface points.
NETS National Electricity Transmission System
The National Electricity Transmission System comprises the onshore and offshore transmission systems of England, Wales and Scotland. It transmits high-voltage electricity from where it is produced to where it is needed throughout the country. The system is made up of high-voltage electricity wires that extend across Britain and nearby offshore waters. It is owned and maintained by regional transmission companies, while the system as a whole is operated by a single system operator (SO).
NETSO National Electricity Transmission System Operator
National Grid acts as the NETSO for the whole of Great Britain while owning the transmission assets in England and Wales. In Scotland, transmission assets are owned by Scottish Hydro Electricty Transmission Ltd (SHE Transmission) in the north of the country and Scottish Power Transmission SP Transmission in the south.
NETS SQSS National Electricity Transmission System Security and Quality of Supply Standards
A set of standards used in the planning and operation of the National Electricity Transmission System of Great Britain. For the avoidance of doubt the National Electricity Transmission System is made up of both the onshore transmission system and the offshore transmission systems.
NGET National Grid Electricity Transmission plc
National Grid Electricity Transmission plc (No. 2366977) whose registered office is 1-3 Strand, London, WC2N 5EH
Network access Maintenance and system access is typically undertaken during the spring, summer and autumn seasons when the system is less heavily loaded and access is favourable. With circuits and equipment unavailable the integrity of the system is reduced. The planning of the system access is carefully controlled to ensure system security is maintained.
NOA Network Options Assessment
The NOA is the process for assessing options for reinforcing the National Electricity Transmission System (NETS) to meet the requirements that the sytem operator (SO) finds from its analysis of the Future Energy Scenarios (FES).
OFGEM Office of Gas and Electricity Markets
The UK’s independent National Regulatory Authority, a non-ministerial government department. Their principal objective is to protect the interests of existing and future electricity and gas consumers.
Offshore This term means wholly or partly in offshore waters.
Offshore transmission circuit
Part of an offshore transmission system between two or more circuit breakers which includes, for example, transformers, reactors, cables, overhead lines and DC converters but excludes busbars and onshore transmission circuits.
Network Options Assessment 2017/18 – January 2018 150
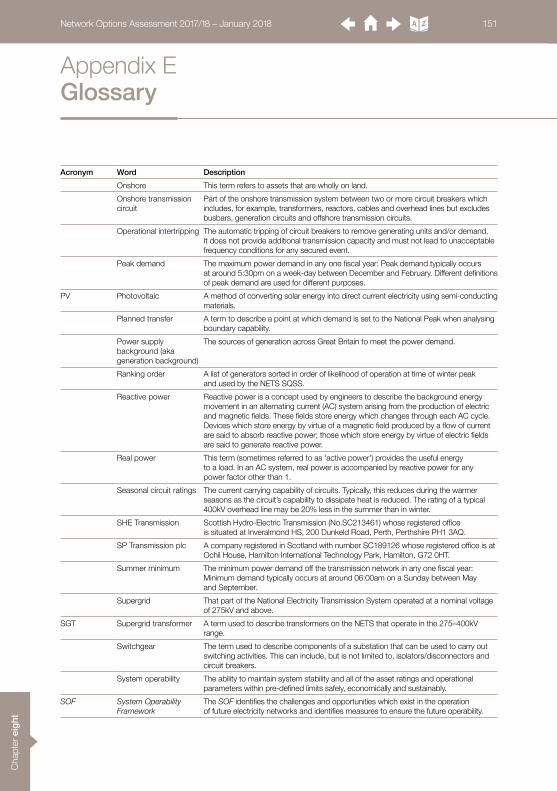
C
hapt
er e
ight
Acronym Word Description
Onshore This term refers to assets that are wholly on land.
Onshore transmission circuit
Part of the onshore transmission system between two or more circuit breakers which includes, for example, transformers, reactors, cables and overhead lines but excludes busbars, generation circuits and offshore transmission circuits.
Operational intertripping The automatic tripping of circuit breakers to remove generating units and/or demand. It does not provide additional transmission capacity and must not lead to unacceptable frequency conditions for any secured event.
Peak demand The maximum power demand in any one fiscal year: Peak demand typically occurs at around 5:30pm on a week-day between December and February. Different definitions of peak demand are used for different purposes.
PV Photovoltaic A method of converting solar energy into direct current electricity using semi-conducting materials.
Planned transfer A term to describe a point at which demand is set to the National Peak when analysing boundary capability.
Power supply background (aka generation background)
The sources of generation across Great Britain to meet the power demand.
Ranking order A list of generators sorted in order of likelihood of operation at time of winter peak and used by the NETS SQSS.
Reactive power Reactive power is a concept used by engineers to describe the background energy movement in an alternating current (AC) system arising from the production of electric and magnetic fields. These fields store energy which changes through each AC cycle. Devices which store energy by virtue of a magnetic field produced by a flow of current are said to absorb reactive power; those which store energy by virtue of electric fields are said to generate reactive power.
Real power This term (sometimes referred to as 'active power') provides the useful energy to a load. In an AC system, real power is accompanied by reactive power for any power factor other than 1.
Seasonal circuit ratings The current carrying capability of circuits. Typically, this reduces during the warmer seasons as the circuit’s capability to dissipate heat is reduced. The rating of a typical 400kV overhead line may be 20% less in the summer than in winter.
SHE Transmission Scottish Hydro-Electric Transmission (No.SC213461) whose registered office is situated at Inveralmond HS, 200 Dunkeld Road, Perth, Perthshire PH1 3AQ.
SP Transmission plc A company registered in Scotland with number SC189126 whose registered office is at Ochil House, Hamilton International Technology Park, Hamilton, G72 0HT.
Summer minimum The minimum power demand off the transmission network in any one fiscal year: Minimum demand typically occurs at around 06:00am on a Sunday between May and September.
Supergrid That part of the National Electricity Transmission System operated at a nominal voltage of 275kV and above.
SGT Supergrid transformer A term used to describe transformers on the NETS that operate in the 275–400kV range.
Switchgear The term used to describe components of a substation that can be used to carry out switching activities. This can include, but is not limited to, isolators/disconnectors and circuit breakers.
System operability The ability to maintain system stability and all of the asset ratings and operational parameters within pre-defined limits safely, economically and sustainably.
SOF System Operability Framework
The SOF identifies the challenges and opportunities which exist in the operation of future electricity networks and identifies measures to ensure the future operability.
Network Options Assessment 2017/18 – January 2018 151
Appendix EGlossary

C
hapter eight
Acronym Word Description
SO System Operator An entity entrusted with transporting energy in the form of natural gas or power on a regional or national level, using fixed infrastructure. Unlike a TSO, the SO may not necessarily own the assets concerned. For example, National Grid operates the electricity transmission system in Scotland, which is owned by Scottish Hydro Electricity Transmission and Scottish Power.
System stability With reduced power demand and a tendency for higher system voltages during the summer months, fewer generators will operate and those that do run could be at reduced power factor output. This condition has a tendency to reduce the dynamic stability of the NETS. Therefore network stability analysis is usually performed for summer minimum demand conditions as this represents the limiting period.
SWW Strategic Wider Works This is a funding mechanism as part of the RIIO-T1 price control that allows TOs to bring forward large investment projects that have not been funded in the price control settlement.
Transmission circuit This is either an onshore transmission circuit or an offshore transmission circuit.
TEC Transmission entry capacity
The maximum amount of active power deliverable by a power station at its grid entry point (which can be either onshore or offshore). This will be the maximum power deliverable by all of the generating units within the power station, minus any auxiliary loads.
Transmission losses Power losses that are caused by the electrical resistance of the transmission system.
TO Transmission Owners A collective term used to describe the three transmission asset owners within Great Britain, namely National Grid Electricity Transmission, Scottish Hydro-Electric Transmission Limited and SP Transmission Limited.
TSO Transmission SystemOperators
An entity entrusted with transporting energy in the form of natural gas or power on a regional or national level, using fixed infrastructure.
Turn-in At some substations, a transmission circuit passes the substation without connecting to that substation. A turn-in breaks the transmission circuit and diverts it into the substation.
Network Options Assessment 2017/18 – January 2018 152

C
hapt
er e
ight
The information contained within this Network Options Assessment Report document (‘the Document’) is published by National Grid Electricity Transmission plc (‘NGET’) without charge and in accordance with Standard Condition C27 (‘C27’) of the NGET transmission licence.
Whilst the information within the Document has been prepared and published in accordance with the requirements of C27, no warranty can be or is made as to the accuracy and completeness of the information contained within the Document and parties using information within the report should make their own enquiries as to its accuracy and suitability for the purpose for which they use it. Neither NGET nor the other companies within the National Grid group (nor the directors or the
employees of any such company) shall be under any liability for any error or misstatement or opinion on which the recipient of the Document relies or seeks to rely (other than fraudulent misstatement or fraudulent misrepresentation) and does not accept any responsibility for any use which is made of the information or Document or (to the extent permitted by law) for any damages or losses incurred. Copyright National Grid 2018, all rights reserved.
No part of this Document may be reproduced in any material form (including photocopying and restoring in any medium or electronic means and whether or not transiently or incidentally) without the written permission of National Grid except in accordance with the provisions of the Copyright, Designs and Patents Act 1988.
Network Options Assessment 2017/18 – January 2018 153
Disclaimer

Join our mailing list to receive emailupdates for NOA. www.nationalgrid.com/noa
Email us with your viewson NOA at:[email protected] we will get in touch.
Access our current and pastNOA documents and data at:www.nationalgrid.com/noa
Keep up to date on key issuesrelating to National Grid via ourConnecting website:www.nationalgridconnecting.com
You can write to us at:NOA TeamElectricity Network DevelopmentNational Grid HouseWarwick Technology ParkGallows HillWarwickCV34 6DA
Continuing the conversation
National Grid UK
@nationalgriduk
NationalGridUK
National Grid
Network Options Assessment 2017/18 – January 2018

National Grid plcNational Grid House, Warwick Technology Park, Gallows Hill, Warwick. CV34 6DA United KingdomRegistered in England and Wales No. 4031152
www.nationalgrid.com