Embed Size (px)
Citation preview

NETWORK, CPM DAN PERT
Dr. Mohammad Abdul Mukhyi, SE., MM
1

PENDAHULUAN
Hal penting dalam manajemen proyek adalah :Ketepatan memilih bentuk organisasi (tim)Ketepatan memilih bentuk organisasi (tim)Memilih manajer proyek yang tepatAktifit i t i d k di i b ikAktifitas integrasi dan koordinasi yang baik
Diluar hal tsb diperlukan :Apa yang akan dikerjakanBagaimana pengendaliannya?
2

LINGKUP PEKERJAAN
Perencanaan dan pengendalian :S b l k di l iSebelum proyek dimulaiSelama proyek berlangsungKoreksi pada saat terjadi perbedaan antararencana dan
l kpelaksanaanDitujukan untuk mengurangi ketidakpastian tentang
g k dih ilk d i g j kapa yang akan dihasilkan dari pengerjaan proyek
3

ALAT ALAT PERENCANAAN
Banyak metoda yang digunakan dalam perencanaanantara lain:
Work breakdown structure (WBS) untukmenentukan pekerjaan pekerjaan yang ada dalamproyekproyek.Matriks tanggungjawab untuk menentukanorganisasi proyek, orang orang kunci dantanggungjawabnyatanggungjawabnya.Gantt charts digunakan untuk menunjukkan jadwalinduk proyek, dan jadwal pekerjaan secara detail.Jaringan kerja (network) untuk memperlihatkanurutan pekerjaan, kapan dimuiai, kapan selesai, kapan proyek secara keseluruhan selesai.p p y
4

PENDEFINISIAN PEKERJAANUtk proyek dalam skala besar diperlukan metode untukmenentukan elemen‐elemen proyek dalam bagian yang lebih detail.lebih detail.Dapat diketahui keterkaian antar aktifitas, urutan waktudan personilnya.Work Breakdown Structure (WBS)Work Breakdown Structure (WBS)
Manfaat dari WBS :Dalam tahap analisis WBS dapat digunakan untuk memastikan akurasi dan kelengkapan dari semua personil proyekDijadikan sebagai dasar penganggaran dan penjadwalanSebagai alat kontrol pelaksanaan proyek
5

PROYEK
Suatu proyek adalah suatu usaha temporer yang menyertakan suatu urutan aktivitas yang menyertakan suatu urutan aktivitas yang dihubungkan dengan sumber daya, yang dirancanguntuk mencapai suatu hasil yang unik dan spesifikuntuk mencapai suatu hasil yang unik dan spesifikdan yang beroperasi di dalam waktu, biaya danbatasan mutu dan sering digunakan untukmemperkenalkan perubahan.
6

CHARACTERISTIC OF A PROJECT
A unique, one-time operational activity or effortRequires the completion of a large number of interrelated activitiesEstablished to achieve specific objectiveResources such as time and/or money are Resources, such as time and/or money, are limitedT i ll h it g t t tTypically has its own management structureNeed leadership
7

APA PROYEK MANAJEMEN?
Aplikasi dari suatu koleksi teknik dan perkakasuntuk mengarahkan penggunaan sumber daya
b b d k h h d iyang berbeda ke arah pemenuhan dari suatuyang unik, kompleks, waktu, biaya dan batasanmutu.Perang dunia II, manakala otoritas militer menggunakan teknik operasional research
t k k j l h k i untuk merencanakan jumlah maksimum penggunaan sumber daya.Salah satu teknik ini adalah penggunaanSalah satu teknik ini adalah penggunaanjaringan untuk menghadirkan suatu sistem dariaktivitas terkait
8
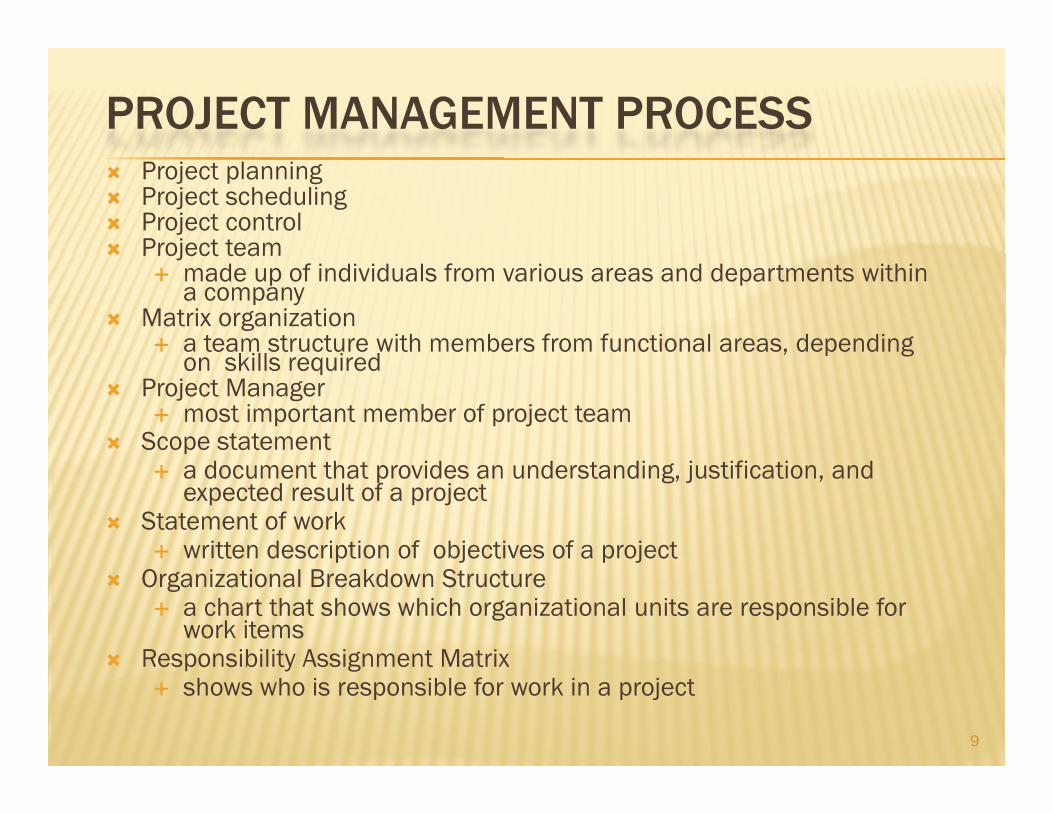
PROJECT MANAGEMENT PROCESSProject planningProject scheduling Project controlProject teamProject team
made up of individuals from various areas and departments within a company
Matrix organizationa team structure with members from functional areas, depending
kill i dp g
on skills requiredProject Manager
most important member of project teamScope statement
a document that provides an understanding, justification, and expected result of a project
Statement of workwritten description of objectives of a projectp j p j
Organizational Breakdown Structurea chart that shows which organizational units are responsible for work items
Responsibility Assignment MatrixResponsibility Assignment Matrixshows who is responsible for work in a project
9

Work Breakdown Structure for Computer Order Processing System Project
Work Breakdown Structure for Computer Order Processing System ProjectProcessing System ProjectProcessing System Project
10

PROJECT PLANNING
Resource Availability and/or LimitsDue date late penalties early completion Due date, late penalties, early completion incentivesBudgetBudget
Activity InformationId if ll i d i i iIdentify all required activitiesEstimate the resources required (time) to
l t h ti itcomplete each activityImmediate predecessor(s) to each activity needed to create interrelationshipsneeded to create interrelationships
11

PROJECT SCHEDULING AND CONTROL TECHNIQUES
Gantt Chart
Critical Path Method (CPM)Critical Path Method (CPM)
Program Evaluation and Review Technique (PERT)
12

Gantt Chart
Graph or bar chart with a bar for each project activity that shows passage of time
Provides visual display of project scheduleProvides visual display of project schedule
13

NETWORKNETWORK
Untuk perencanaan.pHubungan antara komponen dalam network danelemen dalam masalah riil
-Penerapan model network:Masalah transportasiMasalah prosesingP d d li kPerencanaan dan pengendalian proyekpenugasan
14

Masalah Transportasi:Masalah Transportasi:
PABRIK
A A AA1 A2 A3= suplly
TEMPAT PEMASARAN B3B2B1
= demand
15

BIAYA TRANSPORTASI DAN DISTRIBUSI BARANG
Tempatpemasaran
pabrik1 2 3 ……. M
Jumlahpersediaan
1C
11X
11
C12
X12
C13
X13
…….C
1MX
1M
S1
2C
21X
21
C22
X22
C23
X23
…….C
2MX
2M
S2
::3
::
::
::
…….::
::
NC
N1X
N1
CN2
XN2
CN3
XN3
…….C
NMX
NM
SN
Jumlah D
16
Jumlahpermintaan
D1
D2
D3
…….D
M ΣDJ≤ Σ S
J

Formulasi model transportasi
321idiDXSk
XC :Min
m
n
1 iij
m
1 jij
≤∑
∑∑= = XC :Min
n
1 iij
m
1 jij∑∑
= =
n ..., 3 2, 1, j dimana S X
m...,32,1,idimana D X Sk.
j
m
ij
i1 j
ij
=≥
=≤
∑
∑=
n321jdimanaSX
m ..., 3 2, 1, i dimana D X Sk.
m
i
m
1 jij ==
∑
∑=
jdan i dimana 0 X ij
1 j
≥=
jdan i dimana 0 X
n...,32,1,jdimana SX
ij
j1 j
ij
≥
==∑=
17

Masalah TranshipmentMasalah Transhipment
Untuk menentukan jumlah dan lokasi titik angkutanj gserta berguna untuk menentukan jumlah dan lokasititik angkutan secara optimal dengan meminimalkanbiaya angkutan antar lokasi.
18

+ 1 truk
3
C23 C34
C36
6421 7
+ 8 truk
C12
0 truk 3 truk 4 truk
C24
C
C46 C67
5
+ 8 truk 0 truk - 3 truk - 4 truk
C25
C54
C56
0 truk
19

LokasiRute Pengiriman Kapasi
tasBarangX12 X23 X24 X25 X34 X36 X54 X56 X63 X67
1 +1 0 0 0 0 0 0 0 0 0 +8
2 -1 +1 +1 +1 0 0 0 0 0 0 0
3 0 -1 0 0 +1 +1 0 0 -1 0 +1
4 0 0 -1 0 -1 0 -1 0 0 0 -2
5 0 0 0 -1 0 0 +1 +1 0 0 0
6 0 0 0 0 0 -1 0-1
+1 +1 -3
7 0 0 0 0 0 0 0 0 0 1 4
20
7 0 0 0 0 0 0 0 0 0 -1 -4

Fungsi Linear Programing
8 X : XCXCXCXCXCXCXCXCXCXC :Min
12
6767565654544646363634342525242423231212
=+++++++++
sk
0XXX2- X-XX-X-
1 XX X- 0- XXXX-
54463424
363423
25242312
++=+=++=+++
jdanisemuauntuk0X4 X - 3- XX-X-X- 0 XXX-
67
67564636
565425
≥−=
=+=++
jdan i semuauntuk 0 Xij ≥
21

HISTORY OF CPM/PERT
Critical Path Method (CPM)E I Du Pont de Nemours & Co. (1957) for construction of new h i l l d i h dchemical plant and maintenance shut-down
Deterministic task timesActivity on node network constructionActivity-on-node network constructionRepetitive nature of jobs
Project Evaluation and Review Technique (PERT)Project Evaluation and Review Technique (PERT)U S Navy (1958) for the POLARIS missile programMultiple task time estimates (probabilistic nature)p (p )Activity-on-arrow network constructionNon-repetitive jobs (R & D work)
22

TEKNIK CPMTEKNIK CPM
Pekerjaan-pekerjaan dalam proyek harus menandaij p j p ysaat berakhirnya proyek.Pekerjaan-pekerjaan dapat dimulai, diakhiri danj p j pdilaksanakan secara terpisah dalam suatu rangkaiantertentu.Pekerjaan-pekerjaan dapat diatur menurut suaturangkaian tertentu.
23

ATURAN
Setiap aktivitas ditujukan dengan suatu cabang tertentu, cabang inimenunjukkan saat dimulainya dan diakhirinya suatu kejadian.Antara suatu cabang dengan cabang lainnya hanya menunjukkanhubungan antar aktivitas atau pekerjaan yang berbeda.Bila sejumlah aktivitas berakhir pada suatu kejadian, maka inia seju a a t tas be a pada suatu ejad a , a aberarti bahwa kejadian ini tidak dapat dimulai sebelum aktivitasyang berakhir pada kejadian ini selesai.Aktivitas dummy digunakan untuk menggabungkan dua buahAktivitas dummy digunakan untuk menggabungkan dua buahkejadian, bila antara suatu kejadian dan kejadian yang mendahuluinya tidak dihubungkan dengan suatu aktivitas tertentu. Aktivitas dummy ini tidak mempunyai biaya dan waktuAktivitas dummy ini tidak mempunyai biaya dan waktu.Setiap kejadian diberikan tanda angka, sedang setiap aktivitasdiberikan tanda angka menurut kejadian awal dan kejadian yang mengakhiri.
24

PROJECT NETWORK
• Network analysis is the general name given to certain specific techniques which can be used for the planning, management and control of projects
Use of nodes and arrowsArrows An arrow leads from tail to head directionally
Indicate ACTIVITY, a time consuming effort that is required to perform a part of the workpart of the work.
Nodes n A node is represented by a circle- Indicate EVENT, a point in time where one or more activities start and/or
finish.
• Activity– A task or a certain amount of work required in the project– Requires time to complete– Represented by an arrow
• Dummy Activity
25
y y– Indicates only precedence relationships– Does not require any time of effort

EventProject Network
EventSignals the beginning or ending of an activityDesignates a point in timeR t d b i l ( d )Represented by a circle (node)
NetworkShows the sequential relationships among activities using nodes and arrows
A i i d (AON)Activity-on-node (AON)
nodes represent activities, and arrows show precedence relationshipsrelationships
Activity-on-arrow (AOA)
arrows represent activities and nodes are events for points
26
arrows represent activities and nodes are events for points in time

AOA PROJECT NETWORK FOR HOUSE
3
32 0
11 2 4 6 7
3Lay foundation Dummy
Finish work
Build house
31 1
11 2 4 6 7
5
Design house and obtain financing
Order and receive materials
Select carpet
Select paint
AON Project Network for House
22
43
7
Lay foundations Build house
Finish work
13
3 6
71Start
Design house and
27
31 5
11obtain financing
Order and receive materials
Select paintSelect carpet

SITUATIONS IN NETWORK DIAGRAM
AB
A
C
A must finish before either B or C can start
AA
B
C both A and B must finish before C can start
CA
both A and C must finish before either of B or D can start
DB
start
AAB
Dummy
A must finish before B can start
both A and C must finish before D can start
28
CD

CONCURRENT ACTIVITIES
ff 3
2 3
Lay foundationLay foundation 3DummyDummyLay Lay
foundationfoundation22 00
Order materialOrder material 42Order materialOrder material
11
(a)(a) Incorrect precedence Incorrect precedence relationshiprelationship
(b)(b) Correct precedence Correct precedence relationshiprelationship
29

NETWORK EXAMPLEIll t ti f t k l i f i d ig f d t d it i t d Illustration of network analysis of a minor redesign of a product and its associated packaging.
The key question is: How long will it take to complete this project ?The key question is: How long will it take to complete this project ?
30

For clarity, this list is kept to a minimum by specifying only immediate relationships, that is relationships involving activities that "occur near to each other in time".
31

QUESTIONS TO PREPARE ACTIVITY NETWORKIs this a Start Activity? I thi Fi i h A ti it ? Is this a Finish Activity? What Activity Precedes this? What Activity Follows this? What Activity Follows this? What Activity is Concurrent with this?
32

CPM CALCULATION
PathA connected sequence of activities leading from q gthe starting event to the ending event
Critical PathCritical PathThe longest path (time); determines the project duration
Critical ActivitiesAll of the activities that make up the critical pathAll of the activities that make up the critical path
33

FORWARD PASSEarliest Start Time (ES)Earliest Start Time (ES)
earliest time an activity can start ES = maximum EF of immediate predecessors
Earliest finish time (EF)Earliest finish time (EF)earliest time an activity can finishearliest start time plus activity time
EF= ES + tEF= ES + t
Latest Start Time (LS)Backward Pass
Latest time an activity can start without delaying critical path time
LS= LF - tLatest finish time (LF)Latest finish time (LF)
latest time an activity can be completed without delaying critical path time
LS = minimum LS of immediate predecessors
34

CPM ANALYSIS
Draw the CPM networkAnalyze the paths through the networkDetermine the float for each activityDetermine the float for each activity
Compute the activity’s floatfloat = LS - ES = LF - EFfloat LS ES LF EF
Float is the maximum amount of time that this activity can be delay in its completion before it becomes a critical activity, i.e., delays completion of the project
Find the critical path is that the sequence of activities and events where there is no “slack” i e Zero slackevents where there is no slack i.e.. Zero slack
Longest path through a networkFind the project duration is minimum project completion timep j p j p
35

CPM EXAMPLE: CPM Network
f, 15f, 15f, 15f, 15
a, 6a, 6a, 6a, 6g, 17g, 17g, 17g, 17 h, 9h, 9h, 9h, 9
ii 66ii 66
b, 8b, 8b, 8b, 8
ii, 6, 6ii, 6, 6
d, 13d, 13d, 13d, 13 j, 12j, 12j, 12j, 12
c, 5c, 5c, 5c, 5e, 9e, 9e, 9e, 9
36

CPM EXAMPLEES and EF Times f, 15f, 15f, 15f, 15
a, 6a, 6a, 6a, 6 g, 17g, 17g, 17g, 17 h, 9h, 9h, 9h, 9
ii 66ii 660 6
b, 8b, 8b, 8b, 8
ii, 6, 6ii, 6, 60 6
d, 13d, 13d, 13d, 13 jj, 12, 12jj, 12, 120 8
c, 5c, 5c, 5c, 5
e, 9e, 9e, 9e, 90 5
37

CPM EXAMPLE
ES and EF Times f, 15f, 15f, 15f, 15
6 21
a, 6a, 6a, 6a, 6 g, 17g, 17g, 17g, 17 h, 9h, 9h, 9h, 9
ii 66ii 660 6 6 23
6 21
b, 8b, 8b, 8b, 8
ii, 6, 6ii, 6, 60 6 6 23
d, 13d, 13d, 13d, 13 j, 12j, 12j, 12j, 120 8
8 21c, 5c, 5c, 5c, 5
e, 9e, 9e, 9e, 90 5
8 21
38
5 14

CPM EXAMPLE
ES and EF Times ff, 15, 15ff, 15, 15
6 21
a, 6a, 6a, 6a, 6 g, 17g, 17g, 17g, 17 h, 9h, 9h, 9h, 9
ii 66ii 660 6 6 2321 30
6 21
b, 8b, 8b, 8b, 8
ii, 6, 6ii, 6, 60 6 6 23
23 29
d, 13d, 13d, 13d, 13 j, 12j, 12j, 12j, 120 8
8 21 21 33c, 5c, 5c, 5c, 5
e, 9e, 9e, 9e, 90 5
8 21
Project’s EF = 33Project’s EF = 33
39
5 14

CPM EXAMPLE
LS and LF Times f, 15f, 15f, 15f, 15
h 9h 9h 9h 96 21
a, 6a, 6a, 6a, 6 g, 17g, 17g, 17g, 17
h, 9h, 9h, 9h, 9
ii 66ii 660 6 6 23
21 30
24 33
b, 8b, 8b, 8b, 8
ii, 6, 6ii, 6, 60 6 6 23
23 29
27 33d, 13d, 13d, 13d, 13 jj, 12, 12jj, 12, 120 8
8 21 21 33
c, 5c, 5c, 5c, 5
e, 9e, 9e, 9e, 90 5
21 33
40
5 14

CPM EXAMPLECPM EXAMPLE
LS and LF Times f, 15f, 15f, 15f, 15
h 9h 9h 9h 96 21
a, 6a, 6a, 6a, 6 g, 17g, 17g, 17g, 17
h, 9h, 9h, 9h, 9
ii 66ii 660 6 6 23
21 30
24 33
18 24
b, 8b, 8b, 8b, 8
ii, 6, 6ii, 6, 60 6 6 23
23 294 10
27 33
10 27
d, 13d, 13d, 13d, 13 j, 12j, 12j, 12j, 120 8
8 21 21 33
0 8
c, 5c, 5c, 5c, 5
e, 9e, 9e, 9e, 90 5
7 12
21 338 21
41
5 14 7 12
12 21
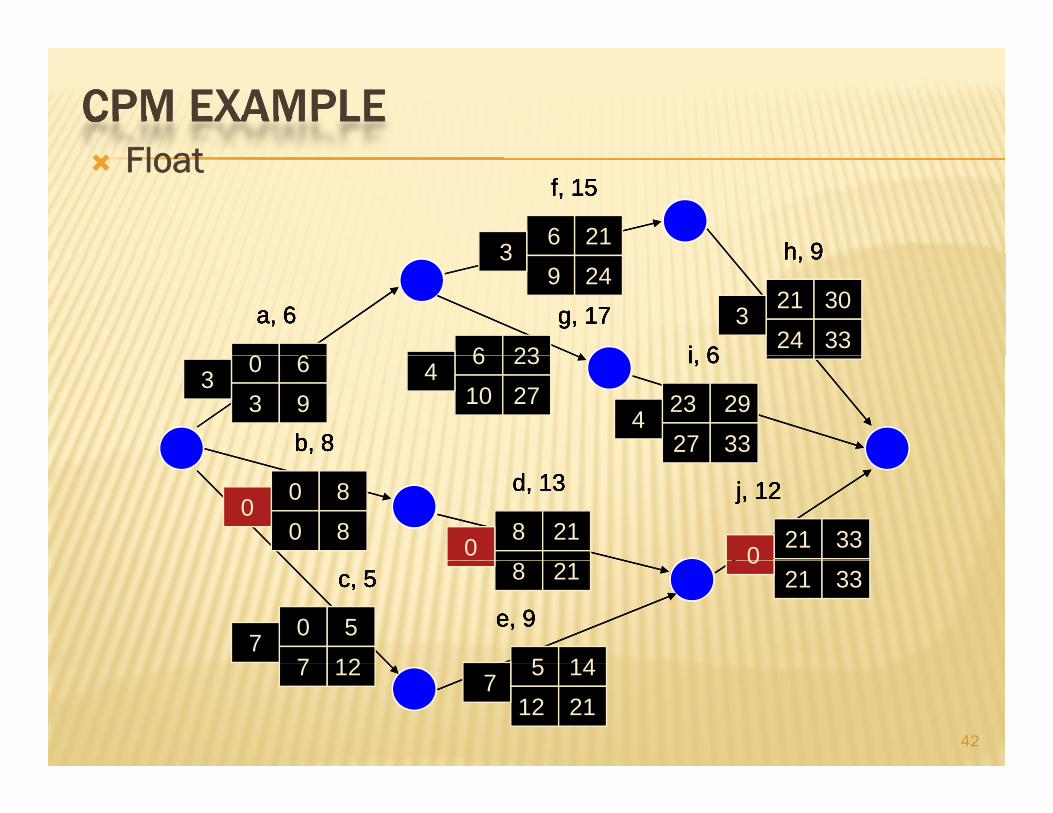
CPM EXAMPLECPM EXAMPLEFl tFloat
f, 15f, 15f, 15f, 15
h 9h 9h 9h 96 21 3
a, 6a, 6a, 6a, 6 g, 17g, 17g, 17g, 17
h, 9h, 9h, 9h, 9
ii 66ii 660 6 6 23
21 30
24 33
9 24 3
3
b, 8b, 8b, 8b, 8
ii, 6, 6ii, 6, 60 6 6 23
23 293 9
27 33
10 27 3 4
4
d, 13d, 13d, 13d, 13 j, 12j, 12j, 12j, 120 8
8 21 21 330 80
0
0 c, 5c, 5c, 5c, 5
e, 9e, 9e, 9e, 90 5
5 147 12
21 338 21 0
7
42
5 14 7 12
12 21 7

CPM EXAMPLE
Critical Path f, 15f, 15f, 15f, 15
a, 6a, 6a, 6a, 6 g, 17g, 17g, 17g, 17 h, 9h, 9h, 9h, 9
ii 66ii 66
b, 8b, 8b, 8b, 8
ii, 6, 6ii, 6, 6
d, 13d, 13d, 13d, 13j, 12j, 12j, 12j, 12
c, 5c, 5c, 5c, 5
e, 9e, 9e, 9e, 9
43

EXAMPLE
Illustration of network analysis of a minor redesign of a product and its associated packaging.
The key question is: How long will it take to complete this project ?
44

For clarity, this list is kept to a minimum by specifying only immediate relationships, that is relationships involving activities that "occur near to each other in time".
45

Before starting any of the above activity, the questions asked would be
•"What activities must be finished before this activity can start"
as ed would be
•could we complete this project in 30 weeks?
could we complete this project in 2 weeks?•could we complete this project in 2 weeks?
One answer could be, if we first do activity 1, then activity 2, then activity 3, ...., then activity 10, then activity 11 and the project would then take the sum of the activity completion times, 30 weeks.
“What is the minimum possible time in which we can complete this project ? “
46

We shall see below how the network analysis diagram/picture we construct helps us to answer this question.
47

CRITICAL PATH TAKES 24 WEEKS FOR THE COMPLETION OF THE PROJECT
48

Packages are available to determine the shortest path and other relevant information.
49

Data entry window
50

Output of the package
51

PERT PERT is based on the assumption that an activity’s duration PERT is based on the assumption that an activity s duration follows a probability distribution instead of being a single valueThree time estimates are required to compute the q pparameters of an activity’s duration distribution:
pessimistic time (tp ) - the time the activity would take if things did not go wellg gmost likely time (tm ) - the consensus best estimate of the activity’s durationoptimistic time (to ) - the time the activity would take if optimistic time (to ) the time the activity would take if things did go well
M ( t d ti ) t tp + 4 tm + toMean (expected time): te = tp 4 tm to6
t t2
52
Variance: Vt =σ 2 = tp - to6

PERT ANALYSISDraw the network.Analyze the paths through the network and find the critical path.The length of the critical path is the mean of the project duration probability distribution which is assumed to be normalduration probability distribution which is assumed to be normalThe standard deviation of the project duration probability distribution is computed by adding the variances of the critical activities (all of the activities that make up the critical path) and taking the square root of that sumProbability computations can now be made using the normal Probability computations can now be made using the normal distribution table.
53

PROBABILITY COMPUTATION
Determine probability that project is completed within specified time
Z = x - µ
σ
where µ = tp = project mean time
σ = project standard mean time
x = (proposed ) specified time
54

NORMAL DISTRIBUTION OF PROJECT TIMENORMAL DISTRIBUTION OF PROJECT TIME
Probability
Zσ
µ = tp Timex
55

PERT EXAMPLE
Immed. Optimistic Most Likely PessimisticActivity Predec. Time (Hr.) Time (Hr.) Time (Hr.)Activity Predec. Time (Hr.) Time (Hr.) Time (Hr.)
A -- 4 6 8B -- 1 4.5 5C A 3 3 3D A 4 5 6 E A 0 5 1 1 5E A 0.5 1 1.5F B,C 3 4 5G B,C 1 1.5 5H E F 5 6 7H E,F 5 6 7I E,F 2 5 8J D,H 2.5 2.75 4.5J D,H 2.5 2.75 4.5K G,I 3 5 7
56

PERT EXAMPLE
PERT Network
DD
AA EE HH JJ
CC
BB II KKFF
GG
KK
57

PERT EXAMPLE
Activity Expected Time VarianceA 6 4/9A 6 4/9B 4 4/9C 3 0C 3 0D 5 1/9E 1 1/36F 4 1/9G 2 4/9H 6 1/9H 6 1/9I 5 1J 3 1/9J 3 1/9K 5 4/9
58

PERT EXAMPLE
Activity ES EF LS LF SlackA 0 6 0 6 0 *criticalA 0 6 0 6 0 *criticalB 0 4 5 9 5C 6 9 6 9 0 *D 6 11 15 20 9E 6 7 12 13 6F 9 13 9 13 0 *F 9 13 9 13 0 G 9 11 16 18 7H 13 19 14 20 1I 13 18 13 18 0 *I 13 18 13 18 0 *J 19 22 20 23 1K 18 23 18 23 0 *
59

PERT EXAMPLE
Vpath = VA + VC + VF + VI + VK
= 4/9 + 0 + 1/9 + 1 + 4/9 = 2
σpath = 1.414z = (24 23)/σ (24 23)/1 414 = 71z = (24 - 23)/σ = (24-23)/1.414 = .71
From the Standard Normal Distribution table: P(z < .71) = .5 + .2612 = .7612
60

PROJECT COST
61

COST CONSIDERATION IN PROJECT
Project managers may have the option or requirement to crash the project, or accelerate the completion of the project.This is accomplished by reducing the length of the critical path(s).The length of the critical path is reduced by reducing the duration of the activities on the critical path.If each activity requires the expenditure of an amount of money to y q p yreduce its duration by one unit of time, then the project manager selects the least cost critical activity, reduces it by one time unit, and traces that change through the remainder of the network.As a result of a reduction in an activity’s time, a new critical path may be created.When there is more than one critical path, each of the critical paths p pmust be reduced.If the length of the project needs to be reduced further, the process is repeated.
62

PROJECT CRASHINGCrashing
reducing project time by expending additional resourcesresources
Crash timean amount of time an activity is reducedy
Crash costcost of reducing activity time
G lGoalreduce project duration at minimum cost
63

ACTIVITY CRASHING
Crashing activityCrash cost
Slope = crash cost per unit time
Normal ActivityNormal cost
Normal time
64
Activity timeCrash time

TIME-COST RELATIONSHIP
Crashing costs increase as project duration decreasesIndirect costs increase as project duration increasesReduce project length as long as crashing costs are less than indirect costsReduce project length as long as crashing costs are less than indirect costs
Time-Cost Tradeoff Total project costMin total cost =
Indirect cost
Total project costoptimal project time
Direct cost
65
time

PROJECT CRASHING EXAMPLE
44
11
2288
441212
774411
1212
33 66
44
44 5544
44
66

TIME COST DATA
Activity Normal ti
Normal t R
Crash ti
Crash t R
Allowable h ti
slopetime cost Rs time cost Rs crash time
12
128
30002000
75
50003500
53
4005002
34
8412
2000400050000
539
3500700071000
313
50030007000
56
44
500500
11
11001100
33
200200
7 4 1500 3 22000 1 700075000 110700
67

28
R500 R7000
R70012
4Project duration = 36
112
874
R70012
From…..
34 5
4
64
R400
R3000 R200R3000 R200
2R500 R7000
4
To…..17
28
74
R70012
7
34 5
4
64
R400
R200
Project
duration = 314
R3000 R200R200Additional cost =
R2000
68

BENEFITS OF CPM/PERT
Useful at many stages of project managementMathematically simpleGive critical path and slack timeGive critical path and slack timeProvide project documentationUseful in monitoring costs
CPM/PERT can answer the following important questions:
•How long will the entire project take to be completed? What are the risks involved? •Which are the critical activities or tasks in the project which could delay the entire
questions:
Which are the critical activities or tasks in the project which could delay the entire project if they were not completed on time?
•Is the project on schedule, behind schedule or ahead of schedule? •If the project has to be finished earlier than planned, what is the best way to do this at
?
69
the least cost?

LIMITATIONS TO CPM/PERTClearly defined, independent and stable activitiesSpecified precedence relationshipsOver emphasis on critical pathsDeterministic CPM modelDeterministic CPM modelActivity time estimates are subjective and depend on judgmentPERT assumes a beta distribution for these time estimates, but the actual distribution may be differentPERT consistently underestimates the expected project y p p jcompletion time due to alternate paths becoming critical
To overcome the limitation, Monte Carlo simulations can be performed on the network to eliminate the optimistic bias
70

COMPUTER SOFTWARE FOR PROJECT MANAGEMENTFOR PROJECT MANAGEMENT
Microsoft Project (Microsoft Corp.)MacProject (Claris Corp.)PowerProject (ASTA Development Inc.)j ( p )Primavera Project Planner (Primavera)Project Scheduler (Scitor Corp.)Project Scheduler (Scitor Corp.)Project Workbench (ABT Corp.)
71

PRACTICE EXAMPLE
A social project manager is faced with a project with the following activities:
A ti it D i ti D tiActivity Description Duration
Social work team to live in village 5w
Social research team to do survey 12w
Analyse results of survey 5w
Establish mother & child health program 14w
Establish rural credit programme 15w
Carry out immunization of under fives 4w
Draw network diagram and show the critical path Calculate project
72
Draw network diagram and show the critical path. Calculate project duration.

PRACTICE PROBLEMActivity Description Durationy p1-2 Social work team to live in village 5w1-3 Social research team to do survey 12w3-4 Analyse results of survey 5w2-4 Establish mother & child health program 14w3-5 Establish rural credit programme 15w4-5 Carry out immunization of under fives 4w
24
1 5
73
3

CONTOH 1:CONTOH 1:
2
B
60 KM
4
2
F
D
100 KM
60 KM
40 KM 50 KM
1 6
F
A 55 KM 25 KM5
3 E
A75 KM
55 KM 25 KM
3 E
C
74

CONTOH 2
AKTIVITAS URAIAN AKTIVITAS PENDAHULUAN
WAKTU PENYELESAIAN
(HARI(HARI
A Desain daftar pertanyaan - 4
B Desain sampling - 5
C Testing daftar pertanyaan danperbaikan
A 4
D Memilih calon intervierwer B 1
E Melatih interviewer D, A 2
F Membagi wilayah kepadainterviewer
B 4interviewer
G Pelaksanaan interview C, E, F 10
H Evaluasi hasil riset G 15
75
H Evaluasi hasil riset G 15


![MANAJER STRATEGIK [Autosaved] - Gunadarma Universitymukhyi.staff.gunadarma.ac.id/Downloads/files/19214/MANAJER... · Strategi Keunggulan Biaya. ... bisnis sebainya didasarkan atas](https://img.dokumen.tips/doc/110x75/5a7ff3907f8b9a24668bc577/manajer-strategik-autosaved-gunadarma-keunggulan-biaya-bisnis-sebainya.jpg)