Embed Size (px)
Citation preview

© Copyright 2012-2018 NetFlow Logic Corporation. All rights reserved. Patents both issued and pending.
NetFlow Analytics for Splunk
User Manual
Version 3.8.x
May 2018

NetFlow Analytics for Splunk App User Manual 1
Table of Contents Introduction .......................................................................................................................... 3
Overview ........................................................................................................................................3
Installation ............................................................................................................................ 4 Upgrading from prior version to 3.7 and above ................................................................................4
Upgrading Technology Add-on for NetFlow (TA-netflow) ..................................................................... 4 Upgrading Netflow Analytics for Splunk App (netflow) ......................................................................... 4
Pre-installation Steps ......................................................................................................................6 Installing into a Single Splunk Server ...............................................................................................6
Technology Add-on for NetFlow Installation ......................................................................................... 6 NetFlow Analytics for Splunk App Installation ....................................................................................... 6
Installing into a Distributed Splunk Environment .............................................................................8 Configure Universal Forwarder Input ..................................................................................................... 8
Administration .................................................................................................................... 10 Settings > Configuration ................................................................................................................ 10 Settings > NFO Index Usage ........................................................................................................... 11 Settings > Update Device Dropdown .............................................................................................. 11
Dashboards ......................................................................................................................... 12
App Navigation Overview .............................................................................................................. 12 Dashboard overview ..................................................................................................................... 12 Overview > Traffic Overview dashboard ........................................................................................ 13 Bandwidth by Hosts ...................................................................................................................... 14
Traffic by Source IP dashboard ............................................................................................................. 14 Traffic by Destination IP dashboard ..................................................................................................... 15 Traffic by Protocol and Port ................................................................................................................. 15 Traffic by Host Pairs dashboard ............................................................................................................ 16 Reports ................................................................................................................................................. 16 Traffic by Subnets dashboard ............................................................................................................... 17 Traffic by Protocol dashboard .............................................................................................................. 17 Connections dashboards ...................................................................................................................... 18
Bandwidth by Network Devices ..................................................................................................... 18 Top Devices by Traffic dashboard ........................................................................................................ 18 Top Devices by Packet Rate dashboard ................................................................................................ 19 Interfaces Utilization dashboard .......................................................................................................... 19 Watched Interfaces Utilization dashboard ........................................................................................... 20 Interface Groups dashboard................................................................................................................. 20
Services ........................................................................................................................................ 20 Service Response Time dashboard ....................................................................................................... 20 Asset Access Monitor ........................................................................................................................... 21
Security Events ............................................................................................................................. 21 Cyber Thread Statistics dashboard ....................................................................................................... 21

NetFlow Analytics for Splunk App User Manual 2
DNS Security dashboard ....................................................................................................................... 22 More Traffic Statistics ................................................................................................................... 22
TCP Health ............................................................................................................................................ 22 GEO IP Monitor dashboard .................................................................................................................. 23 Traffic by Autonomous Systems dashboard ......................................................................................... 23 Traffic by CBQoS dashboard ................................................................................................................. 24 Traffic Analyzer and Planning (based on my-subnets.csv lookup) ....................................................... 24 Microsegmentation Analyzer and Planning ......................................................................................... 25
SNMP ........................................................................................................................................... 26 SNMP interface errors and discards ..................................................................................................... 26 SNMP CISCO - latest memory/cpu values ............................................................................................ 26
Cisco ASA Monitor ........................................................................................................................ 27 Cisco Overview ..................................................................................................................................... 27 Cisco Top Bandwidth Consumers ......................................................................................................... 27 Cisco Top Destinations ......................................................................................................................... 27 Cisco Top Violators ............................................................................................................................... 27 Cisco Top Connectors ........................................................................................................................... 27
Palo Alto Networks ....................................................................................................................... 28 Palo Alto Networks Overview ............................................................................................................... 28 Palo Alto Networks Top Bandwidth Consumers .................................................................................. 28 Palo Alto Networks Top Destinations ................................................................................................... 28 Palo Alto Networks Top Violators ........................................................................................................ 28 Palo Alto Networks Top Connectors .................................................................................................... 28 Top Applications ................................................................................................................................... 29 Top Applications and Users .................................................................................................................. 29 Search Dashboards ............................................................................................................................... 29
Configuring Splunk Analytics for Hadoop (Hunk) .................................................................. 30
How to generate sample events for testing purposes ........................................................... 30

NetFlow Analytics for Splunk App User Manual 3
Introduction
Overview
NetFlow Analytics for Splunk App is designed to deliver next generation, real-time, network resource management
power to network and security analysts. NetFlow Optimizer™ (“NFO”) is a middleware that processes massive
amount of flows to stream summarized and meaningful CIM (“Common Information Model”) compliant syslog events
into Splunk Enterprise, and, optionally, all original flow records to inexpensive storage like Hadoop. The events are
available for alerting and correlation with other machine data. NetFlow Analytics for Splunk App (“App”) provides
visualization and reporting capabilities. The operators benefit from detailed visibility to their entire network and being
able to address many IT use cases including bandwidth monitoring, capacity planning, congestion troubleshooting,
and cyber security using threat intelligence lists.
The App also includes Cisco ASA and Palo Alto Network firewall flow data dashboards which present bandwidth
usage, users, applications, and violators etc, enabling the continual reinforcement of firewall policies.
This guide is intended for network and security analysts who use the App to monitor and investigate problems. For
additional NFO information please visit www.netflowlogic.com.

NetFlow Analytics for Splunk App User Manual 4
Installation
Upgrading from prior version to 3.7 and above
If you are not upgrading from previous versions of NetFlow Analytics for Splunk App and Technology Add-On for
Netflow, skip this section and go to Pre-installation Steps section on page 6.
In the NetFlow Analytics for Splunk App starting from version 3.7 and above, to comply with Splunk guidelines, by
default the events are inserted into the default index (index=main). Summary data is stored by default in summary
index (index=summary).
In the previous versions (3.6 or older) the following indexes were created during the installation and operation:
1. flowintegrator – the main index for syslogs sent by NetFlow Optimizer
2. flowintegrator_exp_ips - a summary index which contains exporter IPs for populating Device drop-down
3. flowintegrator_pct_of_total - a summary index filled with data to speed up calculations of "% of Total" fields on
the dashboards
Upgrading Technology Add-on for NetFlow (TA-netflow)
Starting from release 3.7 default index is index=main. When you upgrade to version 3.7, if you want to
continue using the old index, please create $SPLUNK_ROOT/etc/apps/TA-netflow/local/indexes.conf file if it does
not already exist, and add the following lines to it:
[flowintegrator]
homePath = $SPLUNK_DB/flowintegrator/nfi_traffic/db
coldPath = $SPLUNK_DB/flowintegrator/nfi_traffic/colddb
thawedPath = $SPLUNK_DB/flowintegrator/thaweddb
Another change in this version is that the UDP 10514 input is no longer configured by default, so it should be added
manually, as Netflow Optimizer is sending events by default to UDP 10514.
The TA-netflow is expecting that the sourcetype of events sent from Netflow Optimizer would be set to
"flowintegrator", so please add the following lines to $SPLUNK_ROOT/etc/apps/TA-netflow/local/indexes.conf file:
[udp://10514]
sourcetype = flowintegrator
index = flowintegrator
Restart Splunk for the changes in configuration to take effect.
Upgrading Netflow Analytics for Splunk App (netflow)
Starting from release 3.7 by default the summary indexes are saved to index=summary. To use the old data
from the old summary indexes in the transition period, first the old indexes must be reintroduced in the indexes.conf and the macro.conf needs to be amended in the $SPLUNK_ROOT/etc/apps/netflow/local.

NetFlow Analytics for Splunk App User Manual 5
Create this file if it does not already exist $SPLUNK_ROOT/etc/apps/netflow/local/indexes.conf and add the
following lines to it:
[flowintegrator_exp_ips]
homePath = $SPLUNK_DB/flowintegrator_exp_ips/db
coldPath = $SPLUNK_DB/flowintegrator_exp_ips/colddb
thawedPath = $SPLUNK_DB/flowintegrator_exp_ips/thaweddb
[flowintegrator_pct_of_total]
homePath = $SPLUNK_DB/flowintegrator_pct_of_total/nfi_traffic/db
coldPath = $SPLUNK_DB/flowintegrator_pct_of_total/nfi_traffic/colddb
thawedPath = $SPLUNK_DB/flowintegrator_pct_of_total/thaweddb
Create this file if it does not already exist $SPLUNK_ROOT/etc/apps/netflow/local/macros.conf and add the
following lines:
[netflow_index]
definition = (index=main OR index=flowintegrator) sourcetype=flowintegrator
[summary_index_exp_ips]
definition = (index=summary OR index=flowintegrator_exp_ips)
[summary_index_pct_of_total]
definition = (index=summary OR index=flowintegrator_pct_of_total)
Restart Splunk for the changes to take effect.

NetFlow Analytics for Splunk App User Manual 6
Pre-installation Steps
This App relies on NetFlow Optimizer software. To download a free trial of NetFlow Optimizer, please visit
https://www.netflowlogic.com/download/ and register to receive the FREE trial key. Please download NetFlow
Optimizer Installation and Administration Guide from https://www.netflowlogic.com/resources/documentation/ and
follow instructions for your platform.
NetFlow Analytics for Splunk and Add-on are designed to work together. The Add-on can be used with the App or
with Splunk Enterprise Security.
1. Download Technology Add-on for NetFlow from Splunkbase https://splunkbase.splunk.com/app/1838/
2. Download NetFlow Analytics for Splunk from Splunkbase https://apps.splunk.com/app/489/
Installing into a Single Splunk Server
Technology Add-on for NetFlow Installation
1. Install Technology Add-on for NetFlow.
2. Create the $SPLUNK_ROOT/etc/apps/TA-netflow/local/inputs.conf file, and add the following lines to it:
[udp://10514]
sourcetype = flowintegrator
3. By default NetFlow Optimizer events will be stored in main index. In case you want to use another index, for
example flowintegrator, please create the $SPLUNK_ROOT/etc/apps/TA-netflow/local/indexes.conf file,
and add the following lines to it:
[flowintegrator]
homePath = $SPLUNK_DB/flowintegrator/nfi_traffic/db
coldPath = $SPLUNK_DB/flowintegrator/nfi_traffic/colddb
thawedPath = $SPLUNK_DB/flowintegrator/thaweddb
In that case make sure your $SPLUNK_ROOT/etc/apps/TA-netflow/local/inputs.conf file contains the following:
[udp://10514]
sourcetype = flowintegrator
index = flowintegrator
4. Restart Splunk
NetFlow Analytics for Splunk App Installation
Starting from version 3.7, to comply with Splunk guidelines, by default the events are inserted into the default index (index=main) and the summary indexes are saved to index=summary. In previous versions NFO events were inserted into index [flowintegrator], and the following summary indexes were created and used: [flowintegrator_exp_ips] and [flowintegrator_pct_of_total]. To use or continue using custom indexes for your NetFlow events, please perform the following:
1. Install NetFlow Analytics for Splunk App.
2. Create the file if it does not already exist:

NetFlow Analytics for Splunk App User Manual 7
$SPLUNK_ROOT/etc/apps/netflow/local/indexes.conf
and add the following lines to it:
[flowintegrator_exp_ips]
homePath = $SPLUNK_DB/flowintegrator_exp_ips/db
coldPath = $SPLUNK_DB/flowintegrator_exp_ips/colddb
thawedPath = $SPLUNK_DB/flowintegrator_exp_ips/thaweddb
[flowintegrator_pct_of_total]
homePath = $SPLUNK_DB/flowintegrator_pct_of_total/nfi_traffic/db
coldPath = $SPLUNK_DB/flowintegrator_pct_of_total/nfi_traffic/colddb
thawedPath = $SPLUNK_DB/flowintegrator_pct_of_total/thaweddb
3. Create the file if it does not already exist:
$SPLUNK_ROOT/etc/apps/netflow/local/macros.conf
and add the following lines to it:
[netflow_index]
definition = index=flowintegrator sourcetype=flowintegrator
[summary_index_exp_ips]
definition = index=flowintegrator_exp_ips
[summary_index_pct_of_total]
definition = index=flowintegrator_pct_of_total
4. Create the file if it does not already exist:
$SPLUNK_ROOT/etc/apps/netflow/local/savedsearches.conf
and add the following lines to it:
[cache_total_traffic]
action.summary_index._name = flowintegrator_pct_of_total
[save_exporters]
action.summary_index._name = flowintegrator_exp_ips
5. Restart Splunk for the changes to take effect.

NetFlow Analytics for Splunk App User Manual 8
Installing into a Distributed Splunk Environment
If you have Splunk distributed environment (separate search heads / indexers /
forwarders), install NetFlow Analytics for Splunk App on search heads. Install
Add-on on search heads and indexers/heavy forwarders.
There are three ways to ingest NetFlow Optimizer events into Splunk:
1. NFO sends events directly to Splunk indexer
2. NFO sends events directly to Splunk Universal Forwarder (they could
be installed together or on separate machines)
3. NFO sends events to syslog-ng or rsyslog, and Splunk Universal
Forwarder sends them to Splunk indexers
Configure Universal Forwarder Input
Create or modify %SPLUNK_HOME%/etc/system/local/inputs.conf file as follows. In general there are two options,
either to listen directly for netflow events on a specific port or optionally to monitor files created by syslog-ng or
rsyslog.
Receiving Syslogs Directly from NFO (UDP port 10514)
Add the following lines to inputs.conf file and modify it for your netflow index, if necessary:
[udp://10514]
sourcetype = flowintegrator
index = flowintegrator
Configuring Universal Forwarder with syslog-ng or rsyslog
In this scenario syslog-ng or rsyslog are configured to listen to syslogs sent by NFO on a UDP port 10514. Syslog-ng
or rsyslog are usually writing the logs into configurable directories. In this example we assume that those are written
to /var/log/netflow.
Add the following lines to inputs.conf file and modify it for your netflow index, if necessary:
[monitor:///var/log/netflow]
sourcetype = flowintegrator
index = flowintegrator
It is very important to set sourcetype=flowintegrator and to point it to the index where Netflow Analytics for
Splunk App and Add-on are expecting it.
Configure Universal Forwarder Output (Target Indexers)
During the installation of the Universal Forwarders a Receiving Indexer can be configured, as it can be seen here:

NetFlow Analytics for Splunk App User Manual 9
It is an optional step during the installation. If it was not configured or if load balancing is required, additional
Receiving Indexers can be added later by adding to the %SPLUNK_HOME%/etc/system/local/outputs.conf file:
[tcpout]
defaultGroup = default-autolb-group
[tcpout:default-autolb-group]
server = 10.1.0.100:9997,10.1.0.101:9997
More info about load balancing:
http://docs.splunk.com/Documentation/Splunk/latest/Forwarding/Setuploadbalancingd#How_load_balancing_works

NetFlow Analytics for Splunk App User Manual 10
Administration
Settings > Configuration
Get more value out of NetFlow by enabling additional NetFlow Optimizer (NFO) Logic Modules. By default NetFlow
Optimizer is preconfigured with one Logic Module enabled – “10067: Top Traffic Monitor”. This Module fees data to
most bandwidth monitoring dashboards.
By enabling and configuring other NFO Modules, you activate additional NetFlow analytics to be sent to Splunk,
which are visualized in corresponding dashboards. You may enable / disable the entire Module Set or each Module,
as depicted below.
If you would like to organize your network devices in logical groups, please create exporters-devices.csv lookup file
as shown at the bottom of the Configuration page.
To learn more about NetFlow Optimizer Modules please review NetFlow Optimizer User Guide which could be
downloaded from https://www.netflowlogic.com/resources/documentation/.

NetFlow Analytics for Splunk App User Manual 11
Settings > NFO Index Usage
This dashboard enables you to analyze how Splunk index is used by various NFO Modules and network devices. You
can see which NFO Module is most chatty, and make configuration changes to assure you use your Splunk license
wisely.
Settings > Update Device Dropdown
Most dashboards have Device dropdown (your NetFlow/sFlow exporter IPs and their SNMP names). This dropdown
is populated automatically by "save_exporters" saved search which runs every 30 minutes. The SNMP related
dashboards are using the management IP addresses. To refresh Device dropdown values go to Settings > Update
Device Dropdown and press "Update Device lists" button.
Please visit the Documentation section of the NetFlow Logic website or simply contact us
at [email protected] should you have any questions.

NetFlow Analytics for Splunk App User Manual 12
Dashboards
App Navigation Overview
The App dashboards are organized into logical groups, and could be accessed from the top navigation bar and drop-
down menus.
Overview is the default dashboard showing high level traffic statistics, such as top talkers, top listeners, traffic by
protocol, traffic by protocol and destination ports, and top devices and interfaces by traffic volume.
Bandwidth by Hosts group has dashboards to view traffic statistics from communicating peers point of view. For
example, Traffic by Source IP dashboard shows top talkers, and the ability to drill down to communicating peers as
well as seeing network devices that reported these network conversations.
Bandwidth by Network Devices group has dashboards to view traffic statistics starting from network devices and
interfaces. These dashboards allow you to drill down and see network conversations traversing network devices and
interfaces.
Dashboard overview
Every dashboard has different filters at the top of the screen to enable further narrowing of the report. For example,
the Traffic by Protocol and Port dashboard can be filtered by the device group, device, source IP/mask, destination
IP/mask, protocol, source port, destination port, source DSCP, destination DSCP, input and output interfaces, and
time range.
Please note that source and destination IP/mask filters could be specified as subnets (IP/mask), as full IP addresses
(199.45.1.45), or as a partial IP address (199.45.1.*).
Starting with release 3.7.81 the timeline panel enables you to “pan and zoom” into specific time period. The selected
time interval is propagated into all drilldown panels as shown below.

NetFlow Analytics for Splunk App User Manual 13
Overview > Traffic Overview dashboard
The Overview dashboard is the top view, aimed to provide a summary on traffic over a time period. The views can be
filtered by the Device Group, Device and Time Range.
The panels show Top Traffic by Source IP, Top Traffic by Destination IP, Top Traffic by Protocol and Port, Top Traffic
by Protocol, Top Traffic by Protocol, Top Devices by Traffic, Top Interfaces by Traffic by Device.

NetFlow Analytics for Splunk App User Manual 14
Bandwidth by Hosts
This section covers the dashboards and reports for monitoring traffic to and from hosts in your network, such as top
talkers, top listeners, top host pairs, and many others.
Traffic by Source IP dashboard
The Traffic by Source IP dashboard (a.k.a. Top Talkers) monitors host which generate most traffic in your network. It
is useful for real time or historical network utilization and bandwidth monitoring. The dashboard shows maximum and
average traffic speed and volume, as well as packet rate and connections generated by each host.
Use the filtering options and time picker at the top of the dashboard to select the time interval and narrow down your
search results.

NetFlow Analytics for Splunk App User Manual 15
The Traffic by Source IP dashboard allows viewing talker traffic details – just click on the talker host IP or name, and
drill down panel opens below showing all traffic destinations, including ports, network device interfaces, and traffic
and packet rate details.
Traffic by Destination IP dashboard
The Traffic by Destination IP dashboard (a.k.a. Top Listeners) monitors host which receive most traffic in your
network. As Traffic by Source IP, it is useful for real time or historical network utilization and bandwidth monitoring.
The dashboard shows traffic maximum and average speed and volume, as well as packet rate and connections
received by each host.
Use the filtering options and time picker at the top of the dashboard to select the time interval and narrow down your
search results.
The Traffic by Destination IP dashboard allows viewing listener traffic details – just click on the listener host IP or
name, and drill down panel opens below showing all traffic sources, including ports, network device interfaces, and
traffic and packet rate details.
Traffic by Protocol and Port
The Traffic by Protocol and Port dashboard monitors traffic in your network by Service Name and Transport Protocol
Port Number (a.k.a Destination port). The App is packaged with services.csv lookup file, which is used to display the
service name and protocol, according to IANA: (http://www.iana.org/assignments/service-names-port-
numbers/service-names-port-numbers.xhtml).
NetFlow Analytics for Splunk App User Manual 16
Traffic by Host Pairs dashboard
The Traffic by Host Pairs dashboard shows consolidated bidirectional flows, sorted by traffic volume. You need to
enable Module 10064: Top Pairs Monitor in order to see data in this dashboard. The Traffic by Host Pairs dashboard
contains a timeline panel showing top 10 host pairs’ traffic by volume, and the table showing top 100 host pairs with
details, such as traffic volume and speed, packet rate, and connections count.
Reports
Reports section contains dashboards built to be printed or exported to PDF. The following reports are available today:
Top Talkers
Top Listeners
Top Host Pairs

NetFlow Analytics for Splunk App User Manual 17
Traffic by Subnets dashboard
The Traffic by Subnets dashboard monitors subnets specified in NFO Module 10011: Network Subnets Monitor
configuration. Please refer to NetFlow Optimizer User Guide for details. The Traffic by Subnets dashboard is useful
for real time and historical monitoring of bandwidth utilization in specified subnets.
The dashboard shows traffic In, Out, and in Both directions. Traffic for the top 10 by traffic volume monitored subnets
is shown in timeline panels. The table below shows for each subnet such details as Source IP, Traffic speed and
volume by direction, as well as packet rate information.
Traffic by Protocol dashboard
The Traffic by Protocol dashboard monitors traffic in your network by transport protocol, going through each of the
network devices. It is useful for real time or historical monitoring of you traffic composition. The App is packaged with
protocols.csv lookup file, which is used to display the protocol name and number, according to IANA:
(http://www.iana.org/assignments/protocol-numbers/protocol-numbers.xhtml).
Use the filtering options and time picker at the top of the dashboard to select the time interval and narrow down your
search results.

NetFlow Analytics for Splunk App User Manual 18
The Traffic by Protocol dashboard allows viewing traffic details for each protocol – just click on the protocol in the
table below the graph, and drill down panel opens below showing all traffic details for the selected protocol, including
source and destination hosts and port numbers, network device interfaces, and traffic speed and volume, packet rate,
and connections.
Connections dashboards
Traffic dashboards described in the previous sections are based on NFO Modules that consolidated flow data and
report top hosts by volume (Modules 10011, 10064, 10067 – default Module). Connections dashboards are based on
NFO Module 10063, which reports top hosts by the number of connections regardless of traffic volume. There four
dashboards to monitor host by connections.
Connections by Source IP
Connections by Destination IP
Connections by Protocol and Port
Connections by Protocol
These dashboards contain graphs and table with traffic details similar to corresponding Traffic dashboards.
Bandwidth by Network Devices
In comparison to Host dashboards, which are host centric, the Network devices dashboards are device (routers,
firewalls, VLAN’s) centric, tracking the ingress and egress traffic.
Top Devices by Traffic dashboard
The Top Devices by Traffic dashboard monitors network devices with most traffic in your network. It is useful for real
time or historical network utilization and bandwidth monitoring. The dashboard shows maximum and average traffic
speed as well as packet rate traversing each network device.
Use the filtering options and time picker at the top of the dashboard to select the time interval and narrow down your
search results.

NetFlow Analytics for Splunk App User Manual 19
The Top Devices by Traffic dashboard allows viewing network traffic details – just click on one of the devices, and
drill down panel opens below showing traffic composition by each interface. Further drilldown shows traffic speed
statistics (Min, Max, Average, Standard Deviation, 95th Percentile), and hosts communicating over the selected
interface.
Top Devices by Packet Rate dashboard
The Top Devices by Packet Rate dashboard is similar to Top Devices by Traffic dashboard, but the network devices
are sorted by packet rate rather than traffic volume.
You need to enable Module 10068: Top Packets Monitor in order to see data in this dashboard.
Interfaces Utilization dashboard
The Interfaces Utilization dashboard shows interfaces across your entire data center, with most loaded interfaces
first. As in Top Devices dashboards, Interfaces Utilization allows drill down to examine traffic details going over the
selected interface. Click on an interface, and panels below will show traffic speed statistics, and hosts communicating
over the selected interface.

NetFlow Analytics for Splunk App User Manual 20
Watched Interfaces Utilization dashboard
The Watched Interfaces Utilization dashboard is very similar to Interface Utilization, but shows only the interfaces
specified in watched-interfaces.csv lookup CSV file. Please see Watched Interfaces section at the bottom of App’s
Settings > Configuration page for more details.
Interface Groups dashboard
This dashboard shows consolidated information for Interface Groups. Interface Groups are defined in interface-
groups.csv lookup CSV file. Please see Interface Groups section at the bottom of App’s Settings > Configuration
page for more details.
Services
Services dashboards enable users to monitor performance and traffic statistics of selected services in your
datacenter. You need to enable corresponding NFO Modules in order to see data in these dashboards.
Service Response Time dashboard
To see data in this dashboard enable and configure Module 10017: Service Performance Monitor. Please refer to
NetFlow Optimizer User Guide for details. Use Watch List parameter in this Module to specify the services you want
to monitor (Service Destination IP, Destination Port, and Transport protocol).

NetFlow Analytics for Splunk App User Manual 21
Asset Access Monitor
To see data in this dashboard enable and configure Module 10014: Asset Access Monitor. Please refer to NetFlow
Optimizer User Guide for details.
This dashboard shows top services with most unauthorized connections - traffic from unauthorized users to services
(IP address, destination port, protocol configured in the NFO Module 10014: Asset Access Monitor) and top peers
with most unauthorized connections – traffic to peers (IP address and subnet mask also configurable in NFO Module
10014 section).
Security Events
Cyber Thread Statistics dashboard
The Cyber Threat Statistics dashboard enables your organization to analyze and prioritize network security event
traffic. Using this dashboard you will be able to see geo location of top hosts, network traffic to and from known
suspicious hosts. Out of the box we support geo county database from MaxMind and threat intelligence from
Emerging Threats and Alienvault. A corporation can also integrate its own watch-list.
To see data in this dashboard enable Security Module Set: 10040, 10050, 10051, 10052, 10053 and install
and setup the four utilities for each Module, create the required data sets and add them to the NetFlow Optimizer
Modules.

NetFlow Analytics for Splunk App User Manual 22
DNS Security dashboard
To see data in this dashboard enable Module 10004: DNS Monitor. Please refer to NetFlow Optimizer User Guide for
details. It is useful to monitor average response time of all DNS servers used in your network. The right panel also
shows top DNS users.
More Traffic Statistics
TCP Health
To see data in this dashboard enable and configure Module 10060: TCP Health. Please refer to NetFlow Optimizer
User Guide for details.

NetFlow Analytics for Splunk App User Manual 23
The TCP Health dashboard monitors and detects top hosts with the most TCP Resets.
Top hosts are defined by percent of TCP resets to the total number of Resets for definitive NetFlow exporter or by
percent of TCP resets to the total number of host’s connections.
The TCP Health dashboard shows top hosts with most count of failed TCP connections and top hosts with largest
share of failed TCP connections.
GEO IP Monitor dashboard
The GEO IP dashboard shows geographical locations of Source IP for inbound traffic and Destination IP for outbound
traffic. You need to enable Module 10040: Visitors by country.
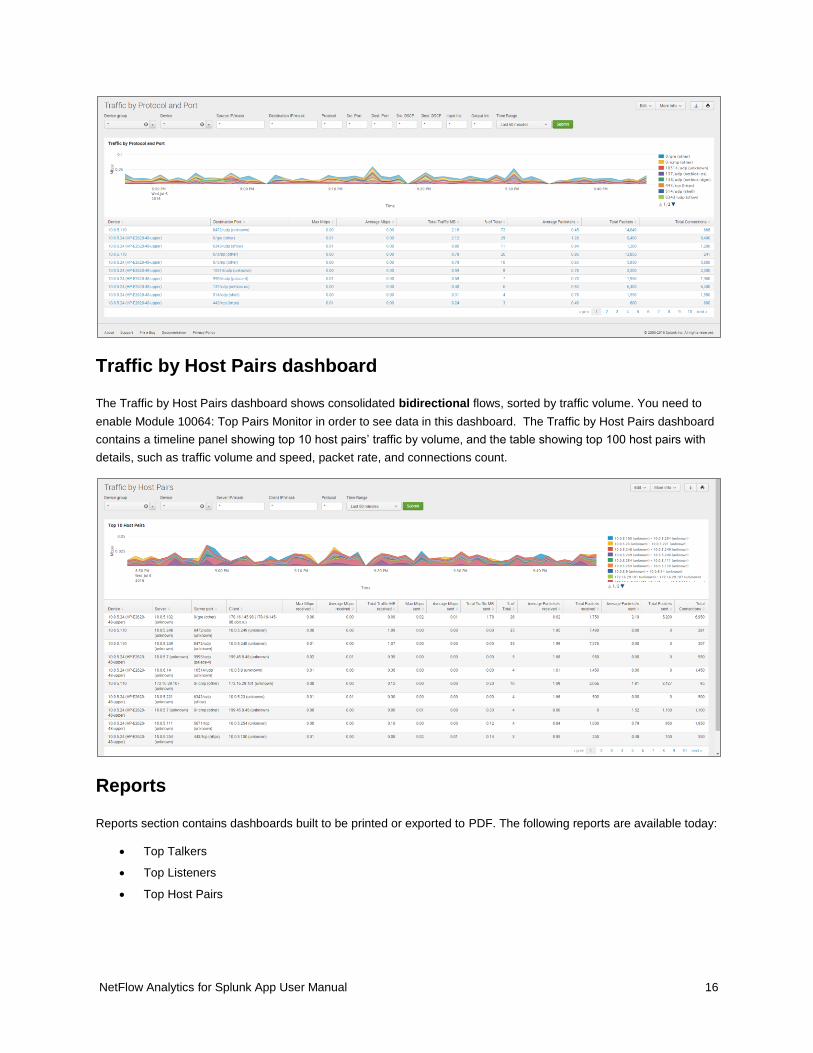
Traffic by Autonomous Systems dashboard
The Traffic by Autonomous Systems (AS) dashboard monitors traffic by AS. To see data in this dashboard enable
and configure Module 10066: Autonomous Systems Monitor.
Use the filtering options and time picker at the top of the dashboard to select the time interval and narrow down your
search results. Select if you want to see incoming or outgoing traffic by AS. Indicate if you want to see statistics for
IPv4 or IPv6 or both.
NetFlow Analytics for Splunk App User Manual 24
Traffic by CBQoS dashboard
The Traffic by CBQoS dashboard enables your organization to analyze and prioritize network traffic by Quality of
Service (QoS). Using this dashboard you will be able to see how QoS policy is applied in each of your network device
where it is enabled and reported, and if necessary tweak Type of Service (TOS) settings. To see data in this
dashboard enable Module 10066: CBQoS Monitor.
Use the filtering options and time picker at the top of the dashboard to select the time interval and narrow down your
search results.
Traffic Analyzer and Planning (based on my-subnets.csv lookup)
This dashboard is using this lookup $SPLUNK_HOME/etc/apps/netflow/lookups/my-subnets.csv file to determine
traffic in and out of your datacenter (East-West, South-North) as well as other subnet based statistics. It supports up
to four-level hierarchy, and should be created in the format shown in this example:

NetFlow Analytics for Splunk App User Manual 25
subnet,level_1,level_2,level_3,level_4,description
10.0.5.0/29,ClassA,ClassA1,ClassA11,ClassA111,ClassAsubnet111
10.0.5.8/29,ClassA,ClassA1,ClassA11,ClassA112,ClassAsubnet112
10.0.5.16/28,ClassA,ClassA1,ClassA12,ClassA121,ClassAsubnet121
10.0.5.32/27,ClassA,ClassA1,ClassA12,ClassA122,ClassAsubnet122
10.0.5.64/26,ClassA,ClassA2,ClassA21,ClassA211,ClassAsubnet211
10.0.5.128/27,ClassA,ClassA2,ClassA21,ClassA212,ClassAsubnet212
10.0.5.160/27,ClassA,ClassA2,ClassA22,ClassA221,ClassAsubnet221
10.0.5.192/26,ClassA,ClassA2,ClassA22,ClassA222,ClassAsubnet222
172.16.0.0/12,ClassB,ClassB1,ClassB11,ClassB111,ClassBsubnet111
192.168.0.0/16,ClassC,ClassC1,ClassC11,ClassC111,ClassCsubnet111
100::/18,IPv6_1,IPv6_11,IPv6_111,IPv6_1111,IPv6_1_subnet
104::/18,IPv6_2,IPv6_21,IPv6_211,IPv6_2111,IPv6_2_subnet
108::/18,IPv6_3,IPv6_31,IPv6_311,IPv6_3111,IPv6_3_subnet
10c::/18,IPv6_4,IPv6_41,IPv6_411,IPv6_4111,IPv6_4_subnet
The dashboards provides filters to apply to traffic statistics, so you can select all or the appropriate segment / sub-
segment of your network.
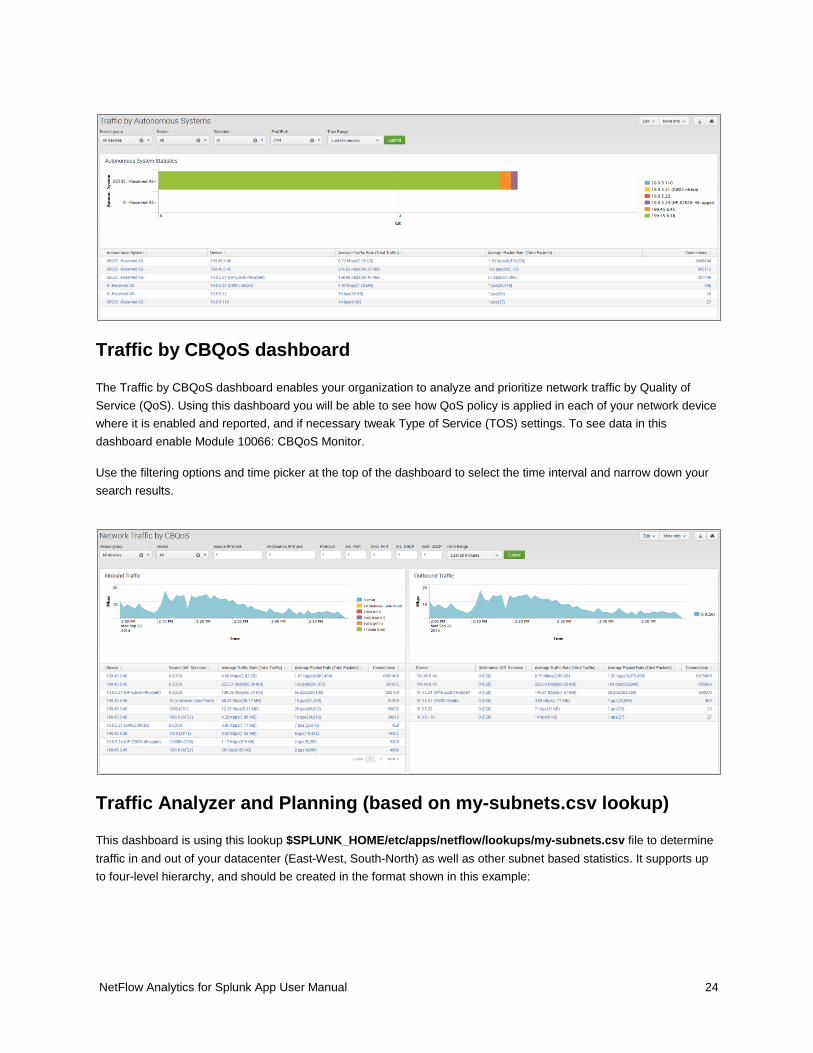
Microsegmentation Analyzer and Planning
This dashboards relies on Microsegmentation Analytics NFO Module which is available upon request. This
dashboard also is using this lookup $SPLUNK_HOME/etc/apps/netflow/lookups/my-subnets.csv file to determine
traffic in and out of your datacenter (East-West, South-North) as well as other subnet based statistics
NetFlow Analytics for Splunk App User Manual 26
SNMP
SNMP interface errors and discards
This dashboard shows network device statistics using NFO’s SNMP polling feature.
SNMP CISCO - latest memory/cpu values
This dashboard shows Cisco network device memory and CPU utilization using NFO’s SNMP polling feature.

NetFlow Analytics for Splunk App User Manual 27
Cisco ASA Monitor
Cisco ASA Monitor dashboards show the output from NetFlow Optimizer Cisco ASA Module set, which in its turn
designed to handle Cisco ASA NSEL.
Cisco Overview
The Cisco Overview dashboard aimed to provide a summary on traffic over the last 24 hours.
The panels show Geo location of hosts on the map, Top Bandwidth Consumers, Top Destinations, Top Violators, and
Top Connectors.
Cisco Top Bandwidth Consumers
This dashboard (a.k.a. Top Talkers) monitors host which generate most traffic in your network. It is useful for real
time or historical network utilization and bandwidth monitoring. The dashboard shows traffic volume and connections
count (created and denied) generated by each host.
Use the filtering options and time picker at the top of the dashboard to select the time interval and narrow down your
search results.
Cisco Top Destinations
This dashboard (a.k.a. Top Listeners) monitors host which receive most traffic. The top of the dashboard has a map
showing geographical locations of top destinations of the traffic in your network. It is useful for real time or historical
network utilization and bandwidth monitoring. The dashboard shows traffic volume and connections count (created
and denied) received by each host.
Use the filtering options and time picker at the top of the dashboard to select the time interval and narrow down your
search results.
Cisco Top Violators
This dashboard shows hosts with most traffic of denied flows. It could be useful to reinforce Cisco ASA firewall
policies.
Use the filtering options and time picker at the top of the dashboard to select the time interval and narrow down your
search results.
Cisco Top Connectors
This dashboard monitors host which generate most connections in your network. It is useful for identifying hosts that
make most connections, but could be omitted from top bandwidth consumers because of the small packets they
send, e.g. port scanners. The dashboard shows connections created by each host.
Use the filtering options and time picker at the top of the dashboard to select the time interval and narrow down your
search results.
NetFlow Analytics for Splunk App User Manual 28
Palo Alto Networks
Palo Alto Networks dashboards show the output from NetFlow Optimizer Palo Alto Networks Module set, which in its
turn designed to handle Palo Alto Network proprietary NetFlow v9 fields.
Palo Alto Networks Overview
The Palo Alto Networks Overview dashboard aimed to provide a summary on traffic over selected period time.
The panels show Top Bandwidth Consumers, Top Destinations, Top Violators, Top Connectors, Top Applications,
and Top Applications and Users.
Palo Alto Networks Top Bandwidth Consumers
This dashboard (a.k.a. Top Talkers) monitors host which generate most traffic in your network. It is useful for real
time or historical network utilization and bandwidth monitoring. The dashboard shows traffic volume and connections
count (created and denied) generated by each host.
Use the filtering options and time picker at the top of the dashboard to select the time interval and narrow down your
search results.
Palo Alto Networks Top Destinations
This dashboard (a.k.a. Top Listeners) monitors host which receive most traffic. It is useful for real time or historical
network utilization and bandwidth monitoring. The dashboard shows traffic volume and connections count (created
and denied) received by each host.
Use the filtering options and time picker at the top of the dashboard to select the time interval and narrow down your
search results.
Palo Alto Networks Top Violators
This dashboard shows hosts with most traffic of denied flows. It could be useful to reinforce Palo Alto Networks
firewall policies.
Use the filtering options and time picker at the top of the dashboard to select the time interval and narrow down your
search results.
Palo Alto Networks Top Connectors
This dashboard monitors host which generate most connections in your network. It is useful for identifying hosts that
make most connections, but could be omitted from top bandwidth consumers because of the small packets they
send, e.g. port scanners. The dashboard shows connections generated by each host.
Use the filtering options and time picker at the top of the dashboard to select the time interval and narrow down your
search results.

NetFlow Analytics for Splunk App User Manual 29
Top Applications
This dashboard monitors traffic by Application as identified by Palo Alto Network devices. It is useful for real time or
historical network utilization and bandwidth monitoring. The dashboard shows traffic volume and connections
attributed to each application recognized by Palo Alto Networks devices.
Use the filtering options and time picker at the top of the dashboard to select the time interval and narrow down your
search results.
Top Applications and Users
This dashboard monitors traffic by Application and Users as identified by Palo Alto Network devices. It is useful for
real time or historical network utilization and bandwidth monitoring. The dashboard shows traffic volume and
connections attributed to each application recognized by Palo Alto Networks devices, and allows to drill down to see
users of each reported application.
Use the filtering options and time picker at the top of the dashboard to select the time interval and narrow down your
search results.
Search Dashboards
There are three search dashboards within the App:
Traffic Timeline - search criteria set to macro `netflow_search_traffic_rules`
Cisco ASA Timeline
Palo Alto Networks Timeline
To see all output from NFO enter “index=flowintegrator” in search area. To filter search results to a specific NFO
Module, please add the corresponding Module output ID to your search, for example:
“index=flowintegrator nfc_id=20067”
You can add additional filters or any other Splunk search commands to narrow your search results and / or see
various statistics. You can also save your custom searches there.

NetFlow Analytics for Splunk App User Manual 30
Configuring Splunk Analytics for Hadoop (Hunk)
To use this App with Hunk (NetFlow Optimizer data sent to Hadoop) perform the following:
1. In Hunk Web, select Manager > Virtual Indexes in the menu bar.
2. Click the Provider tab (if it is not already selected) and click New Provider.
3. Fill in the following fields:
Name – any string
Java Home - /usr/lib/jvm/jre-1.7.0
Hadoop Home - /opt/Hadoop
Hadoop Version – Hadoop 2.x (Yarn)
File System – hdfs://%HDPIP%:8020
Resource Manager Address - %HDPIP%:8050
Resource Scheduler Address - %HDPIP%:8030
HDFS Working Directory - /user/root/splunkmr
4. Select Manager > Virtual Indexes in the menu bar.
5. Click the Virtual Index tab (if it is not already selected) and click New Virtual Index.
6. Fill in the following fields:
Name – any string
7. Paths - /user/flume/netflow-syslog
8. Click Save to save your index and return to the Virtual Indexes page.
How to generate sample events for testing purposes
This functionality relies on the "The Splunk Event Generator" software available from
https://github.com/splunk/eventgen.
Install the eventgen app on the indexer and perform the following:
1. Create directory $SPLUNK_ROOT/etc/apps/TA-netflow/local/ if it doesn't exist
2. Copy eventgen.conf from /default to /local folder and change the line:
disabled = true
to disabled = false
3. Restart Splunk