Embed Size (px)
Citation preview
FSDH Research www.fsdgroup.com
Equity Research Report
Nestle Nigeria Plc Growing Through Continuous Product Innovation
16 November 2018
Equity Research Report
Nestle Nigeria Plc
FSDH Merchant Bank
2 FSDH Research 16 November 2018
Q3 Ended 30 September , 2018
Executive Summary
Nestlé Nigeria Plc (Nestlé) reported a strong performance in Q3 2018 despite
the difficult operating environment
The company is benefiting from investments in expansion in the route to
market and market leadership
It managed its cost of sales better in Q3 2018 than in the corresponding
period of last year
The finance cost dropped significantly and compensated for the increase in
the operating expenses
Consequently, the profit margins increased in Q3 2018 over Q3 2017
The cash profit from core activities that Nestlé generated in 2017 improved
over 2016. This is an indication that more revenue translated to more cash
profit in 2017
Nestlé Nigeria plans to achieve its growth objective through continuous
innovation to meet consumer needs and preferences
As at December 2017, 80% of the agricultural inputs of Nestle are sourced
from local farmers due to investments made in 2011
We estimate a total dividend per share of N55.71 for the FY 2018
Our fair value of the shares of Nestle is N1,147.41
Our target price is N1,250
Equity Research Report
Nestle Nigeria Plc
FSDH Merchant Bank
3 FSDH Research 16 November 2018
1.0 Results Analysis
1.1 Q3 2018 Performance Analysis:
Nestlé Nigeria Plc (Nestlé) reported a strong performance in Q3 2018 despite the
difficult operating environment. The company is benefiting from investments in
expansion in the route to market and market leadership. It managed its cost of
sales better in Q3 2018 than in the corresponding period of last year. However,
the selling and distribution expenses as a proportion of revenue increased in
2018 over the level recorded in Q3 2017. The finance cost dropped significantly
and compensated for the increase in the operating expenses. Consequently, the
profit margins increased in Q3 2018 over Q3 2017. The unaudited Q3 2018 result
for the period ended September 2018 shows that Turnover (T/O) increased by 9.66%
to N203.13bn compared with N185.24bn in 2017. The company’s cost of sales
increased by 6.97% to N116.98bn from N109.36bn in Q3 2017. The increase in the
prices of most raw materials and inputs is responsible for increase in cost of sales.
Despite the increase in cost of sales, the company was more efficient in 2018
compared with 2017. The cost of sales as a percentage of T/O declined to 57.59% in
Q3 2018 from 59.04% as at 2017. Thus, the Gross Profit (GP) increased by 13.53% to
N86.15bn in Q3 2018 from N75.88bn in Q3 2017. Nestlé’s administrative, selling and
distribution expenses increased by 12.18% to N36.79bn. This was as a result of
increased investments in marketing and distribution. These expenses as a percentage
of turnover increased to 18.11% in Q3 2018 from 17.70% in 2017. The Earnings
Before Interest and Tax (EBIT) increased by 14.56% to N49.36bn from N43.09bn.
The company recorded a net financial charge of N1.27bn in Q3 2018, a decrease of
114.77% from N8.61bn in 2017. This was because of the significant drop in net
foreign exchange loss from N11.15bn in 2017 to N96.07mn in 2018. The Profit Before
Tax (PBT) grew to N48.09bn in Q3 2018, an increase of 39.47% from N34.48bn in Q3
2017. The tax provision also increased by 30.19% to N14.97bn from N11.50bn in
2017. The Profit After Tax (PAT) was N33.12bn in Q3 2018, from N22.98bn in 2017,
representing an increase of 44.12%.
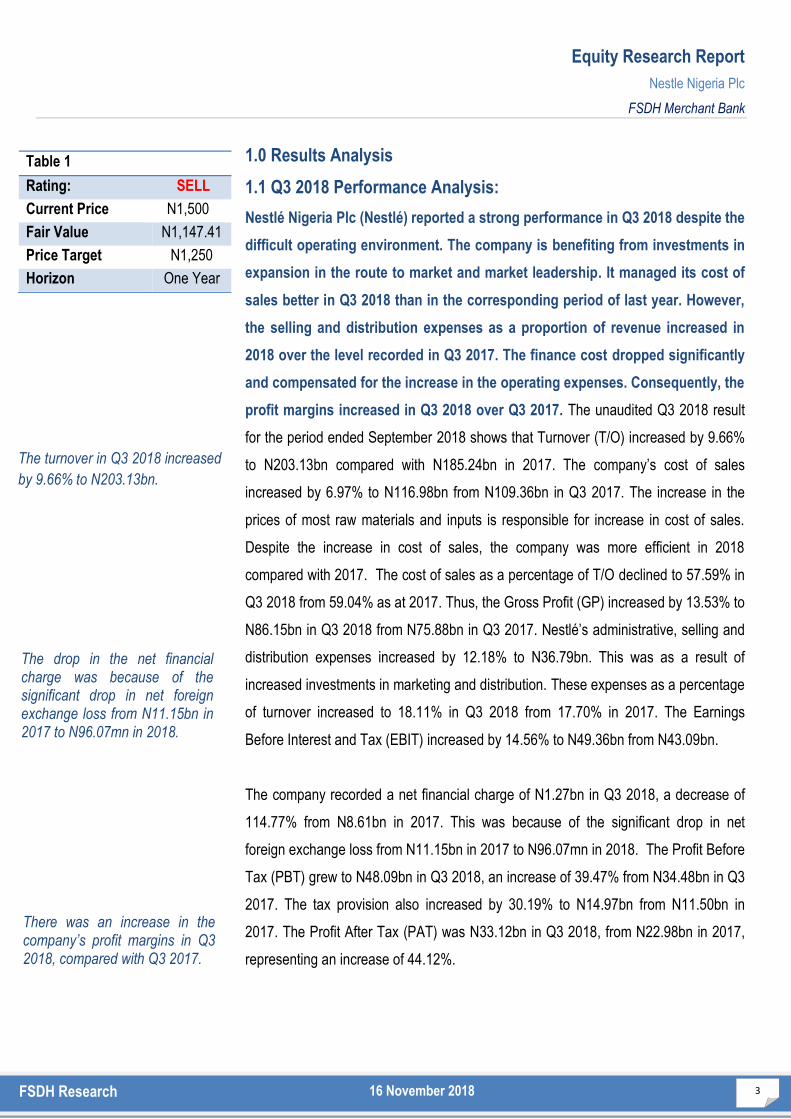
Table 1
Rating: SELL
Current Price N1,5001
Fair Value N1,147.41
Price Target N1,250
Horizon One Year
The drop in the net financial charge was because of the significant drop in net foreign exchange loss from N11.15bn in 2017 to N96.07mn in 2018.
The turnover in Q3 2018 increased
by 9.66% to N203.13bn.
There was an increase in the company’s profit margins in Q3 2018, compared with Q3 2017.
Equity Research Report
Nestle Nigeria Plc
FSDH Merchant Bank
4 FSDH Research 16 November 2018
The GP margin increased to 42.41% in Q3 2018 from 40.96% in Q3 2017 while
the EBIT Margin increased to 24.30% from 23.26%. Similarly, the PBT margin
increased to 23.67% in Q3 2018 from 18.61% as at Q3 2017. The PAT margin
currently stands at 16.30% in Q3 2018, up from 12.41% in the corresponding period of
2017.
A cursory look at the balance sheet position as at Q3 2018 compared with FY
December 2017 shows that the cash position of the company improved greatly in Q3
2018. Although the company tied down more cash in inventory and trade and
receivables, it also enjoyed free credits from trading partners. Consequently, its
working capital improved. The total fixed assets decreased by 7.78% to N66.75bn in
Q3 2018 from N72.38bn in FY 2017. The inventory increased by 27.46% to N30.48bn
in Q3 2018, from N23.91bn in FY 2017. The cash and bank balances increased by
119.13% from N15.14bn in FY 2017 to N33.17bn in Q3 2018. Trade debtors
increased in Q3 2018 by 74.78% to N22.19bn, from N12.70bn in FY 2017. The
company’s trade payables also increased by 81.53% in Q3 2018 to N42.22bn from
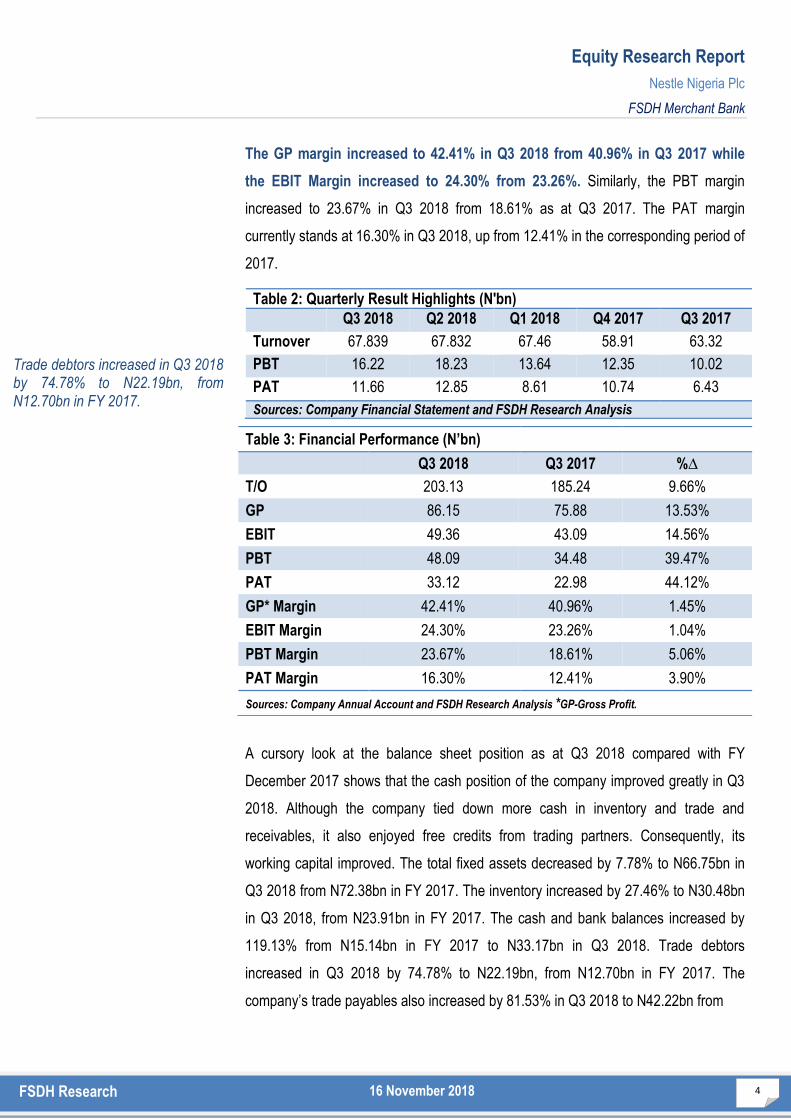
Table 3: Financial Performance (N’bn)
Q3 2018 Q3 2017 %∆
T/O 203.13 185.24 9.66%
GP 86.15 75.88 13.53%
EBIT 49.36 43.09 14.56%
PBT 48.09 34.48 39.47%
PAT 33.12 22.98 44.12%
GP* Margin 42.41% 40.96% 1.45%
EBIT Margin 24.30% 23.26% 1.04%
PBT Margin 23.67% 18.61% 5.06%
PAT Margin 16.30% 12.41% 3.90%
Sources: Company Annual Account and FSDH Research Analysis *GP-Gross Profit.
Table 2: Quarterly Result Highlights (N'bn)
Q3 2018 Q2 2018 Q1 2018 Q4 2017 Q3 2017
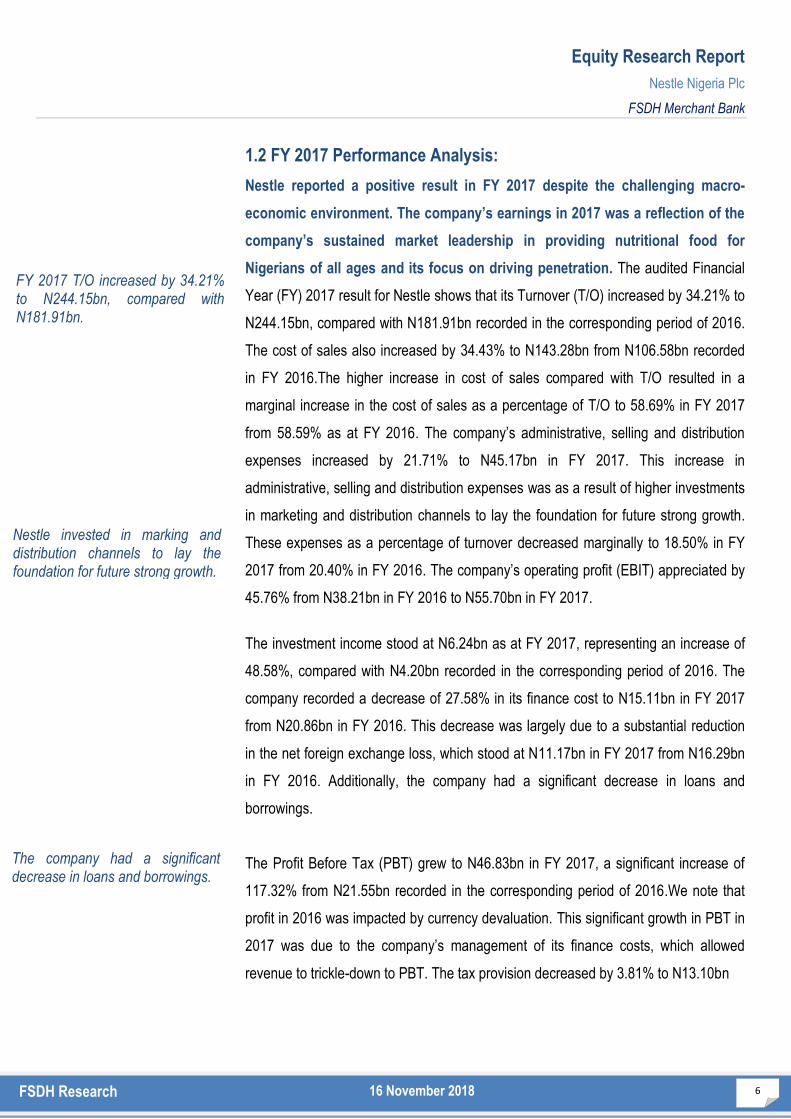
Turnover 67.839 67.832 67.46 58.91 63.32
PBT 16.22 18.23 13.64 12.35 10.02
PAT 11.66 12.85 8.61 10.74 6.43
Sources: Company Financial Statement and FSDH Research Analysis
Trade debtors increased in Q3 2018 by 74.78% to N22.19bn, from N12.70bn in FY 2017.
Equity Research Report
Nestle Nigeria Plc
FSDH Merchant Bank
5 FSDH Research 16 November 2018
32.27%
67.73%
Q3 Financing Mix
Equity Liabilities
42.06
49.04
63.32 67.84
0.00
10.00
20.00
30.00
40.00
50.00
60.00
70.00
80.00
Q3 2015 Q3 2016 Q3 2017 Q3 2018
Q3 Revenue Trend (N'bn)
N23.26bn as at FY 2017. The working capital stood at N7.67bn in Q3 2018 from a
negative N7.18bn in FY 2017, while net assets for the period increased by 25.37% to
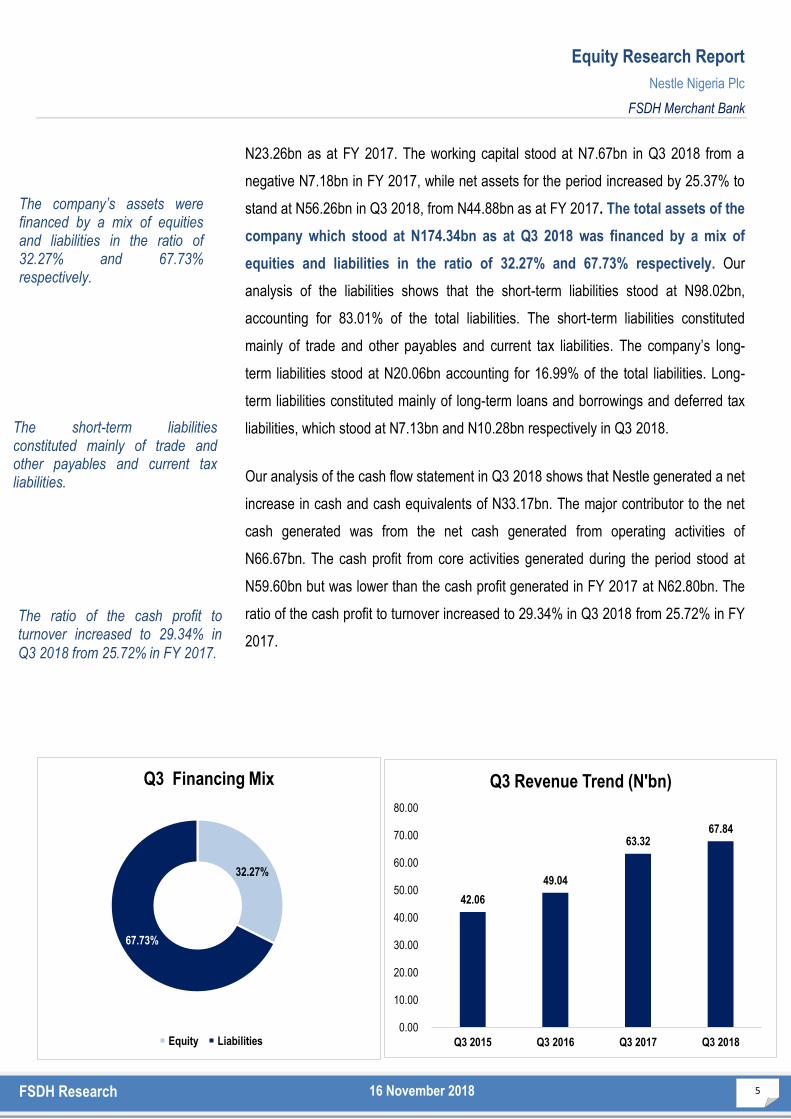
stand at N56.26bn in Q3 2018, from N44.88bn as at FY 2017. The total assets of the
company which stood at N174.34bn as at Q3 2018 was financed by a mix of
equities and liabilities in the ratio of 32.27% and 67.73% respectively. Our
analysis of the liabilities shows that the short-term liabilities stood at N98.02bn,
accounting for 83.01% of the total liabilities. The short-term liabilities constituted
mainly of trade and other payables and current tax liabilities. The company’s long-
term liabilities stood at N20.06bn accounting for 16.99% of the total liabilities. Long-
term liabilities constituted mainly of long-term loans and borrowings and deferred tax
liabilities, which stood at N7.13bn and N10.28bn respectively in Q3 2018.
Our analysis of the cash flow statement in Q3 2018 shows that Nestle generated a net
increase in cash and cash equivalents of N33.17bn. The major contributor to the net
cash generated was from the net cash generated from operating activities of
N66.67bn. The cash profit from core activities generated during the period stood at
N59.60bn but was lower than the cash profit generated in FY 2017 at N62.80bn. The
ratio of the cash profit to turnover increased to 29.34% in Q3 2018 from 25.72% in FY
2017.
The company’s assets were financed by a mix of equities and liabilities in the ratio of 32.27% and 67.73% respectively.
The ratio of the cash profit to turnover increased to 29.34% in
Q3 2018 from 25.72% in FY 2017.
The short-term liabilities constituted mainly of trade and other payables and current tax liabilities.
Equity Research Report
Nestle Nigeria Plc
FSDH Merchant Bank
6 FSDH Research 16 November 2018
1.2 FY 2017 Performance Analysis:
Nestle reported a positive result in FY 2017 despite the challenging macro-
economic environment. The company’s earnings in 2017 was a reflection of the
company’s sustained market leadership in providing nutritional food for
Nigerians of all ages and its focus on driving penetration. The audited Financial
Year (FY) 2017 result for Nestle shows that its Turnover (T/O) increased by 34.21% to
N244.15bn, compared with N181.91bn recorded in the corresponding period of 2016.
The cost of sales also increased by 34.43% to N143.28bn from N106.58bn recorded
in FY 2016.The higher increase in cost of sales compared with T/O resulted in a
marginal increase in the cost of sales as a percentage of T/O to 58.69% in FY 2017
from 58.59% as at FY 2016. The company’s administrative, selling and distribution
expenses increased by 21.71% to N45.17bn in FY 2017. This increase in
administrative, selling and distribution expenses was as a result of higher investments
in marketing and distribution channels to lay the foundation for future strong growth.
These expenses as a percentage of turnover decreased marginally to 18.50% in FY
2017 from 20.40% in FY 2016. The company’s operating profit (EBIT) appreciated by
45.76% from N38.21bn in FY 2016 to N55.70bn in FY 2017.
The investment income stood at N6.24bn as at FY 2017, representing an increase of
48.58%, compared with N4.20bn recorded in the corresponding period of 2016. The
company recorded a decrease of 27.58% in its finance cost to N15.11bn in FY 2017
from N20.86bn in FY 2016. This decrease was largely due to a substantial reduction
in the net foreign exchange loss, which stood at N11.17bn in FY 2017 from N16.29bn
in FY 2016. Additionally, the company had a significant decrease in loans and
borrowings.
The Profit Before Tax (PBT) grew to N46.83bn in FY 2017, a significant increase of
117.32% from N21.55bn recorded in the corresponding period of 2016.We note that
profit in 2016 was impacted by currency devaluation. This significant growth in PBT in
2017 was due to the company’s management of its finance costs, which allowed
revenue to trickle-down to PBT. The tax provision decreased by 3.81% to N13.10bn
FY 2017 T/O increased by 34.21% to N244.15bn, compared with N181.91bn.
Nestle invested in marking and distribution channels to lay the foundation for future strong growth.
The company had a significant decrease in loans and borrowings.
Equity Research Report
Nestle Nigeria Plc
FSDH Merchant Bank
7 FSDH Research 16 November 2018
from N13.62bn. Profit After Tax (PAT) stood at N33.72bn in FY 2017 from N7.92bn in
the corresponding period of 2016, representing an increase of 325.54%.
Gross profit margin decreased marginally from 41.41% in 2016 to 41.31% in 2017.
The company’s EBIT margin grew from 21.01% in FY 2016 to 22.81% in FY 2017.
The gain in finance cost translated to better profit margins during the year. The PBT
margin increased to 19.18% in FY 2017 from 11.85% as at FY 2016. Also, the PAT
margin increased to 13.81% in FY 2017 from 4.36% in the corresponding period of
2016.
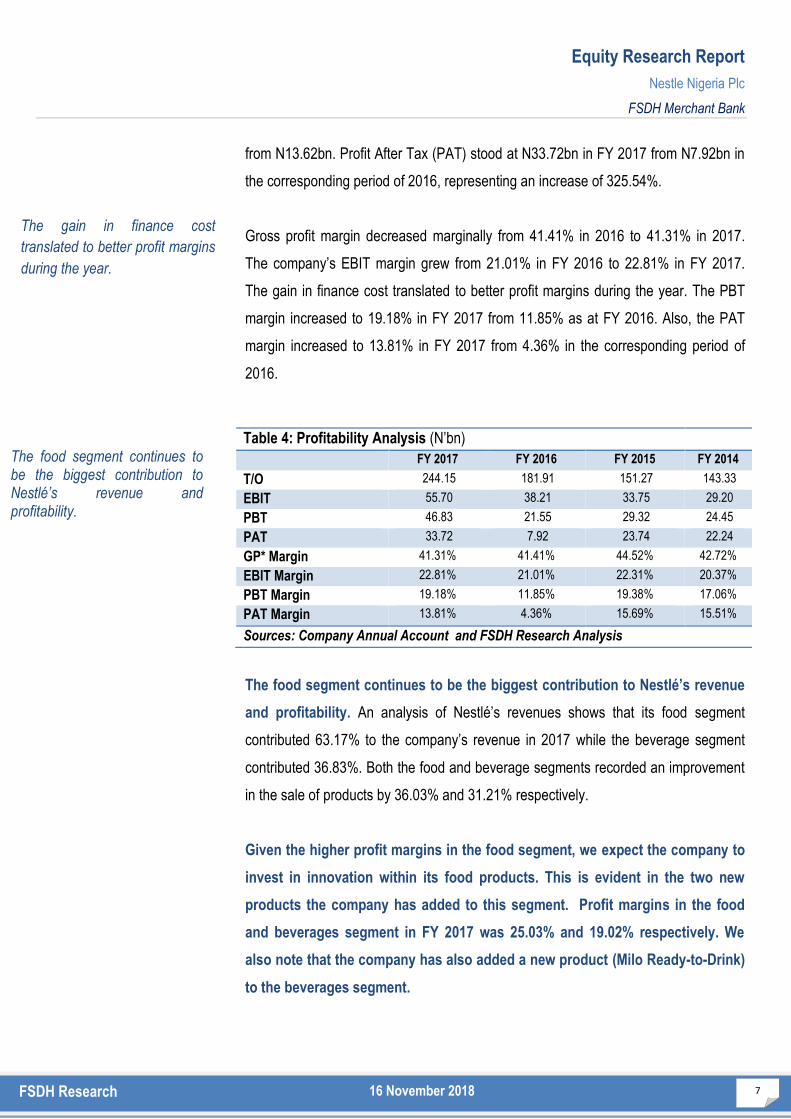
The food segment continues to be the biggest contribution to Nestlé’s revenue
and profitability. An analysis of Nestlé’s revenues shows that its food segment
contributed 63.17% to the company’s revenue in 2017 while the beverage segment
contributed 36.83%. Both the food and beverage segments recorded an improvement
in the sale of products by 36.03% and 31.21% respectively.
Given the higher profit margins in the food segment, we expect the company to
invest in innovation within its food products. This is evident in the two new
products the company has added to this segment. Profit margins in the food
and beverages segment in FY 2017 was 25.03% and 19.02% respectively. We
also note that the company has also added a new product (Milo Ready-to-Drink)
to the beverages segment.
Table 4: Profitability Analysis (N’bn)
FY 2017 FY 2016 FY 2015 FY 2014
T/O 244.15 181.91 151.27 143.33
EBIT 55.70 38.21 33.75 29.20
PBT 46.83 21.55 29.32 24.45
PAT 33.72 7.92 23.74 22.24
GP* Margin 41.31% 41.41% 44.52% 42.72%
EBIT Margin 22.81% 21.01% 22.31% 20.37%
PBT Margin 19.18% 11.85% 19.38% 17.06%
PAT Margin 13.81% 4.36% 15.69% 15.51%
Sources: Company Annual Account and FSDH Research Analysis
The gain in finance cost
translated to better profit margins
during the year.
The food segment continues to be the biggest contribution to Nestlé’s revenue and profitability.
Equity Research Report
Nestle Nigeria Plc
FSDH Merchant Bank
8 FSDH Research 16 November 2018
A cursory look at the balance sheet position as at FY 2017 compared with the position
as at FY 2016 shows a marginal increase in the company’s fixed assets. The total
fixed assets increased by 3.14% to N72.38bn in FY 2017 from N70.17bn in FY 2016.
The inventory increased by 15.86% to N23.91bn from N20.63bn in FY 2016. The cash
and bank balances recorded a significant decrease of 70.52% from N51.35bn in FY
2016 to N15.14bn in FY 2017. The trade debtors increased in FY 2017 by 35.48% to
N9.93bn from N7.33bn in FY 2016.
The trade creditors increased by 33.56% to N14.21bn from N10.64bn as at FY 2016.
The working capital stood at a negative N7.18bn in FY 2017 from a negative
N23.30bn recorded in FY 2018. Net assets for the period increased by 45.34% to
stand at N44.88bn in FY 2017 from N30.88bn as at FY 2016. The total assets of the
company which stood at N146.80bn as at FY 2017 were financed by a mix of equities
and liabilities in the ratio of 30.57% and 69.43% respectively. Our analysis of the
liabilities shows that the short-term liabilities stood at N79.68bn, accounting for
78.17% of the total liabilities, while the long-term liabilities stood at N22.25bn
accounting for 21.83% of the total liabilities. The long-term liabilities constituted mainly
of deferred taxation, which stood at N10.40bn.
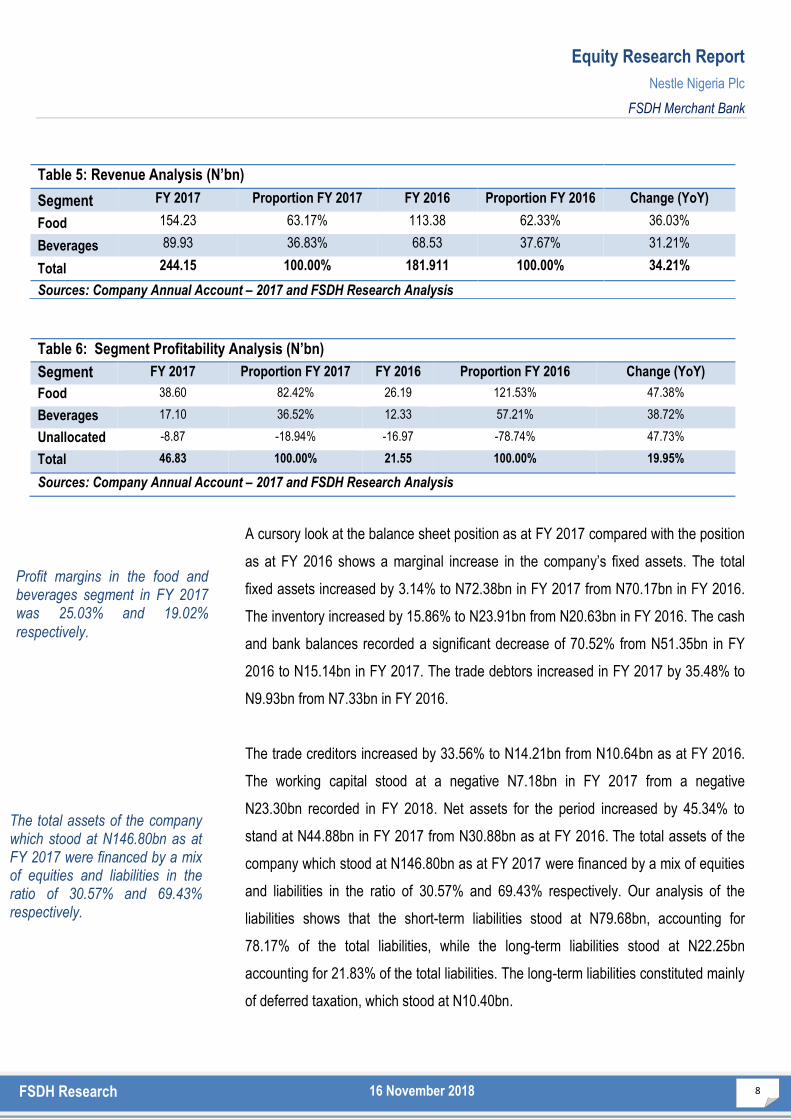
Table 5: Revenue Analysis (N’bn)
Segment FY 2017 Proportion FY 2017 FY 2016 Proportion FY 2016 Change (YoY)
Food 154.23 63.17% 113.38 62.33% 36.03%
Beverages 89.93 36.83% 68.53 37.67% 31.21%
Total 244.15 100.00% 181.911 100.00% 34.21%
Sources: Company Annual Account – 2017 and FSDH Research Analysis
Table 6: Segment Profitability Analysis (N’bn)
Segment FY 2017 Proportion FY 2017 FY 2016 Proportion FY 2016 Change (YoY)
Food 38.60 82.42% 26.19 121.53% 47.38%
Beverages 17.10 36.52% 12.33 57.21% 38.72%
Unallocated -8.87 -18.94% -16.97 -78.74% 47.73%
Total 46.83 100.00% 21.55 100.00% 19.95%
Sources: Company Annual Account – 2017 and FSDH Research Analysis
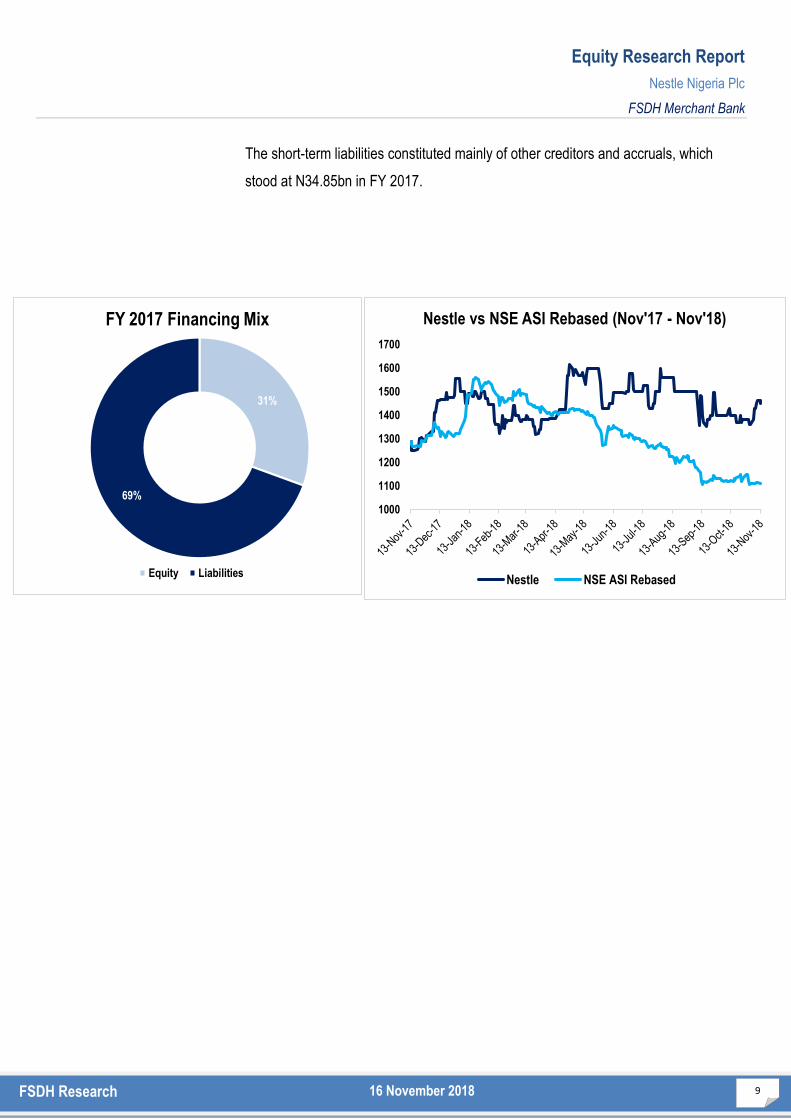
The total assets of the company which stood at N146.80bn as at FY 2017 were financed by a mix of equities and liabilities in the ratio of 30.57% and 69.43% respectively.
Profit margins in the food and beverages segment in FY 2017 was 25.03% and 19.02%
respectively.
Equity Research Report
Nestle Nigeria Plc
FSDH Merchant Bank
9 FSDH Research 16 November 2018
31%
69%
FY 2017 Financing Mix
Equity Liabilities
1000
1100
1200
1300
1400
1500
1600
1700
Nestle vs NSE ASI Rebased (Nov'17 - Nov'18)
Nestle NSE ASI Rebased
The short-term liabilities constituted mainly of other creditors and accruals, which
stood at N34.85bn in FY 2017.
Equity Research Report
Nestle Nigeria Plc
FSDH Merchant Bank
10 FSDH Research 16 November 2018
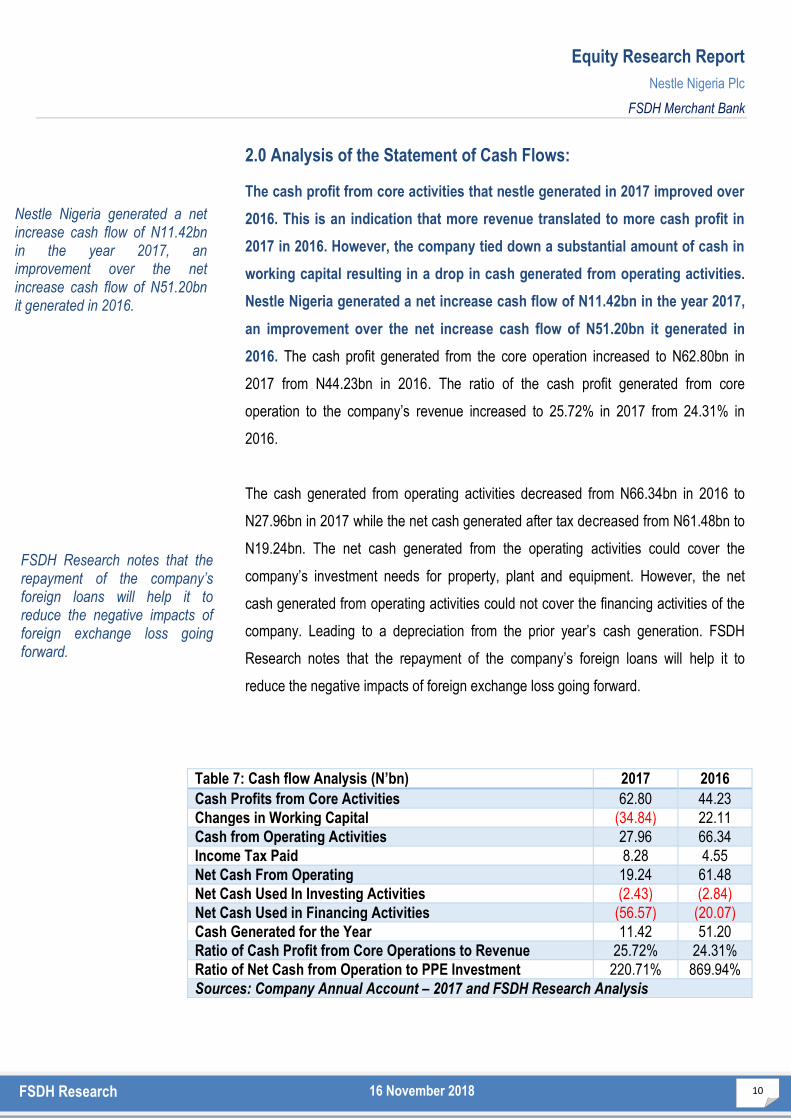
2.0 Analysis of the Statement of Cash Flows:
The cash profit from core activities that nestle generated in 2017 improved over
2016. This is an indication that more revenue translated to more cash profit in
2017 in 2016. However, the company tied down a substantial amount of cash in
working capital resulting in a drop in cash generated from operating activities.
Nestle Nigeria generated a net increase cash flow of N11.42bn in the year 2017,
an improvement over the net increase cash flow of N51.20bn it generated in
2016. The cash profit generated from the core operation increased to N62.80bn in
2017 from N44.23bn in 2016. The ratio of the cash profit generated from core
operation to the company’s revenue increased to 25.72% in 2017 from 24.31% in
2016.
The cash generated from operating activities decreased from N66.34bn in 2016 to
N27.96bn in 2017 while the net cash generated after tax decreased from N61.48bn to
N19.24bn. The net cash generated from the operating activities could cover the
company’s investment needs for property, plant and equipment. However, the net
cash generated from operating activities could not cover the financing activities of the
company. Leading to a depreciation from the prior year’s cash generation. FSDH
Research notes that the repayment of the company’s foreign loans will help it to
reduce the negative impacts of foreign exchange loss going forward.
Table 7: Cash flow Analysis (N’bn) 2017 2016
Cash Profits from Core Activities 62.80 44.23
Changes in Working Capital (34.84) 22.11
Cash from Operating Activities 27.96 66.34
Income Tax Paid 8.28 4.55
Net Cash From Operating 19.24 61.48
Net Cash Used In Investing Activities (2.43) (2.84)
Net Cash Used in Financing Activities (56.57) (20.07)
Cash Generated for the Year 11.42 51.20
Ratio of Cash Profit from Core Operations to Revenue 25.72% 24.31%
Ratio of Net Cash from Operation to PPE Investment 220.71% 869.94%
Sources: Company Annual Account – 2017 and FSDH Research Analysis
Nestle Nigeria generated a net increase cash flow of N11.42bn in the year 2017, an improvement over the net increase cash flow of N51.20bn it generated in 2016.
FSDH Research notes that the repayment of the company’s foreign loans will help it to reduce the negative impacts of foreign exchange loss going forward.
Equity Research Report
Nestle Nigeria Plc
FSDH Merchant Bank
11 FSDH Research 16 November 2018
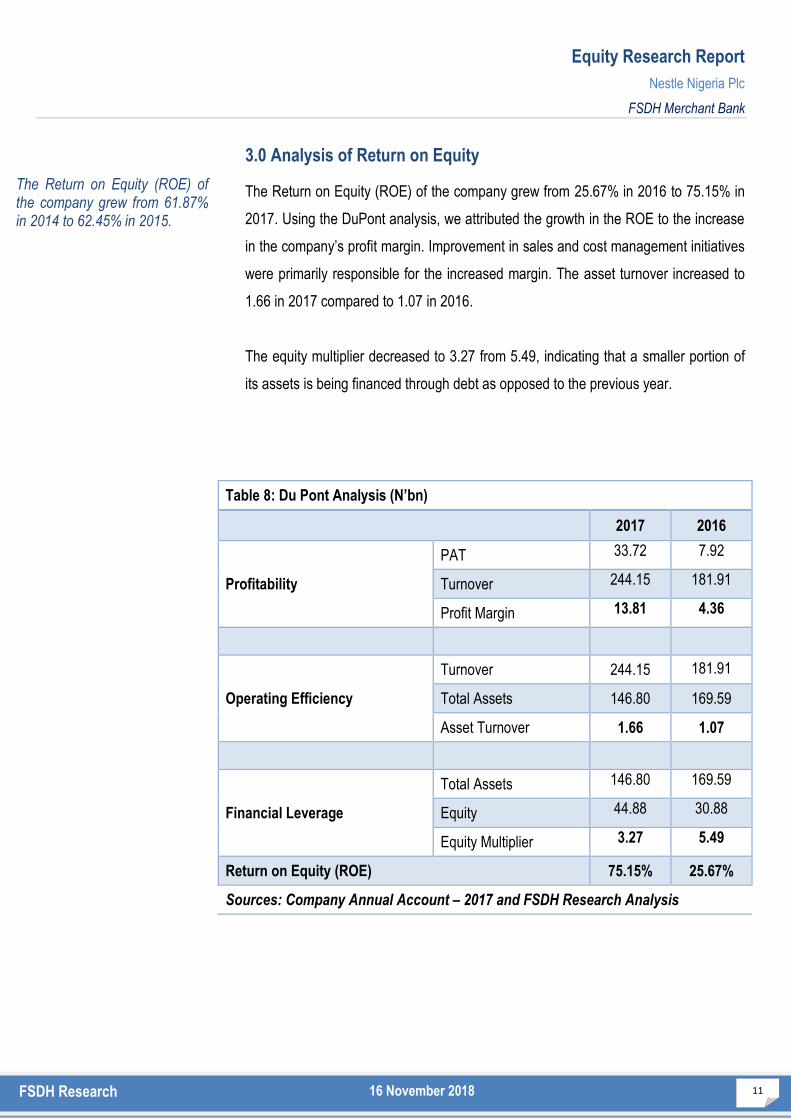
3.0 Analysis of Return on Equity
The Return on Equity (ROE) of the company grew from 25.67% in 2016 to 75.15% in
2017. Using the DuPont analysis, we attributed the growth in the ROE to the increase
in the company’s profit margin. Improvement in sales and cost management initiatives
were primarily responsible for the increased margin. The asset turnover increased to
1.66 in 2017 compared to 1.07 in 2016.
The equity multiplier decreased to 3.27 from 5.49, indicating that a smaller portion of
its assets is being financed through debt as opposed to the previous year.
Table 8: Du Pont Analysis (N’bn)
2017 2016
Profitability
PAT 33.72 7.92
Turnover 244.15 181.91
Profit Margin 13.81 4.36
Operating Efficiency
Turnover 244.15 181.91
Total Assets 146.80 169.59
Asset Turnover 1.66 1.07
Financial Leverage
Total Assets 146.80 169.59
Equity 44.88 30.88
Equity Multiplier 3.27 5.49
Return on Equity (ROE) 75.15% 25.67%
Sources: Company Annual Account – 2017 and FSDH Research Analysis
The Return on Equity (ROE) of the company grew from 61.87% in 2014 to 62.45% in 2015.
Equity Research Report
Nestle Nigeria Plc
FSDH Merchant Bank
12 FSDH Research 16 November 2018
4.0 Drivers of Performance:
The following factors affected the earnings of Nestlé’s:
Positive Factors:
Sustained market leadership
Diversified product portfolio which are essential for everyday living
Its backward integration strategy to secure raw materials locally by partnering
with farmers
Improvements in the economic environment
Increased penetration due to the Popularly Positioned Products (PPP)
strategy
Innovative products
Improved operational efficiency
Negative Factors:
Difficult operating environment
The weak consumer spending power
Stiff competition
The security challenges in the country.
4.1 Strategic Focus:
Nestlé Nigeria plans to achieve its growth objectives by continuing to invest in
innovation of new products to meet consumer needs and preferences as well as
investment in new facilities. The company’s product innovation is based on the
understanding of the nutritional needs, local tastes and habits of its customers. Nestle also
focuses on food fortification to help micronutrient deficiency challenges. This is reinforced
by its PPP strategy, which focuses on the specific needs of lower-income consumers.
PPP offers these consumers high-quality food products that provide nutritional value
at an affordable cost.
Creating Shared Value (CSV) is embedded in the way Nestle does business. This
includes sourcing raw materials for its local production. As at December 2017, 80% of
the agricultural input in production is sourced from local farmer due to investments
made in 2011. All of the grains and legumes used in Golden Morn are locally sourced.
PPP offers these consumers high-quality food products that provide nutritional value at an
affordable cost.
As at December 2017, 80% of the agricultural input in production is sourced from local farmer due to investments made
in 2011.
Equity Research Report
Nestle Nigeria Plc
FSDH Merchant Bank
13 FSDH Research 16 November 2018
5.0 Business:
Nestlé Nigeria is part of the Nestle Group one of the largest food and beverage
companies in the world. Globally, Nestlé companies are organized into regional
groupings to leverage expertise and the size of the company. Nestle Nigeria is a part
of Central and West Africa region. The region is managed through Nestlé Central &
West Africa Limited, which is based in Accra. As at FY 2017; the Nigerian market
contributed 98.76% to the turnover of Nestlé Central & West Africa, while Niger,
Chad, Senegal, Togo, Ghana, Guinea and others contributed the remaining
1.24%. Thus, the Nigerian market remains an important segment of the Nestle
Group.
Nestlé Nigeria has three manufacturing plants Flowergate, Abaji and Agbara. The
Agbara factory has grown into a factory complex housing multiple plants. The
company recently inaugurated the Milo Ready-to-Drink plant at the Agbara factory.
Nestle Nigeria spent N51billion on investments in its manufacturing operations
from 2012 to 2017.
The company produces several products including Maggi Star, Maggi Chicken, Maggi
Crayfish, Maggi Mix’py, Milo, Milo Energy Cubes, Milo Ready-to-Drink (RTD), Goldern
Morn Maize, Golden Morn Puffs, Nestle Pure Life, Nescafe, SMA, NAN Nutrend,
Lactogen and Cerelac.
The company recently
inaugurated the Milo Ready-to-
Drink plant at the Agbara
factory.
Nestle Nigeria spent N51billion on
investments in its manufacturing
operations from 2012 to 2017.
Equity Research Report
Nestle Nigeria Plc
FSDH Merchant Bank
14 FSDH Research 16 November 2018
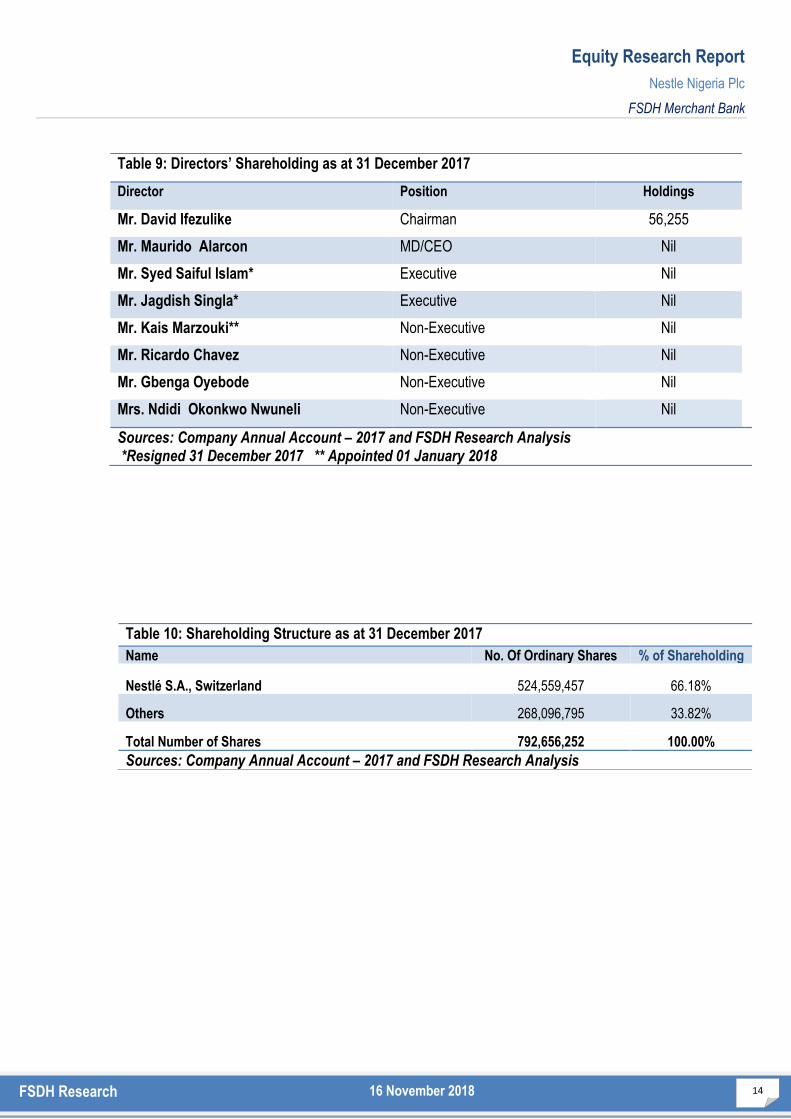
Table 9: Directors’ Shareholding as at 31 December 2017
Director Position Holdings
Mr. David Ifezulike Chairman 56,255
Mr. Maurido Alarcon MD/CEO Nil
Mr. Syed Saiful Islam* Executive Nil
Mr. Jagdish Singla* Executive Nil
Mr. Kais Marzouki** Non-Executive Nil
Mr. Ricardo Chavez Non-Executive Nil
Mr. Gbenga Oyebode Non-Executive Nil
Mrs. Ndidi Okonkwo Nwuneli Non-Executive Nil
Sources: Company Annual Account – 2017 and FSDH Research Analysis *Resigned 31 December 2017 ** Appointed 01 January 2018
Table 10: Shareholding Structure as at 31 December 2017
Name No. Of Ordinary Shares % of Shareholding
Nestlé S.A., Switzerland 524,559,457 66.18%
Others 268,096,795 33.82%
Total Number of Shares 792,656,252 100.00%
Sources: Company Annual Account – 2017 and FSDH Research Analysis
Equity Research Report
Nestle Nigeria Plc
FSDH Merchant Bank
15 FSDH Research 16 November 2018
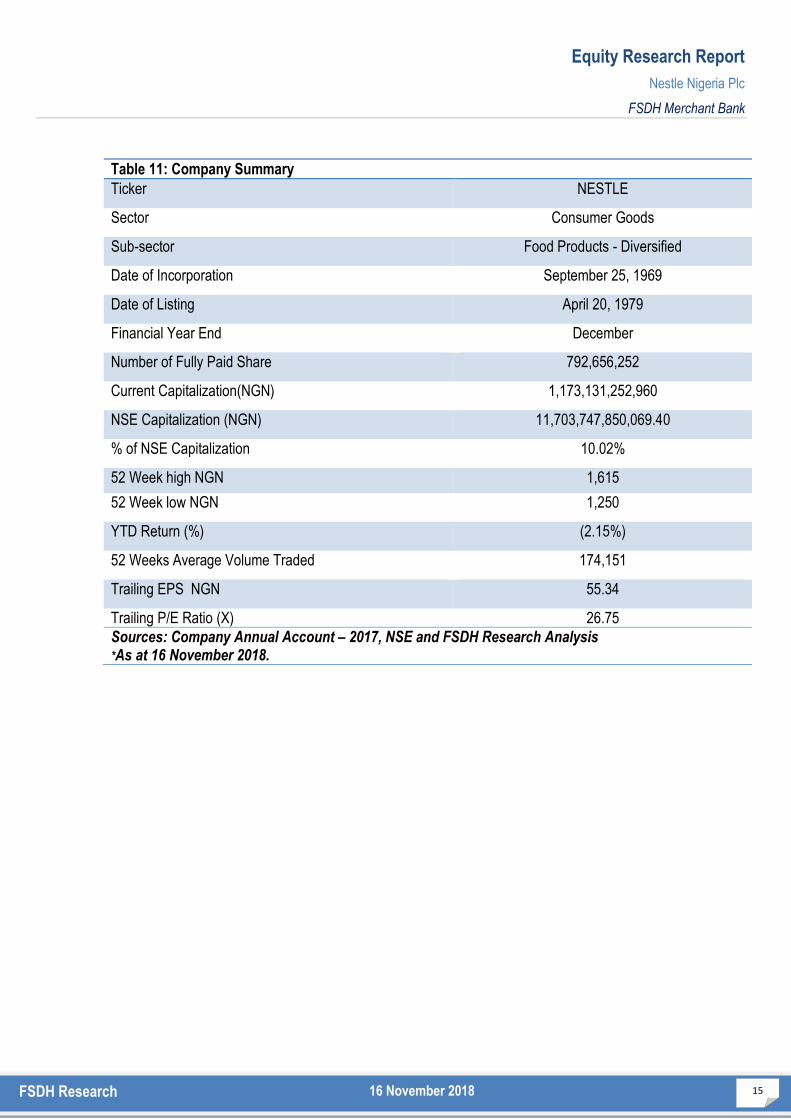
Table 11: Company Summary
Ticker NESTLE
Sector Consumer Goods
Sub-sector Food Products - Diversified
Date of Incorporation September 25, 1969
Date of Listing April 20, 1979
Financial Year End December
Number of Fully Paid Share 792,656,252
Current Capitalization(NGN) 1,173,131,252,960
NSE Capitalization (NGN) 11,703,747,850,069.40
% of NSE Capitalization 10.02%
52 Week high NGN 1,615
52 Week low NGN 1,250
YTD Return (%) (2.15%)
52 Weeks Average Volume Traded 174,151
Trailing EPS NGN 55.34
Trailing P/E Ratio (X) 26.75
Sources: Company Annual Account – 2017, NSE and FSDH Research Analysis *As at 16 November 2018.
Equity Research Report
Nestle Nigeria Plc
FSDH Merchant Bank
16 FSDH Research 16 November 2018
6.0 Product Analysis:
Nestlé has two reportable business segments, which are its strategic business units.
The units are Food Products and Beverages. This strategic business units offer
different products and are managed separately because they require different
technology and marketing strategies. The food and beverages segments contributed
63.17% and 36.83% to the company’s revenue in FY 2017 respectively.
6.1 Food Products:
The company engages in the production and sale of Maggi, Cerelac, Nutrend, NAN,
Lactogen and Golden Morn under this segment. The company has introduced new
products Maggi Naija Pot and Golden Morn puffs. We gathered that the Gold Morn
puffs has gained traction in the market. Products in this category have traditionally
competed with imported food products in the market. Consumers’ gradual shift away
from foreign goods to goods with local content because of weak exchange rate should
be a positive for Nestle. There are smaller competitors in the food products market in
Nigeria but Nestlé maintains the lead in the market. Other competitor’s products in this
category include, Dan-Q Seasoning Cubes Onga Seasoning Cubes, Unilever’s Knorr
and Royco Cubes and Kellog’s Cereals.
6.2 Beverages:
The company engages in the production and sale of Milo, Nido, Nescafe, and Nestlé
Pure Life. The company introduced a new product Milo RTD. Competing products in
the market are Bournvita, Ovaltine, Horlicks, Eva Water, Cway Water, Swan Water,
Peak Milk, Cowbell Milk etc
The company’s food business
contributed more to its revenue than
its beverage business.
Consumers’ gradual shift away from
foreign goods to goods with local
content because of weak exchange
rate should be a positive for Nestle.
Equity Research Report
Nestle Nigeria Plc
FSDH Merchant Bank
17 FSDH Research 16 November 2018
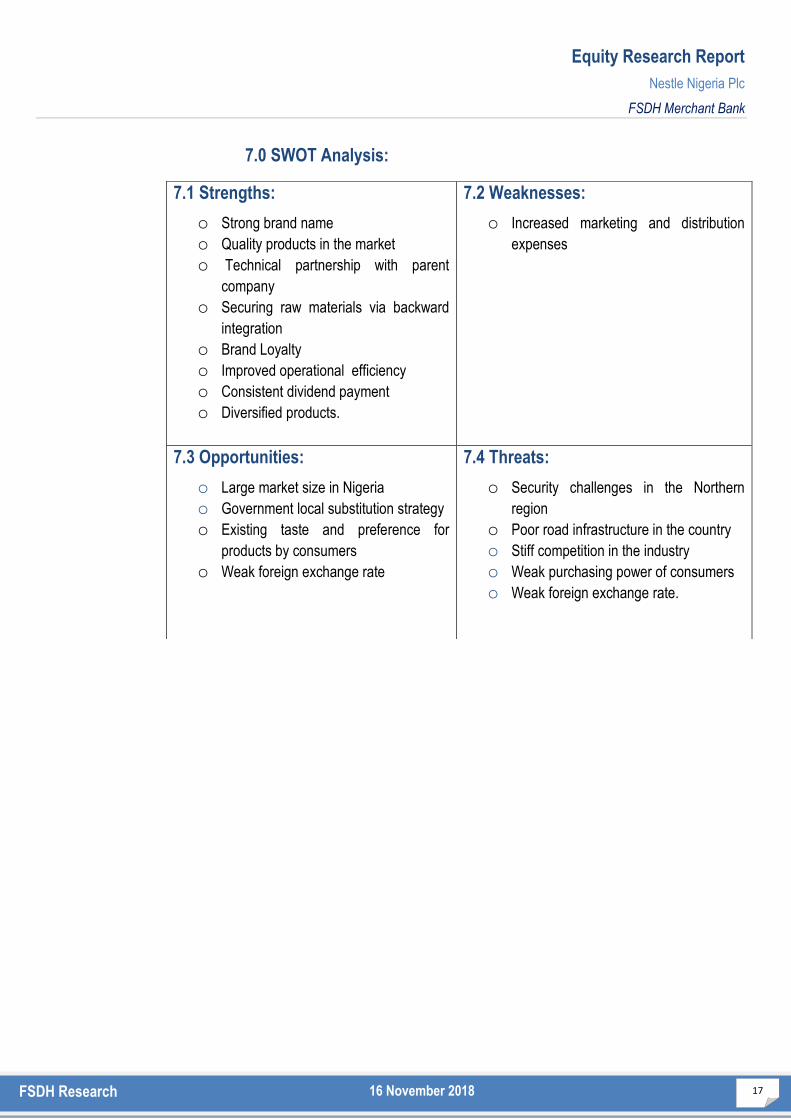
7.0 SWOT Analysis:
7.1 Strengths:
o Strong brand name
o Quality products in the market
o Technical partnership with parent
company
o Securing raw materials via backward
integration
o Brand Loyalty
o Improved operational efficiency
o Consistent dividend payment
o Diversified products.
7.2 Weaknesses:
o Increased marketing and distribution
expenses
7.3 Opportunities:
o Large market size in Nigeria o Government local substitution strategy o Existing taste and preference for
products by consumers
o Weak foreign exchange rate
7.4 Threats:
o Security challenges in the Northern
region
o Poor road infrastructure in the country
o Stiff competition in the industry o Weak purchasing power of consumers o Weak foreign exchange rate.
Equity Research Report
Nestle Nigeria Plc
FSDH Merchant Bank
18 FSDH Research 16 November 2018
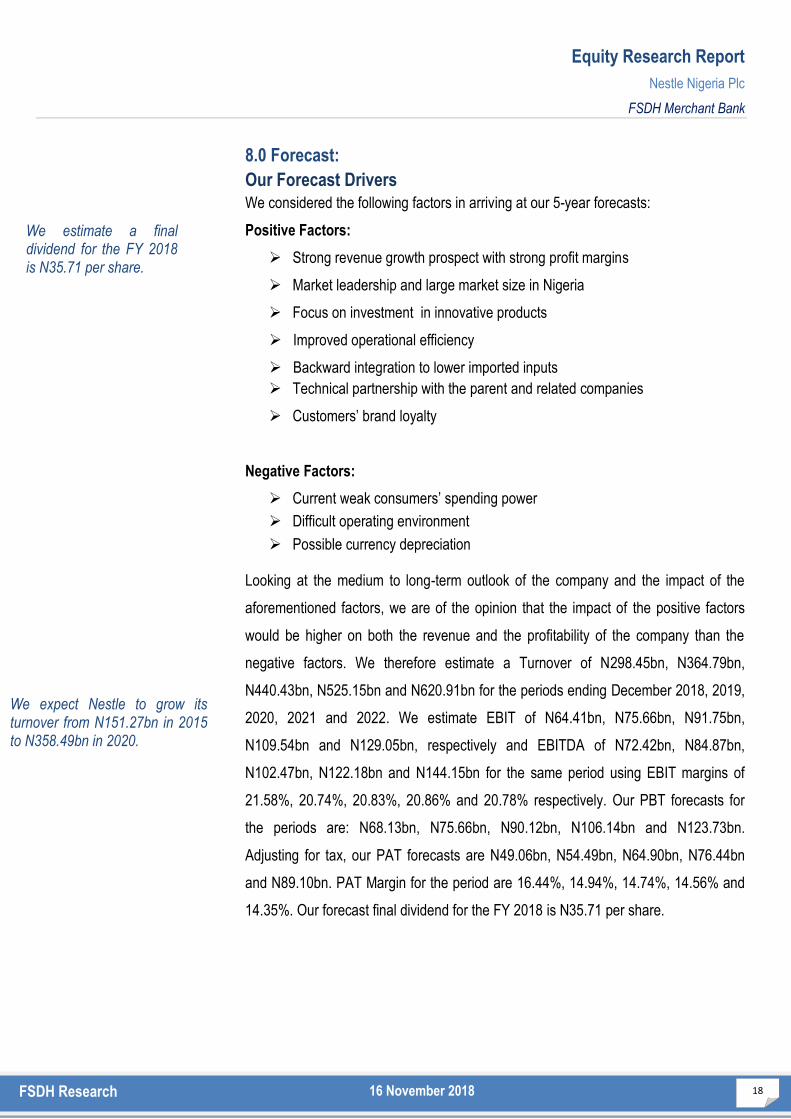
8.0 Forecast:
Our Forecast Drivers
We considered the following factors in arriving at our 5-year forecasts:
Positive Factors:
Strong revenue growth prospect with strong profit margins
Market leadership and large market size in Nigeria
Focus on investment in innovative products
Improved operational efficiency
Backward integration to lower imported inputs
Technical partnership with the parent and related companies
Customers’ brand loyalty
Negative Factors:
Current weak consumers’ spending power
Difficult operating environment
Possible currency depreciation
Looking at the medium to long-term outlook of the company and the impact of the
aforementioned factors, we are of the opinion that the impact of the positive factors
would be higher on both the revenue and the profitability of the company than the
negative factors. We therefore estimate a Turnover of N298.45bn, N364.79bn,
N440.43bn, N525.15bn and N620.91bn for the periods ending December 2018, 2019,
2020, 2021 and 2022. We estimate EBIT of N64.41bn, N75.66bn, N91.75bn,
N109.54bn and N129.05bn, respectively and EBITDA of N72.42bn, N84.87bn,
N102.47bn, N122.18bn and N144.15bn for the same period using EBIT margins of
21.58%, 20.74%, 20.83%, 20.86% and 20.78% respectively. Our PBT forecasts for
the periods are: N68.13bn, N75.66bn, N90.12bn, N106.14bn and N123.73bn.
Adjusting for tax, our PAT forecasts are N49.06bn, N54.49bn, N64.90bn, N76.44bn
and N89.10bn. PAT Margin for the period are 16.44%, 14.94%, 14.74%, 14.56% and
14.35%. Our forecast final dividend for the FY 2018 is N35.71 per share.
We expect Nestle to grow its turnover from N151.27bn in 2015 to N358.49bn in 2020.
We expect UPDC to grow its turnover from N10.95bn in 2014 to N14.86bn in 2018.
We estimate a final dividend for the FY 2018 is N35.71 per share.
We estimate a dividend per share of 60 Kobo for the FY 2014.
Equity Research Report
Nestle Nigeria Plc
FSDH Merchant Bank
19 FSDH Research 16 November 2018
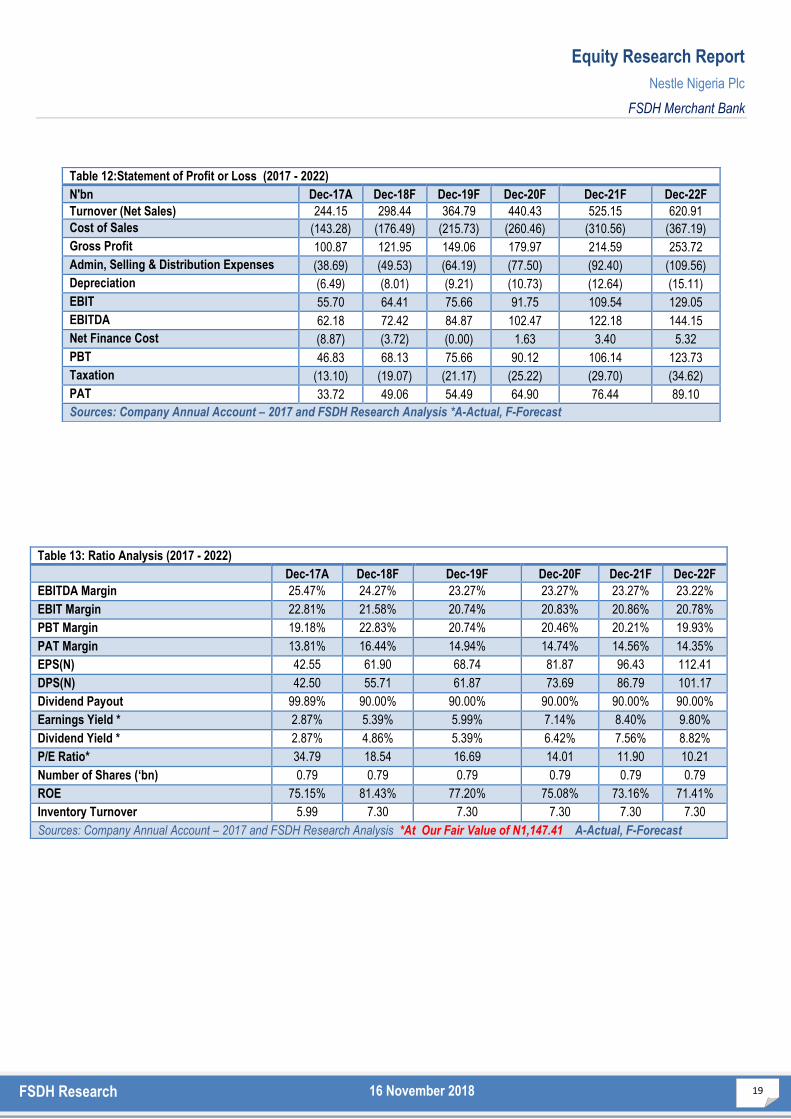
Table 12:Statement of Profit or Loss (2017 - 2022)
N'bn Dec-17A Dec-18F Dec-19F Dec-20F Dec-21F Dec-22F
Turnover (Net Sales) 244.15 298.44 364.79 440.43 525.15 620.91
Cost of Sales (143.28) (176.49) (215.73) (260.46) (310.56) (367.19)
Gross Profit 100.87 121.95 149.06 179.97 214.59 253.72
Admin, Selling & Distribution Expenses (38.69) (49.53) (64.19) (77.50) (92.40) (109.56)
Depreciation (6.49) (8.01) (9.21) (10.73) (12.64) (15.11)
EBIT 55.70 64.41 75.66 91.75 109.54 129.05
EBITDA 62.18 72.42 84.87 102.47 122.18 144.15
Net Finance Cost (8.87) (3.72) (0.00) 1.63 3.40 5.32
PBT 46.83 68.13 75.66 90.12 106.14 123.73
Taxation (13.10) (19.07) (21.17) (25.22) (29.70) (34.62)
PAT 33.72 49.06 54.49 64.90 76.44 89.10
Sources: Company Annual Account – 2017 and FSDH Research Analysis *A-Actual, F-Forecast
Table 13: Ratio Analysis (2017 - 2022)
Dec-17A Dec-18F Dec-19F Dec-20F Dec-21F Dec-22F
EBITDA Margin 25.47% 24.27% 23.27% 23.27% 23.27% 23.22%
EBIT Margin 22.81% 21.58% 20.74% 20.83% 20.86% 20.78%
PBT Margin 19.18% 22.83% 20.74% 20.46% 20.21% 19.93%
PAT Margin 13.81% 16.44% 14.94% 14.74% 14.56% 14.35%
EPS(N) 42.55 61.90 68.74 81.87 96.43 112.41
DPS(N) 42.50 55.71 61.87 73.69 86.79 101.17
Dividend Payout 99.89% 90.00% 90.00% 90.00% 90.00% 90.00%
Earnings Yield * 2.87% 5.39% 5.99% 7.14% 8.40% 9.80%
Dividend Yield * 2.87% 4.86% 5.39% 6.42% 7.56% 8.82%
P/E Ratio* 34.79 18.54 16.69 14.01 11.90 10.21
Number of Shares (‘bn) 0.79 0.79 0.79 0.79 0.79 0.79
ROE 75.15% 81.43% 77.20% 75.08% 73.16% 71.41%
Inventory Turnover 5.99 7.30 7.30 7.30 7.30 7.30
Sources: Company Annual Account – 2017 and FSDH Research Analysis *At Our Fair Value of N1,147.41 A-Actual, F-Forecast
Equity Research Report
Nestle Nigeria Plc
FSDH Merchant Bank
20 FSDH Research 16 November 2018
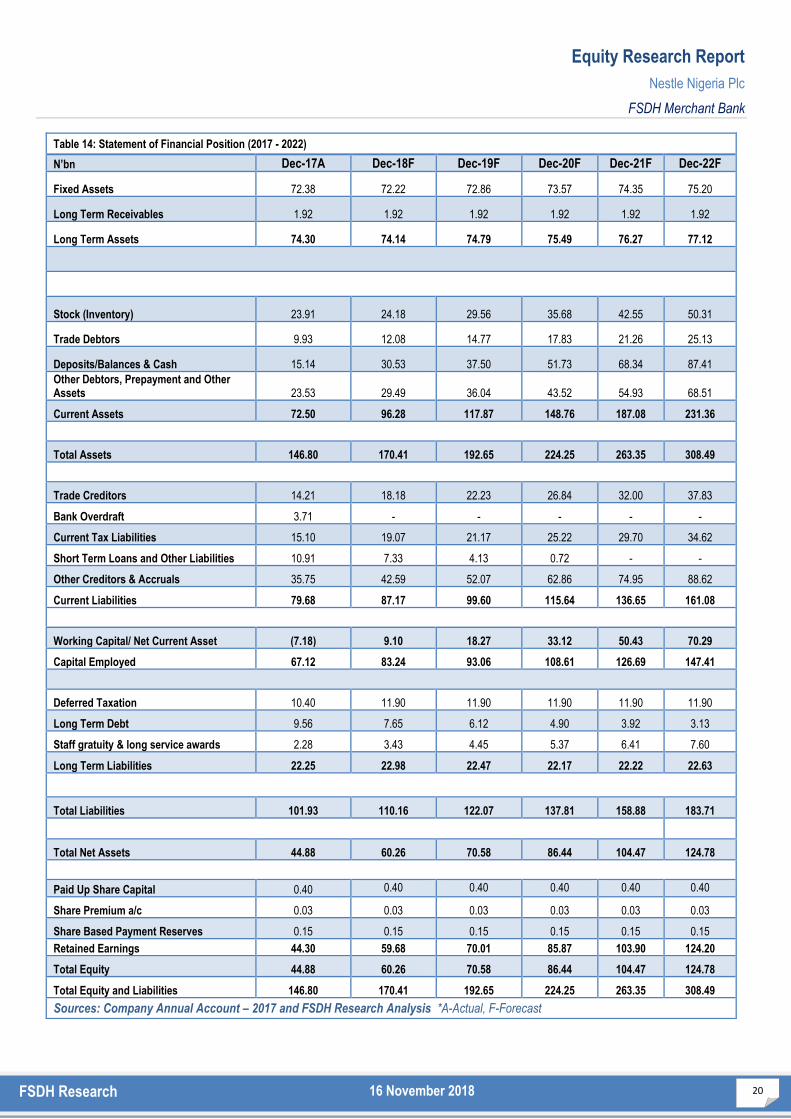
Table 14: Statement of Financial Position (2017 - 2022)
N’bn Dec-17A Dec-18F Dec-19F Dec-20F Dec-21F Dec-22F
Fixed Assets 72.38 72.22 72.86 73.57 74.35 75.20
Long Term Receivables 1.92 1.92 1.92 1.92 1.92 1.92
Long Term Assets 74.30 74.14 74.79 75.49 76.27 77.12
Stock (Inventory) 23.91 24.18 29.56 35.68 42.55 50.31
Trade Debtors 9.93 12.08 14.77 17.83 21.26 25.13
Deposits/Balances & Cash 15.14 30.53 37.50 51.73 68.34 87.41
Other Debtors, Prepayment and Other Assets 23.53 29.49 36.04 43.52 54.93 68.51
Current Assets 72.50 96.28 117.87 148.76 187.08 231.36
Total Assets 146.80 170.41 192.65 224.25 263.35 308.49
Trade Creditors 14.21 18.18 22.23 26.84 32.00 37.83
Bank Overdraft 3.71 - - - - -
Current Tax Liabilities 15.10 19.07 21.17 25.22 29.70 34.62
Short Term Loans and Other Liabilities 10.91 7.33 4.13 0.72 - -
Other Creditors & Accruals 35.75 42.59 52.07 62.86 74.95 88.62
Current Liabilities 79.68 87.17 99.60 115.64 136.65 161.08
Working Capital/ Net Current Asset (7.18) 9.10 18.27 33.12 50.43 70.29
Capital Employed 67.12 83.24 93.06 108.61 126.69 147.41
Deferred Taxation 10.40 11.90 11.90 11.90 11.90 11.90
Long Term Debt 9.56 7.65 6.12 4.90 3.92 3.13
Staff gratuity & long service awards 2.28 3.43 4.45 5.37 6.41 7.60
Long Term Liabilities 22.25 22.98 22.47 22.17 22.22 22.63
Total Liabilities 101.93 110.16 122.07 137.81 158.88 183.71
Total Net Assets 44.88 60.26 70.58 86.44 104.47 124.78
Paid Up Share Capital 0.40 0.40 0.40 0.40 0.40 0.40
Share Premium a/c 0.03 0.03 0.03 0.03 0.03 0.03
Share Based Payment Reserves 0.15 0.15 0.15 0.15 0.15 0.15
Retained Earnings 44.30 59.68 70.01 85.87 103.90 124.20
Total Equity 44.88 60.26 70.58 86.44 104.47 124.78
Total Equity and Liabilities 146.80 170.41 192.65 224.25 263.35 308.49
Sources: Company Annual Account – 2017 and FSDH Research Analysis *A-Actual, F-Forecast
Equity Research Report
Nestle Nigeria Plc
FSDH Merchant Bank
21 FSDH Research 16 November 2018
9.0 Valuation:
We employed a relative valuation method using Enterprise Value (EV) to Earnings
Before Interest Tax Depreciation and Amortization (EBITDA) multiple. The
assumptions and results of the valuation are:
Assumptions:
EV/EBITDA Multiple: 12.97x (Food Processing Multiple – Aswath
Damodaran)
Debt: N24.19bn
Cash: N15.14bn
Number of shares in issue: 792.66mn
Cost of Capital : 20%
Applying the EV/EBITDA multiple of 12.97x, we arrived at N1,147.41 per share as
our fair value.
The current market value of Nestle share is N1,480, the highest and the lowest
closing prices in the last 52 weeks are N1,615 and N1,250 respectively. The
forward earnings yield and dividend yield of the company at our fair value are 5.39%
and 4.86% respectively. The fair value of the stock is 22.47% lower than the current
market price. We therefore place a SELL rating on the shares of Nestle Nigeria Plc at
the price of N1,480 as of 16 November 2018. Our target price for the shares of Nestle
in the next one year is N1,250.
9.1 Risks to Price Target:
The following risks may affect the target price:
Increase in the yield on fixed income securities leading to portfolio
reallocation from the equity market
Drop in market liquidity
Our fair value for Nestle is N1,147.41.
The fair value for UPDC Plc is N15.39.
Equity Research Report
Nestle Nigeria Plc
FSDH Merchant Bank
22 FSDH Research 16 November 2018
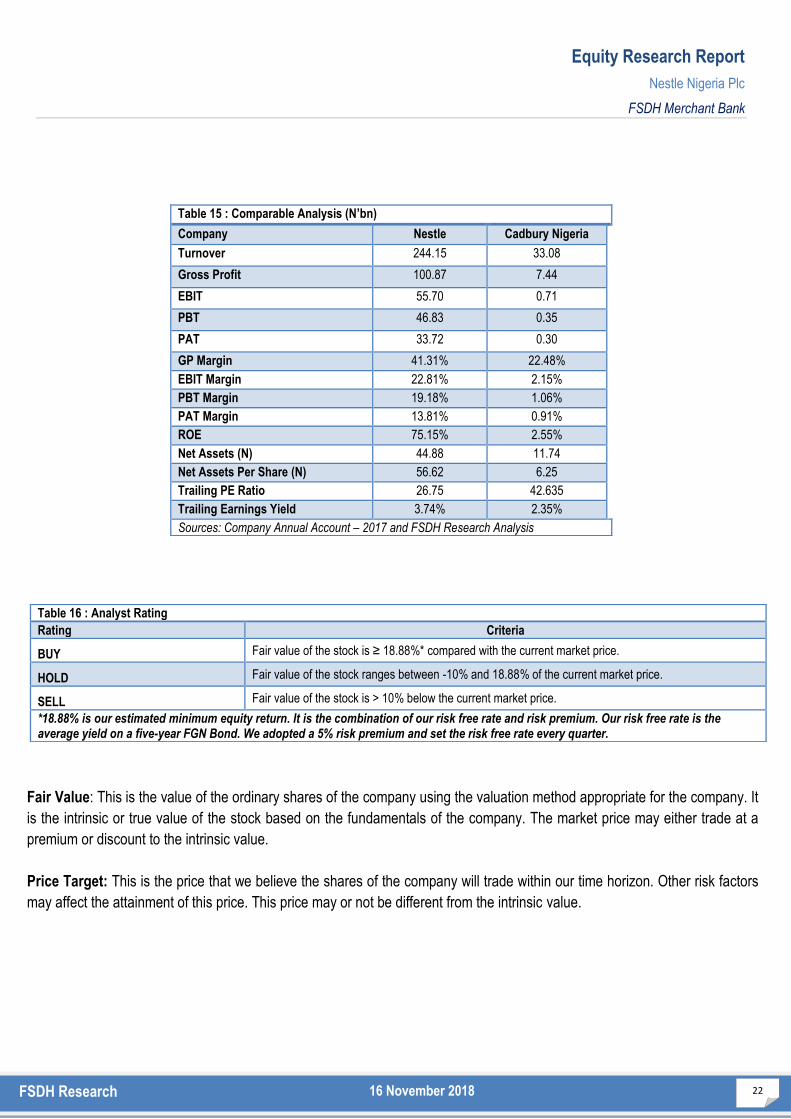
Table 15 : Comparable Analysis (N’bn)
Company Nestle Cadbury Nigeria
Turnover 244.15 33.08
Gross Profit 100.87 7.44
EBIT 55.70 0.71
PBT 46.83 0.35
PAT 33.72 0.30
GP Margin 41.31% 22.48%
EBIT Margin 22.81% 2.15%
PBT Margin 19.18% 1.06%
PAT Margin 13.81% 0.91%
ROE 75.15% 2.55%
Net Assets (N) 44.88 11.74
Net Assets Per Share (N) 56.62 6.25
Trailing PE Ratio 26.75 42.635
Trailing Earnings Yield 3.74% 2.35%
Sources: Company Annual Account – 2017 and FSDH Research Analysis
Table 16 : Analyst Rating
Rating Criteria
BUY Fair value of the stock is ≥ 18.88%* compared with the current market price.
HOLD Fair value of the stock ranges between -10% and 18.88% of the current market price.
SELL Fair value of the stock is > 10% below the current market price.
*18.88% is our estimated minimum equity return. It is the combination of our risk free rate and risk premium. Our risk free rate is the average yield on a five-year FGN Bond. We adopted a 5% risk premium and set the risk free rate every quarter.
Fair Value: This is the value of the ordinary shares of the company using the valuation method appropriate for the company. It
is the intrinsic or true value of the stock based on the fundamentals of the company. The market price may either trade at a
premium or discount to the intrinsic value.
Price Target: This is the price that we believe the shares of the company will trade within our time horizon. Other risk factors
may affect the attainment of this price. This price may or not be different from the intrinsic value.
Equity Research Report
Nestle Nigeria Plc
FSDH Merchant Bank
23 FSDH Research 16 November 2018
For enquiries please contact us at our offices: Lagos Office: 5th-8th floors UAC House, 1/5 Odunlami Street Lagos. Tel: 234-1-2702881-2 Port Harcourt Office: Mainstreet Bank Building, 2nd floor, 5 Trans Amadi Road, Port Harcourt. Tel: 234-802 408 1331. Abuja Office: Leadway House (Ground Floor), Plot 1061 Herbert Macaulay Way,
Central Business District, Abuja-Nigeria. Tel: 234-9-2918821
Website: www.fsdhgroup.com Email: [email protected] Our Reports and Prices are also Available on Bloomberg {FSDH<GO>}
Disclaimer Policy
This publication is produced by FSDH Merchant Bank Limited solely for the
information of users who are expected to make their own investment decisions without
undue reliance on any information or opinions contained herein. The opinions
contained in the report should not be interpreted as an offer to sell, or a solicitation of
any offer to buy any investment. FSDH Merchant Bank Limited may invest
substantially in securities of companies using information contained herein and may
also perform or seek to perform investment services for companies mentioned herein.
Whilst every care has been taken in preparing this document, no responsibility or
liability is accepted by any member of FSDH Merchant Bank Limited for actions taken
as a result of Information provided in this publication.


![Nestlé Nigeria - Cowryassetcowryasset.com/cowry_admin/reports_archives/reports[211].pdf · Nestle Nigeria Plc Posts Average FY 2018 Performance… Nestle Nigeria Plc (NESTLE _) recorded](https://img.dokumen.tips/doc/110x75/5e3411afeb10c4350f24992f/nestl-nigeria-211pdf-nestle-nigeria-plc-posts-average-fy-2018-performance.jpg)


