Embed Size (px)
Citation preview

NeedlesPowersCrosson
Principles of Accounting
12e
Costing Systems: Process Costing19
C H A P T E R
© human/iStockphoto

LEARNING OBJECTIVES
©2014 Cengage Learning. All Rights Reserved. May not be scanned, copied or duplicated, or posted to a publicly accessible website, in whole or in part.
LO1: Describe a process costing system. LO2: Relate the patterns of product flows to the
cost flow methods in a process costing environment, and explain the role of the Work in Process Inventory accounts.
LO3: Describe equivalent production, and compute equivalent units.
LO4: Prepare a process cost report using the FIFO costing method.
LO5: Prepare a process cost report using the average costing method.
LO6: Explain how managers use a process costing system to produce business results.

SECTION 1: CONCEPTS
©2014 Cengage Learning. All Rights Reserved. May not be scanned, copied or duplicated, or posted to a publicly accessible website, in whole or in part.
Cost measurement: accounting for an organization’s costs in quantifiable terms
Cost recognition: recording costs so that they can be matched with related revenues
Matching principle: recording transactions in the periods in which they occur, rather than in the periods in which cash is received or paid

Concepts Underlying the Process Costing System
A process costing system first measures the costs of direct materials, direct labor, and overhead for each process, department, or work cell and then assigns those costs to the products produced during a particular period.– Such a system is used for cost measurement by
companies that make large amounts of similar products or liquid products or that have continuous production runs of identical products.
– In this system, costs are measured and recognized by production processes, not by jobs.
©2014 Cengage Learning. All Rights Reserved. May not be scanned, copied or duplicated, or posted to a publicly accessible website, in whole or in part.

©2014 Cengage Learning. All Rights Reserved. May not be scanned, copied or duplicated, or posted to a publicly accessible website, in whole or in part.
SECTION 2: ACCOUNTING APPLICATIONS
Compute equivalent units Prepare a process cost report using the
FIFO costing method Prepare a process cost report using the
average costing method
©2014 Cengage Learning. All Rights Reserved. May not be scanned, copied or duplicated, or posted to a publicly accessible website, in whole or in part.
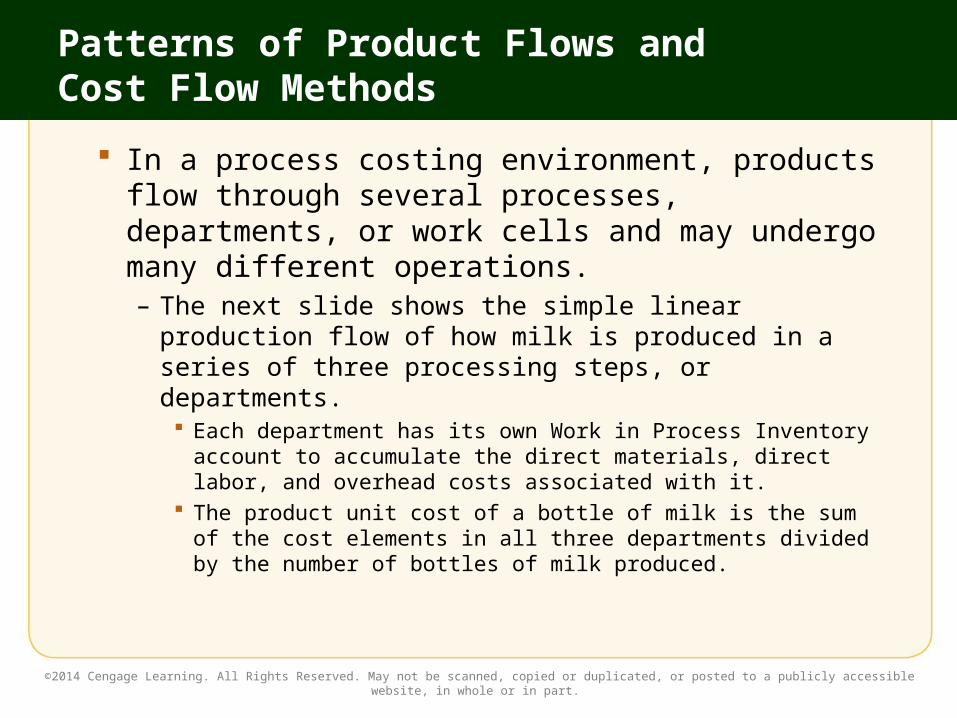
Patterns of Product Flows and Cost Flow Methods
In a process costing environment, products flow through several processes, departments, or work cells and may undergo many different operations.– The next slide shows the simple linear production
flow of how milk is produced in a series of three processing steps, or departments. Each department has its own Work in Process Inventory
account to accumulate the direct materials, direct labor, and overhead costs associated with it.
The product unit cost of a bottle of milk is the sum of the cost elements in all three departments divided by the number of bottles of milk produced.
©2014 Cengage Learning. All Rights Reserved. May not be scanned, copied or duplicated, or posted to a publicly accessible website, in whole or in part.
Product Flows in a Process Costing Environment
©2014 Cengage Learning. All Rights Reserved. May not be scanned, copied or duplicated, or posted to a publicly accessible website, in whole or in part.

Patterns of Product Flows and Cost Flow Methods (slide 1 of 2)
To measure and recognize product costs using process costing requires the preparation of a process cost report for each process, department, or work cell as product-related costs flow through the production process.
Managers assign these costs to the units that have been transferred out of the process and to the units that are still a part of the work in process, using a cost allocation method, such as the FIFO costing method or the average costing method.
©2014 Cengage Learning. All Rights Reserved. May not be scanned, copied or duplicated, or posted to a publicly accessible website, in whole or in part.
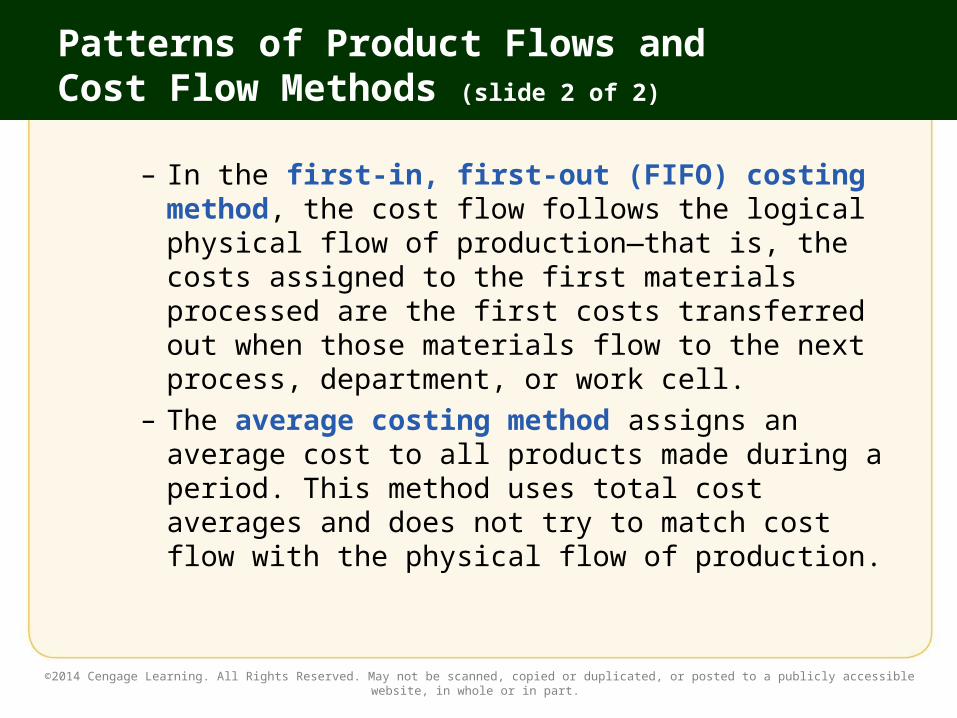
Patterns of Product Flows and Cost Flow Methods (slide 2 of 2)
– In the first-in, first-out (FIFO) costing method, the cost flow follows the logical physical flow of production—that is, the costs assigned to the first materials processed are the first costs transferred out when those materials flow to the next process, department, or work cell.
– The average costing method assigns an average cost to all products made during a period. This method uses total cost averages and does not try to match cost flow with the physical flow of production.
©2014 Cengage Learning. All Rights Reserved. May not be scanned, copied or duplicated, or posted to a publicly accessible website, in whole or in part.
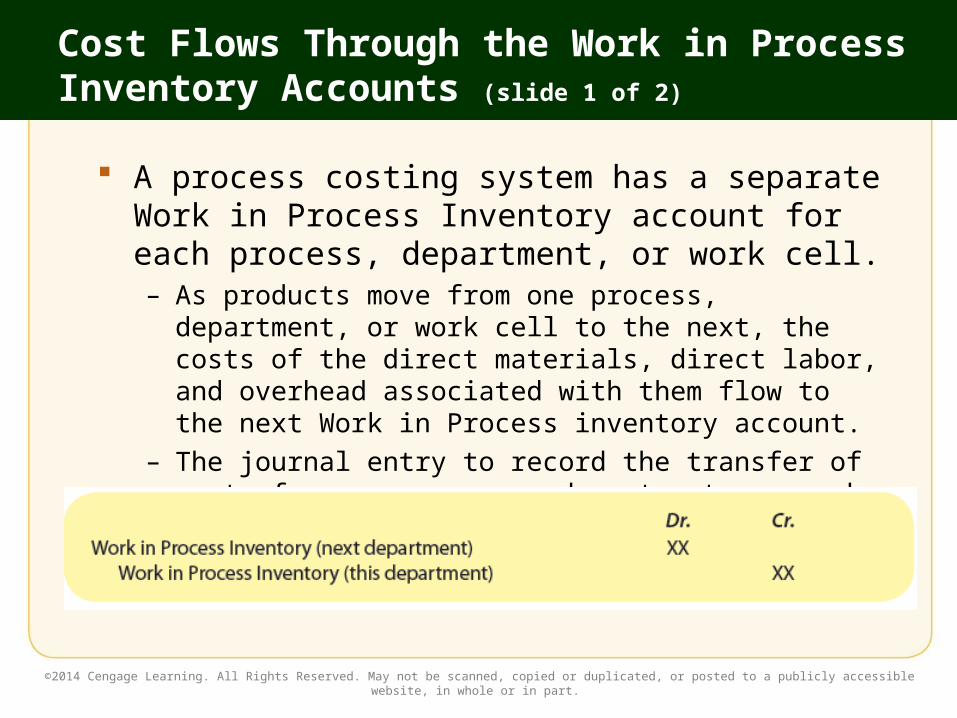
Cost Flows Through the Work in Process Inventory Accounts (slide 1 of 2)
A process costing system has a separate Work in Process Inventory account for each process, department, or work cell.– As products move from one process, department, or
work cell to the next, the costs of the direct materials, direct labor, and overhead associated with them flow to the next Work in Process inventory account.
– The journal entry to record the transfer of costs from one process, department, or work cell to another is:
©2014 Cengage Learning. All Rights Reserved. May not be scanned, copied or duplicated, or posted to a publicly accessible website, in whole or in part.

Cost Flows Through the Work in Process Inventory Accounts (slide 2 of 2)
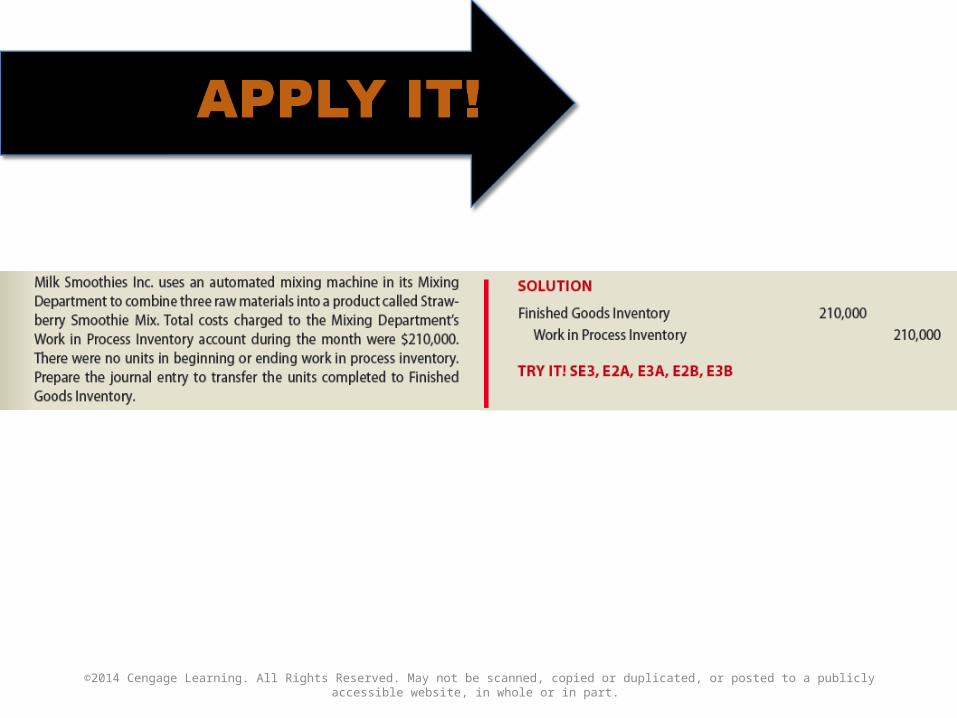
– Once the products are completed, packaged, and ready for sale, their costs are transferred to the Finished Goods Inventory account.
– The journal entry to record this transfer out of Work in Process Inventory into Finished Goods Inventory is:
©2014 Cengage Learning. All Rights Reserved. May not be scanned, copied or duplicated, or posted to a publicly accessible website, in whole or in part.
©2014 Cengage Learning. All Rights Reserved. May not be scanned, copied or duplicated, or posted to a publicly accessible website, in whole or in part.
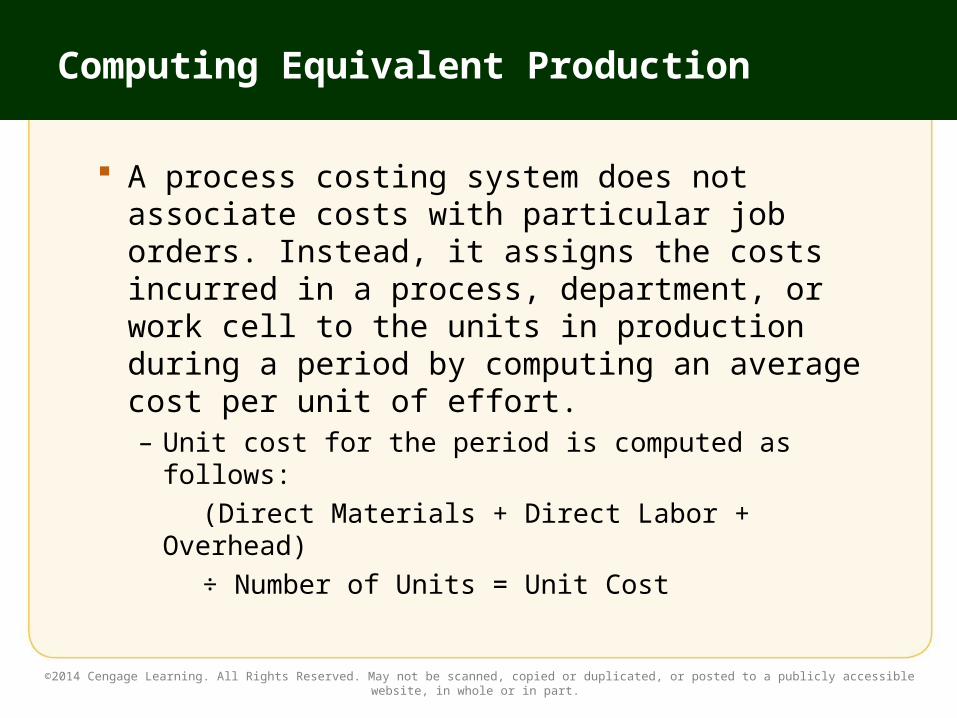
Computing Equivalent Production
A process costing system does not associate costs with particular job orders. Instead, it assigns the costs incurred in a process, department, or work cell to the units in production during a period by computing an average cost per unit of effort. – Unit cost for the period is computed as follows: (Direct Materials + Direct Labor + Overhead) ÷ Number of Units = Unit Cost
©2014 Cengage Learning. All Rights Reserved. May not be scanned, copied or duplicated, or posted to a publicly accessible website, in whole or in part.

Computing Equivalent Production
– Equivalent production (or equivalent units) applies a percentage-of-completion factor to partially completed units to calculate the equivalent number of whole units produced during a period for each type of input (direct materials, direct labor, and overhead). The number of equivalent units produced is (1) the sum of
total units started and completed during the period and (2) an amount representing the work done on partially completed products in both the beginning and ending work in process inventories.
The costs of direct labor and overhead are often incurred uniformly throughout the production process, so it is convenient to combine them when calculating equivalent units. These combined costs are called conversion costs (or processing costs).
©2014 Cengage Learning. All Rights Reserved. May not be scanned, copied or duplicated, or posted to a publicly accessible website, in whole or in part.
Computation of Equivalent Production
©2014 Cengage Learning. All Rights Reserved. May not be scanned, copied or duplicated, or posted to a publicly accessible website, in whole or in part.
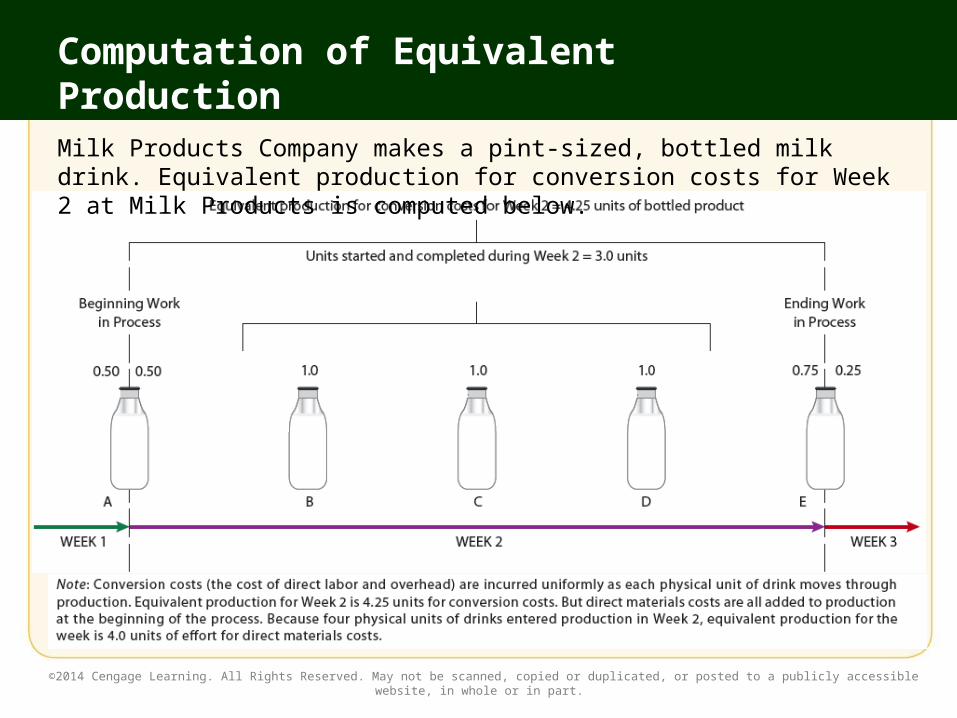
Milk Products Company makes a pint-sized, bottled milk drink. Equivalent production for conversion costs for Week 2 at Milk Products is computed below.

Equivalent Production for Direct Materials
At Milk Products, all direct materials are added at the beginning of production.– Thus, the unit that was half-completed at the
beginning of Week 2 had all its direct materials added during the previous week. No direct materials for this unit are included in the computation of Week 2’s equivalent units for the beginning inventory units.
– During Week 2, work began on four new units—the three units that were completed and the unit that was three-quarters completed at week’s end. Thus, the equivalent production for direct materials for Week 2 was 4.0 units.
©2014 Cengage Learning. All Rights Reserved. May not be scanned, copied or duplicated, or posted to a publicly accessible website, in whole or in part.
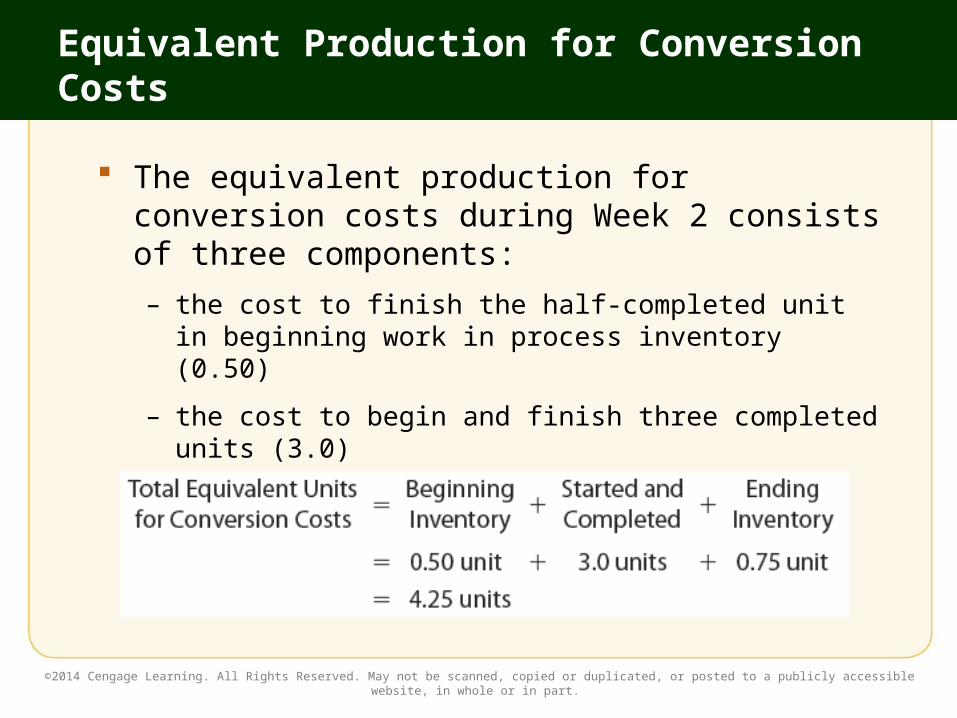
Equivalent Production for Conversion Costs
The equivalent production for conversion costs during Week 2 consists of three components:
– the cost to finish the half-completed unit in beginning work in process inventory (0.50)
– the cost to begin and finish three completed units (3.0)
– the cost to begin work on the three-quarters-completed unit in ending work in process inventory (0.75)
©2014 Cengage Learning. All Rights Reserved. May not be scanned, copied or duplicated, or posted to a publicly accessible website, in whole or in part.

Summary of Equivalent Production
©2014 Cengage Learning. All Rights Reserved. May not be scanned, copied or duplicated, or posted to a publicly accessible website, in whole or in part.
In reality, the number of partially completed drinks would likely be so great that it would be impractical for Milk Products to take a physical count of them. Instead, the company would estimate an average percentage of completion for all drinks in process.
©2014 Cengage Learning. All Rights Reserved. May not be scanned, copied or duplicated, or posted to a publicly accessible website, in whole or in part.

Preparing a Process Cost Report Using the FIFO Costing Method
In a process cost report that uses the FIFO costing method, the cost flow follows the logical physical flow of production.– As shown on the next two slides, the
preparation of a process cost report involves five steps. The first two steps account for the units of product
being processed. The next two steps account for the costs of the direct
materials, direct labor, and overhead being incurred. The final step assigns costs to products being
transferred out of the area and to those remaining behind in ending work in process inventory.
©2014 Cengage Learning. All Rights Reserved. May not be scanned, copied or duplicated, or posted to a publicly accessible website, in whole or in part.

Process Cost Report: FIFO Costing Method(slide 1 of 2)
©2014 Cengage Learning. All Rights Reserved. May not be scanned, copied or duplicated, or posted to a publicly accessible website, in whole or in part.
Process Cost Report: FIFO Costing Method(slide 2 of 2)
©2014 Cengage Learning. All Rights Reserved. May not be scanned, copied or duplicated, or posted to a publicly accessible website, in whole or in part.
Accounting for Units
Managers must account for the physical flow of products through their areas (Step 1) before they can compute equivalent production for the accounting period (Step 2). – Assume the following for Milk Products in February:
The beginning work in process inventory consists of 6,200 partially completed units (60 percent processed in the previous period).
During the period, the 6,200 units in beginning inventory were completed, and 57,500 units were started into production.
Of the 57,500 units started during the period, 52,500 units were completed. The other 5,000 units remain in work in process inventory and are 45 percent complete.
©2014 Cengage Learning. All Rights Reserved. May not be scanned, copied or duplicated, or posted to a publicly accessible website, in whole or in part.
Step 1: Account for Physical Units
In Step 1, Milk Product’s department manager computes the total units to be accounted for by adding the 6,200 units in beginning inventory to the 57,500 units started into production during this period.
Step 1 continues accounting for physical units. The 6,200 units in beginning inventory that were completed during the period, the 52,500 units that were started and finished in the period, and the 5,000 units remaining in the department at the end of the period are summed, and the total is listed as “units accounted for.” (Note that “units accounted for” must equal the “units to be accounted for” in Step 1.)
©2014 Cengage Learning. All Rights Reserved. May not be scanned, copied or duplicated, or posted to a publicly accessible website, in whole or in part.

Step 2: Account for Equivalent Units(slide 1 of 2)
Beginning Inventory– Because all direct materials are added at the beginning of the
production process, the 6,200 partially completed units that began February as work in process were already 100 percent complete in regard to direct materials.
– They were 60 percent complete in regard to conversion costs on February 1. The remaining 40 percent of their conversion costs were incurred during the month. Thus, the current equivalent production for their conversion costs is 2,480 (6,200 units X 40%).
Units Started and Completed During the Period– All the costs of the 52,500 units started and completed during
February were incurred during this period. Thus, the full amount of 52,500 is entered as equivalent units for both direct materials costs and conversion costs.
©2014 Cengage Learning. All Rights Reserved. May not be scanned, copied or duplicated, or posted to a publicly accessible website, in whole or in part.

Step 2: Account for Equivalent Units(slide 2 of 2)
Ending Inventory– Because the materials for the 5,000 drinks still in process at
the end of February were added when the drinks went into production during the month, the full amount of 5,000 is entered as the equivalent units for direct materials costs.
– However, these drinks are only 45 percent complete in terms of conversion costs. Thus, the equivalent production for their conversion costs is 2,250 (5,000 units X 45%).
Totals– Step 2 is completed by summing all the physical units to be
accounted for (63,700), all equivalent units for direct materials costs (57,500), and all equivalent units for conversion costs (57,230).
©2014 Cengage Learning. All Rights Reserved. May not be scanned, copied or duplicated, or posted to a publicly accessible website, in whole or in part.
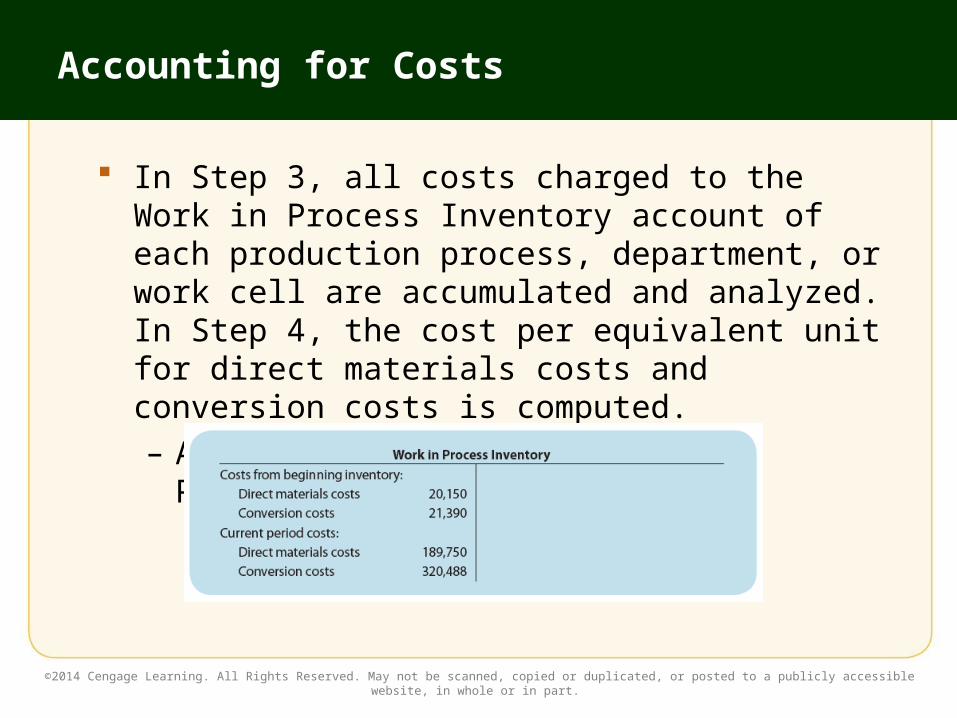
Accounting for Costs
In Step 3, all costs charged to the Work in Process Inventory account of each production process, department, or work cell are accumulated and analyzed. In Step 4, the cost per equivalent unit for direct materials costs and conversion costs is computed.– Assume the following for Milk Products in
February:
©2014 Cengage Learning. All Rights Reserved. May not be scanned, copied or duplicated, or posted to a publicly accessible website, in whole or in part.

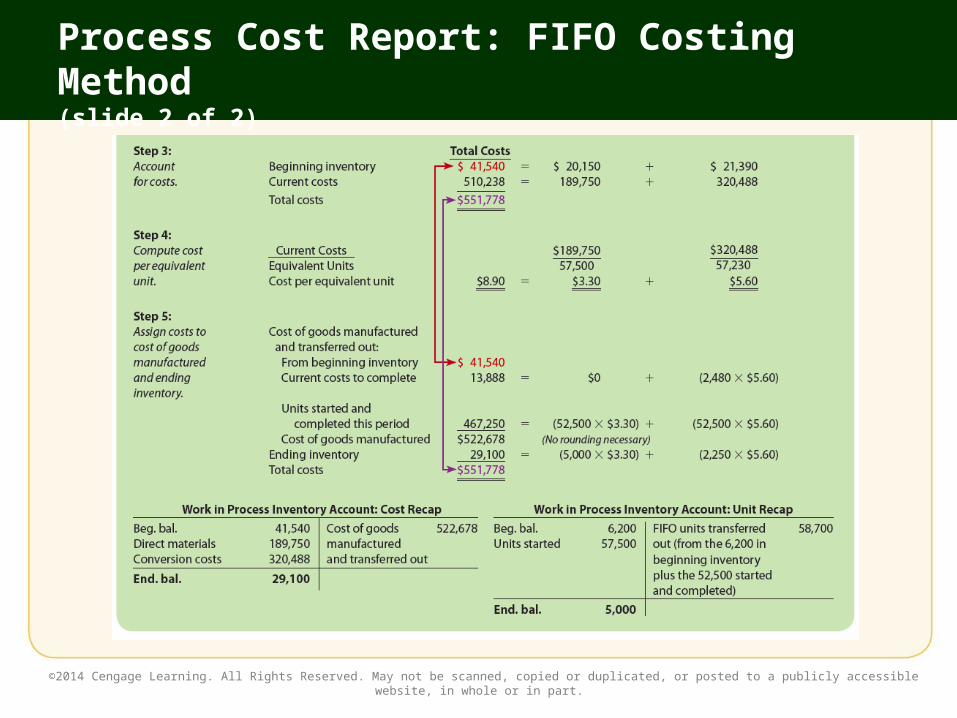
Step 3: Account for Costs
All costs for the period are accumulated in the Total Costs column.
©2014 Cengage Learning. All Rights Reserved. May not be scanned, copied or duplicated, or posted to a publicly accessible website, in whole or in part.
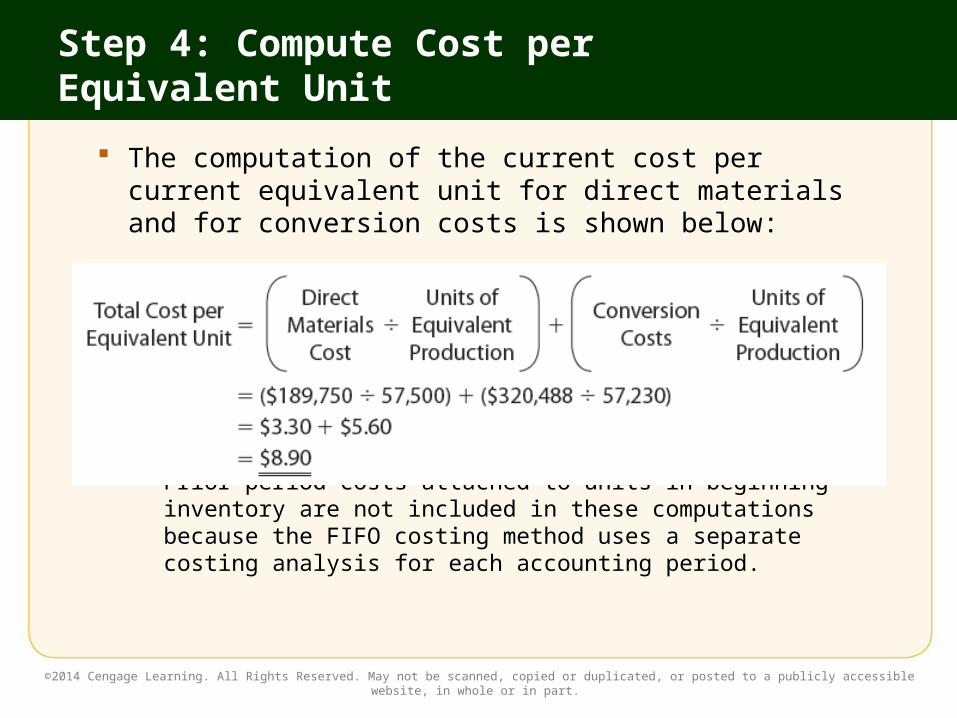
Step 4: Compute Cost per Equivalent Unit
The computation of the current cost per current equivalent unit for direct materials and for conversion costs is shown below:
– Note that the equivalent units are taken from Step 2. Prior period costs attached to units in beginning inventory are not included in these computations because the FIFO costing method uses a separate costing analysis for each accounting period.
©2014 Cengage Learning. All Rights Reserved. May not be scanned, copied or duplicated, or posted to a publicly accessible website, in whole or in part.
Assigning Costs
The final step is to recognize the costs that are transferred out either to the next production process, department, or work cell or to the Finished Goods Inventory account (the cost of goods manufactured), as well as the costs that remain in the Work in Process Inventory account.
©2014 Cengage Learning. All Rights Reserved. May not be scanned, copied or duplicated, or posted to a publicly accessible website, in whole or in part.
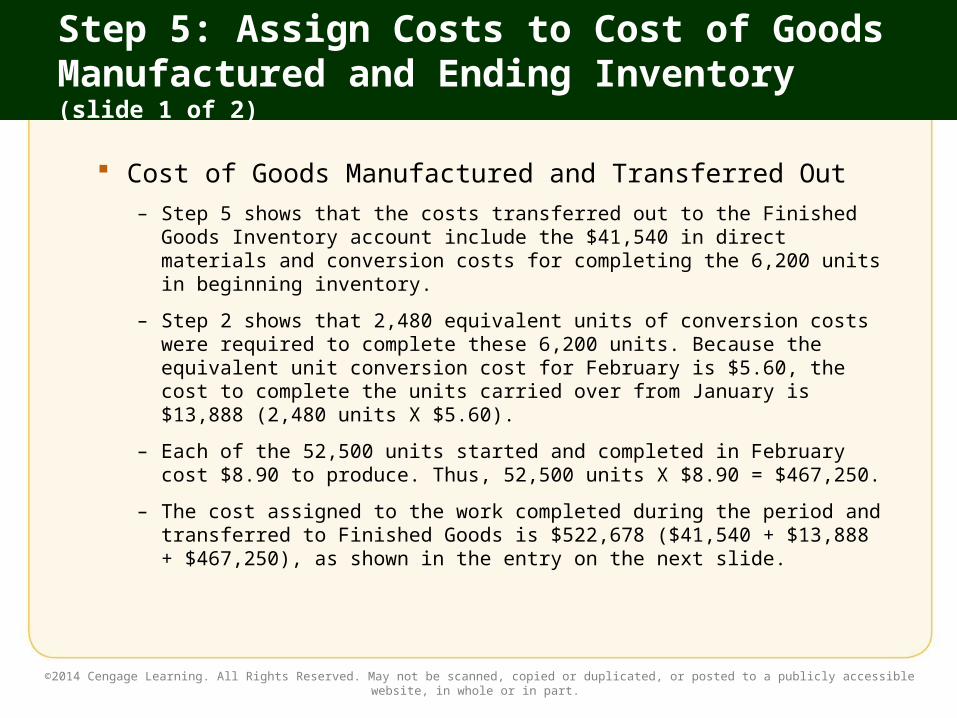
Step 5: Assign Costs to Cost of Goods Manufactured and Ending Inventory (slide 1 of 2)
Cost of Goods Manufactured and Transferred Out– Step 5 shows that the costs transferred out to the Finished
Goods Inventory account include the $41,540 in direct materials and conversion costs for completing the 6,200 units in beginning inventory.
– Step 2 shows that 2,480 equivalent units of conversion costs were required to complete these 6,200 units. Because the equivalent unit conversion cost for February is $5.60, the cost to complete the units carried over from January is $13,888 (2,480 units X $5.60).
– Each of the 52,500 units started and completed in February cost $8.90 to produce. Thus, 52,500 units X $8.90 = $467,250.
– The cost assigned to the work completed during the period and transferred to Finished Goods is $522,678 ($41,540 + $13,888 + $467,250), as shown in the entry on the next slide.
©2014 Cengage Learning. All Rights Reserved. May not be scanned, copied or duplicated, or posted to a publicly accessible website, in whole or in part.
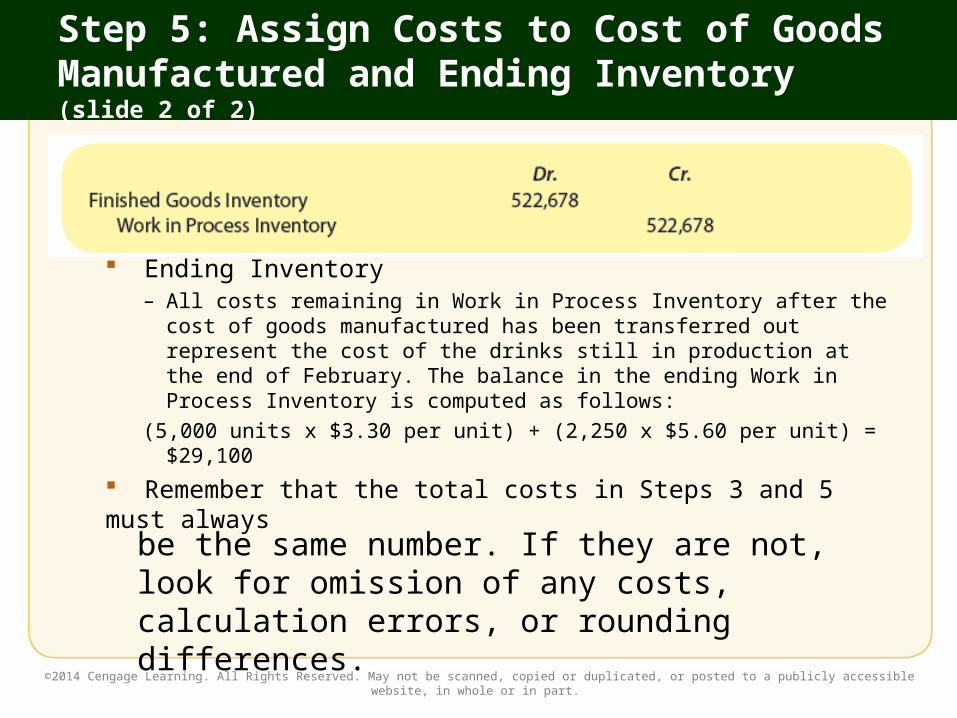
Step 5: Assign Costs to Cost of Goods Manufactured and Ending Inventory (slide 2 of 2)
Ending Inventory– All costs remaining in Work in Process Inventory after the cost of
goods manufactured has been transferred out represent the cost of the drinks still in production at the end of February. The balance in the ending Work in Process Inventory is computed as follows:
(5,000 units x $3.30 per unit) + (2,250 x $5.60 per unit) = $29,100
Remember that the total costs in Steps 3 and 5 must always
©2014 Cengage Learning. All Rights Reserved. May not be scanned, copied or duplicated, or posted to a publicly accessible website, in whole or in part.
be the same number. If they are not, look for omission of any costs, calculation errors, or rounding differences.

Recap of Work in Process Inventory Account
When the process cost report is complete, an account recap will show the effects of the report on the Work in Process Inventory account for the period.
Two recaps of Milk Products’ Work in Process Inventory account for February—one for costs and one for units—appear at the end of the process cost report.
©2014 Cengage Learning. All Rights Reserved. May not be scanned, copied or duplicated, or posted to a publicly accessible website, in whole or in part.

Process Costing for Two or More Production Departments
A company that has more than one production process or department must have a Work in Process Inventory account for each process or department.– When products flow from the first department to the
second department, their costs flow from the first department’s Work in Process Inventory account to the second department’s Work in Process Inventory account.
– The costs transferred into the second department’s Work in Process Inventory account are treated in the same way as the cost of direct materials added at the beginning of the production process.
– At the end of the period, a separate process cost report is prepared for each department.
©2014 Cengage Learning. All Rights Reserved. May not be scanned, copied or duplicated, or posted to a publicly accessible website, in whole or in part.

©2014 Cengage Learning. All Rights Reserved. May not be scanned, copied or duplicated, or posted to a publicly accessible website, in whole or in part.
(slide 1 of 3)
©2014 Cengage Learning. All Rights Reserved. May not be scanned, copied or duplicated, or posted to a publicly accessible website, in whole or in part.
(slide 2 of 3)

©2014 Cengage Learning. All Rights Reserved. May not be scanned, copied or duplicated, or posted to a publicly accessible website, in whole or in part.
(slide 3 of 3)

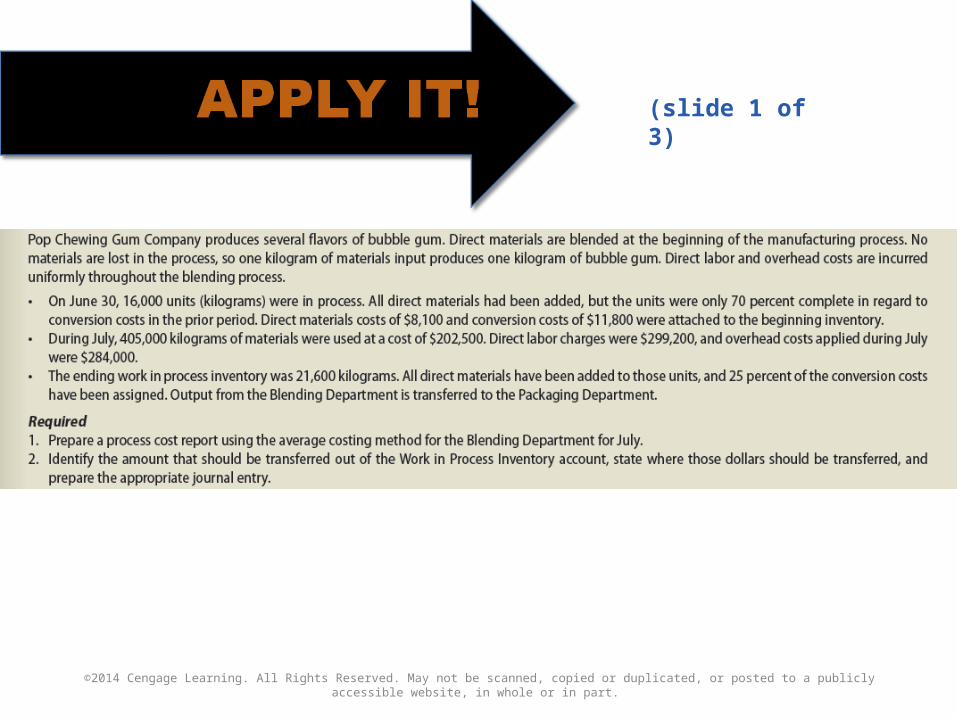
Preparing a Process Cost Report Using the Average Costing Method
When a process cost report uses the average costing method, as shown on the next two slides, cost flows do not follow the logical physical flow of production as they do with the FIFO method.
Instead, the costs in beginning inventory are combined with current period costs to compute an average product unit cost.
Preparing a process cost report using the average costing method includes the same five steps as using the FIFO method, but the procedures for completing the steps differ.
©2014 Cengage Learning. All Rights Reserved. May not be scanned, copied or duplicated, or posted to a publicly accessible website, in whole or in part.
Process Cost Report: Average Costing Method(slide 1 of 2)
©2014 Cengage Learning. All Rights Reserved. May not be scanned, copied or duplicated, or posted to a publicly accessible website, in whole or in part.

Process Cost Report: Average Costing Method(slide 2 of 2)
©2014 Cengage Learning. All Rights Reserved. May not be scanned, copied or duplicated, or posted to a publicly accessible website, in whole or in part.

Accounting for Units
The process cost report accounts for the physical units in a production process, department, or work cell during a period.
Managers must account for the physical flow of products through their areas (Step 1) before they can compute equivalent production for the accounting period (Step 2).
©2014 Cengage Learning. All Rights Reserved. May not be scanned, copied or duplicated, or posted to a publicly accessible website, in whole or in part.

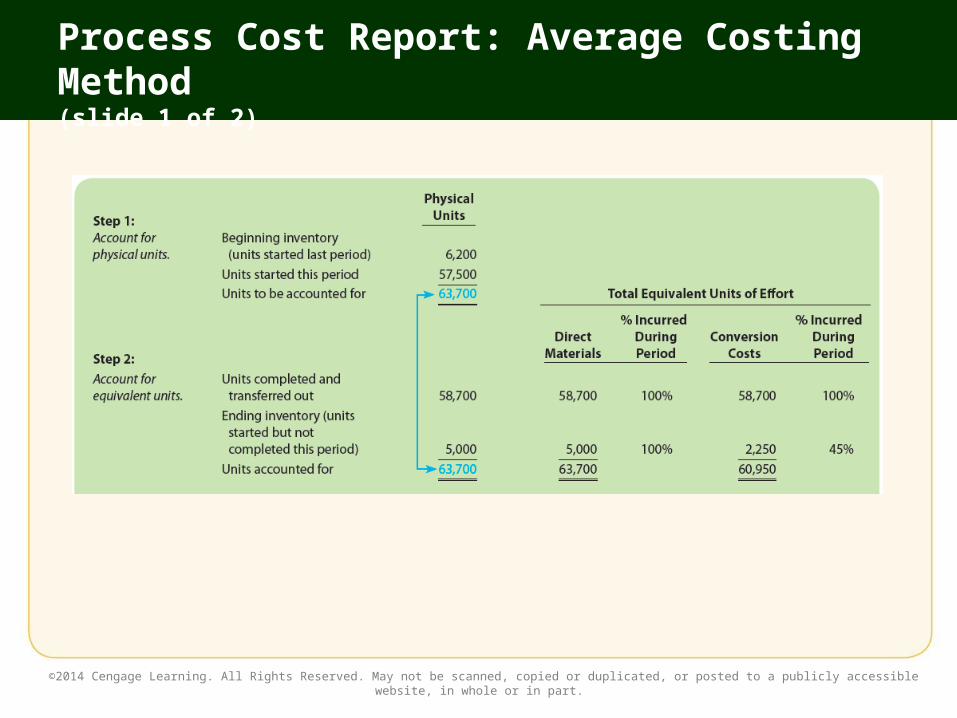
Step 1: Account for Physical Units
Step 1 of a process cost report accounts for the physical units in a production process, department, or work cell during a period.
Units to be accounted for equals the physical units in beginning inventory plus the physical units started during the period.
In Step 1, Milk Products’ department manager computes the total units to be accounted for as follows:
6,200 units + 57,500 units = 63,700 units
©2014 Cengage Learning. All Rights Reserved. May not be scanned, copied or duplicated, or posted to a publicly accessible website, in whole or in part.

Step 2: Account for Equivalent Units (slide 1 of 2)
Units Completed and Transferred Out– The average costing method treats both the direct materials
costs and the conversion costs of the 58,700 units completed in February (6,200 units from beginning inventory + 52,500 started this period) as if they were incurred in the current period. Thus, the full amount of 58,700 is entered as the equivalent units for these costs.
Ending Inventory– Because all direct materials are added at the beginning of
the production process, the full amount of 5,000 is entered as the equivalent units for direct materials costs.
– Because the 5,000 units in ending inventory are only 45 percent complete in terms of conversion costs, the amount of equivalent units is computed as follows: 5,000 units x 45% = 2,250 units
©2014 Cengage Learning. All Rights Reserved. May not be scanned, copied or duplicated, or posted to a publicly accessible website, in whole or in part.
Step 2: Account for Equivalent Units (slide 2 of 2)
Totals– When the average costing method is used,
Step 2 in a process cost report is completed by summing all the physical units to be accounted for, all equivalent units for direct materials costs, and all equivalent units for conversion costs.
– Milk Products accounted for 63,700 physical units. Equivalent units for direct materials costs totaled 63,700, and equivalent units for conversion cots totaled 60,950.
©2014 Cengage Learning. All Rights Reserved. May not be scanned, copied or duplicated, or posted to a publicly accessible website, in whole or in part.

Accounting for Costs
Step 3 of the report accumulates and analyzes all costs in the Work in Process Inventory account, and Step 4 computes the cost per equivalent unit for direct materials costs and conversion costs.
The costs of Milk Products’ beginning inventory were $20,150 for direct materials and $21,390 for conversion. Current period costs were $189,750 for direct materials and $320,488 for conversion.
©2014 Cengage Learning. All Rights Reserved. May not be scanned, copied or duplicated, or posted to a publicly accessible website, in whole or in part.
Step 3: Account for Costs
All direct materials costs and conversion costs for beginning inventory and the current period are accumulated in the Total Costs column.
The total of $551,778 consists of $209,900 in direct materials costs and $341,878 in conversion costs.
©2014 Cengage Learning. All Rights Reserved. May not be scanned, copied or duplicated, or posted to a publicly accessible website, in whole or in part.

Step 4: Compute Cost per Equivalent Unit
Step 4 computes the cost per equivalent unit as follows:
– Notice that the cost per equivalent unit for both direct materials and conversion costs has been rounded to the nearest cent.
– Notice also that the average costing and FIFO costing methods use different numerators and denominators in Step 4. Average costing divides total cost by total equivalent units, whereas FIFO divides current costs by current equivalent units.
©2014 Cengage Learning. All Rights Reserved. May not be scanned, copied or duplicated, or posted to a publicly accessible website, in whole or in part.

Assigning Costs
The final step is to recognize the costs that are transferred out either to the next production process, department, or work cell or to the Finished Goods Inventory account (the cost of goods manufactured), as well as the costs that remain in the Work in Process Inventory account.
©2014 Cengage Learning. All Rights Reserved. May not be scanned, copied or duplicated, or posted to a publicly accessible website, in whole or in part.

Step 5: Assign Costs to Cost of Goods Manufactured and Ending Inventory (slide 1 of 2)
Cost of Goods Manufactured and Transferred Out– The costs of the units completed and transferred out are
assigned by multiplying the equivalent units for direct materials and conversion costs (accounted for in Step 2) by their respective cost per equivalent unit (computed in Step 4) and then totaling these assigned values.
– Because the costs per equivalent unit were rounded in Step 4, a rounding difference of $362 has been deducted from the total cost. The $522,655 of transferred costs will go to the Finished Goods Inventory account, since the goods are ready for sale. The resulting entry is shown on the next slide.
©2014 Cengage Learning. All Rights Reserved. May not be scanned, copied or duplicated, or posted to a publicly accessible website, in whole or in part.
Step 5: Assign Costs to Cost of Goods Manufactured and Ending Inventory (slide 2 of 2)
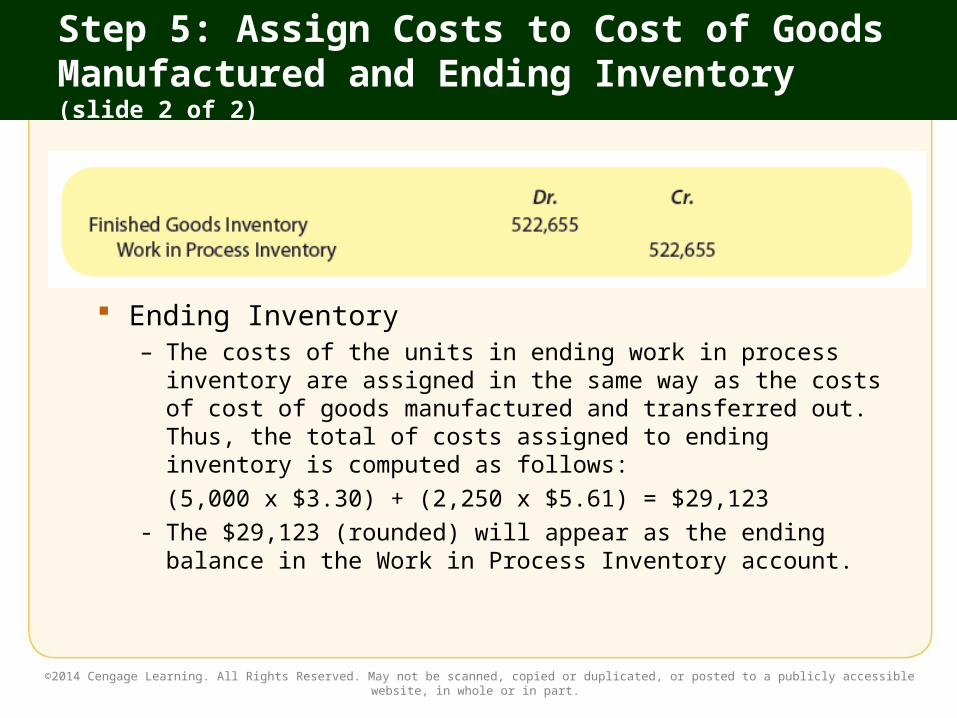
Ending Inventory– The costs of the units in ending work in process
inventory are assigned in the same way as the costs of cost of goods manufactured and transferred out. Thus, the total of costs assigned to ending inventory is computed as follows:(5,000 x $3.30) + (2,250 x $5.61) = $29,123
- The $29,123 (rounded) will appear as the ending balance in the Work in Process Inventory account.
©2014 Cengage Learning. All Rights Reserved. May not be scanned, copied or duplicated, or posted to a publicly accessible website, in whole or in part.
©2014 Cengage Learning. All Rights Reserved. May not be scanned, copied or duplicated, or posted to a publicly accessible website, in whole or in part.
(slide 1 of 3)

©2014 Cengage Learning. All Rights Reserved. May not be scanned, copied or duplicated, or posted to a publicly accessible website, in whole or in part.
(slide 2 of 3)

©2014 Cengage Learning. All Rights Reserved. May not be scanned, copied or duplicated, or posted to a publicly accessible website, in whole or in part.
(slide 3 of 3)

SECTION 3: BUSINESS APPLICATIONS
Planning Performing Evaluating Communicating
©2014 Cengage Learning. All Rights Reserved. May not be scanned, copied or duplicated, or posted to a publicly accessible website, in whole or in part.

The Management Process and the Process Costing System (slide 1 of 2)
Managers use process costing information in every stage of the management process:– Planning: Managers use information about past and
projected product costing and customer preferences to decide what a product should cost. After they have determined a target number of units to be sold, all product-related costs for that targeted number of units can be computed and used in the budget.
– Performing: During the period, managers control costs by tracking product and cost flows through their departments or processes and prepare process cost reports to assign production costs to the products.
©2014 Cengage Learning. All Rights Reserved. May not be scanned, copied or duplicated, or posted to a publicly accessible website, in whole or in part.

The Management Process and the Process Costing System (slide 2 of 2)
– Evaluating: Managers evaluate performance by comparing targeted costs with actual costs. If costs have exceeded expectations, managers analyze why this has occurred and adjust their planning and decision-making strategies.
– Communicating: Managers use actual units and costs to value inventory on the balance sheet and cost of goods sold on the income statement. Managers are also interested in whether goals for product costs are being achieved.
– The ways managers use process costing throughout the management process are summarized on the next slide.
©2014 Cengage Learning. All Rights Reserved. May not be scanned, copied or duplicated, or posted to a publicly accessible website, in whole or in part.

The Management Process and the Process Costing System
©2014 Cengage Learning. All Rights Reserved. May not be scanned, copied or duplicated, or posted to a publicly accessible website, in whole or in part.

©2014 Cengage Learning. All Rights Reserved. May not be scanned, copied or duplicated, or posted to a publicly accessible website, in whole or in part.


![Law in transition 2015 [Publications] · 2021. 1. 17. · Marianna Raszkowska/iStockphoto Eskaylim/iStockphoto Sensay/iStockphoto Rob Bouwman/Getty Images Gautier Willaume/ Getty](https://img.dokumen.tips/doc/110x75/60ad87a1a5f5d569644635b2/law-in-transition-2015-publications-2021-1-17-marianna-raszkowskaistockphoto.jpg)