Embed Size (px)
Citation preview
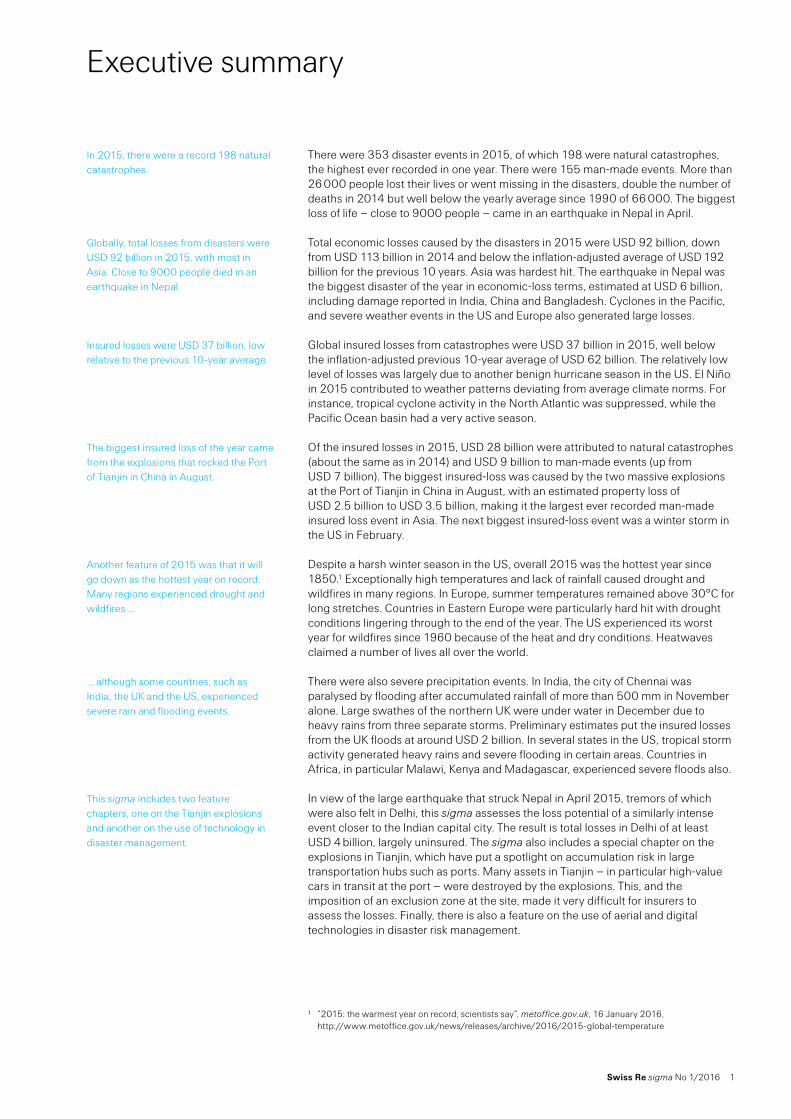
No 1 /2016
Natural catastrophes and man-made disasters in 2015: Asia suffers substantial losses
01 Executive summary
02 Catastrophes in 2015: global overview
07 Regional overview
13 Tianjin: a puzzle of risk accumulation and coverage terms
17 Leveraging technology in disaster management
21 Tables for reporting year 2015
43 Terms and selection criteria

Swiss Re sigma No 1/2016 1
Executive summary
There were 353 disaster events in 2015, of which 198 were natural catastrophes, the highest ever recorded in one year. There were 155 man-made events. More than 26 000 people lost their lives or went missing in the disasters, double the number of deaths in 2014 but well below the yearly average since 1990 of 66 000. The biggest loss of life – close to 9000 people – came in an earthquake in Nepal in April.
Total economic losses caused by the disasters in 2015 were USD 92 billion, down from USD 113 billion in 2014 and below the inflation-adjusted average of USD 192 billion for the previous 10 years. Asia was hardest hit. The earthquake in Nepal was the biggest disaster of the year in economic-loss terms, estimated at USD 6 billion, including damage reported in India, China and Bangladesh. Cyclones in the Pacific, and severe weather events in the US and Europe also generated large losses.
Global insured losses from catastrophes were USD 37 billion in 2015, well below the inflation-adjusted previous 10-year average of USD 62 billion. The relatively low level of losses was largely due to another benign hurricane season in the US. El Niño in 2015 contributed to weather patterns deviating from average climate norms. For instance, tropical cyclone activity in the North Atlantic was suppressed, while the Pacific Ocean basin had a very active season.
Of the insured losses in 2015, USD 28 billion were attributed to natural catastrophes (about the same as in 2014) and USD 9 billion to man-made events (up from USD 7 billion). The biggest insured-loss was caused by the two massive explosions at the Port of Tianjin in China in August, with an estimated property loss of USD 2.5 billion to USD 3.5 billion, making it the largest ever recorded man-made insured loss event in Asia. The next biggest insured-loss event was a winter storm in the US in February.
Despite a harsh winter season in the US, overall 2015 was the hottest year since 1850.1 Exceptionally high temperatures and lack of rainfall caused drought and wildfires in many regions. In Europe, summer temperatures remained above 30°C for long stretches. Countries in Eastern Europe were particularly hard hit with drought conditions lingering through to the end of the year. The US experienced its worst year for wildfires since 1960 because of the heat and dry conditions. Heatwaves claimed a number of lives all over the world.
There were also severe precipitation events. In India, the city of Chennai was paralysed by flooding after accumulated rainfall of more than 500 mm in November alone. Large swathes of the northern UK were under water in December due to heavy rains from three separate storms. Preliminary estimates put the insured losses from the UK floods at around USD 2 billion. In several states in the US, tropical storm activity generated heavy rains and severe flooding in certain areas. Countries in Africa, in particular Malawi, Kenya and Madagascar, experienced severe floods also.
In view of the large earthquake that struck Nepal in April 2015, tremors of which were also felt in Delhi, this sigma assesses the loss potential of a similarly intense event closer to the Indian capital city. The result is total losses in Delhi of at least USD 4 billion, largely uninsured. The sigma also includes a special chapter on the explosions in Tianjin, which have put a spotlight on accumulation risk in large transportation hubs such as ports. Many assets in Tianjin – in particular high-value cars in transit at the port – were destroyed by the explosions. This, and the imposition of an exclusion zone at the site, made it very difficult for insurers to assess the losses. Finally, there is also a feature on the use of aerial and digital technologies in disaster risk management.
1 “2015: the warmest year on record, scientists say”, metoffice.gov.uk, 16 January 2016, http://www.metoffice.gov.uk/news/releases/archive/2016/2015-global-temperature
In 2015, there were a record 198 natural catastrophes.
Globally, total losses from disasters were USD 92 billion in 2015, with most in Asia. Close to 9000 people died in an earthquake in Nepal.
Insured losses were USD 37 billion, low relative to the previous 10-year average.
The biggest insured loss of the year came from the explosions that rocked the Port of Tianjin in China in August.
Another feature of 2015 was that it will go down as the hottest year on record. Many regions experienced drought and wildfires …
… although some countries, such as India, the UK and the US, experienced severe rain and flooding events.
This sigma includes two feature chapters, one on the Tianjin explosions and another on the use of technology in disaster management.
2 Swiss Re sigma No 1/2016
Catastrophes in 2015: global overview
Number of events: 353
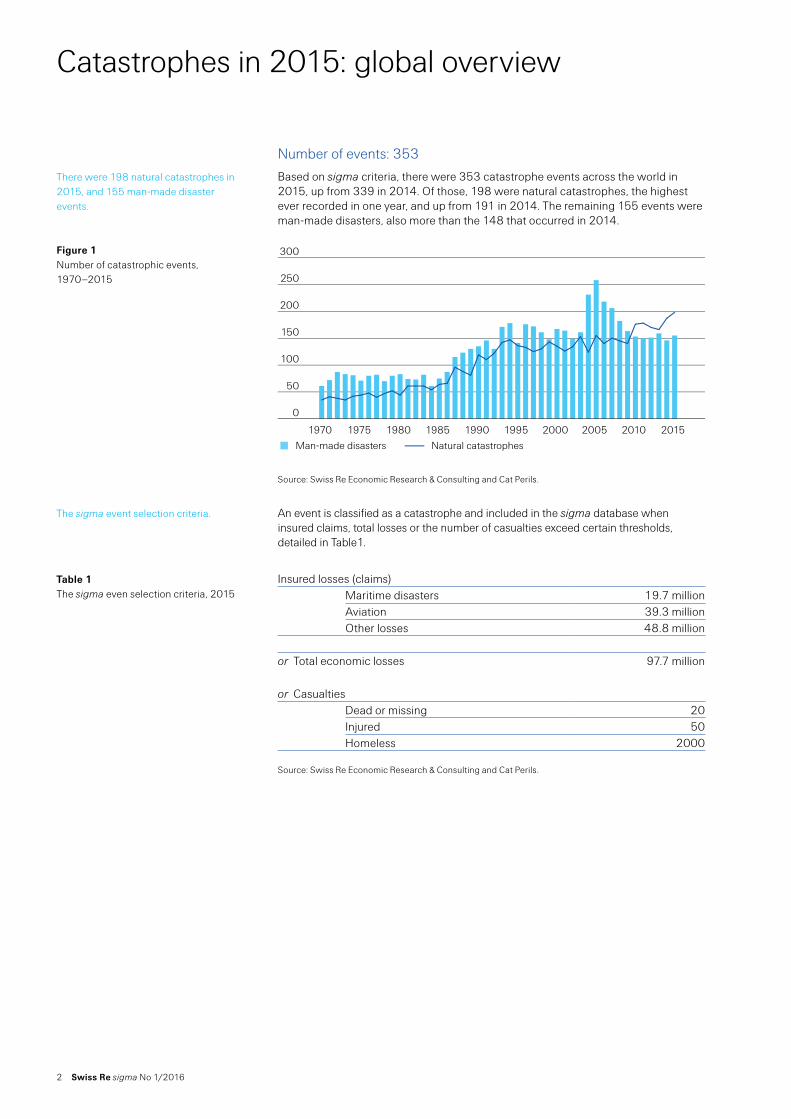
Based on sigma criteria, there were 353 catastrophe events across the world in 2015, up from 339 in 2014. Of those, 198 were natural catastrophes, the highest ever recorded in one year, and up from 191 in 2014. The remaining 155 events were man-made disasters, also more than the 148 that occurred in 2014.
Source: Swiss Re Economic Research & Consulting and Cat Perils.
An event is classified as a catastrophe and included in the sigma database when insured claims, total losses or the number of casualties exceed certain thresholds, detailed in Table1.
Insured losses (claims)Maritime disasters 19.7 millionAviation 39.3 millionOther losses 48.8 million
or Total economic losses 97.7 million
or CasualtiesDead or missing 20Injured 50Homeless 2000
Source: Swiss Re Economic Research & Consulting and Cat Perils.
There were 198 natural catastrophes in 2015, and 155 man-made disaster events.
Figure 1 Number of catastrophic events, 1970–2015
The sigma event selection criteria.
Table 1 The sigma even selection criteria, 2015
0
50
100
150
200
250
300Natural catastrophes
Man-made disasters
2015201020052000199519901985198019751970Man-made disasters Natural catastrophes
Swiss Re sigma No 1/2016 3
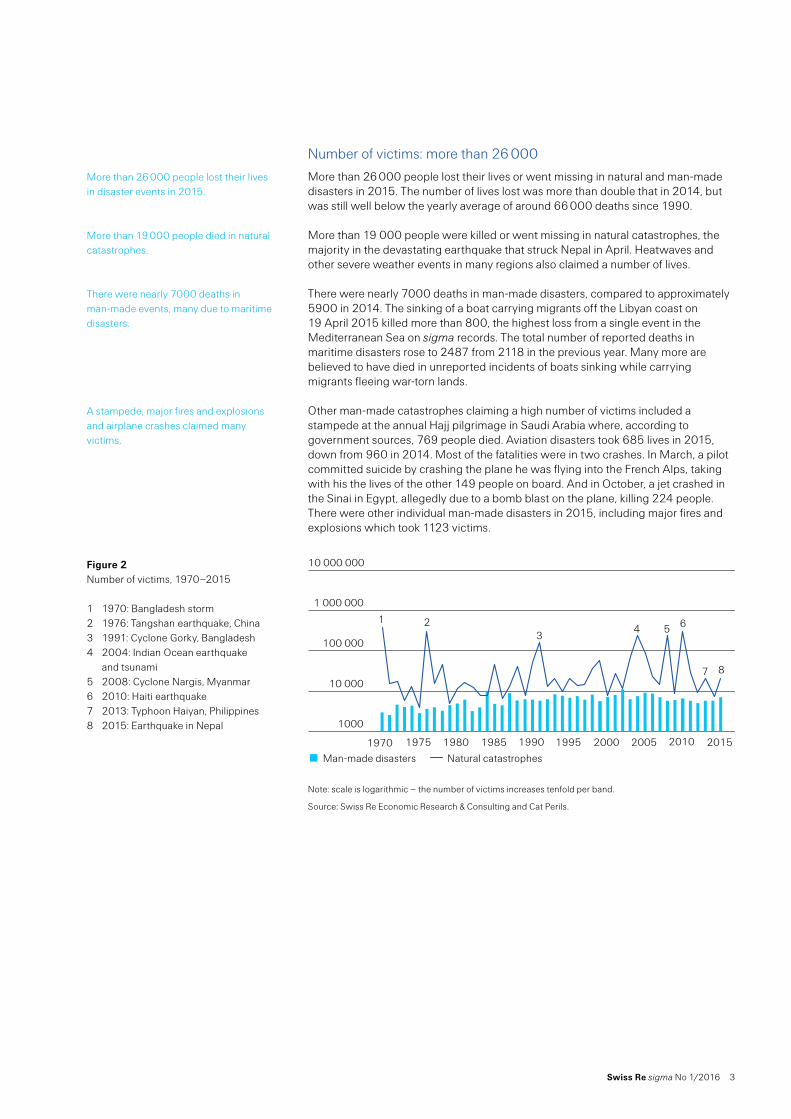
Number of victims: more than 26 000
More than 26 000 people lost their lives or went missing in natural and man-made disasters in 2015. The number of lives lost was more than double that in 2014, but was still well below the yearly average of around 66 000 deaths since 1990.
More than 19 000 people were killed or went missing in natural catastrophes, the majority in the devastating earthquake that struck Nepal in April. Heatwaves and other severe weather events in many regions also claimed a number of lives.
There were nearly 7000 deaths in man-made disasters, compared to approximately 5900 in 2014. The sinking of a boat carrying migrants off the Libyan coast on 19 April 2015 killed more than 800, the highest loss from a single event in the Mediterranean Sea on sigma records. The total number of reported deaths in maritime disasters rose to 2487 from 2118 in the previous year. Many more are believed to have died in unreported incidents of boats sinking while carrying migrants fleeing war-torn lands.
Other man-made catastrophes claiming a high number of victims included a stampede at the annual Hajj pilgrimage in Saudi Arabia where, according to government sources, 769 people died. Aviation disasters took 685 lives in 2015, down from 960 in 2014. Most of the fatalities were in two crashes. In March, a pilot committed suicide by crashing the plane he was flying into the French Alps, taking with his the lives of the other 149 people on board. And in October, a jet crashed in the Sinai in Egypt, allegedly due to a bomb blast on the plane, killing 224 people. There were other individual man-made disasters in 2015, including major fires and explosions which took 1123 victims.
Note: scale is logarithmic – the number of victims increases tenfold per band.
Source: Swiss Re Economic Research & Consulting and Cat Perils.
More than 26 000 people lost their lives in disaster events in 2015.
More than 19 000 people died in natural catastrophes.
There were nearly 7000 deaths in man-made events, many due to maritime disasters.
A stampede, major fires and explosions and airplane crashes claimed many victims.
Figure 2 Number of victims, 1970–2015
1 1970: Bangladesh storm2 1976: Tangshan earthquake, China3 1991: Cyclone Gorky, Bangladesh4 2004: Indian Ocean earthquake
and tsunami5 2008: Cyclone Nargis, Myanmar6 2010: Haiti earthquake7 2013: Typhoon Haiyan, Philippines8 2015: Earthquake in Nepal
Man-made disasters Natural catastrophes
1000
10 000
100 000
1 000 000
10 000 000
1970 1975 1980 1985 1990 1995 2000 2005 2010
1 23
4 5 6
2015
7 8
4 Swiss Re sigma No 1/2016
Catastrophes in 2015: global overview
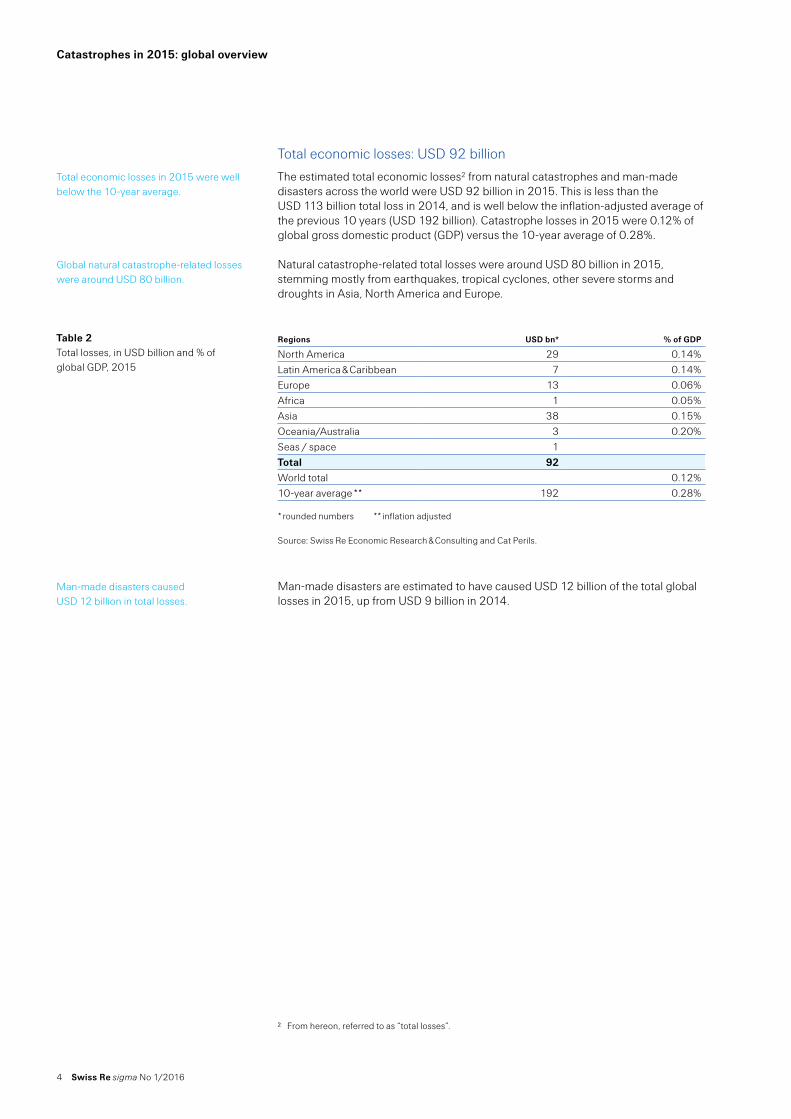
Total economic losses: USD 92 billion
The estimated total economic losses2 from natural catastrophes and man-made disasters across the world were USD 92 billion in 2015. This is less than the USD 113 billion total loss in 2014, and is well below the inflation-adjusted average of the previous 10 years (USD 192 billion). Catastrophe losses in 2015 were 0.12% of global gross domestic product (GDP) versus the 10-year average of 0.28%.
Natural catastrophe-related total losses were around USD 80 billion in 2015, stemming mostly from earthquakes, tropical cyclones, other severe storms and droughts in Asia, North America and Europe.
Regions USD bn* % of GDP
North America 29 0.14%Latin America & Caribbean 7 0.14%Europe 13 0.06%Africa 1 0.05%Asia 38 0.15%Oceania/Australia 3 0.20%Seas / space 1Total 92World total 0.12%10-year average ** 192 0.28% * rounded numbers ** inflation adjusted Source: Swiss Re Economic Research & Consulting and Cat Perils.
Man-made disasters are estimated to have caused USD 12 billion of the total global losses in 2015, up from USD 9 billion in 2014.
2 From hereon, referred to as “total losses”.
Total economic losses in 2015 were well below the 10-year average.
Global natural catastrophe-related losses were around USD 80 billion.
Table 2 Total losses, in USD billion and % of global GDP, 2015
Man-made disasters caused USD 12 billion in total losses.
Swiss Re sigma No 1/2016 5
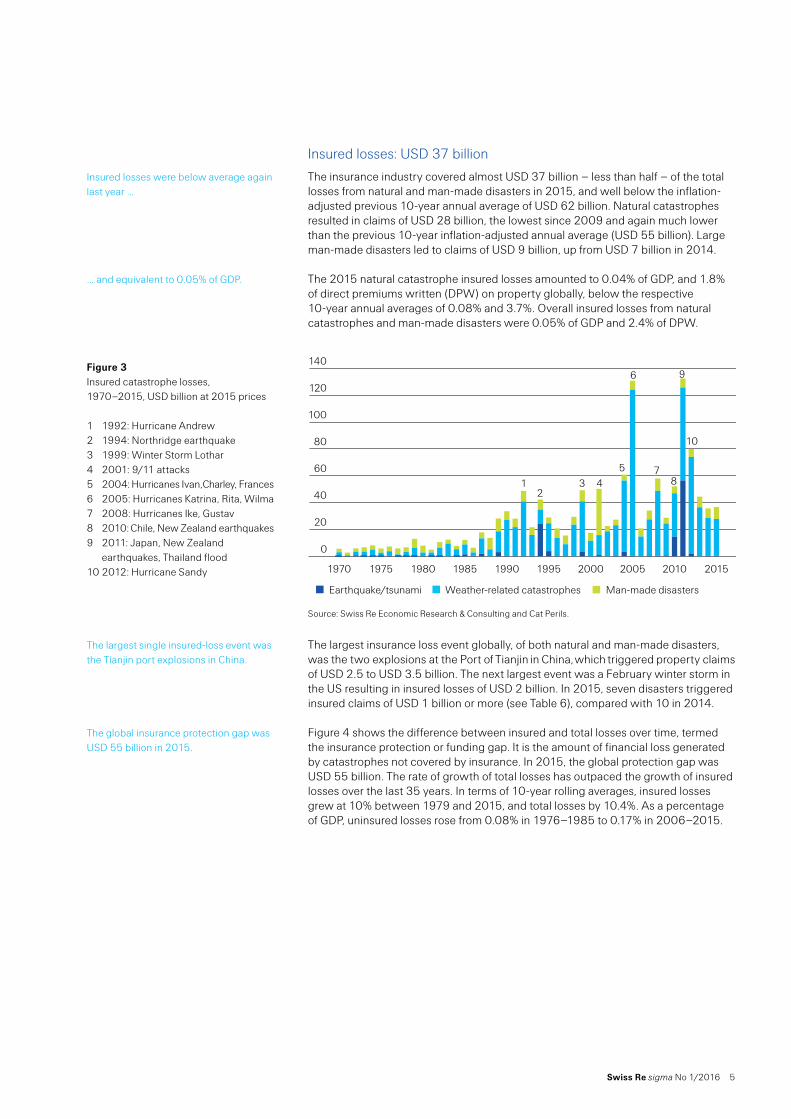
Insured losses: USD 37 billion
The insurance industry covered almost USD 37 billion – less than half – of the total losses from natural and man-made disasters in 2015, and well below the inflation-adjusted previous 10-year annual average of USD 62 billion. Natural catastrophes resulted in claims of USD 28 billion, the lowest since 2009 and again much lower than the previous 10-year inflation-adjusted annual average (USD 55 billion). Large man-made disasters led to claims of USD 9 billion, up from USD 7 billion in 2014.
The 2015 natural catastrophe insured losses amounted to 0.04% of GDP, and 1.8% of direct premiums written (DPW) on property globally, below the respective 10-year annual averages of 0.08% and 3.7%. Overall insured losses from natural catastrophes and man-made disasters were 0.05% of GDP and 2.4% of DPW.
Source: Swiss Re Economic Research & Consulting and Cat Perils.
The largest insurance loss event globally, of both natural and man-made disasters, was the two explosions at the Port of Tianjin in China, which triggered property claims of USD 2.5 to USD 3.5 billion. The next largest event was a February winter storm in the US resulting in insured losses of USD 2 billion. In 2015, seven disasters triggered insured claims of USD 1 billion or more (see Table 6), compared with 10 in 2014.
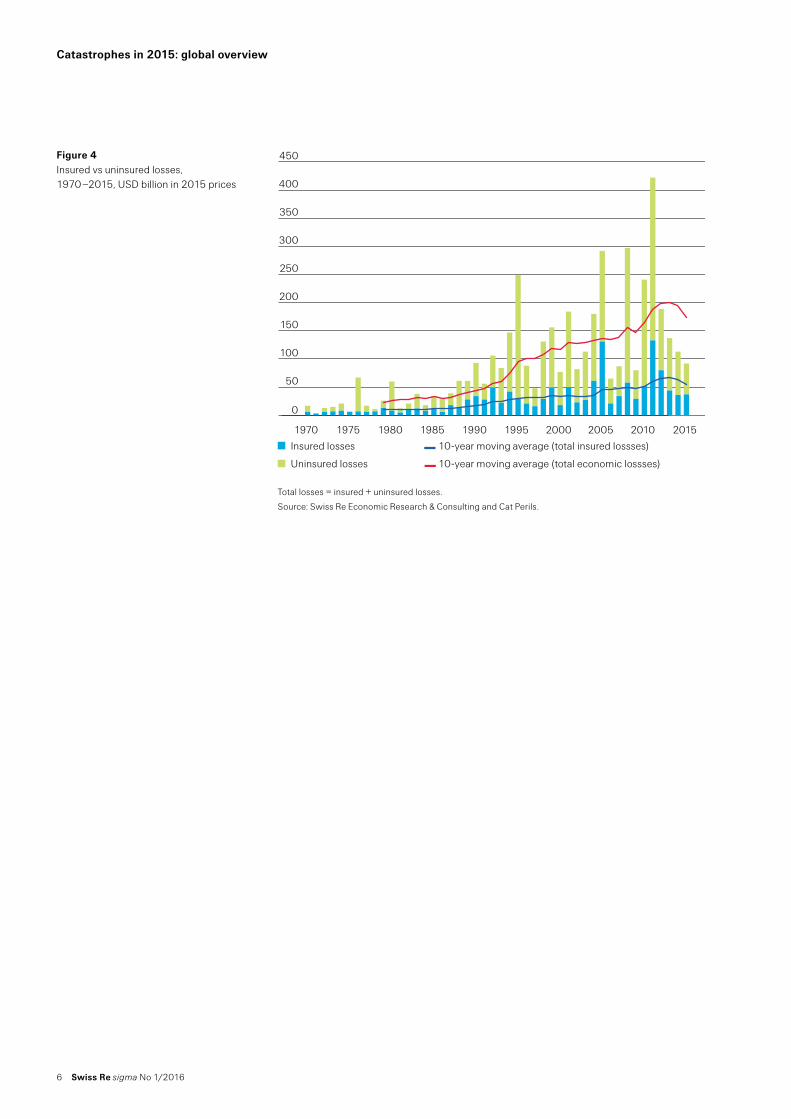
Figure 4 shows the difference between insured and total losses over time, termed the insurance protection or funding gap. It is the amount of financial loss generated by catastrophes not covered by insurance. In 2015, the global protection gap was USD 55 billion. The rate of growth of total losses has outpaced the growth of insured losses over the last 35 years. In terms of 10-year rolling averages, insured losses grew at 10% between 1979 and 2015, and total losses by 10.4%. As a percentage of GDP, uninsured losses rose from 0.08% in 1976–1985 to 0.17% in 2006–2015.
Insured losses were below average again last year …
… and equivalent to 0.05% of GDP.
Figure 3 Insured catastrophe losses, 1970–2015, USD billion at 2015 prices
1 1992: Hurricane Andrew2 1994: Northridge earthquake3 1999: Winter Storm Lothar4 2001: 9/11 attacks 5 2004: Hurricanes Ivan, Charley, Frances6 2005: Hurricanes Katrina, Rita, Wilma7 2008: Hurricanes Ike, Gustav8 2010: Chile, New Zealand earthquakes9 2011: Japan, New Zealand earthquakes, Thailand flood10 2012: Hurricane Sandy
Earthquake/tsunami Man-made disastersWeather-related catastrophes
0
20
40
60
80
100
120
140
Man-made disasters
Weather-related catastrophes
Earthquake/tsunami
2015201020052000199519901985198019751970
12
3 45
6
78
9
10
The largest single insured-loss event was the Tianjin port explosions in China.
The global insurance protection gap was USD 55 billion in 2015.
6 Swiss Re sigma No 1/2016
Catastrophes in 2015: global overview
Total losses = insured + uninsured losses.
Source: Swiss Re Economic Research & Consulting and Cat Perils.
Figure 4 Insured vs uninsured losses, 1970–2015, USD billion in 2015 prices
0
50
100
150
200
250
300
350
400
450
Uninsured losses
Insured losses
2015201020052000199519901985198019751970
Insured losses
Uninsured losses
10-year moving average (total insured lossses)
10-year moving average (total economic lossses)
Swiss Re sigma No 1/2016 7
Regional overview
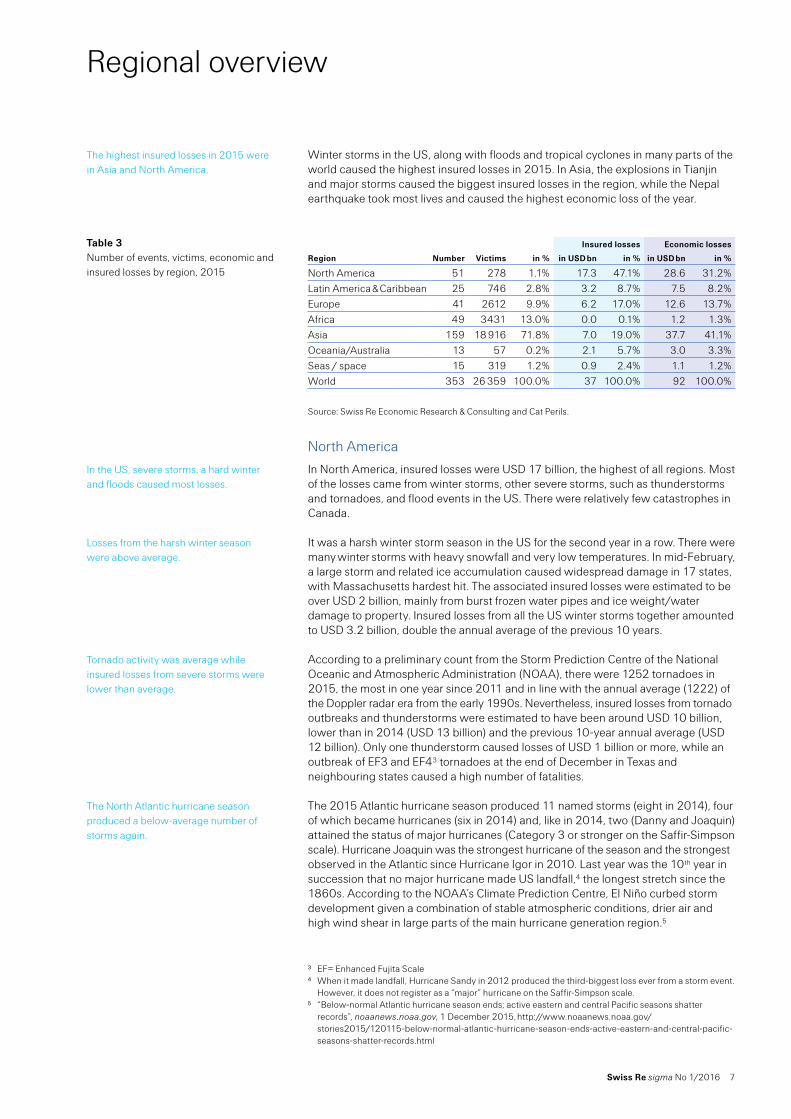
Winter storms in the US, along with floods and tropical cyclones in many parts of the world caused the highest insured losses in 2015. In Asia, the explosions in Tianjin and major storms caused the biggest insured losses in the region, while the Nepal earthquake took most lives and caused the highest economic loss of the year.
Insured losses Economic losses
Region Number Victims in % in USD bn in % in USD bn in %
North America 51 278 1.1% 17.3 47.1% 28.6 31.2%Latin America & Caribbean 25 746 2.8% 3.2 8.7% 7.5 8.2%Europe 41 2612 9.9% 6.2 17.0% 12.6 13.7%Africa 49 3431 13.0% 0.0 0.1% 1.2 1.3%Asia 159 18 916 71.8% 7.0 19.0% 37.7 41.1%Oceania/Australia 13 57 0.2% 2.1 5.7% 3.0 3.3%Seas / space 15 319 1.2% 0.9 2.4% 1.1 1.2%World 353 26 359 100.0% 37 100.0% 92 100.0%
Source: Swiss Re Economic Research & Consulting and Cat Perils.
North America
In North America, insured losses were USD 17 billion, the highest of all regions. Most of the losses came from winter storms, other severe storms, such as thunderstorms and tornadoes, and flood events in the US. There were relatively few catastrophes in Canada.
It was a harsh winter storm season in the US for the second year in a row. There were many winter storms with heavy snowfall and very low temperatures. In mid-February, a large storm and related ice accumulation caused widespread damage in 17 states, with Massachusetts hardest hit. The associated insured losses were estimated to be over USD 2 billion, mainly from burst frozen water pipes and ice weight/water damage to property. Insured losses from all the US winter storms together amounted to USD 3.2 billion, double the annual average of the previous 10 years.
According to a preliminary count from the Storm Prediction Centre of the National Oceanic and Atmospheric Administration (NOAA), there were 1252 tornadoes in 2015, the most in one year since 2011 and in line with the annual average (1222) of the Doppler radar era from the early 1990s. Nevertheless, insured losses from tornado outbreaks and thunderstorms were estimated to have been around USD 10 billion, lower than in 2014 (USD 13 billion) and the previous 10-year annual average (USD 12 billion). Only one thunderstorm caused losses of USD 1 billion or more, while an outbreak of EF3 and EF43 tornadoes at the end of December in Texas and neighbouring states caused a high number of fatalities.
The 2015 Atlantic hurricane season produced 11 named storms (eight in 2014), four of which became hurricanes (six in 2014) and, like in 2014, two (Danny and Joaquin) attained the status of major hurricanes (Category 3 or stronger on the Saffir-Simpson scale). Hurricane Joaquin was the strongest hurricane of the season and the strongest observed in the Atlantic since Hurricane Igor in 2010. Last year was the 10th year in succession that no major hurricane made US landfall,4 the longest stretch since the 1860s. According to the NOAA’s Climate Prediction Centre, El Niño curbed storm development given a combination of stable atmospheric conditions, drier air and high wind shear in large parts of the main hurricane generation region.5
3 EF= Enhanced Fujita Scale4 When it made landfall, Hurricane Sandy in 2012 produced the third-biggest loss ever from a storm event.
However, it does not register as a “major” hurricane on the Saffir-Simpson scale.5 “Below-normal Atlantic hurricane season ends; active eastern and central Pacific seasons shatter
records”, noaanews.noaa.gov, 1 December 2015, http://www.noaanews.noaa.gov/stories2015/120115-below-normal-atlantic-hurricane-season-ends-active-eastern-and-central-pacific-seasons-shatter-records.html
The highest insured losses in 2015 were in Asia and North America.
Table 3 Number of events, victims, economic and insured losses by region, 2015
In the US, severe storms, a hard winter and floods caused most losses.
Losses from the harsh winter season were above average.
Tornado activity was average while insured losses from severe storms were lower than average.
The North Atlantic hurricane season produced a below-average number of storms again.
8 Swiss Re sigma No 1/2016
Regional overview
Even though no hurricane made US landfall in 2015, tropical storm activity affected several states in the form of intense precipitation, leading to severe flooding. In the spring, the remnants of tropical storm Bill brought heavy rain and flooding to Oklahoma and Texas. In October, downpours due to Hurricane Joaquin hit South Carolina and likewise led to heavy flooding.
Other parts of the US were dry, and there were several wildfires during the year. Drought conditions fuelled wildfires in California, the most fire-prone state. The most destructive fire in terms of buildings destroyed (1307) and number of hectares burned (over 30 000) was the Valley Fire in Lake County, California. The insured losses from this event alone were just over USD 0.9 billion, ranking sixth as the most costly wildfire in the US ever. There were also wildfires in the western states of Washington, Oregon and Alaska, and in Canada. In terms of acres burnt (10.1 million)6, 2015 was the worst year for wildfires in the US since 1960. Yet while the fires spanned huge areas, only a few urban areas were impacted meaning that residential property-related losses were limited.
In Canada, there were few natural disasters in 2015 for a second year running. The biggest loss-inducing event was a series of thunderstorms in Calgary, Alberta, in mid-August, leading to insured losses of USD 0.23 billion.
Europe
In Europe, natural catastrophes and man-made disasters caused total losses of USD 13 billion in 2015. Of those, USD 6 billion were insured. The main losses came from heavy precipitation in western countries.
During the first week of December, Storm Desmond brought very heavy rainfall to north and northwest England. More than 3500 houses were flooded, most in Cumbria, and several bridges were destroyed. Starting from 22 December, Storm Eva brought gusts of more than 75 miles per hour, and pushed the rains south into Yorkshire, Lancashire and Greater Manchester. Then, during the last days of the year, Storm Frank brought more heavy rain across northern England, Ireland, Northern Ireland and Scotland. It was the wettest calendar month and the warmest December in the UK since records began in 1910.7 In total, about 16 000 homes were inundated as flood defences were breached. Preliminary estimates put the insured losses from all the December rains and flooding in the UK at around USD 2 billion.
Earlier in the year, in October heavy rains and flooding hit southeastern France. However, overall 2015 was a hot and dry year in continental Europe. In June and July, temperatures remained above 30°C for long stretches in many countries. A prolonged rainfall shortage that began in April and the high summer temperatures caused severe drought, which affected soil moisture content and vegetation conditions. Countries in Eastern Europe, particularly Romania, were severely affected and drought conditions lingered through to the end of the year. The high summer temperatures also claimed a number of victims across Europe. Preliminary estimates from statistical offices indicate a death toll of at least 1200.
Of man-made disasters, the most prominent event was a series of coordinated terrorist attacks in the French capital Paris on 13 November 2015. One hundred and thirty people lost their lives in simultaneous mass shootings, suicide bombings and hostage taking at various locations in the city, and 351 were injured. It was the biggest loss of life in one event in continental Europe last year. Also in Paris, in January the offices of satirical magazine Charlie Hebdo were attacked. Eleven people died.
6 “Billion-Dollar Weather and Climate Disasters: Table of Events”, ncdc.noaa.gov, accessed in January 2016, http://www.ncdc.noaa.gov/billions/events
7 “Recording the weather across the UK”, blog.metoffice.go.uk, January 2016, http://blog.metoffice.gov.uk/2016/01/08/reporting-the-weather-across-the-uk/ and “2015 weather summary – December”, metoffice.gov.uk, 12 January 2016, http://www.metoffice.gov.uk/climate/uk/summaries/2015/december
Heavy rainfalls triggered many severe flood events during the year.
Wildfires are an ever-present hazard in the US.
Insured losses were below average in Canada.
Flooding caused the heaviest losses, particularly in the UK.
In December, severe flooding caused devastation across many parts of the north and north western UK.
However, 2015 was also a hot and dry year in Europe, leading to increased mortality and drought.
There were two terror attacks in Paris in 2015, the most deadly on 13 November.
Swiss Re sigma No 1/2016 9
Asia
As in the previous three years, loss of life due to natural and man-made catastrophes was highest in Asia in 2015. In all, there were around 19 000 victims. The total cost of disaster events in the region was estimated to be around USD 38 billion, of which more than USD 7 billion were insured.
On 25 April 2015, an earthquake of magnitude Mw 7.8 struck Nepal.8 The epicentre was between the capital Kathmandu (home to 1.2 million people) and Pokhara, the nation’s second largest city. The resulting destruction spanned large parts of central Nepal, affecting almost half of its districts including isolated mountainous areas. The earthquake was 8.2 km below the earth’s surface and caused severe damage in Kathmandu. The city lies on a dry lake bed, the soil of which is soft and just 650 metres deep, which accentuated the destructive power of the quake. In all, close to 9000 people were killed, making it the worst disaster in Nepal in over 80 years. The earthquake’s impact went beyond Nepal, with casualties and damage reported in India, China and Bangladesh also. Total losses from the earthquake were estimated to be USD 6 billion, most of which were uninsured.
With respect to insured losses, the biggest natural catastrophe event in Asia was Typhoon Goni, which made landfall in Japan on 25 August. The insured losses were estimated to be USD 1.2 billion. The typhoon claimed 89 lives, most in the Philippines and North Korea rather than in Japan.
Elsewhere, India was hit by severe flooding. In mid-November, repeated heavy monsoon rains caused floods in the southern states of Tamil Nadu and Andhra Pradesh, and in the union territory of Puducherry. The cities of Chennai, Cuddalore and Kancheepuram and neighbouring districts were most affected. The total losses were estimated to be at least USD 2 billion. Insured losses were USD 0.8 billion, making the floods the second costliest insurance event in India on sigma records. A large part of the losses originated from commercial lines as Chennai is home to several manufacturing companies, particularly in the motor industry.
Chennai is a major urban and industrial centre in southern India, with a population of about 8.5 million. While heavy rains in the area are common, during the northeast monsoon (October–December) of last year, the accumulated rainfall in November alone was in excess of 500 mm. Some areas had more than 250 mm rainfall in just 24 hours. This extreme rainfall volume over a short duration paralyzed Chennai, with major disruption to critical infrastructure. The event highlights the vulnerability of rapidly growing urban areas to flash floods originating from heavy rains.
8 Mw is the moment magnitude, based on the seismic moment, which “is a measure of the size of an earthquake based on the area of fault rupture, the average amount of slip, and the force that was required to overcome the friction sticking the rocks together that were offset by faulting.” See http://earthquake.usgs.gov/learn/glossary/?term=seismic%20moment
Asia has suffered the most loss of life from catastrophic events for four years running.
Around 9 000 people died in the earthquake that struck Nepal in April.
Typhoon Goni caused the highest insurance loss of all natural catastrophes in Asia.
Heavy monsoon rains hit southern India.
The city of Chennai was paralyzed by the resulting flash floods.
10 Swiss Re sigma No 1/2016
Regional overview
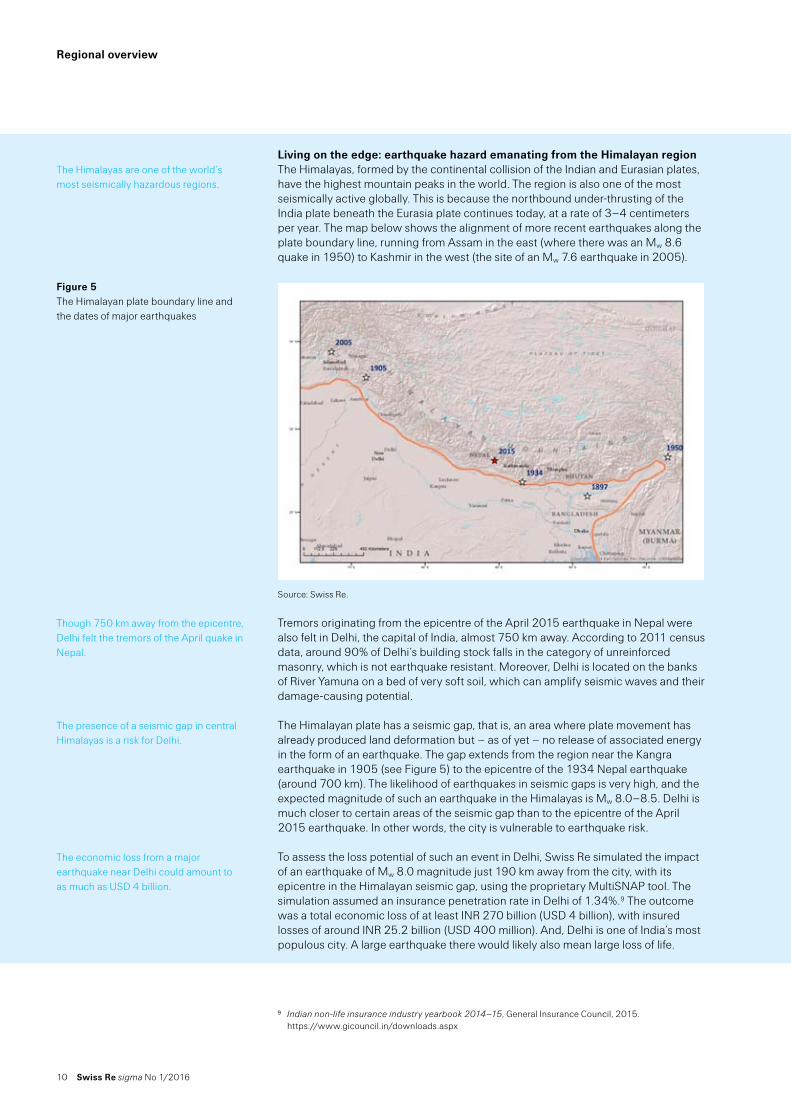
Living on the edge: earthquake hazard emanating from the Himalayan regionThe Himalayas, formed by the continental collision of the Indian and Eurasian plates, have the highest mountain peaks in the world. The region is also one of the most seismically active globally. This is because the northbound under-thrusting of the India plate beneath the Eurasia plate continues today, at a rate of 3–4 centimeters per year. The map below shows the alignment of more recent earthquakes along the plate boundary line, running from Assam in the east (where there was an Mw 8.6 quake in 1950) to Kashmir in the west (the site of an Mw 7.6 earthquake in 2005).
Source: Swiss Re.
Tremors originating from the epicentre of the April 2015 earthquake in Nepal were also felt in Delhi, the capital of India, almost 750 km away. According to 2011 census data, around 90% of Delhi’s building stock falls in the category of unreinforced masonry, which is not earthquake resistant. Moreover, Delhi is located on the banks of River Yamuna on a bed of very soft soil, which can amplify seismic waves and their damage-causing potential.
The Himalayan plate has a seismic gap, that is, an area where plate movement has already produced land deformation but – as of yet – no release of associated energy in the form of an earthquake. The gap extends from the region near the Kangra earthquake in 1905 (see Figure 5) to the epicentre of the 1934 Nepal earthquake (around 700 km). The likelihood of earthquakes in seismic gaps is very high, and the expected magnitude of such an earthquake in the Himalayas is Mw 8.0–8.5. Delhi is much closer to certain areas of the seismic gap than to the epicentre of the April 2015 earthquake. In other words, the city is vulnerable to earthquake risk.
To assess the loss potential of such an event in Delhi, Swiss Re simulated the impact of an earthquake of Mw 8.0 magnitude just 190 km away from the city, with its epicentre in the Himalayan seismic gap, using the proprietary MultiSNAP tool. The simulation assumed an insurance penetration rate in Delhi of 1.34%.9 The outcome was a total economic loss of at least INR 270 billion (USD 4 billion), with insured losses of around INR 25.2 billion (USD 400 million). And, Delhi is one of India’s most populous city. A large earthquake there would likely also mean large loss of life.
9 Indian non-life insurance industry yearbook 2014–15, General Insurance Council, 2015. https://www.gicouncil.in/downloads.aspx
The Himalayas are one of the world’s most seismically hazardous regions.
Figure 5 The Himalayan plate boundary line and the dates of major earthquakes
Though 750 km away from the epicentre, Delhi felt the tremors of the April quake in Nepal.
The presence of a seismic gap in central Himalayas is a risk for Delhi.
The economic loss from a major earthquake near Delhi could amount to as much as USD 4 billion.
Swiss Re sigma No 1/2016 11
With respect to man-made disasters, the largest insurance loss event of 2015 happened in Asia. On 12 August, two massive explosions at the Port of Tianjin in northeast China claimed 173 victims and injured many more. The explosions affected an area of 3 km radius, causing large-scale damage to surrounding property and infrastructure. The property insurance loss is estimated to be USD 2.5 billion to USD 3.5 billion. Read more in the special chapter on Tianjin in this sigma.
Latin America and the Caribbean
Natural catastrophes and man-made disasters caused total losses above USD 7 billion in Latin America and the Caribbean in 2015. Insured losses were over USD 3 billion. The main drivers were earthquakes, hurricanes and floods.
On March 25–26, there were very heavy rains in the Atacama Desert in northern Chile, one of the driest places on earth. The Copiapó River which, according to government sources, had been dry for 17 years, rapidly filled with rainwater and overflowed.10 The ground’s rock surface and lack of vegetation meant that the high volumes of rainwater were not absorbed. Instead, there were massive mudflows that hit the cities of Copiapó and Antofagasta in the Atacama and Antofagasta regions. According to government estimates, the total damage amounted to USD 1.5 billion. Insured losses were around USD 0.45 billion, the largest insured loss from a natural catastrophe in the region. El Niño/ENSO is associated with warm and wet weather along the coast of Peru and Chile.
Similarly, in 2015 El Niño fuelled the tropical storm season in the eastern Pacific, according to the NOAA. The eastern Pacific saw 18 named storms, including 13 hurricanes, nine of which were major. It was the first year since 1971 that there were nine major hurricanes in the eastern Pacific. With wind speeds of 320 km/h, Hurricane Patricia was the strongest hurricane on record in both the Atlantic and the eastern North Pacific basins.11 However, it did not hit heavily populated areas when it made landfall in Mexico, and the insured losses were moderate. The remnants of Patricia did bring rainfall to Texas, though. The combined Mexico/Texas insured losses are estimated to have been USD 0.3 billion.
A fire and explosion on a drilling platform in the Bay of Campeche, Mexico, caused the biggest man-made loss of the region. In another disaster in November, a tailings dam at an iron ore mine in Minas Gerais, Brazil, burst causing significant damage and environmental pollution as mud travelled through waterways.
10 “Flooding in Chile’s Atacama Desert after years’ worth of rain in one day”, climate.gov, 16 April 2015, https://www.climate.gov/news-features/event-tracker/flooding-chile%E2%80%99s-atacama-desert-after-years%E2%80%99-worth-rain-one-day
11 “Hurricane Patricia is strongest recorded in Eastern Nortn Pacific”, World Meteorlogical Organization, 12 October 2015, https://www.wmo.int/media/content/hurricane-patricia-strongest-recorded-eastern-north-pacific
Explosions in the port of Tianjin in China caused the largest insured loss of 2015.
Insured losses in Latin America were over USD 3 billion in 2015.
Floods hit northern Chile.
Patricia was the strongest hurricane on record in the eastern North Pacific and Atlantic basins.
There were some large man-made disasters in Latin America in 2015.
12 Swiss Re sigma No 1/2016
Regional overview
Oceania
Natural catastrophes and man-made disasters in 2015 caused insured losses of USD 2.1 billion in Oceania, primarily from thunderstorms and tropical cyclones. In April, a powerful storm system brought large hail and strong winds to New South Wales, causing insured losses of USD 0.7 billion, the costliest catastrophe event in Australia and the region last year. Other severe storms, tropical cyclone Marcia and bushfires added to the overall insured tally for the region. Marcia was the most intense cyclone to make landfall, and also the most intense recorded so far south on the eastern coast of Australia.12 Several outbreaks of bushfires destroyed homes and vast areas of crop land in South Australia, Victoria and Western Australia last year.
Africa
Natural catastrophes and man-made disasters in Africa claimed 3431 lives and caused total losses of USD 1.2 billion in 2015. The insured losses were minor. At the beginning of the year, 286 people died in floods in Malawi, and close to 250 000 people were left homeless. Losses from the thousands of houses destroyed or damaged were estimated to be USD 0.4 billion. Floods also hit Kenya, while Madagascar was affected by both floods and tropical storm Chedza. Yet again, terrorism contributed to large loss of life in the region. In a gun attack at a University in Garissa, Kenya, 148 students lost their lives.
12 “Annual Climate Report 2015”, bom.gov.au, 2016 http://www.bom.gov.au/climate/annual_sum/2015/Annual-Climate-Report-2015-LR.pdf
Many disasters caused insured losses for USD 2.1 billion in Oceania, mainly in Australia.
In Africa, over 3000 people died in disaster events in 2015.
Swiss Re sigma No 1/2016 13
Tianjin: a puzzle of risk accumulation and coverage terms
On 12 August 2015, two massive explosions at a warehouse in the Port of Tianjin in China claimed 173 victims, injured close to 800, and caused large-scale damage to surrounding property and infrastructure. The severity of the blasts and large asset exposures at the time mean that the Tianjin event is the biggest man-made insurance loss event ever recorded in Asia. The wide range of insurance policies impacted by the explosions, and the complexity of interpretation of coverage between policy classes, make for an interesting case study. The Tianjin experience also puts a spotlight on risk accumulation controls at major trading hubs and industrial parks.
The event
Tianjin is in northeast China. It is the closest starting point to the Asia-Europe land bridge and gateway to the country’s capital Beijing. In 2013, it ranked as the world’s third largest port in terms of cargo volume and the 10th for container traffic.13 It has an industrial and petrochemicals complex covering about 115 km2. The port is the main logistics hub for China’s automotive industry, accounting for 40% of all car imports and exports, and serves the same function for components and materials for a number of other industries, including healthcare and electronics.
The two explosions at Tianjin on 12 August were triggered by a fire in a warehouse in one of the port’s several logistics parks. The warehouse was storing hazardous and flammable materials, such as ammonium nitrate. Of the 173 victims14, 104 were firefighters called out to extinguish the initial fire. According to the China Earthquake Administration, the first blast registered a magnitude of Mw 2.3 and the second Mw 2.9.15 The explosions generated a fireball and sent shockwaves across an area of several-kilometre radius, leaving a large crater in the ground. Properties adjacent to the site of the blasts, mostly container yards and automotive storage facilities, were destroyed, as were thousands of new vehicles in transit parked nearby. According to a recently issued official report from the Chinese authorities, 304 buildings, 12 428 vehicles and 7533 containers were destroyed.16 In addition, due to the sheer intensity of the blasts, thousands of vehicles and properties within a 5 km radius sustained damage ranging from severe to non-structural (eg, shattered windows or just dust cover). Insurers estimate the total number of affected cars to be a multiple of the 12 428 mentioned in the official report. Ironically, the port’s shipping terminals were largely unscathed. As the blasts happened in one of many storage and logistic operations areas, overall port activity was shut down for a few days only.
According to reports of official sources, the fire started in a warehouse after the wetting agent keeping a supply of nitro-cotton in a container damp, evaporated in the high temperatures and auto-ignited. The fire quickly spread to other chemicals stored at the site including ammonium nitrate, which triggered the devastating explosions.17 There is an alternative and widely-held belief that attempts by firefighters to put out the initial fire could have triggered the blasts or magnified their intensity. The government, however, maintains that this was not the case. Either way, the event calls for a review of safety regulations for the storing of hazardous materials, and stronger enforcement of associated procedures.
13 World Port Ranking 2013, American Association of Port Authorities http://www.aapa-ports.org/Industry/content.cfm?ItemNumber=900#Statistics
14 165 people were killed and eight are still missing. See A Duckett, “Tianjin blast blamed on mismanagement”, The Chemical Engineer, 8 February 2016, http://www.tcetoday.com/latest%20news/2016/february/tianjin-blast-blamed-on-mismanagement.aspx#.Vrn2c_72a71
15 “Statement of Mr Pu Yun Qiao, member of the China Earthquake Administration”, as reported in “”, Xinhua, 13 August, 2015, http://news.xinhuanet.com/science/2015-
8/13/c_134511961.htm16 “Tianjin blast probe suggests action against 123 people”, Xinhua, 5 February 2016, http://news.
xinhuanet.com/english/2016-02/05/c_135078930.htm 17 A Duckett, op. cit.
The explosions in Tianjin in 2015 generated accumulated losses across multiple lines of insurance business.
Tianjin’s port is the gateway to Beijing and China’s industrial northeast.
Two huge blasts ripped through a logistics park at the port in August.
According to the official report, auto-ignition of nitro-cotton sparked a fire that led to the explosions.
14 Swiss Re sigma No 1/2016
Tianjin: a puzzle of risk accumulation and coverage terms
In addition to flammable materials, large amounts of toxic sodium cyanide were being stored at the site. The risk of follow-up explosions prompted the authorities to impose a 3 km exclusion zone around the blast area until 25 August. Access within a 1.5 km radius remained restricted even thereafter due to ongoing clean-up operations.
The challenge of loss estimation and claims adjudication in Tianjin
The Tianjin explosions have presented insurers with a number of challenges, not least lack of access to the affected area to assess the full extent of damage and resulting insurance claims. The imposition of the exclusion zones meant that formal loss adjustment within those areas was not possible. The exclusion zones were lifted, but access remained restricted. As such, the level of insured losses in the zones (eg, to cars and cargo containers) have been estimated in total loss terms, or have been based on forensic accounting.18
Robots and pre- and post-event drone and satellite imagery have helped loss assessment. Drones were sent in to take pictures of the disaster site immediately after the explosions. These images were compared with satellite images of the site taken prior to the event. The comparison provided a view of the extent of destruction, and also of the high number of vehicles and containers on the site at the time of the explosion. Initial loss assessments have been based on this information.
Based on Swiss Re’s latest estimates, the total insured property loss of the Tianjin explosions is likely to be around USD 2.5 billion to USD 3.5 billion, making it the largest man-made insured loss event in Asia ever recorded. The estimate is based on, among other, the net loss estimates from re/insurers’ third-quarter or full-year 2015 results, where available. Assumptions were made for those insurers which have not yet released claims estimates. The estimate is a working assumption and is subject to revision.
As first claims were filed, it became clear that damage to the thousands of new vehicles parked at and near the blast site would make up most of the insurance claims. The containers there at the time were mostly empty, and damage to containers, cargo, warehouses, infrastructure, machinery and equipment account for a much smaller proportion of the losses. Business/contingent business interruption, aviation, liability, personal accident and life claims likewise account for a small portion of the losses.
Even though the main loss – to new cars – is known, uncertainties with respect to the types of policies involved remain. If the vehicles at the site at the time of the explosion were in transit, they would likely be covered by marine insurance policies. Standard marine cargo insurance usually covers onshore storage up to a certain number of days, depending on policy terms, once the cargo is loaded off the ships.
If Tianjin was the final port of destination for the vehicles, their next transfer being to a point-of-sales in China, claims could come under property insurance. However, this transfer is often done through a local wholesaler like China Automobile Trading Co (CATC), while other car manufacturers have their own distribution operations. If car imports are channeled through a local wholesaler or subsidiary, it is not quite so simple to determine whether the manufacturer’s cargo policy or the local entity’s property or domestic transport policy responds, or whether the two covers are overlapping. Further, it is sometimes difficult to ascertain which entity held title to the parked vehicles at the time of the explosions and, accordingly, whether the loss falls under the marine cargo or property insurance policies taken out.
18 The branch of accounting used for engagements resulting from actual or anticipated disputes. See https://en.wikipedia.org/wiki/Forensic_accounting
The authorities enforced an exclusion zone to facilitate clean-up work.
The exclusion zone has delayed assessment of the full loss.
Drones and satellite imagery enabled a first assessment of exposures.
Initial estimates indicate insured losses caused by the blasts will total USD 2.5 billion to USD 3.5 billion.
Destroyed and damaged vehicles account for most of the losses.
If the parked vehicles were in transit, claims would come under marine cargo insurance coverage.
But if Tianjin was the final port of destination for the vehicles, claims could be under property insurance.
Swiss Re sigma No 1/2016 15
In addition, if the vehicles had gone through customs and were deemed to be imported into China already, the declared goods (sale) price, including import levies, could apply for loss assessment purposes, depending on policy terms. That would be considerably higher than the manufacturing or replacement value: custom duties and taxes on imported cars in China can make up for up to 50% of the retail selling price, or even more depending on the size of the engine. The total number of cars in the affected area at the time may be known, but it is not possible to ascertain from the parking position alone whether customs duties and taxes have already been paid on these vehicles.
Vehicles outside the 1.5 km exclusion zone but within the 3 km and even further out were also damaged, and it is not clear how badly. In these cases, the question for loss assessment purposes is whether the vehicles should be “written-off” as unsaleable, or whether they have resale value post cleaning and repair. If the latter, an actual sale price or negotiated depreciation rate for repaired vehicles could be applied to determine the residual value of a car. However, until a sufficient number of such sales have taken place, it will be difficult to assess the amount of depreciation. Further, so-called brand clauses could increase loss estimates, depending on policy terms. Some brand clauses give wide discretion to the insured to claim total loss for a car with just limited damage, because selling a repaired vehicle could harm brand reputation. This would be particularly relevant for cars with no physical damage, but where customers could have concerns about buying a vehicle that was in the port of Tianjin when the explosions occurred.
For cargo and containers, there is an added complexity. The widely-used system of open policies for cargo insurance (with a rate based on turnover for a storage facility rather than declarations of the precise shipment) means that an insurer does not know what insured cargo is in a specific container or the exact value of its contents.
Information already published by re/insurers suggests that the majority of vehicle claims in Tianjin fall under the property insurance category, mostly arising from high-value imported cars at the onshore storage stage of their journey to market. However, the sheer volume of the destroyed and damaged cars and the numerous loss adjustment and adjudication challenges as described above leaves the total insurance loss in a state of flux. The very high number of cars on the site suggests some may have been there for an extended period. This could indicate that car manufacturers or importers use ports as intermediate storage facilities, something insurers may not have been aware of previously. The high number of parked vehicles could also be indicative of the recent downturn in the Chinese economy.
Putting the pieces of the puzzle together
The size of the insured loss of any disaster event is largely driven by the accumulation of risks simultaneously exposed to the same event. Ports, warehouses, cargo storage facilities and industrial parks are among the locations with most risk accumulation potential. The concentration of stored, loaded and unloaded cargo, infrastructure and other industrial and commercial activities mean industrial accidents in, and severe weather events at, these locations can generate major accumulated losses across multiple lines of business. Such was the case in Tianjin. The explosions happened in a property close to large storage and transit spaces, where many high-value new cars were parked, and also close to other industrial and commercial buildings typical of a major trading hub. The explosions impacted many risks simultaneously, and there were large losses across many lines of business.
The shipping industry and marine and property insurers are well aware of the potential for large losses from accumulation of risks. However, quantifying losses in cargo aggregation points such as very large container vessels or ports at any given time is difficult. Some re/insurers have developed formal models to better understand these risks, and so improve the insurability of potential accumulated losses. However, Tianjin also shows that there needs to be more risk mapping in aggregation points to better understand exposure accumulations.
Tax treatment will affect the final valuation of vehicle claims.
The extent of damage to vehicles further away from the centre of the blast is not clear, which further complicates valuation assessment.
“Open policies” for cargo insurance add another unknown factor in final valuation.
Indications are that most of the vehicle claims will ultimately fall under property insurance.
Property and cargo present major risk accumulation factors in ports, especially in big centres like Tianjin.
Tracking cargo exposure is challenging.

16 Swiss Re sigma No 1/2016
Tianjin: a puzzle of risk accumulation and coverage terms
Catastrophe modelling has traditionally focused on static risks, such as buildings and infrastructures, including those within ports. Modelling mobile risks such as ships and cargo, and how the risks accumulate in distribution centres, has always been a challenge.19 Accumulation management for cargo usually involves coding the exposure as warehouse content using fixed location data, such as the central point of the port. However, ports are large and fragmented, often consisting of separate areas spanning kilometers, as is the case of Tianjin. Proper cargo modeling must correctly account for the geographic distribution of exposure. Advanced methods are required to address the complexity of these distributions.
Equipping expensive goods and cargo containers with active sensors could help track exposure. Big Data and smart analytics could make marine data more accessible, enabling better assessment of cargo risk accumulations and creating greater scope for modelling. The shipping industry and insurers should use the Tianjin experience as an opportunity to promote more robust understanding of how exposures accumulate. It is not only fires and explosions that pose a risk. Ports and ships can also be struck by natural catastrophes, as in the case of Hurricane Sandy in 2012.20 In all cases, a complex puzzle of marine and property cumulative loss scenarios can result.
The Tianjin explosions are a reminder that large-scale man-made industrial catastrophe events do happen. The disaster also throws light on some new considerations. In particular, the sheer volume of motor vehicles involved turned some simple coverage issues into one of the biggest challenges that the insurance industry has ever faced. Tianjin also shows that man-made disasters can have a major impact on a global and complex scale, given the large number of stakeholders spread across different jurisdictions, each with their own regulatory framework.
Tianjin could ultimately become one of the largest man-made insurance loss events worldwide ever recorded (see Table 4). The event shows the large loss potential in a country like China, with a fast-growing economy. If further evidence is needed, in 2013 a fire at a major high-tech semiconductor plant in Wuxi, also in China, caused insured losses of USD 0.9 billion. 2015 was the third year in a row that the biggest man-made loss globally originated from an emerging market, a reminder of the importance of insurance for developing countries. Financial protection through insurance is key to restoring business operations and recouping losses. Accurate assessment of exposures, appropriate coverage terms and adequate pricing are likewise crucial. For re/insurers, they need to actively identify, monitor and manage exposures in hazard zones and in areas with high asset-value concentrations.
Year Country Event Insured loss Victims
2001 US Terror attack on WTC, Pentagon, other buildings 25.2 2 9821988 UK Explosion on platform Piper Alpha 3.0 1672015 China Explosions at a warehouse storing hazardous
chemicals at Tianjin Port2.5 to 3.5* 173
1989 US Vapour cloud explosion at petrochemical plant 2.4 231979 US Damage at nuclear power station 1.42001 France Explosion destroys fertilizer plant 1.3 30
*provisional
Source: Swiss Re.
19 Safe havens: Measuring natural catastrophe exposure to cargo traded through ports, Swiss Re, 2010.20 Hurricane Sandy destroyed thousands of recreational boats along the eastern coast of US and caused
significant damage on many of the facilities of the Port of New York and New Jersey.
Capturing the spatial distribution of cargo is critical to an understanding of port accumulation.
The shipping industry and insurers can use the Tianjin experience to better-understand risk accumulation in ports, and on vessels too.
The complexities presented by the explosions have challenged the insurance industry.
The Tianjin experience also highlights the new potential risks facing developing countries with rapidly-developing economies.
Table 4 Largest man-made insured losses globally, in USD billion at 2015 prices
Swiss Re sigma No 1/2016 17
Leveraging technology in disaster management
Using technologies to build knowledge
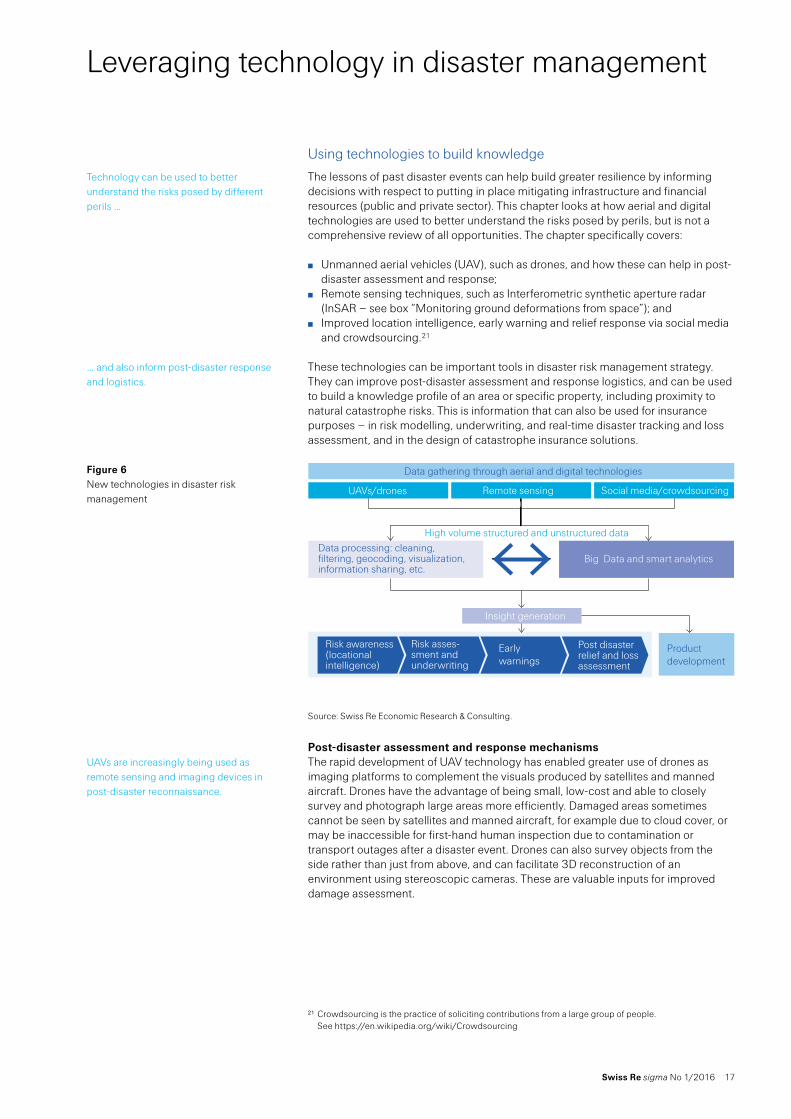
The lessons of past disaster events can help build greater resilience by informing decisions with respect to putting in place mitigating infrastructure and financial resources (public and private sector). This chapter looks at how aerial and digital technologies are used to better understand the risks posed by perils, but is not a comprehensive review of all opportunities. The chapter specifically covers:
Unmanned aerial vehicles (UAV), such as drones, and how these can help in post-disaster assessment and response;
Remote sensing techniques, such as Interferometric synthetic aperture radar (InSAR – see box “Monitoring ground deformations from space”); and
Improved location intelligence, early warning and relief response via social media and crowdsourcing.21
These technologies can be important tools in disaster risk management strategy. They can improve post-disaster assessment and response logistics, and can be used to build a knowledge profile of an area or specific property, including proximity to natural catastrophe risks. This is information that can also be used for insurance purposes – in risk modelling, underwriting, and real-time disaster tracking and loss assessment, and in the design of catastrophe insurance solutions.
Source: Swiss Re Economic Research & Consulting.
Post-disaster assessment and response mechanismsThe rapid development of UAV technology has enabled greater use of drones as imaging platforms to complement the visuals produced by satellites and manned aircraft. Drones have the advantage of being small, low-cost and able to closely survey and photograph large areas more efficiently. Damaged areas sometimes cannot be seen by satellites and manned aircraft, for example due to cloud cover, or may be inaccessible for first-hand human inspection due to contamination or transport outages after a disaster event. Drones can also survey objects from the side rather than just from above, and can facilitate 3D reconstruction of an environment using stereoscopic cameras. These are valuable inputs for improved damage assessment.
21 Crowdsourcing is the practice of soliciting contributions from a large group of people. See https://en.wikipedia.org/wiki/Crowdsourcing
Technology can be used to better understand the risks posed by different perils …
… and also inform post-disaster response and logistics.
Figure 6 New technologies in disaster risk management
UAVs are increasingly being used as remote sensing and imaging devices in post-disaster reconnaissance.
18 Swiss Re sigma No 1/2016
Leveraging technology in disaster management
The first deployment of drones in a disaster event came after Hurricane Katrina in 2005. Ten years later, their use has become mainstream. For example:
In the Port of Tianjin, drones were used to take pictures of the site hit by the devastating explosions of 12 August 2015 immediately after the event. These were compared with satellite images taken prior to the blasts which showed the number of vehicles, cargo and containers on site at the time of the explosion. The before and after comparison enabled initial loss assessment. This would not have been possible without drones because of the 3 km-radius exclusion zone enforced at the site. The alternative would have been to use manned aircraft to take pictures after the event from high altitude, which would have been more expensive and may not have produced the same quality images.
In December 2015, drones were used to take pictures over Cumbria in the UK after large areas were flooded due to Storm Desmond. The images allowed for better response planning, and loss adjusters used them to identify the worst-affected areas and properties for which claims were reported, which in turn facilitated initial claims reserving.22
Similarly, for the first time in Australia, insurers used drones to assess the damage caused by bushfires in Victoria on Christmas Day 2015.23
In the US, the use of drones by insurers is a growing trend and, for the first time, in 2015 the Federal Aviation Administration granted regulatory approval to insurance firms to use drones for commercial purposes.24
Social media can likewise be highly effective in disaster situations, for example to send early warning signals. When an Mw 5.9 magnitude earthquake hit near Richmond, Virginia in the US in August 2011, Twitter users in New York read about the quake 30 seconds before they themselves felt the ground shaking.25 In some situations, such as during Hurricane Sandy in 2012, social media platforms like Twitter and Facebook, and voice over internet protocol (VoIP)-based applications such as Skype, can be a primary source of communication. Sandy knocked out power to millions of people in New Jersey, who instead received updates from the authorities and the emergency services before and during the storm using their mobile devices.26 Social media has infiltrated less-connected populations also. In an example of “technology leapfrogging”, in the aftermath of the devastating earthquake that hit Kathmandu in April 2015, the few people with connection to the likes of Facebook were able to use the networks to collect and share information.27
Location intelligenceKnowledge of the location of insurable assets and their proximity to natural disaster risks, coupled with new analytical tools, can improve risk mitigation. Remote sensing tools such as InSAR can be used to support these efforts and help insurers improve risk models and pricing (see below).
22 “Drones will transform loss adjusting”, Insurance Day, 2 January 2016.23 “Australia: IAG is first to use drones to assess Nat CAT damage”, Asia Insurance Review, 13 January
2016, http://www.asiainsurancereview.com/News/View-NewsLetter-Article/id/34697/Type/eDaily24 “How Insurers Are Racing To Adopt Drones In One Chart”, CB Insights, 4 January 2016, https://www.
cbinsights.com/blog/insurance-firm-drone-exemptions/25 R. Ford, “East Coast residents read about D.C. earthquake before feeling it themselves”,
thehollywoodreporter.com, 23 August 2011, http://www.hollywoodreporter.com/news/earthquake-twitter-users-learned-tremors-226481
26 M. Mussoline, “Sandy Proves Social Media Can Be Powerful in a Hurricane”, accuweather.com, 13 August 2013, http://www.accuweather.com/en/weather-news/social-media-and-hurricanes-disasters/9550752 And, according to a recent study by the University of San Francisco, in the US over 70% of people in disaster situations use social media to communicate with relatives. See S. Thomas, “Social Media Changing the Way FEMA Responds to Disaster”, National Defense Magazine, September 2013.
27 “Social Media Becomes a Lifeline in the Nepal Earthquake Aftermath”, globalvoices.org, 26 April 2015, https://globalvoices.org/2015/04/26/global-social-media-lifeline-in-nepal-earthquake-aftermath/
In 2015, the commercial deployment of drones in disaster situations became mainstream.
Social media is becoming a valuable communications tool in disaster scenarios.
Location intelligence is crucial for disaster risk management and underwriting.
Swiss Re sigma No 1/2016 19
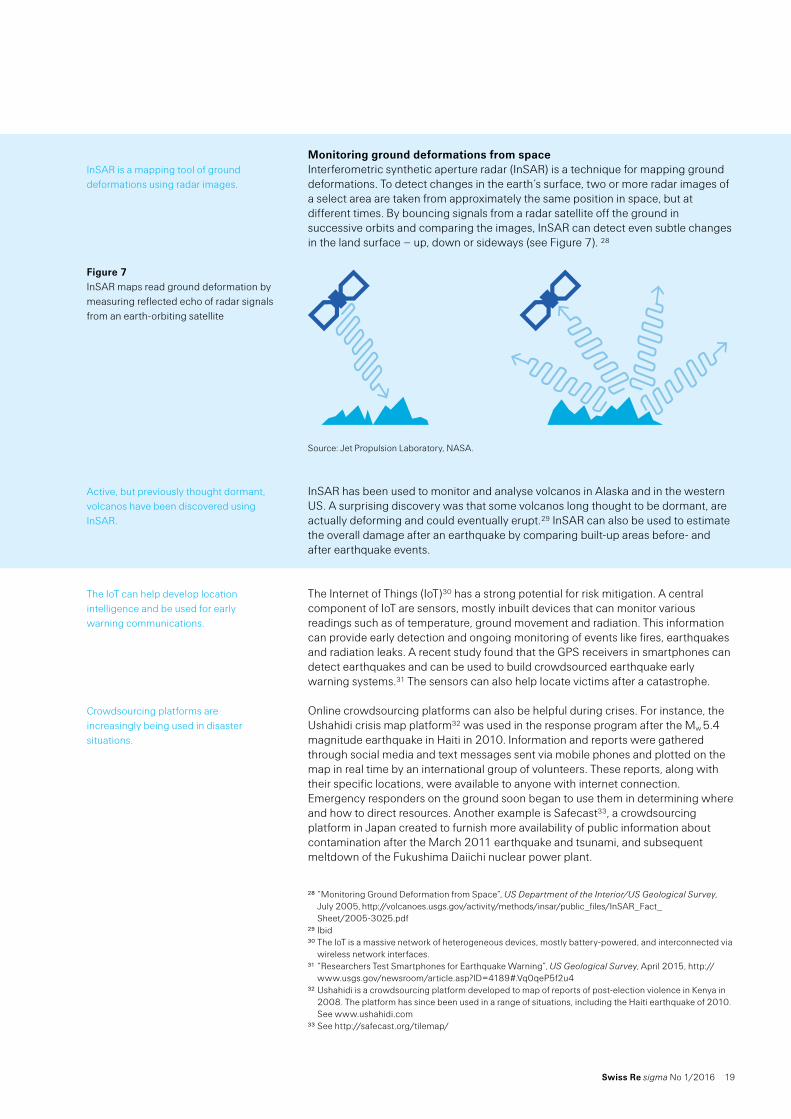
Monitoring ground deformations from spaceInterferometric synthetic aperture radar (InSAR) is a technique for mapping ground deformations. To detect changes in the earth’s surface, two or more radar images of a select area are taken from approximately the same position in space, but at different times. By bouncing signals from a radar satellite off the ground in successive orbits and comparing the images, InSAR can detect even subtle changes in the land surface – up, down or sideways (see Figure 7). 28
Source: Jet Propulsion Laboratory, NASA.
InSAR has been used to monitor and analyse volcanos in Alaska and in the western US. A surprising discovery was that some volcanos long thought to be dormant, are actually deforming and could eventually erupt.29 InSAR can also be used to estimate the overall damage after an earthquake by comparing built-up areas before- and after earthquake events.
The Internet of Things (IoT)30 has a strong potential for risk mitigation. A central component of IoT are sensors, mostly inbuilt devices that can monitor various readings such as of temperature, ground movement and radiation. This information can provide early detection and ongoing monitoring of events like fires, earthquakes and radiation leaks. A recent study found that the GPS receivers in smartphones can detect earthquakes and can be used to build crowdsourced earthquake early warning systems.31 The sensors can also help locate victims after a catastrophe.
Online crowdsourcing platforms can also be helpful during crises. For instance, the Ushahidi crisis map platform32 was used in the response program after the Mw 5.4 magnitude earthquake in Haiti in 2010. Information and reports were gathered through social media and text messages sent via mobile phones and plotted on the map in real time by an international group of volunteers. These reports, along with their specific locations, were available to anyone with internet connection. Emergency responders on the ground soon began to use them in determining where and how to direct resources. Another example is Safecast33, a crowdsourcing platform in Japan created to furnish more availability of public information about contamination after the March 2011 earthquake and tsunami, and subsequent meltdown of the Fukushima Daiichi nuclear power plant.
28 “Monitoring Ground Deformation from Space”, US Department of the Interior/US Geological Survey, July 2005, http://volcanoes.usgs.gov/activity/methods/insar/public_files/InSAR_Fact_Sheet/2005-3025.pdf
29 Ibid30 The IoT is a massive network of heterogeneous devices, mostly battery-powered, and interconnected via
wireless network interfaces.31 “Researchers Test Smartphones for Earthquake Warning”, US Geological Survey, April 2015, http://
www.usgs.gov/newsroom/article.asp?ID=4189#.Vq0qeP5f2u432 Ushahidi is a crowdsourcing platform developed to map of reports of post-election violence in Kenya in
2008. The platform has since been used in a range of situations, including the Haiti earthquake of 2010. See www.ushahidi.com
33 See http://safecast.org/tilemap/
InSAR is a mapping tool of ground deformations using radar images.
Figure 7 InSAR maps read ground deformation by measuring reflected echo of radar signals from an earth-orbiting satellite
Active, but previously thought dormant, volcanos have been discovered using InSAR.
The IoT can help develop location intelligence and be used for early warning communications.
Crowdsourcing platforms are increasingly being used in disaster situations.
20 Swiss Re sigma No 1/2016
Leveraging technology in disaster management
The Global Earthquake Model (GEM) Foundation is a public-private initiative to promote advances in seismic hazard and risk assessment. GEM is developing a global standardized exposure database of property stock with detailed information on spatial, structural and occupancy rates. GEM has been working on exploring the possibility of using data, typically building inventory, crowdsourced through a social media platform called OpenStreetMap (OSM) to model earthquake risk.34 OSM is a free global map of human settlements (transport networks, buildings, amenities etc.) and the natural environment. Similar to Wikipedia, the information is contributed by the general public, voluntarily and anywhere in the world. If platforms like OSM gain traction, there will be an accumulation of granular location-specific information available free of charge to the public at large. Insurers will be able to include these inputs into their models, turning what has-to-date been a labour-intensive data gathering process more automated. For governments, particularly in emerging markets where systematic documentation on the construction of new buildings in rapidly growing cities may be lacking, these data can be used to inform strategy on strengthening urban resilience.
The aforementioned technologies can also be used in the design of new insurance solutions. Below is an example of how satellite technology can be used to trigger agriculture insurance pay-outs in regions prone to drought conditions. Satellite pasture insurance pilot in Mexico Swiss Re’s Agro Reinsurance Product Center has joined forces with a local insurer in Mexico, Protección Agropecuaria Compañía de Seguros, SA (ProAgro) to develop an index-based insurance product to protect cattle producers in the event of severe drought losses to their pastures and grazing land. The product is designed to allow for quick and timely payouts to the insured so they can buy supplementary fodder to maintain their herds. Because it is parameter based35, the insurance is operationally more efficient than traditional livestock insurance, which requires a livestock and farm inspection to establish a claim.
The product is based on the “Normalized Difference Vegetative Index” (NDVI), an indicator of vegetation growth conditions estimated from satellite imagery, and which augments drought-monitoring information. The underlying principle is to establish a historical NDVI database for each defined pixel area on a grid and to calculate the average NDVI value for that area over the growing season. Payouts are triggered if, during the insurance period, the actual measured NDVI value in a pixel of a satellite image of the area falls below a pre-defined threshold of the historical average NDVI value in that pixel. The threshold is set at a level to reflect the onset of pasture production losses due to drought. And, to calibrate the index and minimize the inherent basis risk36, measurements of biomass in random samples of ground soil in the pastures are taken to verify the findings observed in the satellite images.
The product is due to be piloted in May 2016 in select states in Mexico. This example shows how, by using technology-driven innovation and working closely together, local stakeholders and re/insurers can play an important role in making the world more resilient.
34 “End-to-end demonstration of the Inventory Data Capture Tools”, Globalquakemodel.org, January 2014, http://www.globalquakemodel.org/media/publication/DATA-CAPTURE-GEM-EndtoEnd-IDCT-Demo-201406-V01.pdf
35 Parametric insurance pay-outs are triggered based on the physical parameters of a catastrophic event, such as wind speed, location of a hurricane, or magnitude of an earthquake.
36 Basis risk is the risk that actual losses borne by the buyer of protection will deviate from the payoffs received under the contract.
Open source platforms can also improve catastrophe models.
Technology can also be used in insurance product design.
Swiss Re has partnered with a local player in Mexico to develop a macro-level index-based insurance product for severe drought.
The product is based on NDVI. Pay-outs are triggered if the measured NDVI value falls below a pre-defined threshold.
It will be piloted in May 2016.
Smart use of technology can make the world more resilient.
Swiss Re sigma No 1/2016 21
Tables for reporting year 2015
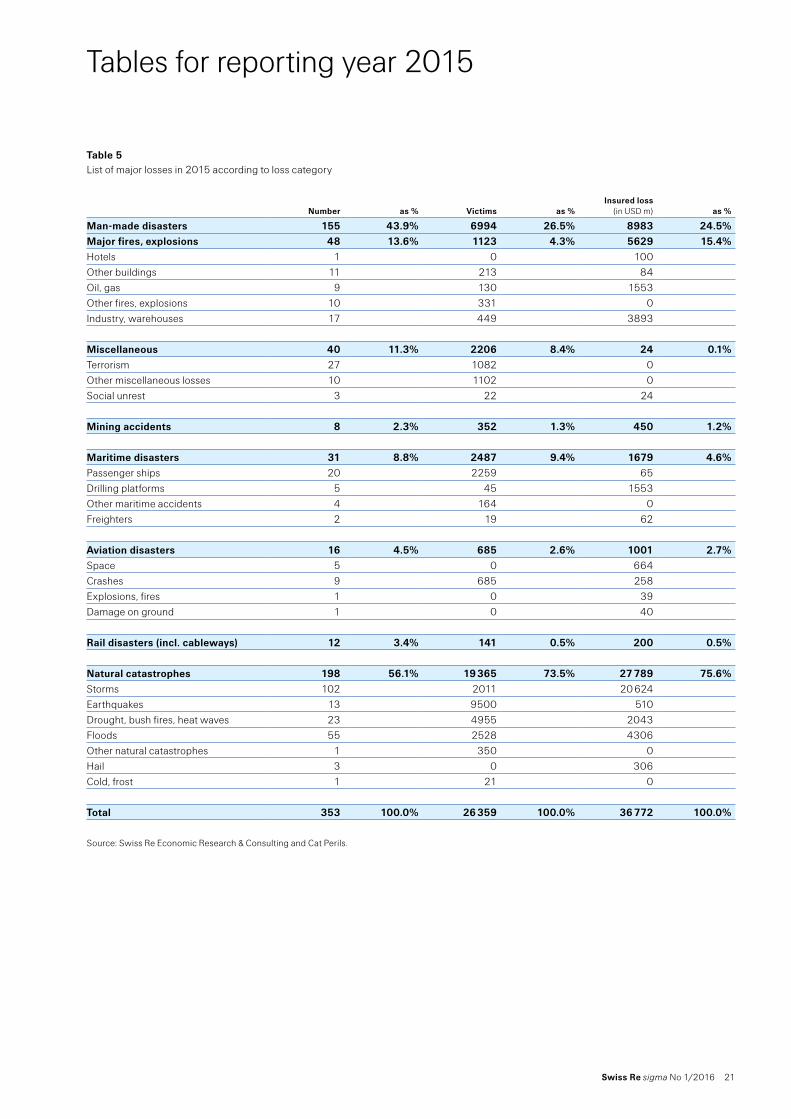
Table 5 List of major losses in 2015 according to loss category
Number as % Victims as %Insured loss
(in USD m) as %
Man-made disasters 155 43.9% 6994 26.5% 8983 24.5%Major fires, explosions 48 13.6% 1123 4.3% 5629 15.4%Hotels 1 0 100Other buildings 11 213 84Oil, gas 9 130 1553Other fires, explosions 10 331 0Industry, warehouses 17 449 3893
Miscellaneous 40 11.3% 2206 8.4% 24 0.1%Terrorism 27 1082 0Other miscellaneous losses 10 1102 0Social unrest 3 22 24
Mining accidents 8 2.3% 352 1.3% 450 1.2%
Maritime disasters 31 8.8% 2487 9.4% 1679 4.6%Passenger ships 20 2259 65Drilling platforms 5 45 1553Other maritime accidents 4 164 0Freighters 2 19 62
Aviation disasters 16 4.5% 685 2.6% 1001 2.7%Space 5 0 664Crashes 9 685 258Explosions, fires 1 0 39Damage on ground 1 0 40
Rail disasters (incl. cableways) 12 3.4% 141 0.5% 200 0.5%
Natural catastrophes 198 56.1% 19 365 73.5% 27 789 75.6%Storms 102 2011 20 624Earthquakes 13 9500 510Drought, bush fires, heat waves 23 4955 2043Floods 55 2528 4306Other natural catastrophes 1 350 0Hail 3 0 306Cold, frost 1 21 0
Total 353 100.0% 26 359 100.0% 36 772 100.0%
Source: Swiss Re Economic Research & Consulting and Cat Perils.
22 Swiss Re sigma No 1/2016
Tables for reporting year 2015
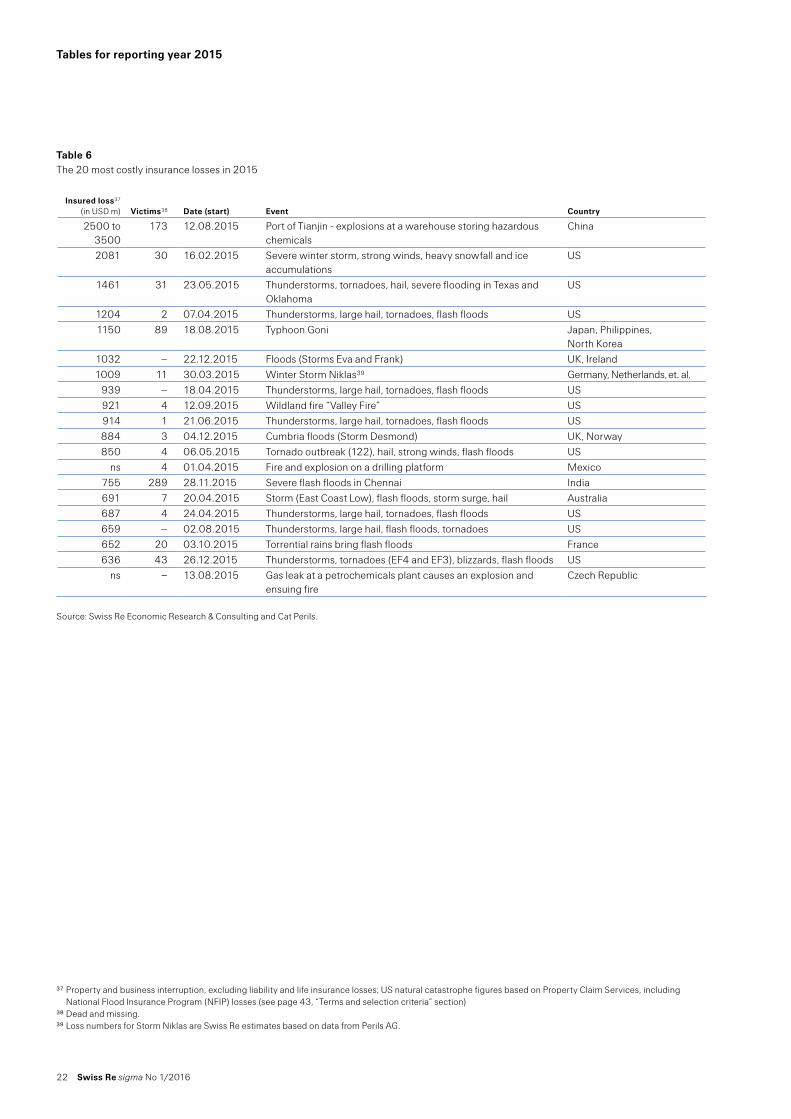
Table 637 The 20 most costly insurance losses in 201538
Insured loss37
(in USD m) Victims38 Date (start) Event Country
2500 to 3500
173 12.08.2015 Port of Tianjin - explosions at a warehouse storing hazardous chemicals
China
2081 30 16.02.2015 Severe winter storm, strong winds, heavy snowfall and ice accumulations
US
1461 31 23.05.2015 Thunderstorms, tornadoes, hail, severe flooding in Texas and Oklahoma
US
1204 2 07.04.2015 Thunderstorms, large hail, tornadoes, flash floods US1150 89 18.08.2015 Typhoon Goni Japan, Philippines,
North Korea1032 – 22.12.2015 Floods (Storms Eva and Frank) UK, Ireland1009 11 30.03.2015 Winter Storm Niklas39 Germany, Netherlands, et. al.
939 – 18.04.2015 Thunderstorms, large hail, tornadoes, flash floods US921 4 12.09.2015 Wildland fire “Valley Fire” US914 1 21.06.2015 Thunderstorms, large hail, tornadoes, flash floods US884 3 04.12.2015 Cumbria floods (Storm Desmond) UK, Norway850 4 06.05.2015 Tornado outbreak (122), hail, strong winds, flash floods US
ns 4 01.04.2015 Fire and explosion on a drilling platform Mexico755 289 28.11.2015 Severe flash floods in Chennai India691 7 20.04.2015 Storm (East Coast Low), flash floods, storm surge, hail Australia687 4 24.04.2015 Thunderstorms, large hail, tornadoes, flash floods US659 – 02.08.2015 Thunderstorms, large hail, flash floods, tornadoes US652 20 03.10.2015 Torrential rains bring flash floods France636 43 26.12.2015 Thunderstorms, tornadoes (EF4 and EF3), blizzards, flash floods US
ns – 13.08.2015 Gas leak at a petrochemicals plant causes an explosion and ensuing fire
Czech Republic
Source: Swiss Re Economic Research & Consulting and Cat Perils.39
37 Property and business interruption, excluding liability and life insurance losses; US natural catastrophe figures based on Property Claim Services, including National Flood Insurance Program (NFIP) losses (see page 43, “Terms and selection criteria” section)
38 Dead and missing.39 Loss numbers for Storm Niklas are Swiss Re estimates based on data from Perils AG.
Swiss Re sigma No 1/2016 23
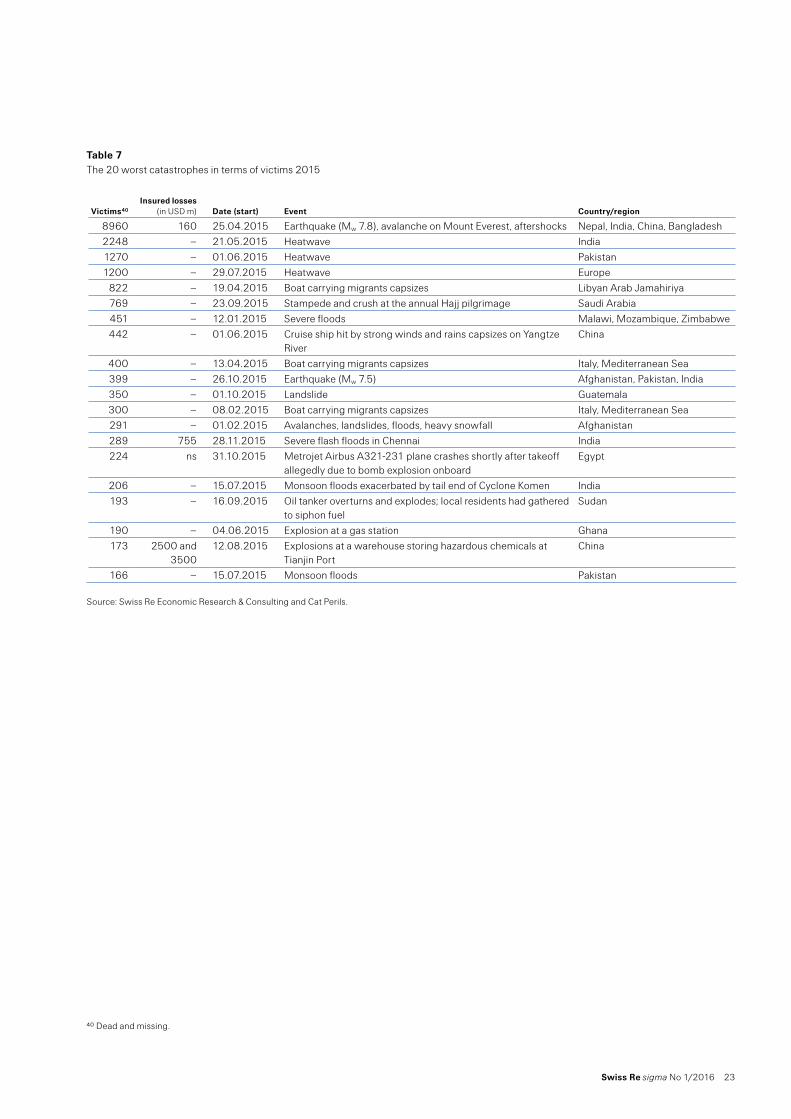
Table 7 The 20 worst catastrophes in terms of victims 2015
Victims40
Insured losses (in USD m) Date (start) Event Country/region
8960 160 25.04.2015 Earthquake (Mw 7.8), avalanche on Mount Everest, aftershocks Nepal, India, China, Bangladesh2248 – 21.05.2015 Heatwave India1270 – 01.06.2015 Heatwave Pakistan1200 – 29.07.2015 Heatwave Europe
822 – 19.04.2015 Boat carrying migrants capsizes Libyan Arab Jamahiriya769 – 23.09.2015 Stampede and crush at the annual Hajj pilgrimage Saudi Arabia451 – 12.01.2015 Severe floods Malawi, Mozambique, Zimbabwe442 – 01.06.2015 Cruise ship hit by strong winds and rains capsizes on Yangtze
RiverChina
400 – 13.04.2015 Boat carrying migrants capsizes Italy, Mediterranean Sea399 – 26.10.2015 Earthquake (Mw 7.5) Afghanistan, Pakistan, India350 – 01.10.2015 Landslide Guatemala300 – 08.02.2015 Boat carrying migrants capsizes Italy, Mediterranean Sea291 – 01.02.2015 Avalanches, landslides, floods, heavy snowfall Afghanistan289 755 28.11.2015 Severe flash floods in Chennai India224 ns 31.10.2015 Metrojet Airbus A321-231 plane crashes shortly after takeoff
allegedly due to bomb explosion onboardEgypt
206 – 15.07.2015 Monsoon floods exacerbated by tail end of Cyclone Komen India193 – 16.09.2015 Oil tanker overturns and explodes; local residents had gathered
to siphon fuelSudan
190 – 04.06.2015 Explosion at a gas station Ghana173 2500 and
350012.08.2015 Explosions at a warehouse storing hazardous chemicals at
Tianjin PortChina
166 – 15.07.2015 Monsoon floods Pakistan
Source: Swiss Re Economic Research & Consulting and Cat Perils.
40 Dead and missing.
24 Swiss Re sigma No 1/2016
Tables for reporting year 2015
Table 8 Chronological list of all natural catastrophes 2015
Floods
Date Country EventNumber of victims/amount of damage (where data available), local currency and/or USD
5.1.–9.2. Bolivia, Peru, La Paz, Chuquisaca, Potosí, Oruro, Cochabamba, Santa Cruz
Floods caused by heavy torrential rains 23 dead 1000 homeless
12.1.–31.1. Malawi, Mozambique, Zimbabwe
Severe floods – 523 347 houses and 89 110 ha of crop land damaged or destroyed in Malawi, 21 780 houses destroyed and 14 361 houses damaged in Mozambique
279 dead, 172 missing248 620 homelessUSD 405m total damage
29.1.–12.2. Greece, Bulgaria, Macedonia Albania
Floods, heavy snowfall, strong winds, landslides – severe damage to agriculture
4 dead, 1 missing110 injuredEUR 682m (USD 741m) total damage
8.2.–13.2. IndonesiaJava, Bali, West Nusa Tenggara
Floods 6 deadUSD 235m total damage
13.2.–14.2. AngolaLuanda
Flash floods – 187 houses destroyed, more than 2000 houses damaged
5 deadMore than 2000 homeless
27.2.–1.3. MadagascarAntananarivo
Flash floods – 4800 houses destroyed 26 dead
9.3.–12.3. AngolaLobito, Benguela
Severe flash floods 69 dead
10.3. IranBandar Abbas
Flash floods – 900 houses destroyed 3 deadMore than 2000 homelessUSD 60m total damage
20.3.–31.3. IndiaJammu and Kashmir
Floods – 12 565 houses damaged 44 dead25 injured2907 homelessINR 5bn (USD 76m) total damage
24.3.–26.3. ChileAtacama, Antofagasta, Coquimbo
Flash floods, Copiapó River overflowed – 2071 houses destroyed, 6253 houses damaged, damage to copper mines
31 dead, 16 missingUSD 450m insured lossUSD 1.5bn total damage
29.3. BurundiMuhuta, Bujumbura
Landslides caused by heavy rains 10 dead, 1 missing2 870 homeless
4.4.–15.4. ChinaHunan, Jiangxi
Remnants of Typhoon Maysak bring floods to 52 towns in Hunan and to 19 467 ha of cropland – more than 5000 houses destroyed, more than 10 000 houses damaged
6 deadUSD 209m total damage
28.4. AfghanistanJerow-Bala, Khawahan, Badakhshan Province
Landslide caused by heavy rains and snow melt 52 dead
7.5.–21.6. TanzaniaDar es Salaam, Arusha, Kilimanjaro, Tanga, Kagera
Floods 12 dead5000 homeless
9.5. AfghanistanFaryab
Flash floods – 1500 houses destroyed 7 dead10 injured3000 homeless
10.5.–18.5. ChinaFujian, Jiangxi, Hunan, Guangdong, Guangxi, Guizhou
Floods – severe damage to agriculture 48 deadUSD 800m total damage
18.5. ColombiaSalgar
Flash floods trigger large mudslide, debris flow 93 dead48 injured
28.5.–1.6. ChinaGuizhou, Chongqing, Jiangsu, Fujian
Floods 17 deadUSD 500m total damage
Swiss Re sigma No 1/2016 25
Date Country EventNumber of victims/amount of damage (where data available), local currency and/or USD
3.6.–5.6. GhanaAccra
Flash floods 25 dead5000 homeless>USD 12m total damage
10.6. NepalTaplejung District
Floods trigger landslide 36 dead
13.6.–14.6. GeorgiaTbilisi
Flash flood, landslide and ensuing mudflow caused Vere River to overflow – nearby properties flooded, partial collapse of the city’s highway
19 dead, 3 missing457 injured300 homelessGEL 55m (USD 23m) total damage
16.6.–20.6. ChinaGuizhou, Hubei, Hunan, Jiangxi, Yunnan, Zhejiang
Floods 9 deadUSD 200m total damage
19.6.–29.6. IndiaWestern Gujarat
Monsoon floods – 200 000 ha of agriculture land flooded
81 deadINR 40bn (USD 604m) total damage
24.6.–28.6. BangladeshCox’s Bazar, Chittagong, Bandarban
Flash floods, landslides – 27 269 houses destroyed, 77 090 houses damaged
22 dead20 651 injuredUSD 40m total damage
26.6.–2.7. ChinaAnhui, Jiangsu, Sichuan
Floods 16 deadUSD 545m total damage
15.7.–19.8. IndiaWest Bengal, Odisha, Rajasthan, Manipur
Monsoon floods exacerbated by tail end of Cyclone Komen
206 dead
15.7.–19.8. Pakistan Chitral (Khyber Pakhtunkhwa), Punjab
Monsoon floods 166 dead
25.7.–19.8. Niger, Burkina FasoAgadez, Dosso, Maradi, Niamey, Tillabéry, Tahoua, Zinder
River floods 12 dead54 injured5528 homelessUSD 31m total damage
26.7.–11.8. Myanmar (Burma)Chin, Rakhine
Severe monsoon floods exacerbated by tail end of Cyclone Komen – 21 221 houses destroyed, 468 676 houses damaged
125 deadMMK 155bn (USD 119m) total damage
1.8.–5.8. North KoreaNorth Hamgyong Province, South Hamgyong Province, South Hwanghae Province
Monsoon (Changma) floods – 714 houses destroyed
24 dead, 9 missing3541 homeless
3.8. MacedoniaTetovo
Flash floods, debris flow, landslides 6 dead79 injuredEUR 80m (USD 87m) total damage
10.8.–19.8. ArgentinaBuenos Aires, Santa Fe
Floods 3 deadUSD 146m total damage
11.8.–12.8. ItalyCorigliano Calabro, Rossano Calabro
Flash floods EUR 102m (USD 111m) total damage
13.8.–11.9. IndiaAssam
Monsoon rains cause floods – Brahmaputra River burst its banks, 2000 villages flooded
50 deadUSD 50m total damage
30.8.–11.9. NigeriaZamfara, Anambra, Sokoto, Kebbi, Kano
Floods caused by torrential rains 30 dead2000 homeless
9.9.–11.9. JapanJoso (Ibaraki), Tochigi, Miyagi
Flooding and 455 landslides due to tropical storm Etau – Kinugawa River burst its banks in the city of Joso, 16 houses destroyed, 102 houses seriously damaged, 18 882 houses flooded, more than 1000 people stranded
8 dead46 injuredJPY 40bn (USD 333m) insured lossUSD 500m total damage
1.10.–27.10. IndiaSouthern Tami Nadul
Monsoon floods – damage to agriculture 49 deadINR 1bn (USD 15m) total damage
3.10.–4.10. FranceAlpes-Maritimes, Var, Côte d’Azur
Torrential rains bring flash floods 20 deadEUR 600m (USD 652m) insured lossEUR 850m (USD 924m) total damage
26 Swiss Re sigma No 1/2016
Tables for reporting year 2015
Date Country EventNumber of victims/amount of damage (where data available), local currency and/or USD
13.10.–19.10. ItalyBenevento (Campania), Lazio, Abruzzo
Heavy rains, flash floods 4 deadEUR 150m (USD 163m) total damage
14.10.–17.10. OmanNizwa, Ras Al Hadd, Bahla
Flash floods 7 dead50 injured
16.10.–23.10. AlgeriaTindouf
Heavy rains flood Sahrawi refugee camps and south-western Algeria – 1 200 homes and tents destroyed
35 000 homeless
28.10.–6.11. IraqBaghdad
Flash floods 58 dead2650 homeless
2.11.–12.11. KenyaNarok, Bungoma, Talek
Flash floods and landslides 23 dead
8.11.–20.11. IndiaAndhra Pradesh, Tamil Nadu, Puducherry
Monsoon rains exacerbated by remnants of a deep depression in the Bay of Bengal – flooding in Andhra Pradesh and Tamil Nadu
81 deadUSD 110m total damage
10.11.–15.11. ChinaHunan
Floods, landslides 38 deadUSD 130m total damage
13.11.–4.12. Sri LankaJaffna, Mullaitivu, Killinochchi, Trincomalee, Puttalam, Gampaha
Floods – 160 houses destroyed, 2656 houses damaged
3 dead2600 homeless
19.11.–24.11. Democratic Republic of Congo Kinshasa
River flood – N’djili River burst its banks 31 dead8480 homeless
25.11.–4.12. Qatar, Saudi ArabiaDoha
Flash floods 1 deadUSD 120m total damage
28.11. IranIlam, Lorestan, Kurdistan, Kermanshah
Flash floods 6 deadIRR 7000bn (USD 234m) total damage
28.11.–4.12. IndiaChennai (Tamil Nadu), Andhra Pradesh, Puducherry
Flash floods in Chennai – 55 175 ha flooded 289 dead1000 injuredINR 50bn (USD 755m) insured lossUSD 2.2bn total damage
1.12.2015–6.1.2016
KenyaGarissa, Migori, Busia and Homa Bay
Floods – several rivers burst their banks 89 dead73 injured
4.12.–6.12. UK, NorwayCumbria, Lancashire
Flooding as a result of Storm Desmond 3 deadGBP 600m (USD 884m) insured loss>GBP 800m (USD 1.2bn) total damage
5.12.–30.12. Argentina, Paraguay, Uruguay, Brazil
Floods and landslides caused by torrential rains – Rivers Uruguay and Paraguay burst their banks
20 deadUSD 200m total damage
22.12.–28.12. UK, IrelandYork, Yorkshire, Lancashire, Greater Manchester
Flooding as a result of storms Eva and Frank – Rivers Calder, Ribble, Nidd, Irwell, Ouse, Foss, and Aire burst their banks
GBP 700m (USD 1.0bn) insured loss>GBP 800m (USD 1.2bn) total damage
24.12.2015–9.1.2016
United StatesMO (St. Louis), IL, AR, TN, MS, LA
Winter flood along Mississippi River in Midwest – major flooding in Missouri, Illinois
31 dead>USD 200m insured loss>USD 600m total damage
Swiss Re sigma No 1/2016 27
Storms
Date Country EventNumber of victims/amount of damage (where data available), local currency and/or USD
8.1.–11.1. Germany, Norway, UK, Sweden, Denmark
Windstorm Elon-Felix41 2 deadEUR 329m (USD 358m) insured loss EUR 500m (USD 543m) total damage
16.1.–17.1. MadagascarAnalamanga, Vatovavy, Fitovinany, Atsimo, Atsinanana, Menabe
Tropical storm Chedza – pump station responsible for disposal of rain and flood water collapsed exacerbating flooding, 1831 houses destroyed or damaged, 13 100 ha of paddy fields flooded
80 dead, 9 missingUSD 36m total damage
19.1. OmanMuscat
Storms and floods USD 221m total damage
26.1.–28.1. United StatesCT, ME, MA, NH, NY, RI
Winter storm (nor’easter) with winds up to 104 km/h, heavy snow fall, coastal flooding
2 deadUSD 50m insured lossUSD 80m total damage
1.2.–4.2. United StatesMA, NY, CT, IL, MI, IN
Winter storm, high winds, heavy snowfall and freezing temperatures – 3000 flights cancelled
22 deadUSD 100–300m insured lossUSD 150m total damage
1.2.–15.2. AfghanistanPanjshir
Avalanches, landslides, floods, heavy snowfall – 1454 houses destroyed, 7119 houses damaged
291 dead96 injuredUSD 3m total damage
5.2.–8.2. Spain, Italy Blizzards, heavy snowfall, strong winds, flooding – frost damage to agriculture
3 deadEUR 68m (USD 73m) insured lossEUR 150m (USD 163m) total damage
7.2.–11.2. United StatesMA, NY, CT, RI, NH
Winter storm, heavy snowfall – over 2000 flights cancelled
2 deadUSD 100–300m insured lossUSD 300m total damage
14.2.–15.2. United StatesMA, NY, NJ, VA, MD, RI, CT, NH, PA, DE
Winter storm, heavy snowfall, strong winds – 1600 flights cancelled
8 deadUSD 300–600m insured lossUSD 700m total damage
16.2.–17.2. United StatesVA, GA, TN, NC, SC
Winter storm, heavy snow, strong icy winds 10 deadUSD 25–100m insured lossUSD 100m total damage
16.2.–22.2. United StatesMA, NY, TN, MD, VA, PA, KY, NC, MI, RI, NH, OH, SC, IL, DC, ME, VT
Severe winter storm, strong winds, heavy snowfall and ice accumulations – severe damage in Massachusetts
30 deadUSD 1–3bn insured lossUSD 3bn total damage
19.2.–20.2. AustraliaYeppoon, Rockhampton, Biloela, Yeppoon, Byfield, Jambin, Marmor, Monto, Queensland
Tropical Cyclone Marcia (Cat 5) with winds up to 208 km/h – up to 2 000 houses destroyed
1 deadAUD 544m (USD 396m) insured lossAUD 750m (USD 546m) total damage
3.3.–4.3. TanzaniaMsalala, Shinyanga
Thunderstorms, large hail, flash floods – 634 houses destroyed
47 dead112 injured, 3500 homeless
3.3.–5.3. United StatesNY, PA, KY, WV, AR
Winter storm, sleet and snow fall 13 deadUSD 100–300m insured lossUSD 170m total damage
4.3.–9.3. ItalyToscana, Liguria, Abruzzo, Umbria, Marche, Puglia, Campania
Winter storm Anton with winds up to 200 km/h, heavy snowfall, floods, landslides – severe disruption to transport, damage to agriculture, – explosion at gas pipeline in Abruzzo
3 deadEUR 254m (USD 276m) insured lossEUR 800m (USD 869m) total damage
6.3.–18.3. IndiaGujarat, Punjab, Himachal Pradesh, Haryana, Maharashtra, Bihar, Uttar Pradesh, Madhya Pradesh, Rajasthan, Jammu & Kashmir, West Bengalwere
Severe hailstorms, flash floods – severe damage to agriculture
27 deadINR 7bn (USD 106m) insured lossINR 60bn (USD 906m) total damage
41 Loss estimates for Windstorm Elon-Felix from Perils AG.
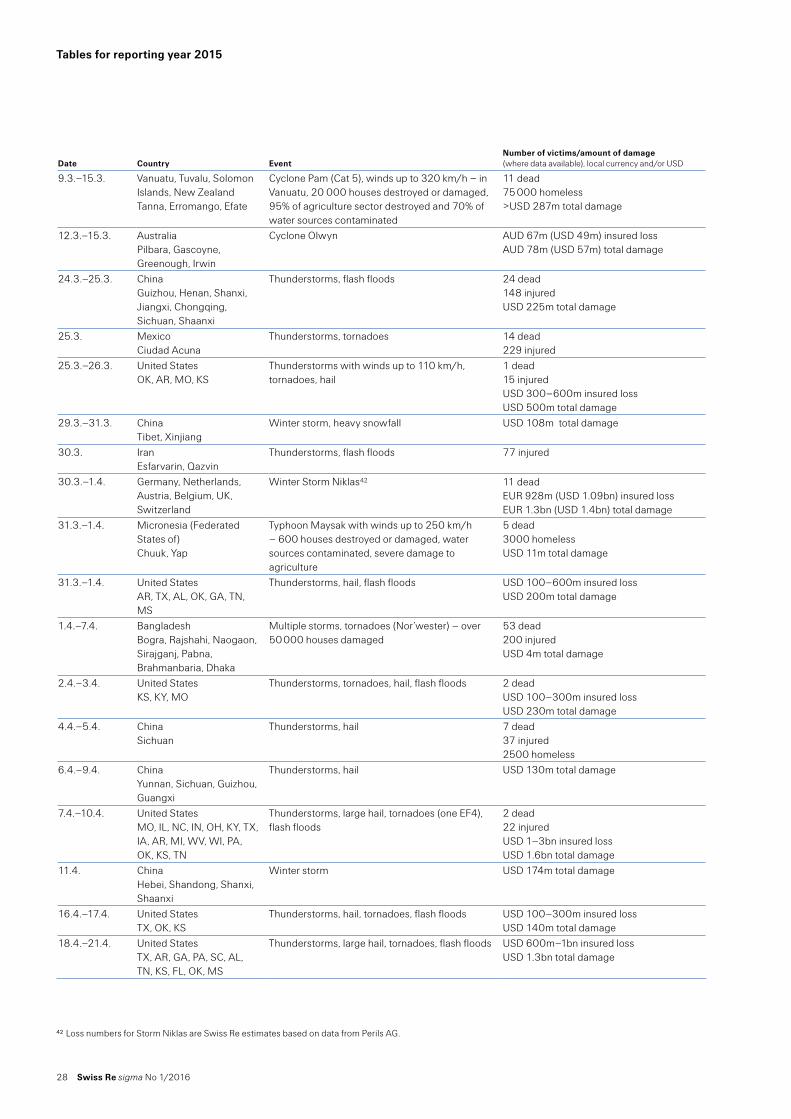
28 Swiss Re sigma No 1/2016
Tables for reporting year 2015
Date Country EventNumber of victims/amount of damage (where data available), local currency and/or USD
9.3.–15.3. Vanuatu, Tuvalu, Solomon Islands, New ZealandTanna, Erromango, Efate
Cyclone Pam (Cat 5), winds up to 320 km/h – in Vanuatu, 20 000 houses destroyed or damaged, 95% of agriculture sector destroyed and 70% of water sources contaminated
11 dead75 000 homeless>USD 287m total damage
12.3.–15.3. AustraliaPilbara, Gascoyne, Greenough, Irwin
Cyclone Olwyn AUD 67m (USD 49m) insured lossAUD 78m (USD 57m) total damage
24.3.–25.3. ChinaGuizhou, Henan, Shanxi, Jiangxi, Chongqing, Sichuan, Shaanxi
Thunderstorms, flash floods 24 dead148 injuredUSD 225m total damage
25.3. MexicoCiudad Acuna
Thunderstorms, tornadoes 14 dead229 injured
25.3.–26.3. United StatesOK, AR, MO, KS
Thunderstorms with winds up to 110 km/h, tornadoes, hail
1 dead15 injuredUSD 300–600m insured lossUSD 500m total damage
29.3.–31.3. ChinaTibet, Xinjiang
Winter storm, heavy snowfall USD 108m total damage
30.3. IranEsfarvarin, Qazvin
Thunderstorms, flash floods 77 injured
30.3.–1.4. Germany, Netherlands, Austria, Belgium, UK, Switzerland
Winter Storm Niklas42 11 deadEUR 928m (USD 1.09bn) insured lossEUR 1.3bn (USD 1.4bn) total damage
31.3.–1.4. Micronesia (Federated States of)Chuuk, Yap
Typhoon Maysak with winds up to 250 km/h – 600 houses destroyed or damaged, water sources contaminated, severe damage to agriculture
5 dead3000 homelessUSD 11m total damage
31.3.–1.4. United StatesAR, TX, AL, OK, GA, TN, MS
Thunderstorms, hail, flash floods USD 100–600m insured lossUSD 200m total damage
1.4.–7.4. BangladeshBogra, Rajshahi, Naogaon, Sirajganj, Pabna, Brahmanbaria, Dhaka
Multiple storms, tornadoes (Nor’wester) – over 50 000 houses damaged
53 dead200 injuredUSD 4m total damage
2.4.–3.4. United StatesKS, KY, MO
Thunderstorms, tornadoes, hail, flash floods 2 deadUSD 100–300m insured lossUSD 230m total damage
4.4.–5.4. ChinaSichuan
Thunderstorms, hail 7 dead37 injured2500 homeless
6.4.–9.4. ChinaYunnan, Sichuan, Guizhou, Guangxi
Thunderstorms, hail USD 130m total damage
7.4.–10.4. United StatesMO, IL, NC, IN, OH, KY, TX, IA, AR, MI, WV, WI, PA, OK, KS, TN
Thunderstorms, large hail, tornadoes (one EF4), flash floods
2 dead22 injuredUSD 1–3bn insured lossUSD 1.6bn total damage
11.4. ChinaHebei, Shandong, Shanxi, Shaanxi
Winter storm USD 174m total damage
16.4.–17.4. United StatesTX, OK, KS
Thunderstorms, hail, tornadoes, flash floods USD 100–300m insured lossUSD 140m total damage
18.4.–21.4. United StatesTX, AR, GA, PA, SC, AL, TN, KS, FL, OK, MS
Thunderstorms, large hail, tornadoes, flash floods USD 600m–1bn insured lossUSD 1.3bn total damage
42 Loss numbers for Storm Niklas are Swiss Re estimates based on data from Perils AG.
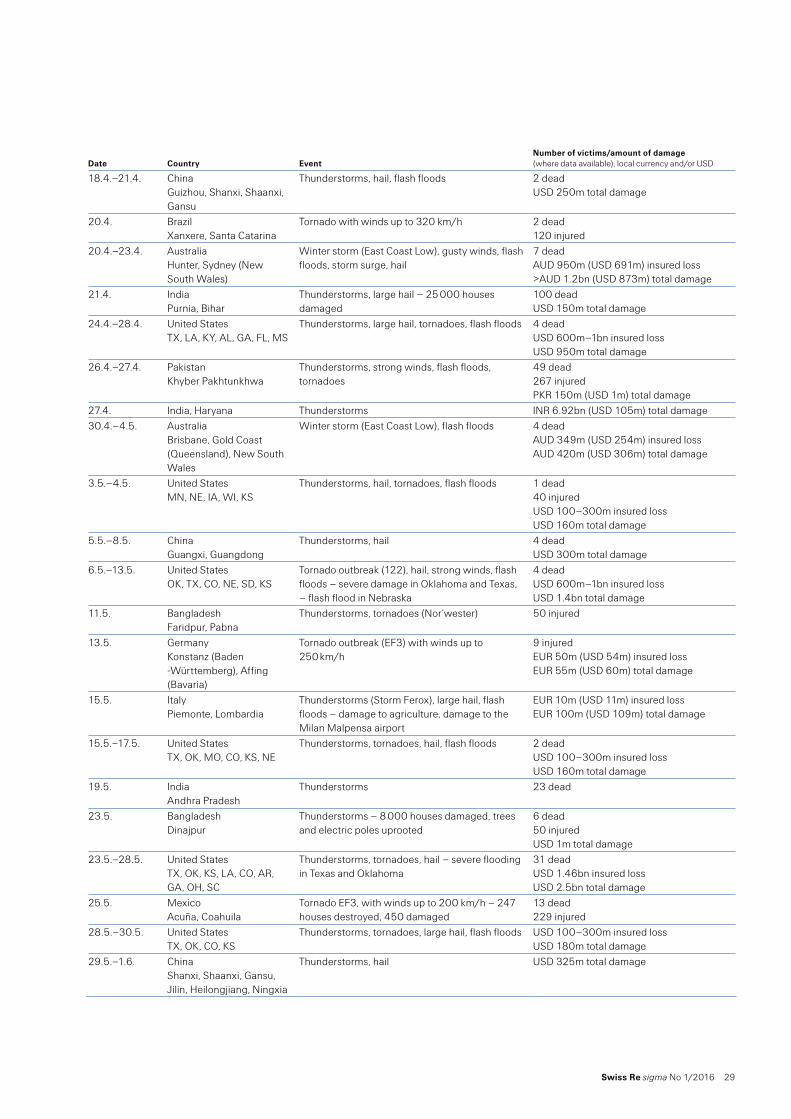
Swiss Re sigma No 1/2016 29
Date Country EventNumber of victims/amount of damage (where data available), local currency and/or USD
18.4.–21.4. ChinaGuizhou, Shanxi, Shaanxi, Gansu
Thunderstorms, hail, flash floods 2 deadUSD 250m total damage
20.4. BrazilXanxere, Santa Catarina
Tornado with winds up to 320 km/h 2 dead120 injured
20.4.–23.4. AustraliaHunter, Sydney (New South Wales)
Winter storm (East Coast Low), gusty winds, flash floods, storm surge, hail
7 deadAUD 950m (USD 691m) insured loss>AUD 1.2bn (USD 873m) total damage
21.4. IndiaPurnia, Bihar
Thunderstorms, large hail – 25 000 houses damaged
100 deadUSD 150m total damage
24.4.–28.4. United StatesTX, LA, KY, AL, GA, FL, MS
Thunderstorms, large hail, tornadoes, flash floods 4 deadUSD 600m–1bn insured lossUSD 950m total damage
26.4.–27.4. PakistanKhyber Pakhtunkhwa
Thunderstorms, strong winds, flash floods, tornadoes
49 dead267 injuredPKR 150m (USD 1m) total damage
27.4. India, Haryana Thunderstorms INR 6.92bn (USD 105m) total damage30.4.–4.5. Australia
Brisbane, Gold Coast (Queensland), New South Wales
Winter storm (East Coast Low), flash floods 4 deadAUD 349m (USD 254m) insured lossAUD 420m (USD 306m) total damage
3.5.–4.5. United StatesMN, NE, IA, WI, KS
Thunderstorms, hail, tornadoes, flash floods 1 dead40 injuredUSD 100–300m insured lossUSD 160m total damage
5.5.–8.5. ChinaGuangxi, Guangdong
Thunderstorms, hail 4 deadUSD 300m total damage
6.5.–13.5. United StatesOK, TX, CO, NE, SD, KS
Tornado outbreak (122), hail, strong winds, flash floods – severe damage in Oklahoma and Texas, – flash flood in Nebraska
4 deadUSD 600m–1bn insured lossUSD 1.4bn total damage
11.5. BangladeshFaridpur, Pabna
Thunderstorms, tornadoes (Nor’wester) 50 injured
13.5. GermanyKonstanz (Baden -Württemberg), Affing (Bavaria)
Tornado outbreak (EF3) with winds up to 250 km/h
9 injuredEUR 50m (USD 54m) insured lossEUR 55m (USD 60m) total damage
15.5. ItalyPiemonte, Lombardia
Thunderstorms (Storm Ferox), large hail, flash floods – damage to agriculture, damage to the Milan Malpensa airport
EUR 10m (USD 11m) insured lossEUR 100m (USD 109m) total damage
15.5.–17.5. United StatesTX, OK, MO, CO, KS, NE
Thunderstorms, tornadoes, hail, flash floods 2 deadUSD 100–300m insured lossUSD 160m total damage
19.5. IndiaAndhra Pradesh
Thunderstorms 23 dead
23.5. BangladeshDinajpur
Thunderstorms – 8 000 houses damaged, trees and electric poles uprooted
6 dead50 injuredUSD 1m total damage
23.5.–28.5. United StatesTX, OK, KS, LA, CO, AR, GA, OH, SC
Thunderstorms, tornadoes, hail – severe flooding in Texas and Oklahoma
31 deadUSD 1.46bn insured lossUSD 2.5bn total damage
25.5. MexicoAcuña, Coahuila
Tornado EF3, with winds up to 200 km/h – 247 houses destroyed, 450 damaged
13 dead229 injured
28.5.–30.5. United StatesTX, OK, CO, KS
Thunderstorms, tornadoes, large hail, flash floods USD 100–300m insured lossUSD 180m total damage
29.5.–1.6. ChinaShanxi, Shaanxi, Gansu, Jilin, Heilongjiang, Ningxia
Thunderstorms, hail USD 325m total damage
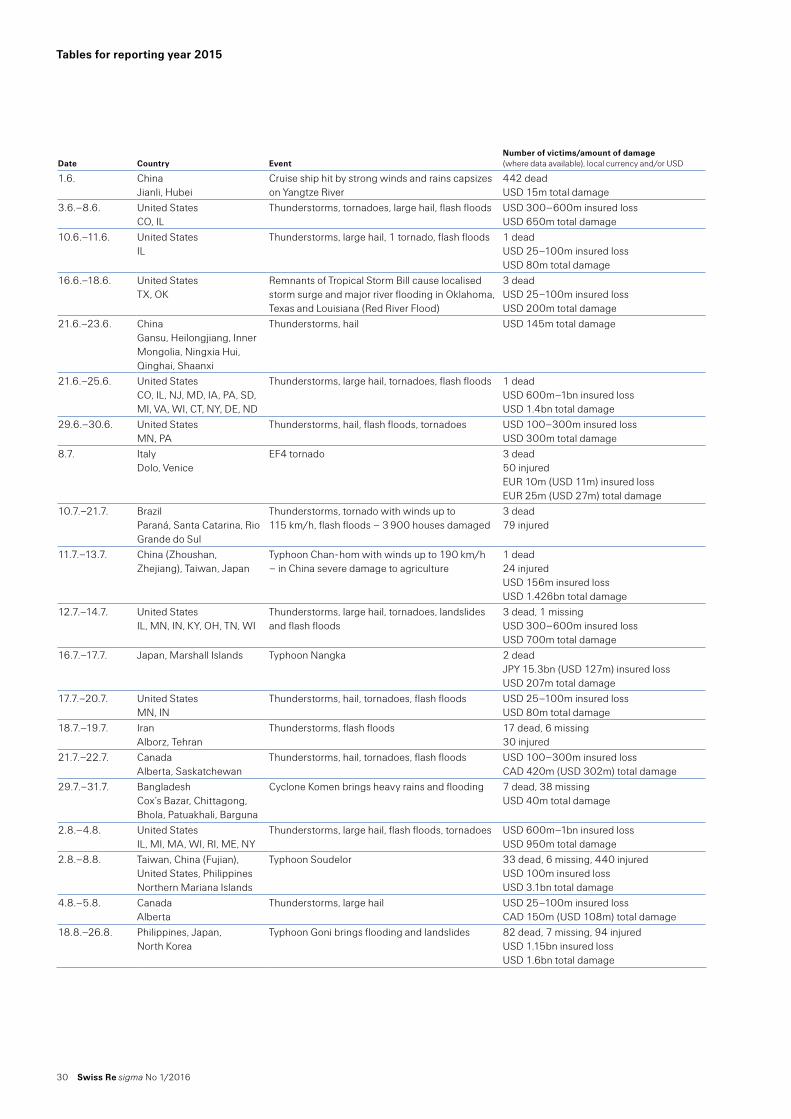
30 Swiss Re sigma No 1/2016
Tables for reporting year 2015
Date Country EventNumber of victims/amount of damage (where data available), local currency and/or USD
1.6. ChinaJianli, Hubei
Cruise ship hit by strong winds and rains capsizes on Yangtze River
442 deadUSD 15m total damage
3.6.–8.6. United StatesCO, IL
Thunderstorms, tornadoes, large hail, flash floods USD 300–600m insured lossUSD 650m total damage
10.6.–11.6. United StatesIL
Thunderstorms, large hail, 1 tornado, flash floods 1 deadUSD 25–100m insured lossUSD 80m total damage
16.6.–18.6. United StatesTX, OK
Remnants of Tropical Storm Bill cause localised storm surge and major river flooding in Oklahoma, Texas and Louisiana (Red River Flood)
3 deadUSD 25–100m insured lossUSD 200m total damage
21.6.–23.6. ChinaGansu, Heilongjiang, Inner Mongolia, Ningxia Hui, Qinghai, Shaanxi
Thunderstorms, hail USD 145m total damage
21.6.–25.6. United StatesCO, IL, NJ, MD, IA, PA, SD, MI, VA, WI, CT, NY, DE, ND
Thunderstorms, large hail, tornadoes, flash floods 1 deadUSD 600m–1bn insured lossUSD 1.4bn total damage
29.6.–30.6. United StatesMN, PA
Thunderstorms, hail, flash floods, tornadoes USD 100–300m insured lossUSD 300m total damage
8.7. ItalyDolo, Venice
EF4 tornado 3 dead50 injuredEUR 10m (USD 11m) insured lossEUR 25m (USD 27m) total damage
10.7.–21.7. BrazilParaná, Santa Catarina, Rio Grande do Sul
Thunderstorms, tornado with winds up to 115 km/h, flash floods – 3 900 houses damaged
3 dead79 injured
11.7.–13.7. China (Zhoushan, Zhejiang), Taiwan, Japan
Typhoon Chan-hom with winds up to 190 km/h – in China severe damage to agriculture
1 dead24 injuredUSD 156m insured lossUSD 1.426bn total damage
12.7.–14.7. United StatesIL, MN, IN, KY, OH, TN, WI
Thunderstorms, large hail, tornadoes, landslides and flash floods
3 dead, 1 missingUSD 300–600m insured lossUSD 700m total damage
16.7.–17.7. Japan, Marshall Islands Typhoon Nangka 2 deadJPY 15.3bn (USD 127m) insured lossUSD 207m total damage
17.7.–20.7. United StatesMN, IN
Thunderstorms, hail, tornadoes, flash floods USD 25–100m insured lossUSD 80m total damage
18.7.–19.7. IranAlborz, Tehran
Thunderstorms, flash floods 17 dead, 6 missing30 injured
21.7.–22.7. CanadaAlberta, Saskatchewan
Thunderstorms, hail, tornadoes, flash floods USD 100–300m insured lossCAD 420m (USD 302m) total damage
29.7.–31.7. BangladeshCox’s Bazar, Chittagong, Bhola, Patuakhali, Barguna
Cyclone Komen brings heavy rains and flooding 7 dead, 38 missingUSD 40m total damage
2.8.–4.8. United StatesIL, MI, MA, WI, RI, ME, NY
Thunderstorms, large hail, flash floods, tornadoes USD 600m–1bn insured lossUSD 950m total damage
2.8.–8.8. Taiwan, China (Fujian), United States, PhilippinesNorthern Mariana Islands
Typhoon Soudelor 33 dead, 6 missing, 440 injuredUSD 100m insured lossUSD 3.1bn total damage
4.8.–5.8. CanadaAlberta
Thunderstorms, large hail USD 25–100m insured lossCAD 150m (USD 108m) total damage
18.8.–26.8. Philippines, Japan,North Korea
Typhoon Goni brings flooding and landslides 82 dead, 7 missing, 94 injuredUSD 1.15bn insured lossUSD 1.6bn total damage
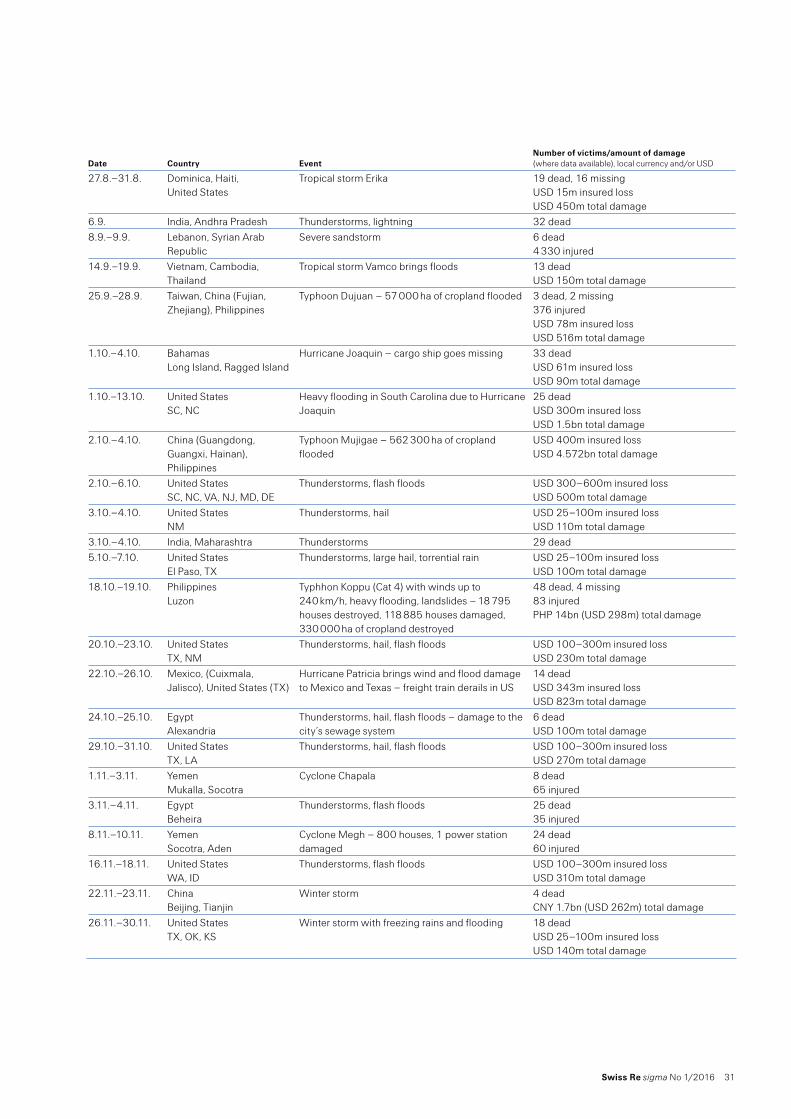
Swiss Re sigma No 1/2016 31
Date Country EventNumber of victims/amount of damage (where data available), local currency and/or USD
27.8.–31.8. Dominica, Haiti, United States
Tropical storm Erika 19 dead, 16 missingUSD 15m insured lossUSD 450m total damage
6.9. India, Andhra Pradesh Thunderstorms, lightning 32 dead8.9.–9.9. Lebanon, Syrian Arab
RepublicSevere sandstorm 6 dead
4 330 injured14.9.–19.9. Vietnam, Cambodia,
ThailandTropical storm Vamco brings floods 13 dead
USD 150m total damage25.9.–28.9. Taiwan, China (Fujian,
Zhejiang), PhilippinesTyphoon Dujuan – 57 000 ha of cropland flooded 3 dead, 2 missing
376 injuredUSD 78m insured lossUSD 516m total damage
1.10.–4.10. BahamasLong Island, Ragged Island
Hurricane Joaquin – cargo ship goes missing 33 deadUSD 61m insured lossUSD 90m total damage
1.10.–13.10. United StatesSC, NC
Heavy flooding in South Carolina due to Hurricane Joaquin
25 deadUSD 300m insured lossUSD 1.5bn total damage
2.10.–4.10. China (Guangdong, Guangxi, Hainan), Philippines
Typhoon Mujigae – 562 300 ha of cropland flooded
USD 400m insured lossUSD 4.572bn total damage
2.10.–6.10. United StatesSC, NC, VA, NJ, MD, DE
Thunderstorms, flash floods USD 300–600m insured lossUSD 500m total damage
3.10.–4.10. United StatesNM
Thunderstorms, hail USD 25–100m insured lossUSD 110m total damage
3.10.–4.10. India, Maharashtra Thunderstorms 29 dead5.10.–7.10. United States
El Paso, TXThunderstorms, large hail, torrential rain USD 25–100m insured loss
USD 100m total damage18.10.–19.10. Philippines
LuzonTyphhon Koppu (Cat 4) with winds up to 240 km/h, heavy flooding, landslides – 18 795 houses destroyed, 118 885 houses damaged, 330 000 ha of cropland destroyed
48 dead, 4 missing83 injuredPHP 14bn (USD 298m) total damage
20.10.–23.10. United StatesTX, NM
Thunderstorms, hail, flash floods USD 100–300m insured lossUSD 230m total damage
22.10.–26.10. Mexico, (Cuixmala, Jalisco), United States (TX)
Hurricane Patricia brings wind and flood damage to Mexico and Texas – freight train derails in US
14 deadUSD 343m insured lossUSD 823m total damage
24.10.–25.10. EgyptAlexandria
Thunderstorms, hail, flash floods – damage to the city’s sewage system
6 deadUSD 100m total damage
29.10.–31.10. United StatesTX, LA
Thunderstorms, hail, flash floods USD 100–300m insured lossUSD 270m total damage
1.11.–3.11. YemenMukalla, Socotra
Cyclone Chapala 8 dead65 injured
3.11.–4.11. EgyptBeheira
Thunderstorms, flash floods 25 dead35 injured
8.11.–10.11. YemenSocotra, Aden
Cyclone Megh – 800 houses, 1 power station damaged
24 dead60 injured
16.11.–18.11. United StatesWA, ID
Thunderstorms, flash floods USD 100–300m insured lossUSD 310m total damage
22.11.–23.11. ChinaBeijing, Tianjin
Winter storm 4 deadCNY 1.7bn (USD 262m) total damage
26.11.–30.11. United StatesTX, OK, KS
Winter storm with freezing rains and flooding 18 deadUSD 25–100m insured lossUSD 140m total damage
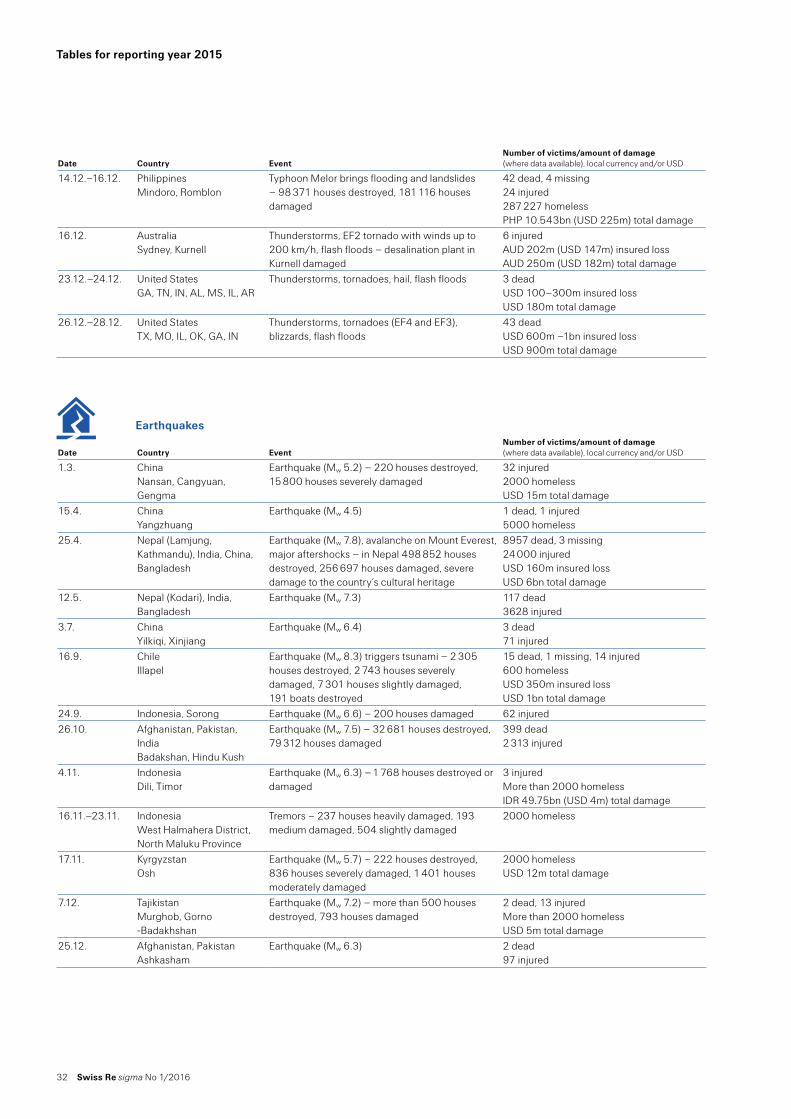
32 Swiss Re sigma No 1/2016
Tables for reporting year 2015
Date Country EventNumber of victims/amount of damage (where data available), local currency and/or USD
14.12.–16.12. PhilippinesMindoro, Romblon
Typhoon Melor brings flooding and landslides – 98 371 houses destroyed, 181 116 houses damaged
42 dead, 4 missing24 injured287 227 homelessPHP 10.543bn (USD 225m) total damage
16.12. AustraliaSydney, Kurnell
Thunderstorms, EF2 tornado with winds up to 200 km/h, flash floods – desalination plant in Kurnell damaged
6 injuredAUD 202m (USD 147m) insured lossAUD 250m (USD 182m) total damage
23.12.–24.12. United StatesGA, TN, IN, AL, MS, IL, AR
Thunderstorms, tornadoes, hail, flash floods 3 deadUSD 100–300m insured lossUSD 180m total damage
26.12.–28.12. United StatesTX, MO, IL, OK, GA, IN
Thunderstorms, tornadoes (EF4 and EF3), blizzards, flash floods
43 deadUSD 600m –1bn insured lossUSD 900m total damage
Earthquakes
Date Country EventNumber of victims/amount of damage (where data available), local currency and/or USD
1.3. ChinaNansan, Cangyuan, Gengma
Earthquake (Mw 5.2) – 220 houses destroyed, 15 800 houses severely damaged
32 injured2000 homelessUSD 15m total damage
15.4. ChinaYangzhuang
Earthquake (Mw 4.5) 1 dead, 1 injured5000 homeless
25.4. Nepal (Lamjung, Kathmandu), India, China, Bangladesh
Earthquake (Mw 7.8), avalanche on Mount Everest, major aftershocks – in Nepal 498 852 houses destroyed, 256 697 houses damaged, severe damage to the country’s cultural heritage
8957 dead, 3 missing24 000 injuredUSD 160m insured lossUSD 6bn total damage
12.5. Nepal (Kodari), India, Bangladesh
Earthquake (Mw 7.3) 117 dead3628 injured
3.7. ChinaYilkiqi, Xinjiang
Earthquake (Mw 6.4) 3 dead71 injured
16.9. ChileIllapel
Earthquake (Mw 8.3) triggers tsunami – 2 305 houses destroyed, 2 743 houses severely damaged, 7 301 houses slightly damaged, 191 boats destroyed
15 dead, 1 missing, 14 injured600 homelessUSD 350m insured lossUSD 1bn total damage
24.9. Indonesia, Sorong Earthquake (Mw 6.6) – 200 houses damaged 62 injured26.10. Afghanistan, Pakistan,
IndiaBadakshan, Hindu Kush
Earthquake (Mw 7.5) – 32 681 houses destroyed, 79 312 houses damaged
399 dead2 313 injured
4.11. IndonesiaDili, Timor
Earthquake (Mw 6.3) – 1 768 houses destroyed or damaged
3 injuredMore than 2000 homelessIDR 49.75bn (USD 4m) total damage
16.11.–23.11. IndonesiaWest Halmahera District, North Maluku Province
Tremors – 237 houses heavily damaged, 193 medium damaged, 504 slightly damaged
2000 homeless
17.11. KyrgyzstanOsh
Earthquake (Mw 5.7) – 222 houses destroyed, 836 houses severely damaged, 1 401 houses moderately damaged
2000 homelessUSD 12m total damage
7.12. TajikistanMurghob, Gorno -Badakhshan
Earthquake (Mw 7.2) – more than 500 houses destroyed, 793 houses damaged
2 dead, 13 injuredMore than 2000 homelessUSD 5m total damage
25.12. Afghanistan, PakistanAshkasham
Earthquake (Mw 6.3) 2 dead97 injured
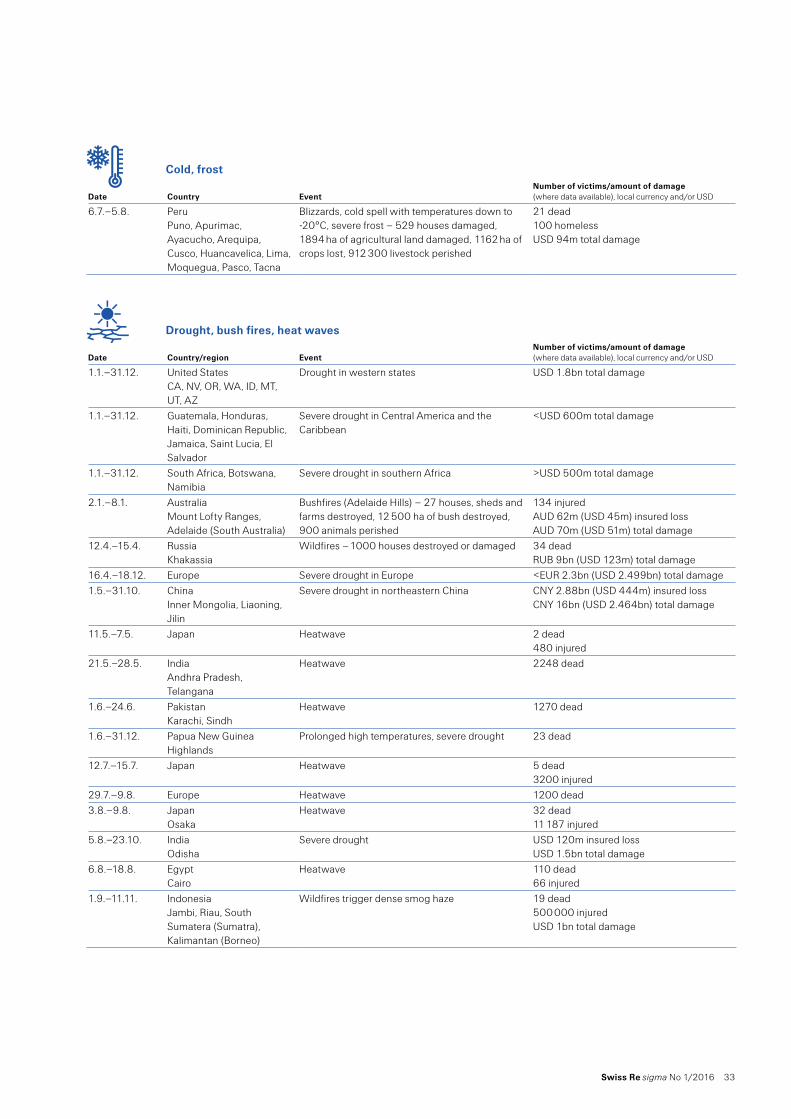
Swiss Re sigma No 1/2016 33
Cold, frost
Date Country EventNumber of victims/amount of damage (where data available), local currency and/or USD
6.7.–5.8. PeruPuno, Apurimac, Ayacucho, Arequipa, Cusco, Huancavelica, Lima, Moquegua, Pasco, Tacna
Blizzards, cold spell with temperatures down to -20°C, severe frost – 529 houses damaged, 1894 ha of agricultural land damaged, 1162 ha of crops lost, 912 300 livestock perished
21 dead100 homelessUSD 94m total damage
Drought, bush fires, heat waves
Date Country/region EventNumber of victims/amount of damage (where data available), local currency and/or USD
1.1.–31.12. United StatesCA, NV, OR, WA, ID, MT, UT, AZ
Drought in western states USD 1.8bn total damage
1.1.–31.12. Guatemala, Honduras, Haiti, Dominican Republic, Jamaica, Saint Lucia, El Salvador
Severe drought in Central America and the Caribbean
<USD 600m total damage
1.1.–31.12. South Africa, Botswana, Namibia
Severe drought in southern Africa >USD 500m total damage
2.1.–8.1. AustraliaMount Lofty Ranges, Adelaide (South Australia)
Bushfires (Adelaide Hills) – 27 houses, sheds and farms destroyed, 12 500 ha of bush destroyed, 900 animals perished
134 injuredAUD 62m (USD 45m) insured lossAUD 70m (USD 51m) total damage
12.4.–15.4. RussiaKhakassia
Wildfires – 1000 houses destroyed or damaged 34 deadRUB 9bn (USD 123m) total damage
16.4.–18.12. Europe Severe drought in Europe <EUR 2.3bn (USD 2.499bn) total damage1.5.–31.10. China
Inner Mongolia, Liaoning, Jilin
Severe drought in northeastern China CNY 2.88bn (USD 444m) insured lossCNY 16bn (USD 2.464bn) total damage
11.5.–7.5. Japan Heatwave 2 dead480 injured
21.5.–28.5. IndiaAndhra Pradesh, Telangana
Heatwave 2248 dead
1.6.–24.6. PakistanKarachi, Sindh
Heatwave 1270 dead
1.6.–31.12. Papua New GuineaHighlands
Prolonged high temperatures, severe drought 23 dead
12.7.–15.7. Japan Heatwave 5 dead3200 injured
29.7.–9.8. Europe Heatwave 1200 dead3.8.–9.8. Japan
OsakaHeatwave 32 dead
11 187 injured5.8.–23.10. India
OdishaSevere drought USD 120m insured loss
USD 1.5bn total damage6.8.–18.8. Egypt
CairoHeatwave 110 dead
66 injured1.9.–11.11. Indonesia
Jambi, Riau, South Sumatera (Sumatra), Kalimantan (Borneo)
Wildfires trigger dense smog haze 19 dead500 000 injuredUSD 1bn total damage

34 Swiss Re sigma No 1/2016
Tables for reporting year 2015
Date Country EventNumber of victims/amount of damage (where data available), local currency and/or USD
9.9.–14.9. United StatesAmador, Calaveras (CA)
Wildland fire “Butte Fire” – 475 houses destroyed, 45 structures damaged, 28 679 ha of forest destroyed
2 dead, 1 injuredUSD 300–600m insured lossUSD 400m total damage
12.9.–14.9. United StatesLake, Napa, Sonoma (CA)
Wildland fire “Valley Fire” – 1280 houses, 27 multi-family structures, 66 commercial properties, and 585 other minor structures destroyed. 41 houses, 7 commercial buildings damaged, 30 783 ha of forest destroyed
4 dead4 injuredUSD 600m–1bn insured lossUSD 1.4bn total damage
14.9.–17.9. ColombiaBoyacá, Cundinamarca
Severe wildfires COP 476bn (USD 150m) total damage
15.11.–21.11. AustraliaEsperance, Western Australia
Large bushfires destroy 145 000 ha of land including vast areas of cropping land
4 deadAUD 17m (USD 12m) insured lossAUD 150m (USD 109m) total damage
25.11.–28.11. AustraliaBalaklava, Roseworthy, South Australia
Pinerey Bushfires – 85 000 ha of agricultural land burnt
2 dead, 13 injuredAUD 170m (USD 124m) insured lossAUD 200m (USD 146m) total damage
25.12.–26.12. AustraliaVictoria
Great Ocean Road bushfires – 116 houses destroyed
AUD 87m (USD 63m) insured lossAUD 100m (USD 73m) total damage
Hail
Date Country EventNumber of victims/amount of damage (where data available), local currency and/or USD
7.4. IndiaBareilly, Uttar Pradesh
Hailstorm INR 8bn (USD 121m) total damage
25.4. AustraliaSydney
Anzac Day hailstorm – damage to commercial facilities and to agriculture
AUD 421m (USD 306m) insured lossAUD 500m (USD 364m) total damage
5.9. ItalyPozzuoli (Campania), Emilia Romagna, Lombardia
Series of hailstorms cause damage to agriculture and vehicles
2 injuredEUR 90m (USD 98m) total damage
Other natural catastrophes
Date Country EventNumber of victims/amount of damage (where data available), local currency and/or USD
1.10. GuatemalaEl Cambray II, Santa Catarina Pinula
Landslide – 73 houses severely damaged, 111 houses damaged
280 dead, 70 missing27 injured407 homelessUSD 5m total damage
Note: Table 8 uses loss ranges for US natural catastrophes as defined by Property Claim Services.
Source: Swiss Re Economic Research & Consulting and Cat Perils.

Swiss Re sigma No 1/2016 35
Table 9 Chronological list of all man-made disasters 2015
Aviation disasters
Date Country EventNumber of victims (where data available)
18.1. Syrian Arab RepublicAbu adh Dhuhur
Syrian Air Force Antonov 26 plane crashes on landing approach
30 dead
4.2. TaiwanTaipei
TransAsia Airways ATR 72-600 plane crashes after take off
43 dead
24.3. FranceBarcelonnette
Germanwings Airbus A320-211 crashes due to pilot suicide
150 dead
2.4. YemenAden
Yemenia Boeing 747SP destroyed during a gun battle at Aden International Airport
12.4. Space Loss of contact with Egypt-Sat 2, a remote sensing satellite
14.4. JapanHiroshima
Asiana Airlines Airbus A320-232 plane written off after hard landing
27 injured
25.4. TurkeyIstanbul
A Turkish Airlines Airbus A320-232 catches fire on landing
28.4. Space Russian ISS resupply craft lost due to early separation from rocket
9.5. Space Airbus A400M plane crashes during a test flight 4 dead, 2 injured16.5. Space Mexsat satellite crashes due to faulty launch28.6. Space
Cape CanaveralNASA ISS resupply rocket explodes shortly after launch
30.6. IndonesiaMedan
TNI-AU Lockheed C-130B Hercules plane crashes shortly after takeoff
139 dead
16.8. IndonesiaOksibil
Trigana Air Service ATR 42-300 crashes before landing
54 dead
31.10. EgyptAl-Arish, Sinai
Metrojet Airbus A321-231 plane crashes shortly after takeoff allegedly due to bomb onboard
224 dead
4.11. SudanJuba
Allied Services Ltd Antonov 12BK cargo plane crashes shortly after takeoff
41 dead
21.11. Space Loss of contact with Amos 5, a commercial satellite
Major fires, explosions
Date Country EventNumber of victims (where data available)
10.1. United States, Ohio Explosion and fire at an oil refinery10.1. South Korea
UijeongbuFire at a multi-storey apartment block 5 dead
125 injured11.1. Bangladesh
DhakaFire in a shanty town 2 dead
2000 homeless29.1. Mexico
Mexico CityGas leak causes an explosion at a children’s hospital
2 dead72 injured
5.2. UKStaverton
Fire at an electrical plant
16.2. GermanyRechterfeld
Fire at an animal feed factory
3.3. United StatesDuryea, PA
Fire at a glass-making facility
11.3. RussiaKazan
Fire at a shopping centre 17 dead55 injured
12.3. BangladeshMongla, Bagerhat
Under-construction roof at a cement factory collapses
5 dead50 injured
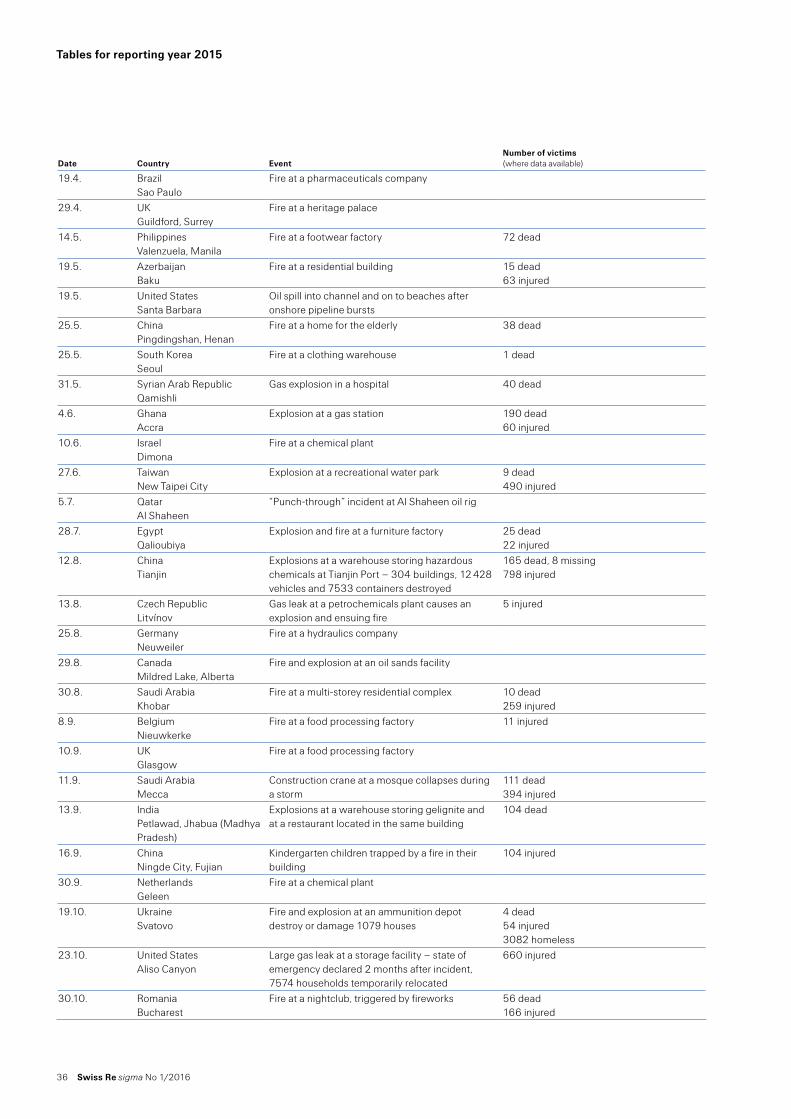
36 Swiss Re sigma No 1/2016
Tables for reporting year 2015
Date Country EventNumber of victims (where data available)
19.4. BrazilSao Paulo
Fire at a pharmaceuticals company
29.4. UKGuildford, Surrey
Fire at a heritage palace
14.5. PhilippinesValenzuela, Manila
Fire at a footwear factory 72 dead
19.5. AzerbaijanBaku
Fire at a residential building 15 dead63 injured
19.5. United StatesSanta Barbara
Oil spill into channel and on to beaches after onshore pipeline bursts
25.5. ChinaPingdingshan, Henan
Fire at a home for the elderly 38 dead
25.5. South KoreaSeoul
Fire at a clothing warehouse 1 dead
31.5. Syrian Arab RepublicQamishli
Gas explosion in a hospital 40 dead
4.6. GhanaAccra
Explosion at a gas station 190 dead60 injured
10.6. IsraelDimona
Fire at a chemical plant
27.6. TaiwanNew Taipei City
Explosion at a recreational water park 9 dead490 injured
5.7. QatarAl Shaheen
“Punch-through” incident at Al Shaheen oil rig
28.7. EgyptQalioubiya
Explosion and fire at a furniture factory 25 dead22 injured
12.8. ChinaTianjin
Explosions at a warehouse storing hazardous chemicals at Tianjin Port – 304 buildings, 12 428 vehicles and 7533 containers destroyed
165 dead, 8 missing798 injured
13.8. Czech RepublicLitvínov
Gas leak at a petrochemicals plant causes an explosion and ensuing fire
5 injured
25.8. GermanyNeuweiler
Fire at a hydraulics company
29.8. CanadaMildred Lake, Alberta
Fire and explosion at an oil sands facility
30.8. Saudi ArabiaKhobar
Fire at a multi-storey residential complex 10 dead259 injured
8.9. BelgiumNieuwkerke
Fire at a food processing factory 11 injured
10.9. UKGlasgow
Fire at a food processing factory
11.9. Saudi ArabiaMecca
Construction crane at a mosque collapses during a storm
111 dead394 injured
13.9. IndiaPetlawad, Jhabua (Madhya Pradesh)
Explosions at a warehouse storing gelignite and at a restaurant located in the same building
104 dead
16.9. ChinaNingde City, Fujian
Kindergarten children trapped by a fire in their building
104 injured
30.9. NetherlandsGeleen
Fire at a chemical plant
19.10. UkraineSvatovo
Fire and explosion at an ammunition depot destroy or damage 1079 houses
4 dead54 injured3082 homeless
23.10. United StatesAliso Canyon
Large gas leak at a storage facility – state of emergency declared 2 months after incident, 7574 households temporarily relocated
660 injured
30.10. RomaniaBucharest
Fire at a nightclub, triggered by fireworks 56 dead166 injured
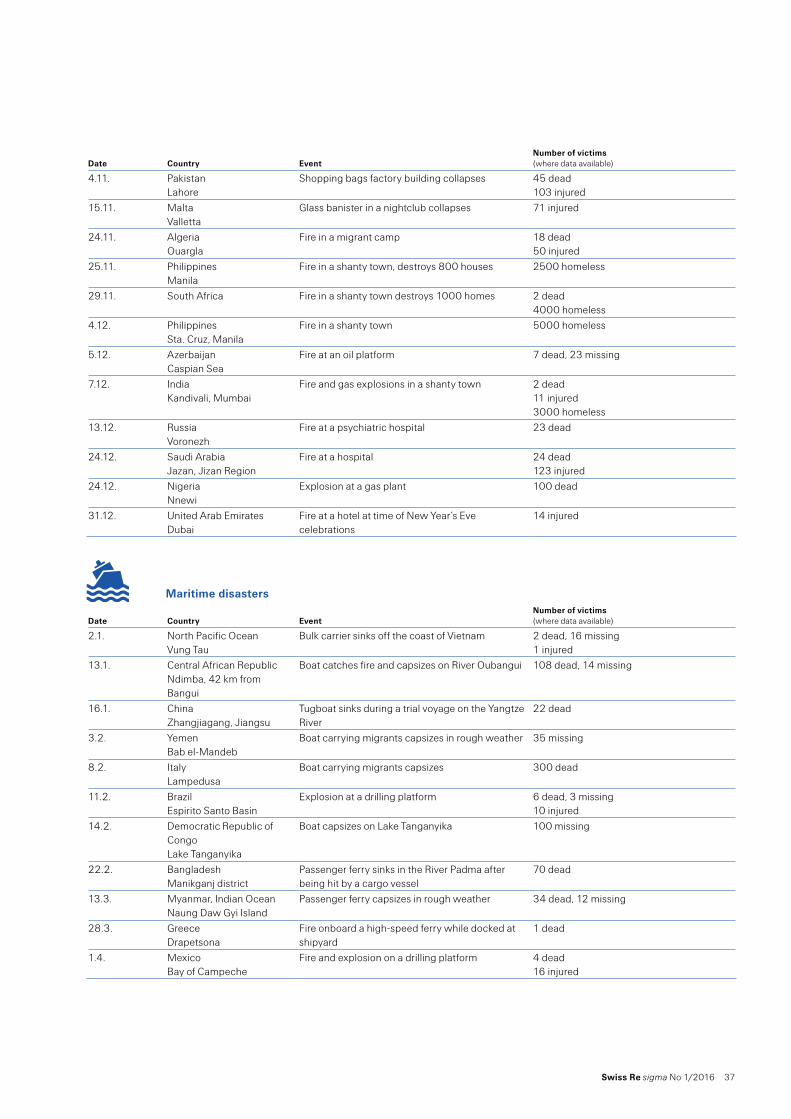
Swiss Re sigma No 1/2016 37
Date Country EventNumber of victims (where data available)
4.11. PakistanLahore
Shopping bags factory building collapses 45 dead103 injured
15.11. MaltaValletta
Glass banister in a nightclub collapses 71 injured
24.11. AlgeriaOuargla
Fire in a migrant camp 18 dead50 injured
25.11. PhilippinesManila
Fire in a shanty town, destroys 800 houses 2500 homeless
29.11. South Africa Fire in a shanty town destroys 1000 homes 2 dead4000 homeless
4.12. PhilippinesSta. Cruz, Manila
Fire in a shanty town 5000 homeless
5.12. AzerbaijanCaspian Sea
Fire at an oil platform 7 dead, 23 missing
7.12. IndiaKandivali, Mumbai
Fire and gas explosions in a shanty town 2 dead11 injured3000 homeless
13.12. RussiaVoronezh
Fire at a psychiatric hospital 23 dead
24.12. Saudi ArabiaJazan, Jizan Region
Fire at a hospital 24 dead123 injured
24.12. NigeriaNnewi
Explosion at a gas plant 100 dead
31.12. United Arab EmiratesDubai
Fire at a hotel at time of New Year’s Eve celebrations
14 injured
Maritime disasters
Date Country EventNumber of victims (where data available)
2.1. North Pacific OceanVung Tau
Bulk carrier sinks off the coast of Vietnam 2 dead, 16 missing1 injured
13.1. Central African RepublicNdimba, 42 km from Bangui
Boat catches fire and capsizes on River Oubangui 108 dead, 14 missing
16.1. ChinaZhangjiagang, Jiangsu
Tugboat sinks during a trial voyage on the Yangtze River
22 dead
3.2. YemenBab el-Mandeb
Boat carrying migrants capsizes in rough weather 35 missing
8.2. ItalyLampedusa
Boat carrying migrants capsizes 300 dead
11.2. BrazilEspirito Santo Basin
Explosion at a drilling platform 6 dead, 3 missing10 injured
14.2. Democratic Republic of CongoLake Tanganyika
Boat capsizes on Lake Tanganyika 100 missing
22.2. BangladeshManikganj district
Passenger ferry sinks in the River Padma after being hit by a cargo vessel
70 dead
13.3. Myanmar, Indian OceanNaung Daw Gyi Island
Passenger ferry capsizes in rough weather 34 dead, 12 missing
28.3. GreeceDrapetsona
Fire onboard a high-speed ferry while docked at shipyard
1 dead
1.4. MexicoBay of Campeche
Fire and explosion on a drilling platform 4 dead16 injured

38 Swiss Re sigma No 1/2016
Tables for reporting year 2015
Date Country EventNumber of victims (where data available)
1.4. Russia, North Pacific Ocean, Kamchatka Peninsula, Sea of Okhotsk
Fishing vessel sinks after hitting ice 57 dead, 12 missing
13.4. Mediterranean SeaItaly
Boat carrying migrants capsizes 400 missing
16.4. Mediterranean Seaoff Sicily
Boat carrying migrants capsizes 41 missing
19.4. Libyan Arab JamahiriyaZuwarah, Tripoli
Boat carrying migrants capsizes 24 dead, 798 missing
28.4. Mediterranean Sea Spain, Majorca
Fire on board a passenger ferry
5.5. MexicoBay of Campeche
Offshore oil rig tilts during maintenance operations
2 dead10 injured
15.5. Falkland Islands Blowout at an oil rig11.6. Indian Ocean
Indonesia, Makassar StraitPassenger ferry sinks in unknown circumstances 22 missing
27.6. TurkeyDardanelles Strait
Passenger vessel collides with tanker; both damaged
2.7. Pacific Ocean Philippines, Ormoc City
Ferry capsizes in rough weather 61 dead
30.7. Indian OceanBangladesh Sadar, Bhola
Three fishing boats capsize in rough weather 4 dead, 24 missing
3.9. Indian Ocean, MalaysiaSabak Bernam, Selangor
Boat carrying migrant workers capsizes in rough weather
61 dead
13.9. Mediterranean SeaGreece, Farmakonisi Island
Boat carrying migrants capsizes 34 dead
15.9. Mediterranean SeaGreece, Kos
Boat carrying migrants capsizes 22 dead
20.9. Indian OceanBangladesh, Patuakhali
Five fishing boats capsize in rough weather 47 missing
20.9. Indian OceanBangladesh, Barguna
Five fishing boats capsize in rough weather 20 missing
25.10. North Pacific OceanHong Kong
High-speed ferry hits floating object 124 injured
30.11. Democratic Republic of Congo, Bukavu
Boat capsizes on Lake Kivu 1 dead, 22 missing
4.12. Guneshli oil field, Caspian Sea, Azerbaijan
Fire on a drilling platform during a storm – 30 people die in a lifeboat during rescue operations, damage to gas pipeline
10 dead, 20 missing9 injured
19.12. Indian Ocean, Indonesia, Bone Bay, Siwa, Sulawesi
Ferry capsizes in rough weather 66 dead, 12 missing37 injured
Mining accidents
Date Country EventNumber of victims (where data available)
4.3. Ukraine, Donetsk Oblast Gas explosion at a coal mine 33 dead19.4. China, Datong City, Shanxi Wall failure at a coal mine traps miners 21 dead12.8. China, Shanyang, Shaanxi Landslide at a vanadium mine buries dormitories
and three residential buildings9 dead, 56 missing
10.10. China, Shangrao, Jiangxi Gas explosion at a coal mine 22 dead5.11. Brazil
Bento Rodrigues (Mariana)Two dams at an iron ore mine collapse – triggers mudflow at a nearby town and contaminates waterways
13 dead, 11 missing637 homeless
20.11. China, Jixi, Heilongjiang Fire at a coal mine 22 dead21.11. Myanmar
Hpakant, KachinLandslide at a jade mine buries workers and 80 residential buildings
115 dead
25.12. Myanmar, Hpakant Landslide at a gold and jade mine 50 missing
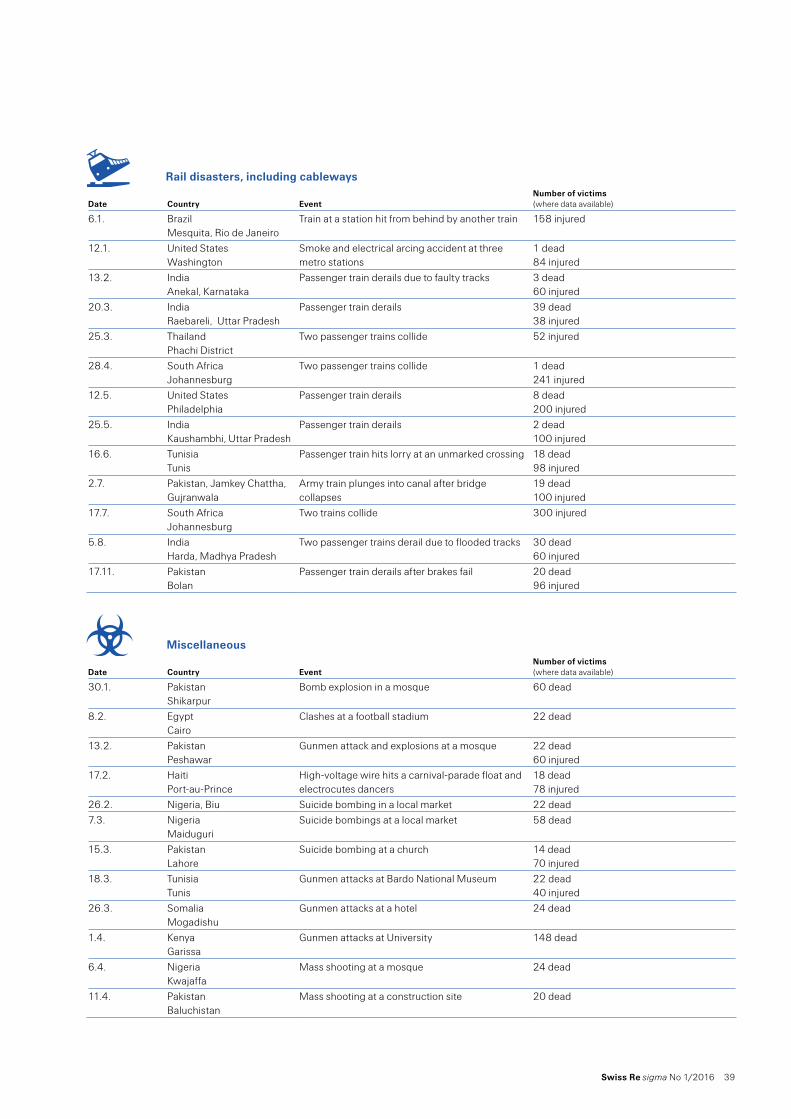
Swiss Re sigma No 1/2016 39
Rail disasters, including cableways
Date Country EventNumber of victims (where data available)
6.1. BrazilMesquita, Rio de Janeiro
Train at a station hit from behind by another train 158 injured
12.1. United StatesWashington
Smoke and electrical arcing accident at three metro stations
1 dead84 injured
13.2. IndiaAnekal, Karnataka
Passenger train derails due to faulty tracks 3 dead60 injured
20.3. IndiaRaebareli, Uttar Pradesh
Passenger train derails 39 dead38 injured
25.3. ThailandPhachi District
Two passenger trains collide 52 injured
28.4. South AfricaJohannesburg
Two passenger trains collide 1 dead241 injured
12.5. United StatesPhiladelphia
Passenger train derails 8 dead200 injured
25.5. IndiaKaushambhi, Uttar Pradesh
Passenger train derails 2 dead100 injured
16.6. TunisiaTunis
Passenger train hits lorry at an unmarked crossing 18 dead98 injured
2.7. Pakistan, Jamkey Chattha, Gujranwala
Army train plunges into canal after bridge collapses
19 dead100 injured
17.7. South AfricaJohannesburg
Two trains collide 300 injured
5.8. IndiaHarda, Madhya Pradesh
Two passenger trains derail due to flooded tracks 30 dead60 injured
17.11. PakistanBolan
Passenger train derails after brakes fail 20 dead96 injured
Miscellaneous
Date Country EventNumber of victims (where data available)
30.1. PakistanShikarpur
Bomb explosion in a mosque 60 dead
8.2. EgyptCairo
Clashes at a football stadium 22 dead
13.2. PakistanPeshawar
Gunmen attack and explosions at a mosque 22 dead60 injured
17.2. HaitiPort-au-Prince
High-voltage wire hits a carnival-parade float and electrocutes dancers
18 dead78 injured
26.2. Nigeria, Biu Suicide bombing in a local market 22 dead7.3. Nigeria
MaiduguriSuicide bombings at a local market 58 dead
15.3. PakistanLahore
Suicide bombing at a church 14 dead70 injured
18.3. TunisiaTunis
Gunmen attacks at Bardo National Museum 22 dead40 injured
26.3. SomaliaMogadishu
Gunmen attacks at a hotel 24 dead
1.4. KenyaGarissa
Gunmen attacks at University 148 dead
6.4. NigeriaKwajaffa
Mass shooting at a mosque 24 dead
11.4. PakistanBaluchistan
Mass shooting at a construction site 20 dead
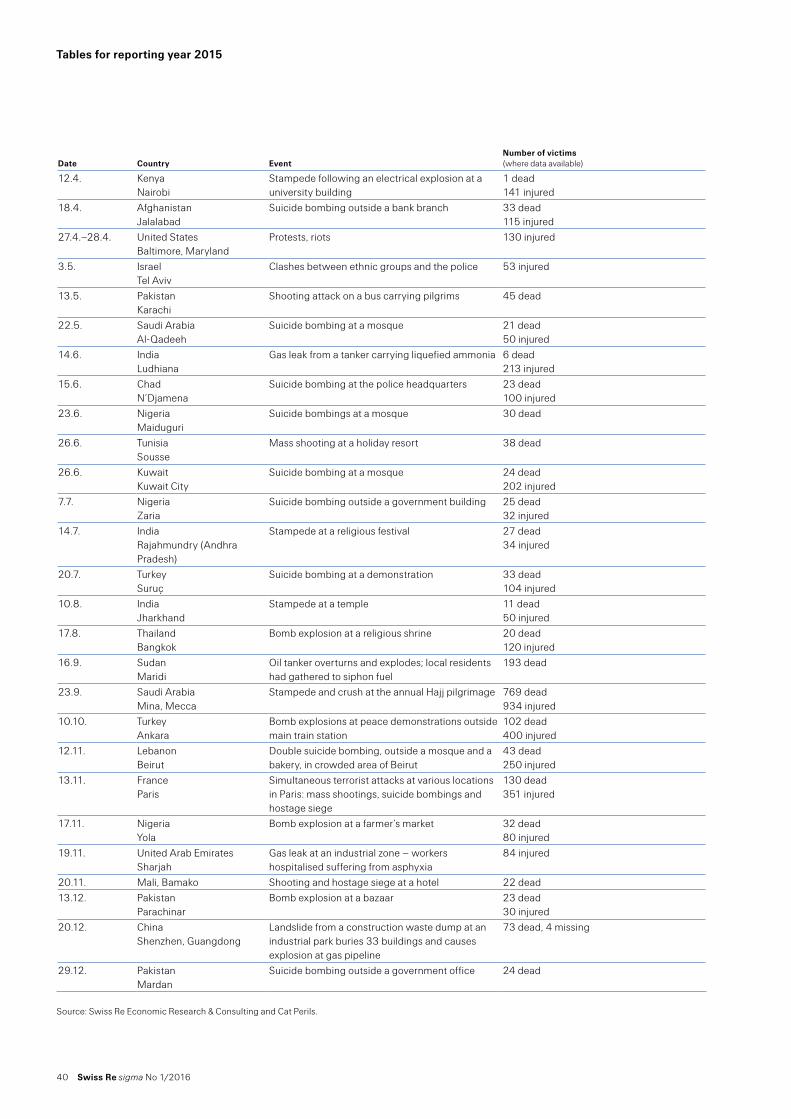
40 Swiss Re sigma No 1/2016
Tables for reporting year 2015
Date Country EventNumber of victims (where data available)
12.4. KenyaNairobi
Stampede following an electrical explosion at a university building
1 dead141 injured
18.4. AfghanistanJalalabad
Suicide bombing outside a bank branch 33 dead115 injured
27.4.–28.4. United StatesBaltimore, Maryland
Protests, riots 130 injured
3.5. IsraelTel Aviv
Clashes between ethnic groups and the police 53 injured
13.5. PakistanKarachi
Shooting attack on a bus carrying pilgrims 45 dead
22.5. Saudi ArabiaAl-Qadeeh
Suicide bombing at a mosque 21 dead50 injured
14.6. IndiaLudhiana
Gas leak from a tanker carrying liquefied ammonia 6 dead213 injured
15.6. ChadN’Djamena
Suicide bombing at the police headquarters 23 dead100 injured
23.6. NigeriaMaiduguri
Suicide bombings at a mosque 30 dead
26.6. TunisiaSousse
Mass shooting at a holiday resort 38 dead
26.6. KuwaitKuwait City
Suicide bombing at a mosque 24 dead202 injured
7.7. NigeriaZaria
Suicide bombing outside a government building 25 dead32 injured
14.7. IndiaRajahmundry (Andhra Pradesh)
Stampede at a religious festival 27 dead34 injured
20.7. TurkeySuruç
Suicide bombing at a demonstration 33 dead104 injured
10.8. IndiaJharkhand
Stampede at a temple 11 dead50 injured
17.8. ThailandBangkok
Bomb explosion at a religious shrine 20 dead120 injured
16.9. SudanMaridi
Oil tanker overturns and explodes; local residents had gathered to siphon fuel
193 dead
23.9. Saudi ArabiaMina, Mecca
Stampede and crush at the annual Hajj pilgrimage 769 dead934 injured
10.10. TurkeyAnkara
Bomb explosions at peace demonstrations outside main train station
102 dead400 injured
12.11. LebanonBeirut
Double suicide bombing, outside a mosque and a bakery, in crowded area of Beirut
43 dead250 injured
13.11. FranceParis
Simultaneous terrorist attacks at various locations in Paris: mass shootings, suicide bombings and hostage siege
130 dead351 injured
17.11. NigeriaYola
Bomb explosion at a farmer’s market 32 dead80 injured
19.11. United Arab EmiratesSharjah
Gas leak at an industrial zone – workers hospitalised suffering from asphyxia
84 injured
20.11. Mali, Bamako Shooting and hostage siege at a hotel 22 dead13.12. Pakistan
ParachinarBomb explosion at a bazaar 23 dead
30 injured20.12. China
Shenzhen, GuangdongLandslide from a construction waste dump at an industrial park buries 33 buildings and causes explosion at gas pipeline
73 dead, 4 missing
29.12. PakistanMardan
Suicide bombing outside a government office 24 dead
Source: Swiss Re Economic Research & Consulting and Cat Perils.
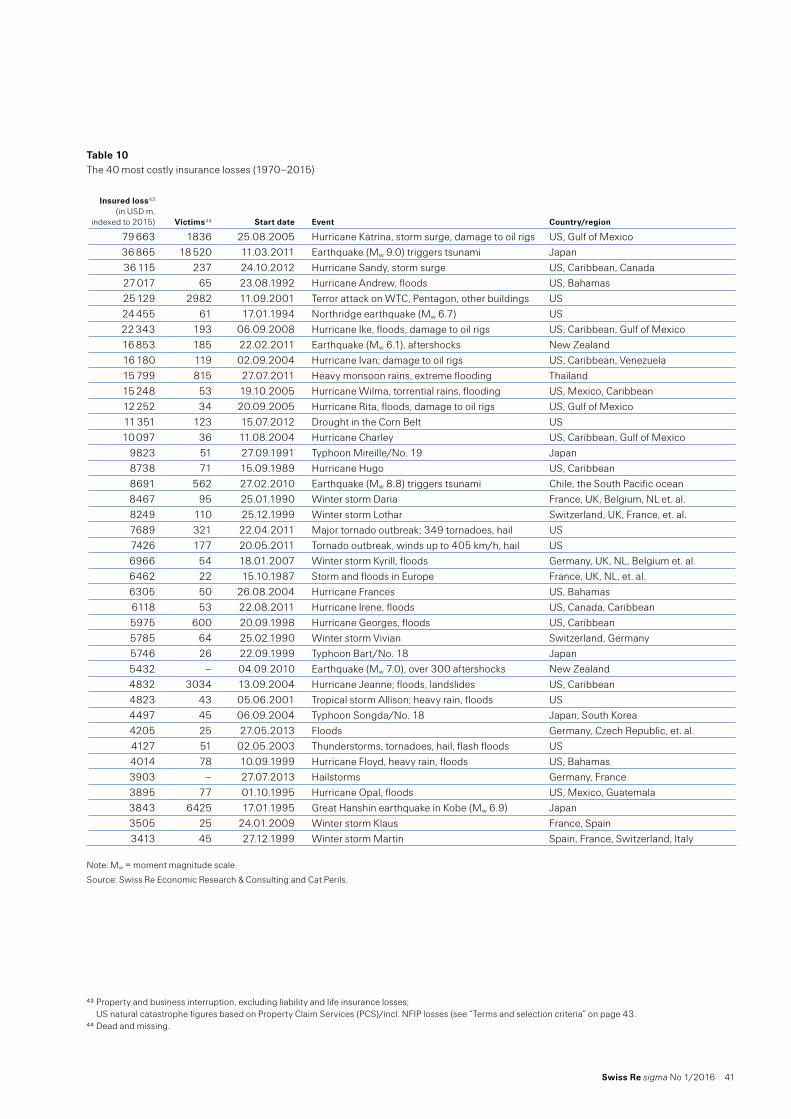
Swiss Re sigma No 1/2016 41
Table 10 The 40 most costly insurance losses (1970–2015)
Insured loss43 (in USD m,
indexed to 2015) Victims44 Start date Event Country/region
79 663 1836 25.08.2005 Hurricane Katrina, storm surge, damage to oil rigs US, Gulf of Mexico36 865 18 520 11.03.2011 Earthquake (Mw 9.0) triggers tsunami Japan36 115 237 24.10.2012 Hurricane Sandy, storm surge US, Caribbean, Canada27 017 65 23.08.1992 Hurricane Andrew, floods US, Bahamas25 129 2982 11.09.2001 Terror attack on WTC, Pentagon, other buildings US24 455 61 17.01.1994 Northridge earthquake (Mw 6.7) US22 343 193 06.09.2008 Hurricane Ike, floods, damage to oil rigs US, Caribbean, Gulf of Mexico16 853 185 22.02.2011 Earthquake (Mw 6.1), aftershocks New Zealand16 180 119 02.09.2004 Hurricane Ivan; damage to oil rigs US, Caribbean, Venezuela15 799 815 27.07.2011 Heavy monsoon rains, extreme flooding Thailand15 248 53 19.10.2005 Hurricane Wilma, torrential rains, flooding US, Mexico, Caribbean12 252 34 20.09.2005 Hurricane Rita, floods, damage to oil rigs US, Gulf of Mexico11 351 123 15.07.2012 Drought in the Corn Belt US10 097 36 11.08.2004 Hurricane Charley US, Caribbean, Gulf of Mexico
9823 51 27.09.1991 Typhoon Mireille/No. 19 Japan8738 71 15.09.1989 Hurricane Hugo US, Caribbean8691 562 27.02.2010 Earthquake (Mw 8.8) triggers tsunami Chile, the South Pacific ocean8467 95 25.01.1990 Winter storm Daria France, UK, Belgium, NL et. al.8249 110 25.12.1999 Winter storm Lothar Switzerland, UK, France, et. al.7689 321 22.04.2011 Major tornado outbreak; 349 tornadoes, hail US7426 177 20.05.2011 Tornado outbreak, winds up to 405 km/h, hail US6966 54 18.01.2007 Winter storm Kyrill, floods Germany, UK, NL, Belgium et. al.6462 22 15.10.1987 Storm and floods in Europe France, UK, NL, et. al.6305 50 26.08.2004 Hurricane Frances US, Bahamas6118 53 22.08.2011 Hurricane Irene, floods US, Canada, Caribbean5975 600 20.09.1998 Hurricane Georges, floods US, Caribbean5785 64 25.02.1990 Winter storm Vivian Switzerland, Germany5746 26 22.09.1999 Typhoon Bart/No. 18 Japan5432 – 04.09.2010 Earthquake (Mw 7.0), over 300 aftershocks New Zealand4832 3034 13.09.2004 Hurricane Jeanne; floods, landslides US, Caribbean4823 43 05.06.2001 Tropical storm Allison; heavy rain, floods US4497 45 06.09.2004 Typhoon Songda/No. 18 Japan, South Korea4205 25 27.05.2013 Floods Germany, Czech Republic, et. al.4127 51 02.05.2003 Thunderstorms, tornadoes, hail, flash floods US4014 78 10.09.1999 Hurricane Floyd, heavy rain, floods US, Bahamas3903 – 27.07.2013 Hailstorms Germany, France3895 77 01.10.1995 Hurricane Opal, floods US, Mexico, Guatemala3843 6425 17.01.1995 Great Hanshin earthquake in Kobe (Mw 6.9) Japan3505 25 24.01.2009 Winter storm Klaus France, Spain3413 45 27.12.1999 Winter storm Martin Spain, France, Switzerland, Italy
Note: Mw = moment magnitude scale.
Source: Swiss Re Economic Research & Consulting and Cat Perils.
43 Property and business interruption, excluding liability and life insurance losses; US natural catastrophe figures based on Property Claim Services (PCS)/incl. NFIP losses (see “Terms and selection criteria” on page 43.
44 Dead and missing.
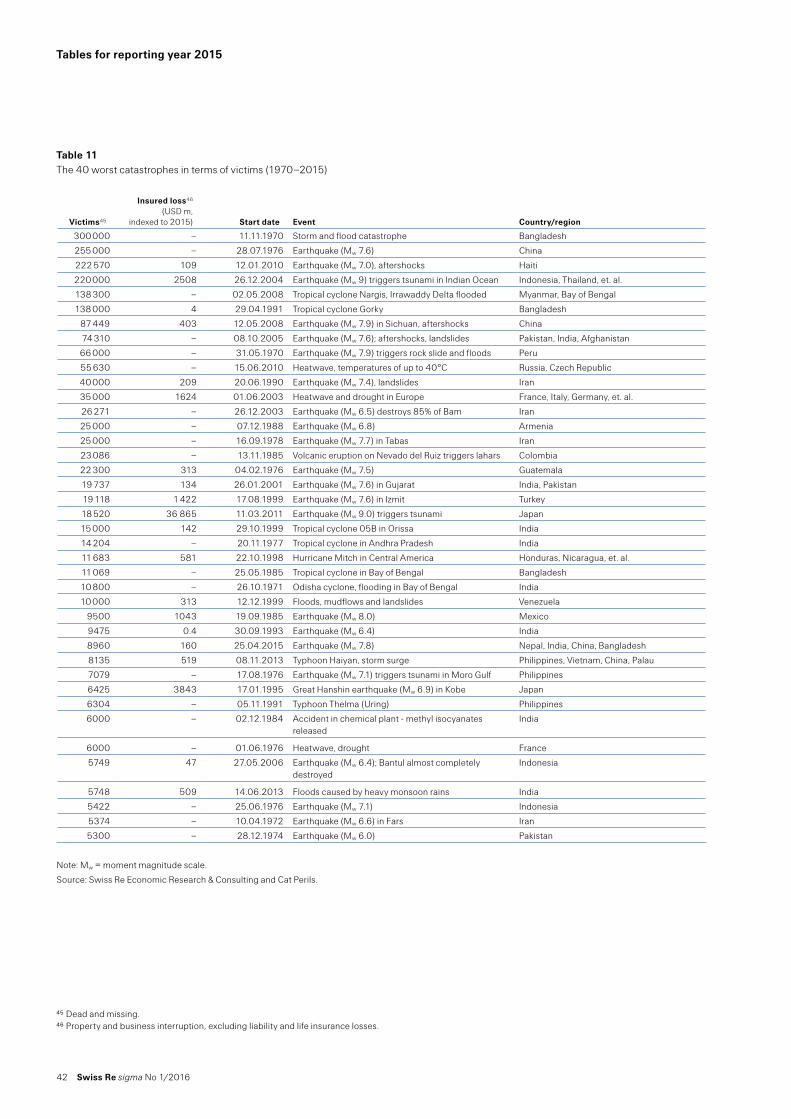
42 Swiss Re sigma No 1/2016
Tables for reporting year 2015
Table 11 The 40 worst catastrophes in terms of victims (1970–2015)
Victims45
Insured loss46 (USD m,
indexed to 2015) Start date Event Country/region
300 000 – 11.11.1970 Storm and flood catastrophe Bangladesh
255 000 – 28.07.1976 Earthquake (Mw 7.6) China
222 570 109 12.01.2010 Earthquake (Mw 7.0), aftershocks Haiti
220 000 2508 26.12.2004 Earthquake (Mw 9) triggers tsunami in Indian Ocean Indonesia, Thailand, et. al.
138 300 – 02.05.2008 Tropical cyclone Nargis, Irrawaddy Delta flooded Myanmar, Bay of Bengal
138 000 4 29.04.1991 Tropical cyclone Gorky Bangladesh
87 449 403 12.05.2008 Earthquake (Mw 7.9) in Sichuan, aftershocks China
74 310 – 08.10.2005 Earthquake (Mw 7.6); aftershocks, landslides Pakistan, India, Afghanistan
66 000 – 31.05.1970 Earthquake (Mw 7.9) triggers rock slide and floods Peru
55 630 – 15.06.2010 Heatwave, temperatures of up to 40°C Russia, Czech Republic
40 000 209 20.06.1990 Earthquake (Mw 7.4), landslides Iran
35 000 1624 01.06.2003 Heatwave and drought in Europe France, Italy, Germany, et. al.
26 271 – 26.12.2003 Earthquake (Mw 6.5) destroys 85% of Bam Iran
25 000 – 07.12.1988 Earthquake (Mw 6.8) Armenia
25 000 – 16.09.1978 Earthquake (Mw 7.7) in Tabas Iran
23 086 – 13.11.1985 Volcanic eruption on Nevado del Ruiz triggers lahars Colombia
22 300 313 04.02.1976 Earthquake (Mw 7.5) Guatemala
19 737 134 26.01.2001 Earthquake (Mw 7.6) in Gujarat India, Pakistan
19 118 1 422 17.08.1999 Earthquake (Mw 7.6) in Izmit Turkey
18 520 36 865 11.03.2011 Earthquake (Mw 9.0) triggers tsunami Japan
15 000 142 29.10.1999 Tropical cyclone 05B in Orissa India
14 204 – 20.11.1977 Tropical cyclone in Andhra Pradesh India
11 683 581 22.10.1998 Hurricane Mitch in Central America Honduras, Nicaragua, et. al.
11 069 – 25.05.1985 Tropical cyclone in Bay of Bengal Bangladesh
10 800 – 26.10.1971 Odisha cyclone, flooding in Bay of Bengal India
10 000 313 12.12.1999 Floods, mudflows and landslides Venezuela
9500 1043 19.09.1985 Earthquake (Mw 8.0) Mexico
9475 0.4 30.09.1993 Earthquake (Mw 6.4) India
8960 160 25.04.2015 Earthquake (Mw 7.8) Nepal, India, China, Bangladesh
8135 519 08.11.2013 Typhoon Haiyan, storm surge Philippines, Vietnam, China, Palau
7079 – 17.08.1976 Earthquake (Mw 7.1) triggers tsunami in Moro Gulf Philippines
6425 3843 17.01.1995 Great Hanshin earthquake (Mw 6.9) in Kobe Japan
6304 – 05.11.1991 Typhoon Thelma (Uring) Philippines
6000 – 02.12.1984 Accident in chemical plant - methyl isocyanates released
India
6000 – 01.06.1976 Heatwave, drought France
5749 47 27.05.2006 Earthquake (Mw 6.4); Bantul almost completely destroyed
Indonesia
5748 509 14.06.2013 Floods caused by heavy monsoon rains India
5422 – 25.06.1976 Earthquake (Mw 7.1) Indonesia
5374 – 10.04.1972 Earthquake (Mw 6.6) in Fars Iran
5300 – 28.12.1974 Earthquake (Mw 6.0) Pakistan
Note: Mw = moment magnitude scale.
Source: Swiss Re Economic Research & Consulting and Cat Perils.
45 Dead and missing.46 Property and business interruption, excluding liability and life insurance losses.
Swiss Re sigma No 1/2016 43
Terms and selection criteria
Natural catastrophesThe term “natural catastrophe” refers to an event caused by natural forces. Such an event generally results in a large number of individual losses involving many insurance policies. The scale of the losses resulting from a catastrophe depends not only on the severity of the natural forces concerned, but also on man-made factors, such as building design or the efficiency of disaster control in the afflicted region. In this sigma study, natural catastrophes are subdivided into the following categories: floods, storms, earthquakes, droughts/forest fires/heat waves, cold waves/frost, hail, tsunamis, and other natural catastrophes.
Man-made disastersThis study categorises major events associated with human activities as “man-made” or “technical” disasters. Generally, a large object in a very limited space is affected, which is covered by a small number of insurance policies. War, civil war, and war-like events are excluded. sigma subdivides man-made disasters into the following categories: major fires and explosions, aviation and space disasters, shipping disasters, rail disasters, mining accidents, collapse of buildings/bridges, and miscellaneous (including terrorism). In Tables 8 and 9 (pages 41–42), all major natural catastrophes and man-made disasters and the associated losses are listed chronologically.
Total lossesFor the purposes of the present sigma study, total losses are all the financial losses directly attributable to a major event, ie damage to buildings, infrastructure, vehicles etc. The term also includes losses due to business interruption as a direct consequence of the property damage. Insured losses are gross of any reinsurance, be it provided by commercial or government schemes. A figure identified as “total damage” or “economic loss” includes all damage, insured and uninsured. Total loss figures do not include indirect financial losses – ie loss of earnings by suppliers due to disabled businesses, estimated shortfalls in GDP and non-economic losses, such as loss of reputation or impaired quality of life.
Generally, total (or economic) losses are estimated and communicated in very different ways. As a result, they are not directly comparable and should be seen only as an indication of the general order of magnitude.
Insured losses“Losses” refer to all insured losses except liability. Leaving aside liability losses, on one hand, allows a relatively swift assessment of the insurance year; on the other hand, however, it tends to understate the cost of man-made disasters. Life insurance losses are also not included.
NFIP flood damage in the USThe sigma catastrophe database also includes flood damage covered by the National Flood Insurance Program (NFIP) in the US, provided that it fulfils the sigma selection criteria.
A natural catastrophe is caused by natural forces.
A man-made or technical disaster is triggered by human activities.
Losses due to property damage and business interruption that are directly attributable to major events are included in this study.
The amount of the total losses is a general indication only.
The term “losses” refer to insured losses, but do not include liability.
NFIP flood damage in the US is included.
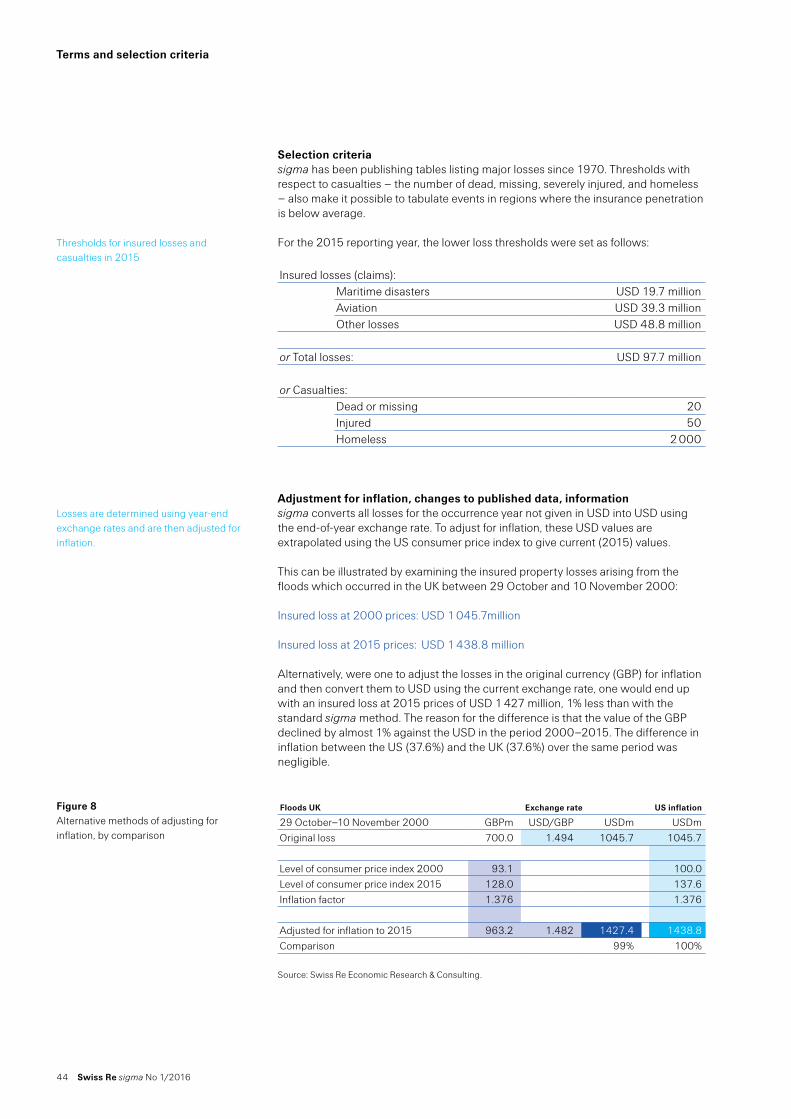
44 Swiss Re sigma No 1/2016
Terms and selection criteria
Selection criteriasigma has been publishing tables listing major losses since 1970. Thresholds with respect to casualties – the number of dead, missing, severely injured, and homeless – also make it possible to tabulate events in regions where the insurance penetration is below average.
For the 2015 reporting year, the lower loss thresholds were set as follows:
Insured losses (claims):Maritime disasters USD 19.7 millionAviation USD 39.3 millionOther losses USD 48.8 million
or Total losses: USD 97.7 million
or Casualties:Dead or missing 20Injured 50Homeless 2 000
Adjustment for inflation, changes to published data, informationsigma converts all losses for the occurrence year not given in USD into USD using the end-of-year exchange rate. To adjust for inflation, these USD values are extrapolated using the US consumer price index to give current (2015) values.
This can be illustrated by examining the insured property losses arising from the floods which occurred in the UK between 29 October and 10 November 2000:
Insured loss at 2000 prices: USD 1 045.7million
Insured loss at 2015 prices: USD 1 438.8 million
Alternatively, were one to adjust the losses in the original currency (GBP) for inflation and then convert them to USD using the current exchange rate, one would end up with an insured loss at 2015 prices of USD 1 427 million, 1% less than with the standard sigma method. The reason for the difference is that the value of the GBP declined by almost 1% against the USD in the period 2000–2015. The difference in inflation between the US (37.6%) and the UK (37.6%) over the same period was negligible.
Floods UK Exchange rate US inflation
29 October–10 November 2000 GBPm USD/GBP USDm USDmOriginal loss 700.0 1.494 1045.7 1045.7
Level of consumer price index 2000 93.1 100.0Level of consumer price index 2015 128.0 137.6Inflation factor 1.376 1.376
Adjusted for inflation to 2015 963.2 1.482 1427.4 1438.8Comparison 99% 100%
Source: Swiss Re Economic Research & Consulting.
Thresholds for insured losses and casualties in 2015
Losses are determined using year-end exchange rates and are then adjusted for inflation.
Figure 8 Alternative methods of adjusting for inflation, by comparison
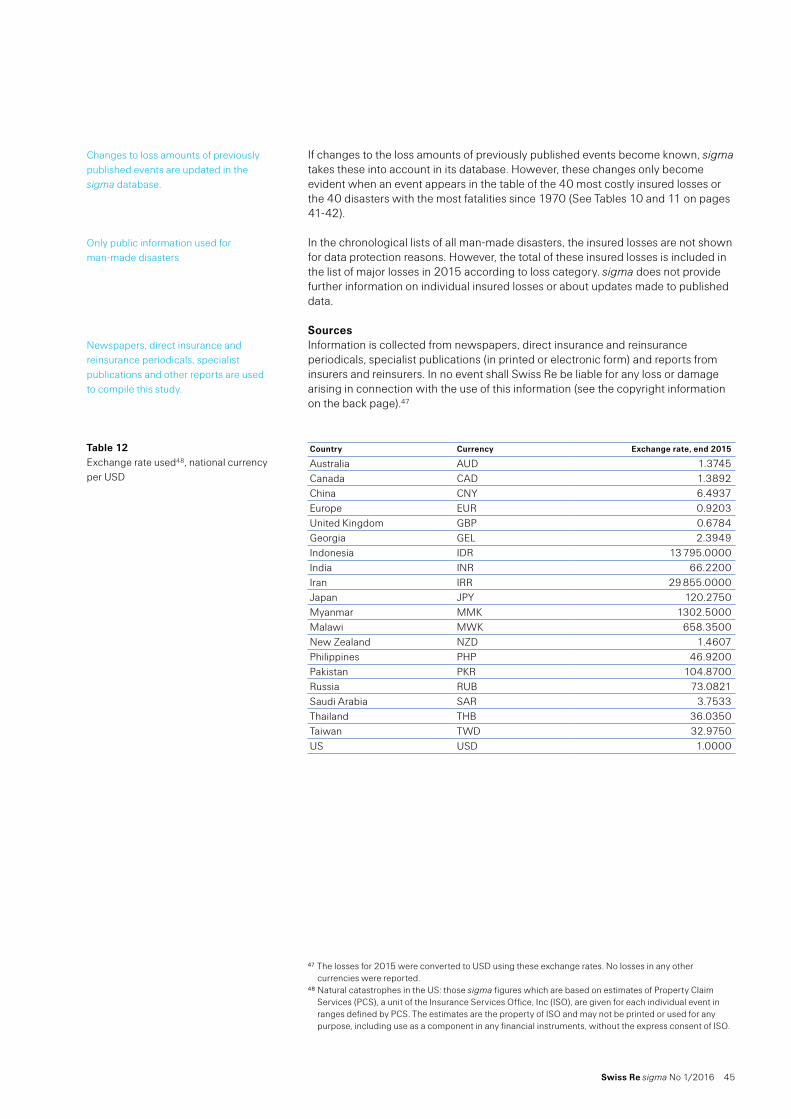
Swiss Re sigma No 1/2016 45
If changes to the loss amounts of previously published events become known, sigma takes these into account in its database. However, these changes only become evident when an event appears in the table of the 40 most costly insured losses or the 40 disasters with the most fatalities since 1970 (See Tables 10 and 11 on pages 41-42).
In the chronological lists of all man-made disasters, the insured losses are not shown for data protection reasons. However, the total of these insured losses is included in the list of major losses in 2015 according to loss category. sigma does not provide further information on individual insured losses or about updates made to published data.
SourcesInformation is collected from newspapers, direct insurance and reinsurance periodicals, specialist publications (in printed or electronic form) and reports from insurers and reinsurers. In no event shall Swiss Re be liable for any loss or damage arising in connection with the use of this information (see the copyright information on the back page).47
Country Currency Exchange rate, end 2015
Australia AUD 1.3745Canada CAD 1.3892China CNY 6.4937Europe EUR 0.9203United Kingdom GBP 0.6784Georgia GEL 2.3949Indonesia IDR 13 795.0000India INR 66.2200Iran IRR 29 855.0000Japan JPY 120.2750Myanmar MMK 1302.5000Malawi MWK 658.3500New Zealand NZD 1.4607Philippines PHP 46.9200Pakistan PKR 104.8700Russia RUB 73.0821Saudi Arabia SAR 3.7533Thailand THB 36.0350Taiwan TWD 32.9750US USD 1.0000
47 The losses for 2015 were converted to USD using these exchange rates. No losses in any other currencies were reported.
48 Natural catastrophes in the US: those sigma figures which are based on estimates of Property Claim Services (PCS), a unit of the Insurance Services Office, Inc (ISO), are given for each individual event in ranges defined by PCS. The estimates are the property of ISO and may not be printed or used for any purpose, including use as a component in any financial instruments, without the express consent of ISO.
Changes to loss amounts of previously published events are updated in the sigma database.
Only public information used for man-made disasters
Newspapers, direct insurance and reinsurance periodicals, specialist publications and other reports are used to compile this study.
Table 12 Exchange rate used48, national currency per USD
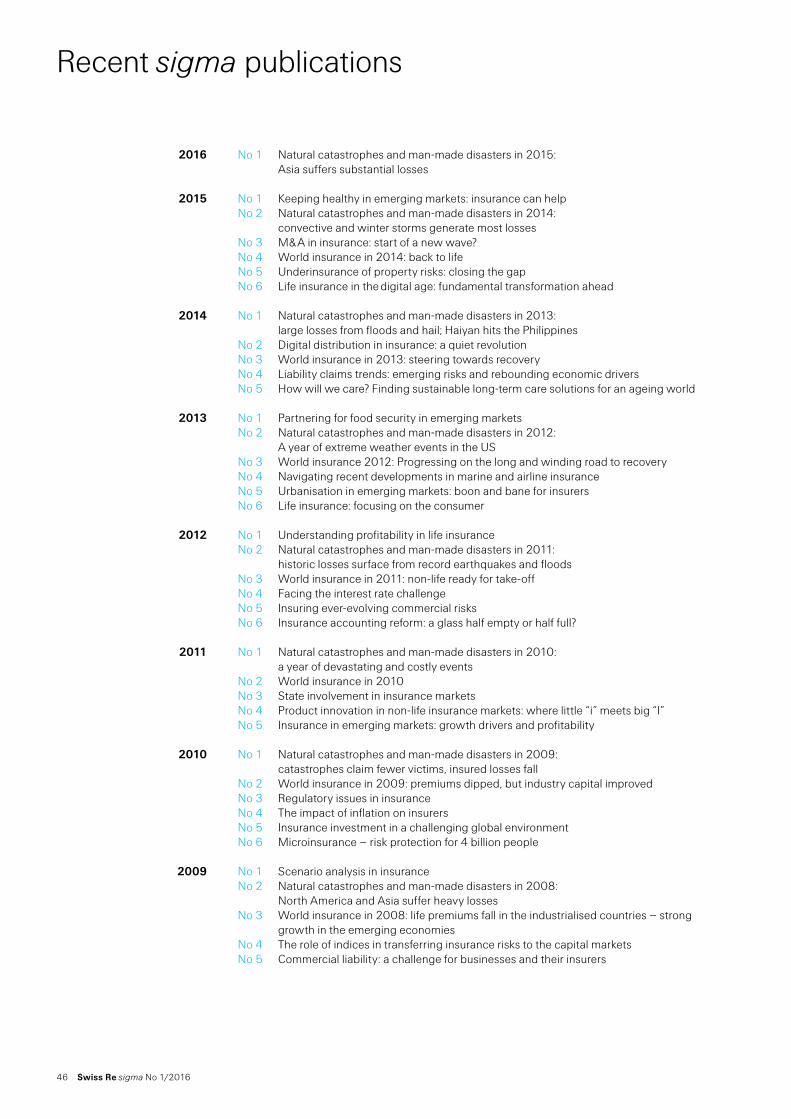
46 Swiss Re sigma No 1/2016
Recent sigma publications
2016 No 1 Natural catastrophes and man-made disasters in 2015: Asia suffers substantial losses
2015 No 1 Keeping healthy in emerging markets: insurance can help No 2 Natural catastrophes and man-made disasters in 2014: convective and winter storms generate most losses No 3 M & A in insurance: start of a new wave? No 4 World insurance in 2014: back to life No 5 Underinsurance of property risks: closing the gap No 6 Life insurance in the digital age: fundamental transformation ahead
2014 No 1 Natural catastrophes and man-made disasters in 2013: large losses from floods and hail; Haiyan hits the Philippines
No 2 Digital distribution in insurance: a quiet revolution No 3 World insurance in 2013: steering towards recovery No 4 Liability claims trends: emerging risks and rebounding economic drivers No 5 How will we care? Finding sustainable long-term care solutions for an ageing world
2013 No 1 Partnering for food security in emerging markets No 2 Natural catastrophes and man-made disasters in 2012: A year of extreme weather events in the US No 3 World insurance 2012: Progressing on the long and winding road to recovery No 4 Navigating recent developments in marine and airline insurance No 5 Urbanisation in emerging markets: boon and bane for insurers No 6 Life insurance: focusing on the consumer
2012 No 1 Understanding profitability in life insurance No 2 Natural catastrophes and man-made disasters in 2011: historic losses surface from record earthquakes and floods No 3 World insurance in 2011: non-life ready for take-off No 4 Facing the interest rate challenge No 5 Insuring ever-evolving commercial risks No 6 Insurance accounting reform: a glass half empty or half full?
2011 No 1 Natural catastrophes and man-made disasters in 2010: a year of devastating and costly events No 2 World insurance in 2010 No 3 State involvement in insurance markets No 4 Product innovation in non-life insurance markets: where little “i” meets big “I” No 5 Insurance in emerging markets: growth drivers and profitability
2010 No 1 Natural catastrophes and man-made disasters in 2009: catastrophes claim fewer victims, insured losses fall
No 2 World insurance in 2009: premiums dipped, but industry capital improved No 3 Regulatory issues in insurance No 4 The impact of inflation on insurers No 5 Insurance investment in a challenging global environment No 6 Microinsurance – risk protection for 4 billion people
2009 No 1 Scenario analysis in insurance No 2 Natural catastrophes and man-made disasters in 2008:
North America and Asia suffer heavy losses No 3 World insurance in 2008: life premiums fall in the industrialised countries – strong
growth in the emerging economies No 4 The role of indices in transferring insurance risks to the capital markets No 5 Commercial liability: a challenge for businesses and their insurers
Swiss Re sigma No 1/2016 47
Published by:
Swiss Re LtdEconomic Research & ConsultingP.O. Box 8022 ZurichSwitzerland
Telephone +41 43 285 2551Fax +41 43 282 0075E-Mail: [email protected]
Armonk Office:175 King StreetArmonk, NY 10504
Telephone +1 914 828 8000
Hong Kong Office:18 Harbour Road, WanchaiCentral Plaza, 61st FloorHong Kong, SAR
Telephone + 852 25 82 5644
Authors:Lucia BevereTelephone +41 43 285 9279
Rajeev SharanTelephone +91 80 4900 2172
Vipin K STelephone +91 80 4900 2402
sigma editor:Paul RonkeTelephone +41 43 285 2660
Editor in chiefKurt Karl,Head of Economic Research & Consulting, is responsible for the sigma series.
Explore and visualize sigma data on natural catastrophes and the world insurance markets at www.sigma-explorer.com
© 2016 Swiss Re. All rights reserved.
The editorial deadline for this study was 26 February 2016.
sigma is available in English (original language), German, French, Spanish, Chinese and Japanese.
sigma is available on Swiss Re’s website: www.swissre.com/sigma
The internet version may contain slightly updated information.
Translations:German: Diction AGFrench: ithaxa Communications SARLSpanish: Traductores Asociados Valencia S.L.
Graphic design and production:Corporate Real Estate & Logistics / Media Production, Zurich
Printing: Multicolor Print AG, Baar
This report is printed on sustainably produced paper. The wood used comes from forest certified to 100% by the Forest Stewardship Council (FSC).
© 2016Swiss ReAll rights reserved.
The entire content of this sigma edition is subject to copyright with all rights reserved. The information may be used for private or internal purposes, provided that any copyright or other proprietary notices are not removed. Electronic reuse of the data published in sigma is prohibited.
Reproduction in whole or in part or use for any public purpose is permitted only with the prior written approval of Swiss Re Economic Research & Consulting and if the source reference “Swiss Re, sigma No 1/2016” is indicated. Courtesy copies are appreciated.
Although all the information used in this study was taken from reliable sources, Swiss Re does not accept any responsibility for the accuracy or comprehensiveness of the information given or forward looking statements made. The information provided and forward-looking statements made are for informational purposes only and in no way constitute or should be taken to reflect Swiss Re’s position, in particular in relation to any ongoing or future dispute. In no event shall Swiss Re be liable for any loss or damage arising in connection with the use of this information and readers are cautioned not to place undue reliance on forward-looking statements. Swiss Re undertakes no obligation to publicly revise or update any forward-looking statements, whether as a result of new information, future events or otherwise.
Order no: 270_0116_EN

48 Swiss Re sigma No 1/2016


Swiss Re LtdEconomic Research & ConsultingMythenquai 50 /60 P.O. Box 8022 Zurich Switzerland
Telephone + 41 43 285 2551 Fax +41 43 282 0075 [email protected]