Embed Size (px)
Citation preview

PIOJ. March 5, 2015. Page 1 of 104
National Policy on Poverty
National Poverty Reduction Programme
GREEN PAPER
GOVERNMENT OF JAMAICA
Ministry of Economic Growth and Job Creation
December 2016
December 2016 Page 2 of 104
Table of Contents
PREFACE ........................................................................................................................... 4
LIST OF TABLES AND FIGURES ................................................................................... 5
LIST OF APPENDICES .................................................................................................... 5
LIST OF ACRONYMS ....................................................................................................... 6
EXECUTIVE SUMMARY ................................................................................................. 9
Background and Purpose ...................................................................................................................... 9
Guiding Principles, Vision, Goals, Themes, Objectives, and Outcomes ..................................... 10
The National Poverty Reduction Programme ................................................................................. 11
Context for Poverty Reduction .......................................................................................................... 12
1. INTRODUCTION ......................................................................................................... 13
1.1 Measurement of Poverty in Jamaica ............................................................................................ 13
1.2 Background ..................................................................................................................................... 13
1.3 Purpose ............................................................................................................................................ 15
1.4 The Policy Development Process ............................................................................................... 16
2. SITUATION ANALYSIS (SUMMARY) ....................................................................... 18
3. THE NATIONAL POLICY ON POVERTY .............................................................. 22
3.1 Guiding Principles ......................................................................................................................... 22
3.2 Vision Statement ............................................................................................................................ 23
3.3 Policy Goals and Intermediate Outcomes ................................................................................. 23
3.4 Thematic Areas .............................................................................................................................. 23
3.5 Policy Objectives ............................................................................................................................ 24
3.6 Strategies and Actions ................................................................................................................... 24
4. KEY STAKEHOLDERS AND THEIR ROLES (POLICY AND PROGRAMME) .. 30
5. INSTITUTIONAL AND MONITORING & EVALUATION FRAMEWORKS
(POLICY AND PROGRAMME) ...................................................................................... 31
5.1 Institutional Framework (Revised) .............................................................................................. 31
5.2 Monitoring and Evaluation Framework ..................................................................................... 33
6. CONTEXT FOR POVERTY REDUCTION (POLICY AND PROGRAMME) ....... 34
6.1 Policy Coherence – Linkages with Other Policies, Legislation and Programmes ................ 34
6.2 Economic Context ......................................................................................................................... 40

December 2016 Page 3 of 104
6.3 Social Context ................................................................................................................................. 41
6.4 Lessons Learned ............................................................................................................................. 41
6.5 Resource Mobilization and Funding ........................................................................................... 43
6.6 Risks to Policy/Programme Success ........................................................................................... 45
7. THE NATIONAL POVERTY REDUCTION PROGRAMME, 2030 ....................... 46
7.1 Poverty Reduction Programme Parameters ............................................................................... 46
7.2 Programme Levels and Priorities ................................................................................................. 46
8. MEDIUM-TERM POVERTY REDUCTION PROGRAMME, 2015-2018 ................ 49
8.1 Specific Target Groups ................................................................................................................. 49
8.2 Key Strategic Interventions by Target Group ........................................................................... 50
APPENDICES .................................................................................................................. 62
Appendix 1: Stakeholder Consultations ............................................................................................ 62
Appendix 2: Situation Analysis ........................................................................................................... 65
Appendix 3: Prevalence of Food Poverty by Region and Sex (1990-2012) ................................. 86
Appendix 4: Distribution of Poverty in Jamaica (1990-2012) ....................................................... 87
Appendix 5: Poverty Gap Index (Poverty Depth) in Jamaica by Region (2001-2012) .............. 88
Appendix 6: Squared Poverty Gap Index (Poverty Severity) in Jamaica by Region (2001-2012)
................................................................................................................................................................ 89
Appendix 7: Prevalence of Poverty in Jamaica by Sex (1990-2012) ............................................. 90
Appendix 8: Prevalence of Poverty and Food Poverty by Sex of Household Head (1990-2012)
................................................................................................................................................................ 91
Appendix 9: Prevalence of Poverty by Region and Sex (1990-2012) ........................................... 92
Appendix10: Prevalence of Poverty in Jamaica by Age Group (1990-2012) ............................... 93
Appendix 11: Prevalence of Poverty by Region and Age (1990-2012) ........................................ 94
Appendix 12: Prevalence of Food Poverty by Region and Age (1990-2012) .............................. 95
Appendix 13: Key Workflow Considerations of the Poverty Reduction Coordinating Unit ... 96
Appendix 14: International and Regional Best Practices ................................................................ 97
GLOSSARY OF TERMS ................................................................................................. 100
REFERENCES ................................................................................................................ 101

December 2016 Page 4 of 104
PREFACE
[Insert]

December 2016 Page 5 of 104
LIST OF TABLES AND FIGURES
List of Tables
Table 1 Partnerships in the National Poverty Reduction
Table 2 Poverty Reduction Indicators and Targets
Table 3 Select Policies, Legislations and International Agreements
Table 4 Major Government Projects, Programmes, and Interventions Targeting Poverty Reduction and 2015/2016 FY Budget Allocation
List of Figures
Figure 1 Institutional Framework for the Poverty Reduction Programme
Figure 2 Programme Levels
Box 1 Select Proposed Goals and Targets – Post-2015 Sustainable Development Goals
LIST OF APPENDICES Appendix 1: Stakeholder Consultations
Appendix 2: Situation Analysis
Appendix 3: Prevalence of Food Poverty by Region and Sex (1990-2012)
Appendix 4: Distribution of Poverty in Jamaica (1990-2012)
Appendix 5: Poverty Gap Index (Poverty Depth) in Jamaica by Region (2001-2012)
Appendix 6: Squared Poverty Gap Index (Poverty Severity) in Jamaica by Region (2001-2012)
Appendix 7: Prevalence of Poverty in Jamaica by Sex (1990-2012)
Appendix 8: Prevalence of Poverty and Food Poverty by Sex of Household Head (1990-2012)
Appendix 9: Prevalence of Poverty by Region and Sex (1990-2012)
Appendix10: Prevalence of Poverty in Jamaica by Age Group (1990-2012)
Appendix 11: Prevalence of Poverty by Region and Age (1990-2012)
Appendix 12: Prevalence of Food Poverty by Region and Age (1990-2012)
Appendix 13: Key Workflow Considerations of the Poverty Reduction Coordinating Unit
Appendix 14: International and Regional Best Practice

December 2016 Page 6 of 104
LIST OF ACRONYMS
BAM Banana Accompanying Measures
BIS Beneficiary Identification System
BOS Board of Supervision
BRM Benefits Review Mechanism
BSJ Bureau of Standards Jamaica
CBOs Community Based Organizations
CDA Child Development Agency
COMET Community Empowerment and Transformation Project
CRP Community Renewal Programme
CSJP Citizen Security and Justice Programme
DBJ Development Bank of Jamaica
ECIs Early Childhood Institutions
EFF Extended Fund Facility
ESSJ Economic and Social Survey of Jamaica
FBOs Faith-Based Organizations
FY Financial Year
GIS Growth Inducement Strategy
GOJ Government of Jamaica
HAJ Housing Agency of Jamaica
HEART /NTA Human Employment and Resource Training/National Training Agency
HIV/AIDS Human Immunodeficiency Virus/Acquired Immunodeficiency Syndrome
HRC Human Resource Committee
ILO International Labour Organisation
IMF International Monetary Fund
JA REEACH Jamaica Rural Economy and Ecosystems Adapted to Climate Change
JADEP Jamaica Drug for the Elderly Programme
JBDC Jamaica Business Development Corporation
JCPD Jamaica Council for Persons with Disabilities
JSIF Jamaica Social Investment Fund
JSLC Jamaica Survey of Living Conditions
KMA Kingston Metropolitan Area
MDAs Ministries, Departments and Agencies
MDGs Millennium Development Goals
MEFP Memorandum of Economic and Financial Policies
MICS Multiple Indicator Cluster Survey

December 2016 Page 7 of 104
LIST OF ACRONYMS cont’d
MIDA Micro Investment Development Agency
MIIC Ministry of Industry Investment and Commerce
MIS Management Information System
MLGCD Ministry of Local Government and Community Development
MLSS Ministry of Labour and Social Security
MLWECC Ministry of Land, Water, Environment and Climate Change
MNS Ministry of National Security
MOA Ministry of Agriculture
MOE Ministry of Education
MOFP Ministry of Finance and Planning
MOH Ministry of Health
MSMEs Micro, Small and Medium Enterprises
MTF Medium Term Socio-Economic Framework
MTWH Ministry of Transport, Works and Housing
MYC Ministry of Youth and Culture
NDP National Development Plan
NFPB National Family Planning Board
NGOs Non-Government Organizations
NHT National Housing Trust
NIDS National Identification System
NIS National Insurance Scheme
NLA National Land Agency
NPEP National Poverty Eradication Programme
NSPC National Social Protection Committee
OPM Office of the Prime Minister
OVC Orphans and Vulnerable Children
PAHO Pan American Health Organization
PATH Programme of Advancement through Health and Education
PCMU Programme Coordinating and Monitoring Unit
PESP Primary Education Support Project
PIOJ Planning Institute of Jamaica
PRCU Poverty Reduction Coordinating Unit
PRPC Poverty Reduction Programme Committee
PRSP Poverty Reduction Strategic Plan
PSOJ Private Sector Organization of Jamaica

December 2016 Page 8 of 104
LIST OF ACRONYMS cont’d
PVOs Private Voluntary Organizations
PWDs Persons with Disabilities
RUYE Rural Youth Employment
SALISES Sir Arthur Lewis Institute of Social and Economic Studies
SDC Social Development Commission
SLB Students’ Loan Bureau
SPPRD Social Policy, Planning and Research Division
SPS Social Protection Strategy
SSN Social Safety Net
STATIN Statistical Institute of Jamaica
TRN Tax Registration Number
TWG Thematic Working Groups
UN United Nations
UNDP United Nations Development Programme
USAID United States Agency for International Development
UWI University of the West Indies
WHO World Health Organization

December 2016 Page 9 of 104
EXECUTIVE SUMMARY Background and Purpose The National Policy on Poverty and National Poverty Reduction Programme together constitute a responsive instrument of the Government of Jamaica to the need to institute a systematic and accountable framework to implement, coordinate, and monitor measures to address poverty and vulnerability. These represent a move to providing a focal point for coordinating poverty programmes and to address the void existing since the end of the previous programme. The National Poverty Eradication Programme and accompanying policy framework (Ministry Paper #13, 1997) had been in effect since 1997, administered through the Programme Monitoring and Coordinating Unit (PMCU) of the Office of the Prime Minister. The PMCU ceased functioning around 2007. Building on the experience of the past, the new National Policy addresses new dynamics and realities in a comprehensive manner. Reflecting new policy directions and approaches, the National Policy and Programme are linked to Vision 2030 Jamaica – National Development Plan and its Poverty Reduction Strategic Plan. It is also seamlessly linked to the Jamaica Social Protection Strategy (2014), which provides the framework for the delivery of Effective Social Protection, an outcome of Vision 2030 Jamaica. The National Policy provides a focused and overarching framework for addressing poverty, inclusive of principles, vision, goals, objectives, strategies, institutional and monitoring and evaluation frameworks. The National Programme on the other hand, outlines the parameters for delivery and provides focussed interventions, strategies, and actions towards achieving the policy goals over the medium-term (2015-2018) and longer term (2030). Within the overall framework of the Vision 2030 Jamaica, the Policy and Programme aim to eradicate extreme poverty and reduce absolute poverty at the national and sub-national levels. The intermediate outcomes of the policy are the strengthening of the institutional and legislative environment and providing a framework of cooperation among state and non-state actors for sustainability of the poverty reduction efforts. This Policy provides a holistic and integrated framework that:
a) Outlines the Government’s prioritization of the issue of poverty; b) Outlines fundamental principles, strategies, and approaches towards poverty reduction; c) Provides a locus of responsibility for coordinating the National Poverty Reduction
Programme; d) Emphasises improved coordination, integration, collaboration, and efficiencies among
poverty reduction programmes; e) Provides a credible and responsive mechanism to positively and directly influence the
poverty prevalence. f) Identifies key focus areas and target groups for prioritization within a Medium-Term
Programme; g) Provides the basis for resource mobilization for poverty programmes; h) Provides a structured and coordinated approach to monitoring and evaluation of poverty
reduction interventions;

December 2016 Page 10 of 104
Guiding Principles, Vision, Goals, Themes, Objectives, and Outcomes Guiding Principles: The National Policy on Poverty embraces the following seven core principles, which form the basis for empowering individuals, households and communities to achieve their full potential and thereby contribute to holistic national development. These are:
1. Respect for Human Rights 2. Inclusive and Participatory Development 3. Shared Prosperity 4. Equitable Access to Basic Goods and Services 5. Evidence-Based Monitoring and Evaluation (M&E) 6. Transparency and Accountability 7. Sustainable Development Approaches
Thematic Areas and Objectives: Listed below are the seven thematic areas and corresponding objectives of the Policy. Relevant strategies towards the achievement of each objective are detailed in the document. Thematic Area 1: Social Safety Nets Objective 1: Strengthen social safety nets to address extreme poverty-induced deprivations (including hunger).
Thematic Area 2: Human Capital Development Objective 2: Promote and expand human capital development among the poor and vulnerable (including children and persons with disabilities).
Thematic Area 3: Livelihood Creation and Income Security Objective 3: Enhance income security among the poor and vulnerable.
Thematic Area 4: Food and Nutrition Security Objective 4: Enhance food and nutrition security of the poor.
Thematic Area 5: Basic Social and Physical Infrastructure Objective 5: Strengthen basic social and physical infrastructure within poor rural and urban communities.
Thematic Area 6: Psychosocial, Cultural, and Normative Advancement Objective 6: Address psychosocial, cultural and normative influences on poverty.
Thematic Area 7: Coordination and Capacity Building. Objective 7: Strengthen coordination and capacity building among key stakeholders for poverty reduction. Vision Statement: Every Jamaican is consuming goods and services above the minimum acceptable national standards, and has equal and equitable opportunities and support to achieve and maintain income security and improved quality of life.

December 2016 Page 11 of 104
Policy Goals: The Policy and Programme aim to eradicate extreme poverty by 2022 and reduce the national prevalence of poverty to less than 10 per cent by 2030. The eradication of extreme poverty will be targeted within the first two medium-term programmes (2015-2018 and 2018-2022). Within the medium-term poverty programmes, specific targets will be set for each goal, and focus will be placed on disaggregation by sex, geographic area, and age cohorts, where feasible.
GOAL 1: Extreme (food) poverty eradicated by 2022
GOAL 2: National poverty prevalence reduced significantly below 10 per cent by 2030
The determination of the focus areas has been guided by data and research, current policy focus of the Government, lessons learned locally and from regional and international best practice on poverty reduction and socio-economic development, along with insights from consultations with key stakeholders. Intermediate Outcomes of the Policy: 1. Institutional framework for poverty reduction coordination established and operationalized at national and sub-national levels. 2. Legislative environment that supports sustainable poverty reduction facilitated and strengthened. 3. A framework of cooperation and coordination among government and non-government partners towards poverty reduction outcomes at the national and sub-national levels established.
The National Poverty Reduction Programme The prevalence of poverty in Jamaica has trended upwards since 2008 and is consistently highest in rural areas. In 2012, the national poverty prevalence was 19.9 per cent of the population, with the food poor representing 7.5 per cent. Children are among the most vulnerable groups and account for almost half of those living in poverty. Other vulnerable groups include persons with disabilities, the homeless, the elderly and youth as well as those within the category of the working poor. These, as well as the small producers and entrepreneurs that are faced with the challenges that threaten their viability, are targeted for the medium-term programme which will be implemented to address poverty at the individual/household, community and national levels. The implementation of poverty programmes is primarily state-led however there are non-government and civil society organizations that are involved in poverty reduction efforts. The main poverty programmes are challenged by poor targeting, inadequacy of benefits, cost effectiveness issues and lack of sustainability, and in some instances, lack of institutional capacities for effective implementation.

December 2016 Page 12 of 104
Context for Poverty Reduction Social, Economic and Environmental Imperatives The Policy highlights the importance of economic and social development, the interconnectedness of all sectors, the need for strong and effective partnerships, favourable distribution of resources to programmes, and consistent commitment on the part of the Government as important prerequisites to achieving poverty reduction. These along with coordination, monitoring and evaluation, as well as personal responsibility and commitment of programme beneficiaries will lead to the achievement of stated outcomes. The possible risks to the Policy and Programme, including resource constraints, resistance to coordination and monitoring, weakness in supporting sectors, resistance to change and the effect of persistent environmental hazards, are also outlined. Resources and Funding The poverty reduction programme will be resourced through budgetary provisions to existing programmes and projects earmarked for priority. Current interventions being implemented through Ministries, Departments and Agencies (MDAs) will need to be adequately resourced to ensure sustained poverty-related outcomes. Technical and funding support from the international development partners will remain critical.

December 2016 Page 13 of 104
1. INTRODUCTION 1.1 Measurement of Poverty in Jamaica
In Jamaica, a consumption methodology is used to measure poverty. The process of poverty measurement begins by defining a food poverty line. The food poverty line represents the recommended minimum caloric requirement that is needed to sustain a family of five (two adults and three children). The minimum caloric requirement is captured in a food basket, where the total caloric value of the food basket is equal to the minimum caloric requirement. The food basket contains food items organised in six categories, and is a minimum cost basket. Each category of the food basket contains the lowest priced food items from different options of commonly consumed food items. Each food item is then costed and summed to obtain the total cost of the food basket. The monetary cost of the food basket then represents the food poverty line (after some adjustments for the age and sex distribution of the family of five). To this food poverty line, the basic value of non-food items is then added to obtain the poverty line for Jamaica. The basic value of non-food items is determined by estimating the ratio of total non-food cost to total food cost. Total ratio of food cost to non-food cost is approximately 2:1. Since the value of the food poverty line is known, this percentage is used to derive the non-food cost which is then added to the food poverty line to derive the poverty line for Jamaica. Implicit in the non-food share are all the other basic expenditures typical to the family, including housing and education. In 2012, the poverty line was estimated to be $143,687. If an individual’s consumption is below this figure, then that person is considered to be in poverty.
1.2 Background Despite weak economic growth and a high debt to GDP ratio, Jamaica’s poverty rates showed a significant downward trend from 1990 to 2007. Using an absolute poverty method to measure progress for the United Nations’ Millennium Development Goal (MDG) Goal 1 concerning halving extreme poverty shows that the poverty reduction target was achieved, moving from 28.4 per cent of Jamaicans living below the national poverty line in 1990 to 9.9 per cent in 2007. However, the onset of the global food crisis in 2007/08 and the financial and economic crises of 2008/09, in addition to structural weaknesses in the economy, led to a reversal of most of the gains made in poverty reduction. The decline observed in poverty rates over the period 1990-2007 occurred within the context of low and flat economic growth and relatively stable employment rates for most years. Upward movement in real incomes, and general downward movement in inflation rates were characteristic features over the period. However, in 2007, the decline in economic activities due to the global food price increases as well as the global financial crisis and its lagged effects, contributed significantly to the increase in poverty rates seen from 2008 to 2012, from a low of 9.9 per cent to 19.9 per cent. According to Handa (2010, 1) there is “significant movement in and out of poverty, with approximately half of poor households moving out of [exit] poverty each year and being

December 2016 Page 14 of 104
replaced by approximately the same number of new poor” based on assessment of the JSLC data sets (1995-2005). Further, “over a 3-year period, one-third of those who had a ‘poverty event’ [poor, that is, consumed below the poverty line] will have another ‘poverty event,’ representing about 4.0 per cent of the total household population” (Handa 2010, 11). This is consistent with the literature1 on poverty which argues that there are structural or hard core poor, transient poor and vulnerable groups. The dynamism of poverty in Jamaica is evident in ‘movers’ who may be among the vulnerable population who are likely to regress into poverty when shocks and crises arise (Handa 2010). Poverty-related public policy in Jamaica dates back to The Poor Relief Act, 1886. Following on Jamaica’s commitment to eradicate absolute poverty, articulated within the International Conference on Population and Development Programme of Action (1994), and involvement in the United Nations World Summit on Social Development in Copenhagen (1995), the Cabinet approved Jamaica's Policy Towards Poverty Eradication and the National Poverty Eradication Programme (NPEP) {Ministry Paper 13} and an institutional framework approved by Parliament, in 1997.The Programme Coordinating and Monitoring Unit (PCMU) was established in the Office of the Prime Minister as the institutional focal point for the poverty programme which commenced implementation in 1997. The poverty eradication efforts focused on community development, and broadening access to basic social services. The cessation of the NPEP and the PCMU around 2007/2008 resulted in the absence of a locus of institutional responsibility for poverty. The Vision 2030 Jamaica – National Development Plan, outlines a set of strategies regarding poverty reduction in the Poverty Reduction Strategic Plan, 2008-2030. The Plan recognizes that one of the fundamental requirements for effective implementation is a singular focal point of institutional responsibility, under an assigned Ministry, along with improved mechanisms and instruments for monitoring and measuring poverty. The major strategic objectives outlined in the plan are for equitable access to basic goods and services, responsive public policy, opportunities for sustainable livelihoods, and social inclusion. These entail a major focus on families, rural development, human capital formation through education and empowerment, and the provision of economic opportunities for poor households and vulnerable persons. The vigorous attention that must be paid to community development and infrastructure is also included. Arising from the development of the Poverty Reduction Strategic Plan of Vision 2030 Jamaica, the PIOJ saw the need for a revision and updating of the policy and programmatic frameworks for poverty initiatives, and the imperative for an institutional focal point of responsibility to be identified within Government. The Poverty Reduction Coordinating Unit (PRCU) was therefore established in the PIOJ in late 2013, with Cabinet Decision No. 06/15 further sanctioning the drafting of a new policy and programme for poverty reduction. The Conceptual Framework for Poverty Reduction Coordination in Jamaica, November 2014, was articulated through a multi-stakeholder participatory process, and accepted as the basis for the development of the Policy.
1Thomas (1988), Beckford (1972), Handa (2010), Benfield (2010) and Witter et al. (2009).

December 2016 Page 15 of 104
This new Policy and Programme are in keeping with commitments articulated in Vision 2030 Jamaica; Medium Term Socio-Economic Policy Framework (MTF2015-2018); Social Protection Strategy (SPS) and the Growth Inducement Strategy (GIS) and other related policies. Vision 2030 Jamaica targets reduction of the prevalence of poverty to less than 10 per cent by 2030. The PRCU is responsible for multi-sectoral coordination of poverty programmes and projects, within the framework of the Social Protection Strategy approved by Cabinet in March 2014. The Social Protection System supports human capital development through health, education, labour market, housing, food security, and the natural environment necessary for sustainable livelihoods and income security. The Growth Inducement Strategy framework projected growth performance is expected to contribute to poverty reduction in context of the economic programme under an Extended Fund Facility Agreement with the International Monetary Fund (IMF), 2013.The Policy and Programme are also instruments in support of regional commitments and agreements including Transforming our World: The 2030 Agenda for Sustainable Development (2030 Agenda), the Samoa Pathway and the World Summit on Social Development: Declaration and Programme of Action.
1.3 Purpose Vision 2030 Jamaica and the Jamaica Social Protection Strategy provide the overarching framework for social protection and poverty reduction interventions going forward. Within this framework, the National Policy on Poverty and its associated Medium-Term Poverty Reduction Programme provide a broad, yet focused poverty policy and programming response to address poverty reduction and mitigation, and builds on the merits of the prior policy and programme intervention. At the core of this new policy and programme is the empowerment of people; building resilience at the national, community, household and individual levels, to break the intergenerational cycle of poverty. The role of the Government is to first reinforce the framework in which to tackle the issue of poverty, and provide a cohesive structure within which partners can contribute to the strategic imperatives. Various programmes and projects can fit within the framework of the Poverty Programme from time to time, as the dynamics change or the focus of the poverty reduction efforts shift. The National Policy on Poverty and National Poverty Reduction Programme, coordinated through the PRCU, will replace the National Poverty Eradication Policy and Programme, and is intended to reverse the upward trend of poverty since 2008. This trend eroded and reversed Jamaica’s achievement of the United Nations’ Millennium Development Goal (MDG) Goal 1 concerning the eradication of poverty. The policy and programme focus will also provide a platform for poverty targeting as reflected in Transforming our World: The 2030 Agenda for Sustainable Development (2030 Agenda). This National Policy on Poverty and its associated Programme provide a systematic and integrated framework that:
i) Outlines the Government’s prioritization of the issue of poverty. j) Outlines fundamental principles, strategies, and approaches towards poverty reduction.

December 2016 Page 16 of 104
k) Provides a locus of responsibility for coordinating the national poverty reduction programme.
l) Emphasises improved coordination, integration, collaboration, and efficiencies among poverty reduction programmes.
m) Provides a credible and responsive mechanism to positively and directly influence poverty prevalence.
n) Identifies key focus areas and target groups for prioritization within a Medium-Term Programme.
o) Provides the basis for resource mobilization for poverty programmes. p) Provides a structured and coordinated approach to monitoring and evaluation of poverty
reduction interventions. Poverty programmes in Jamaica span a wide range of interventions, from construction of community infrastructure such as roads and schools, divestment of lands under favourable terms and conditions, water and sanitation projects, rural electrification, climate change adaptation and disaster resilience and skills building, to cash transfers, residential care and employment programmes, education, training and apprenticeship programmes, health care and insurance programmes as well as nutrition support. However, in as much as there are millions of dollars being spent on poverty programmes of various kinds, Jamaica will not reap sustainable, positive outcomes, if programmes remain fragmented, and there is inadequate provision for measuring programme effects. Across Ministries Departments and Agencies (MDAs), and even NGOs, (inclusive of donor/lender facilitated projects) ad hoc, well intentioned initiatives are currently giving rise to duplication of efforts, wastage of resources, poorly designed initiatives, and detached and fragmented programme approaches. This is due in part to lack of information and unproductive use of the available data. There is also limited accountability for the prevalence of poverty, brought about by the absence of a governance framework and formal institutionalised mechanisms for the monitoring of indicators and the evaluation of impacts and outcomes. It is anticipated that the National Policy on Poverty, its various Medium-Term (3-4 Year) Poverty Reduction Programmes, and framework for coordination, monitoring and evaluation will provide a systematic approach towards realizing the eradication of extreme (food) poverty and reduction of absolute poverty. This is in keeping with the targets set for the 2030 Agenda and realizing the outcomes defined by Vision 2030 Jamaica.
1.4 The Policy Development Process The PIOJ, through the PRCU, utilised a consultative approach to the development of the Draft Policy and Programme. This included the views of key stakeholders and clients including beneficiary groups, prior to the drafting of the document. The Inter-sectoral Committee for the Development of the National Policy on Poverty and National Poverty Reduction Programme, established in 2014, guided the policy development process and provided valuable discourse and input.

December 2016 Page 17 of 104
A series of technical consultation sessions with key stakeholders were held. These included: personnel within relevant MDAs; representatives of all Local Authorities; all technical Divisions of the PIOJ; members of the NGO community; faith-based organizations; persons from poor households; private sector representatives including the small business community; and academia. The Policy also benefited from lessons learned locally as well as from regional and international
best practices. Relevant studies and literature in the area also informed its content and focus.
The consultative process will be further strengthened through strategic public consultation and validation sessions on the approved Green Paper. This will include the involvement of a wider range of stakeholders including International Development Partners (IDPs). The approved Green Paper will also be made available for review through various electronic media, and tabled in Parliament.

December 2016 Page 18 of 104
2. SITUATION ANALYSIS (SUMMARY)
This section is a summary of the findings of the Situation Analysis. The detailed Situation Analysis is located in Appendix II, which, in the main, provides data up to 2014. Profile of Poverty The prevalence, depth and severity of poverty have declined since the 1990s but have trended upward since 2008. This trend is consistent across geographical areas, sex and age groups. The national poverty prevalence was 19.9 per cent in 20122. In addition to the poor, 4.2 per cent of the population were vulnerable to falling into poverty that is, consuming within 10.0 per cent above the poverty line. The bottom 50.0 per cent of Jamaican households accounted for 24.4 per cent of national consumption expenditure compared with 75.6 per cent consumed by the top 50 per cent (JSLC 2012). While only slightly higher proportions of males (20.6 per cent) than females (19.2 per cent) (appendix 9) were poor, slightly greater proportions of female headed households(15.9 per cent) compared to those headed by males (13.2 per cent) were poor (Appendix 8). Persons with disabilities were also more likely to be poor than persons without disabilities. The proportion of children in poverty, (25 per cent), is consistently higher than the working age adults (17.8 per cent) and the elderly (14.5 per cent).Children in female-headed single parent households are more vulnerable to poverty because of the lower per capita consumption due to larger household size as well as discrimination in employment and wages and less access to resources (PIOJ, 2014, 18-19). Children in the care of the state are vulnerable because of low educational outcomes, challenges with independent living, disability, stigma and unemployment or low wage jobs (PIOJ, 2014, 16). The School to Work Transition Survey conducted with youth aged 15-29 years indicates that some 39.9 per cent of youth consider themselves poor or nearly poor (ILO, STATIN and PIOJ 2013, 28). This is twice the national poverty prevalence of 19.9 per cent in 2012. Youth face unemployment rates three times that of adults 25 years and over in both 2012 and 2013(PIOJ 2013, 21.7). Youth unemployment was more prevalent among males and in urban areas. A large proportion of youth (15-24 years) is significantly at risk as they leave high school without qualification for employment and are not pursuing further education or training. The working age population is also affected by and vulnerable to poverty. The prevalence of poverty among working age adults was 17.8 per cent in 2012, and was highest in rural areas. Participation in social safety net is also low. The two industries that employ most workers in Jamaica have the lowest levels of NIS compliance, that is, Agriculture & Fishery, and Wholesale and Retail Trade sectors where most of the employed poor are located. The national registration rate for NIS was 38.7 per cent, some 9.4 per cent in NHF and 26.1 per cent in JADEP. The dependent elderly 65 years and over represents 8.6 per cent of the population. In 2012, 14.5 per cent of the dependent elderly were poor. Currently, less than one-third of persons 65 years
2 Most recent available data.

December 2016 Page 19 of 104
and older receive NIS pension benefits, and only 27 per cent of NIS pensioners qualify for the full flat rate benefit of $2800 per week (Christie 2013, 6). Elderly beneficiaries of the PATH programme receive $1 725.00 per month (MLSS 2015, 34). The JSLC data for 2008 indicate that 13.8 per cent of persons with disabilities were poor, and the majority of persons with disabilities who are poor, (42.9 per cent), are located in the rural areas. The 2001 Census data indicate that 14.1 per cent of persons with disabilities were employed with higher unemployment rates among males than females. The major risk factors identified for poverty among persons with disabilities are weak transitioning through educational levels, inadequate system for early detection of disabilities, limited access to employment, stigma, discrimination and exclusion (PIOJ 2013, 31). The indigent is described as persons who are unable to provide their basic needs and fully require daily support. For the 2011 period, 53.3 per cent of the outdoor poor were females and 59.5 per cent of indoor poor were males (PIOJ, 2013, 36). The homeless represents a relatively small percentage of the population and are among the vulnerable because of their low educational status, unemployment, lack of support systems, drug abuse, mental and other health problems, deportation and likely criminal record. Homelessness is more prevalent among males and in urban centres (PIOJ, 2013, 37-38). Small producers (farmers and fishers) are among those who are vulnerable to poverty. In 2014 there were 205,000 persons employed in the occupation group of Skilled Agriculture and Fishery Workers, representing 18.5 per cent of the labour force (STATIN 2014, 4). Ballayram (2008), identified that this occupational group faced significant risks to food security and livelihood, which includes lack of capital and credit, poor purchasing power, weak human and physical capital, seasonality of available employment, weak social fabric, indebtedness and lack of capital to expand livelihood. They are further challenged by praedial larceny, environmental hazards and risks, little social security coverage and are characterized by a cycle of low nutritional and educational outcomes. Micro and Small Enterprises contribute significantly to employment in Jamaica but are challenged by informality which creates a challenge in accessing capital, as well as excessive bureaucracy in their performance of their business, lack of training among business owners and limited access to international markets (PIOJ, 2013, 50). In 1996 micro and small businesses in Jamaica, accounted for 18.1 per cent of the employed labour force. They are mainly involved in the Wholesale and Retail Trade (55.7 per cent) and Community and Social and Personal Services sectors (23.3 per cent) (MIIC, 2013, 24, 25).

December 2016 Page 20 of 104
Socio-economic Determinants of Poverty Among the main issues identified as the determinants of poverty in Jamaica are low educational attainment levels, low income earning capability, inability to access basic social services, lack of economic opportunities leading to underemployment, unemployment and low wage employment, poor rural development impacting the opportunities and livelihoods of rural households and high levels of risks due to natural hazards (PIOJ, 2009). The industries in which the poor mainly worked include Agriculture, Forestry & Fishing (24.4 per cent); Wholesale & Retail, and Repair of Motor Vehicle/Equipment (20.6 per cent); Construction (11.3 per cent); and Private Households with Employed Persons (8.7 per cent) which are traditionally associated with lower income occupations. The data further identify that heads of poor households had lower levels of educational attainment than heads of non-poor households. Some 3.5 per cent of poor household heads had completed tertiary education, 20.2 per cent attained primary, 23.5 per cent completed secondary and 50.9 per cent completed some secondary schooling. The majority (70.6 per cent) of the poor went to public health-care facilities when ill, 24.8 per cent to private facilities and 4.5 per cent to other types of facilities. Comparatively, 51.7 per cent of the non-poor went to public health-care facilities when ill, 41.6 per cent to private facilities and 6.6 per cent to other types of facilities. Some 5.6 per cent of the poor had health insurance compared with 22.0 per cent of non-poor although their likelihood of having Non-Communicable Diseases was 22.2 per cent and 26.7per cent respectively. There are psycho-social, cultural, and normative features of society that perpetuate poverty. Consultations with key stakeholders revealed that these norms and practices include beliefs associated with childbearing and the definition of gender roles. These enable practices that impact household consumption, cognitive development, and educational outcomes, and place both household heads and members of the household at risk of poverty.3Family dynamics and instability also affect healthy child development, failure of which results in juvenile delinquency, child abuse and poor educational performance (Le Franc, Bailey and Branch, 1998:1 as cited in Rickets and Anderson 2009, 5).The quality of service delivery to the poor and access to information were also identified by stakeholders as factors impacting the quality of life of the poor. Poverty Reduction Context and Programmes Poverty reduction programmes are primarily state-led though there are non-government organizations engaged in poverty reduction efforts. For the financial year (FY) 2013/14, government spending on select poverty-reduction related programmes identified by MDAs was approximately $18.6 billion and $20.5 billion for the same set of programmes in FY 2014/15. The Programme of Advancement Through Health and Education (PATH) is the main programme aimed at poverty reduction and is implemented through the Ministry of Labour and Social Security. Other major poverty reduction programmes are implemented through the
3PIOJ Key Stakeholder Consultation held August 25, 2015.

December 2016 Page 21 of 104
Ministry of Local Government and Community Development, Board of Supervision Poor Relief Programme and the Office of the Prime Minister (Jamaica Social Investment Fund). Poverty reduction programmes are challenged by inadequacy of benefits, targeting and cost effectiveness and sustainability of the programmes based on reliance on external funding, as well as duplication of efforts. Additionally, there are institutional challenges including lack of capacities, weak monitoring and evaluation and information systems, lack of clear definition of roles and programme overlaps. The National Poverty Reduction Policy and Programme replace the National Poverty Eradication Policy and Programme. It is developed, and will be implemented in context of existing policies and international agreements with the overarching framework being Vision 2030 Jamaica National Development Plan. The legislative and policy environment and linkages with other policies and programmes are detailed in Section 6.

December 2016 Page 22 of 104
3. THE NATIONAL POLICY ON POVERTY
3.1 Guiding Principles The National Policy on Poverty embraces seven core principles, which form the basis for empowering individuals, households and communities to achieve their full potential and thereby contribute to holistic national development.
1. Respect for Human Rights: The policy acknowledges the inalienable fundamental human rights and dignity of all citizens under the Jamaican Constitution, and in keeping with international covenants of which Jamaica is a signatory.
2. Inclusive and Participatory Development: The coordination of national efforts on poverty shall include the partnership of multiple stakeholders in Government, the private sector, non-governmental organizations (NGOs), as well as poor and vulnerable persons, at the national and sub-national levels. Gender and disability considerations will be mainstreamed throughout. This guiding principle embodies the concept of “no one left behind” as is embraced and promoted under the 2030 Agenda for Sustainable Development.
3. Shared Prosperity: The achievement of shared prosperity for all levels of the society through sustainable economic growth that facilitates the participation in viable livelihood opportunities and the benefits of national development in order to counteract vulnerability and inequality, and social exclusion.
4. Equitable Access to Basic Goods and Services: Using the Rights-based Approach, the Policy seeks to ensure fair and objective delivery of basic social services to all citizens, in particular the most vulnerable. The policy also enshrines the efficient and effective delivery of public goods and services to all citizens.
5. Evidence-Based Monitoring and Evaluation (M&E): The Policy promotes strong systems for monitoring, evaluating, and strengthening programmes while utilizing relevant research, data and best practices to improve systems and programmes.
6. Transparency and Accountability Processes to define, develop, and review policy and programme parameters are in keeping with approved formats and accountable procedures. The Policy also promotes clear ownership of responsibility on the part of the Government and its partners for the implementation of the National Poverty Reduction Programme.

December 2016 Page 23 of 104
7. Sustainable Development Approaches The Policy recognizes the importance of the natural environment to sustainable livelihoods and development, and therefore promotes environmental stewardship through sustainable management and use of natural resources and increasing capacity to adapt to climate change.
3.2 Vision Statement
Every Jamaican is consuming goods and services above the minimum acceptable
national standards, and has equal and equitable opportunities and support to achieve
and maintain income security and improved quality of life.
3.3 Policy Goals and Intermediate Outcomes As indicated in Goals 1 and 2 below, the Policy and Programme aim to eradicate extreme poverty by 2026 and reduce the national prevalence of poverty by 2030.Within the medium-term poverty programmes, specific targets will be set for each Goal, and focus will be placed on disaggregation by sex, geographic area, and age cohorts, where feasible. 3.3.1 Policy Goals GOAL 1: Extreme (food) poverty eradicated by 2022 GOAL 2: National poverty prevalence reduced significantly below 10 per cent by 2030. 3.3.2. Intermediate Outcomes of the Policy Outcome 1: Institutional framework for poverty reduction coordination established and
strengthened at national and sub-national levels.
Outcome 2: Legislative environment that supports sustainable poverty reduction facilitated and
strengthened.
Outcome 3: A framework of cooperation and coordination among government and non-
government partners towards poverty reduction outcomes at national and sub-national levels
established.
3.4 Thematic Areas The Government and its partners shall pursue strategies and actions under the following 7 Policy Thematic Areas:
1. Social Safety Nets

December 2016 Page 24 of 104
2. Human Capital Development 3. Livelihood Creation And Income Security 4. Food And Nutrition Security 5. Basic Social And Physical Infrastructure 6. Psycho-Social, Cultural, And Normative Advancement and 7. Coordination And Capacity Building
3.5 Policy Objectives Objective 1: Strengthen social safety nets to address extreme poverty-induced deprivations (including hunger). Objective 2: Promote and expand human capital development among the poor and vulnerable (including children and persons with disabilities). Objective 3: Enhance income security among the poor and vulnerable. Objective 4: Enhance food and nutrition security of the poor. Objective 5: Strengthen basic social and physical infrastructure. Objective 6: Address psycho-social, cultural and normative influences on poverty. Objective 7: Strengthen coordination and capacity building for poverty reduction.
3.6 Strategies and Actions 1. Social Safety Nets Objective 1: Address extreme poverty-induced deprivations including hunger through strengthened social safety nets. Having established that it is the right of every citizen to have access to basic social services in order to have his/her basic needs met, and recognizing the responsibility of the Government in facilitating an adequate quality of life for those deprived of familial and other support, the Government and its partners shall:
a. Provide adequate budgetary support to the identified public safety net initiatives. b. Enact and amend legislation to strengthen the policy environment for social assistance in
an effort to address barriers faced by the poor. c. Ensure that basic amenities, public services, and facilities are accessible to the poor,
whether by means of targeted or universal interventions. d. Provide for the basic needs of food, shelter, water, sanitation, income, education and
health care for the poor, within specified programmes and initiatives. e. Provide income transfers in the form of cash or kind to support the poor (individuals or
families) identified through appropriate screening mechanisms and processes. f. Facilitate institutional care as required, for the infirm, indigent or homeless, to ensure
that the basic needs of the most vulnerable are met. g. Facilitate programmes and interventions to adequately respond to the needs of the
vulnerable and temporary poor in cases of misfortune or negative climatic events such as natural and manmade disasters.

December 2016 Page 25 of 104
h. Utilize transparent screening mechanisms to objectively identify the poor for differentiated state interventions as deemed necessary.
i. Facilitate access to vital documents for poor citizens (including Birth Certificates, National ID, and TRN).
2. Human Capital Development Objective 2: Promote and expand human capital development among the poor and vulnerable (including children and persons with disabilities). Recognizing the potential of each individual and family, and the need for interventions to prevent intergenerational transmission of poverty, the Government and its partners shall:
a. Facilitate equity, access and opportunity for poor individuals and families through the creation of enabling and non-discriminatory policy environments in the areas of healthcare (preventative, promotive, curative and rehabilitative), education and training.
b. Build the capacities of poor households to break the intergenerational cycle of poverty and become independent of social assistance programmes, through: emphasis on human capital development, early intervention, greater support and application of improved case management interventions and approaches, and the appropriate linkages, referrals, and training opportunities.
c. Promote and facilitate the strengthening of holistic family-based services, in support of specific interventions for children, youth, the working age, elderly, and persons with disabilities, of both sexes.
d. Facilitate certification/standards acquisition and employment (school-to-work) transition support is included in training modules that target the poor and other vulnerable groups.
e. Empower families through improved access to services, information and resources in response to needs.
3. Livelihood Creation and Income Security Objective 3: Enhance livelihood creation and income security among the poor and vulnerable Recognizing that income security is critical to independence from welfare programmes, Government and its partners will encourage and facilitate labour market participation of the poor through sustainable job creation, higher income generation, protection of income, mitigation of livelihood risks, livelihood creation and economic opportunities in keeping with the International Labour Organization Decent Work Agenda4 through:
a. Identification and improvement of human capital (personal assets or capacities, talents and skills) for income generation and Decent Work.
b. Identification and improvement of community assets for income generation and Decent Work through community-based and other non-government organizations in development of skills and community engagement.
4 The Decent Work Agenda embodies the four strategic objectives of the ILO: Promoting Jobs, Guaranteeing rights at work; Extending social protection; and Promoting social dialogue. A crosscutting objective is gender equality.

December 2016 Page 26 of 104
c. Timely review and adjustments to the Minimum Wage, in response to changing economic realities.
d. Improvement of livelihoods through access to business development services, micro-finance and social enterprise options for targeted clients.
e. Facilitate and encourage efforts towards improved productivity, sustainability of livelihoods and building resilience.
f. Build capacities to enable participation in non-traditional industries. g. Expansion of the provision of information and training in financial literacy and business
development through various media and for various groups. h. Encouragement/promotion of participation in the National Insurance Scheme, other
insurance and pension offerings. i. Facilitating increased access to civil registration documents for the poor and vulnerable
for access to financing. j. Improved access to water and water storage systems and facilities for the purpose of
irrigation. k. Facilitation of land tenure security through programmes for land titling and other
appropriate options for medium to long-term land use. l. Supporting the productive use of underutilized agricultural lands. m. Promotion of greater insurance of assets. n. Facilitating community-based and family-based interventions for care services for family
dependents (elderly, children persons with debilitative health issues, persons with restrictive disabilities) in order to support the availability of working-age persons for the labour market.
o. Facilitation of eligible Jamaican workers in overseas employment, provision of options for their participation in savings schemes and social security provisions, and increasing the availability of support services.
p. Promoting options for redeployment of persons for continued income generation. q. Promoting environmentally sustainable livelihoods and reduce risks associated with
climate change and natural hazards through the regulation of environmental practices. r. Enabling entrepreneurs in the informal sector to formalize and strengthen businesses
and access social insurance and pension schemes. s. Providing opportunities and support to the elderly for income-generating activities, in an
effort to promote active ageing, income security, and inter-generational transfer of knowledge and skills.
4. Food and Nutrition Security Objective 4: Enhance food and nutrition security of the poor Recognizing the basic necessity of a nutritionally adequate diet for human survival and optimal healthy development, the Government and its partners shall:
a. Design and implement appropriate programmes, mechanisms and facilities to ensure the availability, accessibility, safety, and stability of sufficient food supply for the extreme/food poor (food insecure) across the life cycle.
b. Formulate programmes to detect, prevent and consistently mitigate malnutrition caused by diet and inadequate intake of food.

December 2016 Page 27 of 104
c. Ensure the availability of emergency food stocks for designated time periods in keeping with the National Food and Nutrition Security Targets for emergency recovery and relief.
d. Support institutional strengthening, integration and expanded coverage, reach and efficacy of the National School Feeding Programme from the early childhood to secondary levels in keeping with nutritional guidelines to ensure equity, adequacy and accessibility.
e. Promote nutritional and physically healthy lifestyle practices consistent with national and international dietary goals.
f. Improve access to water and water storage systems and facilities for the purpose of irrigation.
g. Increase support to subsistence farming to inform crop production, productivity, diversification and expansion.
h. Strengthen efforts to address the issue of praedial larceny. i. Identify and provide support to reduce risk from natural hazards and phenomena such as
climate change to areas/communities at risk to mitigate livelihood losses to farmers, fishers, fish farmers and other producers.
j. Facilitate the development of comprehensive agricultural insurance and other risk transfer mechanisms inclusive of subscription to national and regional disaster funds.
k. Build the capacity of small-scale rural producers to deal with price variations, facilitate their access to financial services, improve their agricultural risk management capacity and promote sustainable agricultural practices.
l. Promote backward and forward integration and value chain enhancement of local produce to improve productivity and obtain higher returns on investment.
m. Facilitate productive inclusion through market linkages of local agricultural producers with safety net programmes, other feeding programmes at the local and national levels.
n. Support infrastructure needed by the sector such as access to farm roads and development projects to ensure small-scale farmers increase their productivity and upgrade their market connectivity.
5. Basic Social and Physical Infrastructure Objective 5: Strengthen basic social and physical infrastructure Recognizing the fundamental necessity of basic public social and physical infrastructure to facilitate well-being of the population, the Government and its partners shall:
a. Provide and facilitate equitable/equal access to basic public infrastructure such as water, sanitation and solid waste disposal, electricity, schools, healthcare facilities, housing, roads and other public facilities and services, the minimum of which should be in keeping with the specified social protection floor for Jamaica.
b. Strengthen existing systems for the care and maintenance of public community infrastructure and promote collective responsibility among users in rural and urban communities.
c. Facilitate a policy environment that supports the creation of partnerships with private and non-government entities for the provision of public infrastructure facilities and services.

December 2016 Page 28 of 104
6. Psycho-social, Cultural, and Normative Advancement Objective 6: Address psycho-social, cultural and normative influences on poverty Recognizing the normative influences on poverty and the multi-dimensional response required for poverty reduction, including psycho-social and culturally relevant interventions, the Government and its partners shall:
a. Support public education thrust to enhance knowledge, promote mind-set change, and strengthen positive values and attitude, while building social capital.
b. Encourage participatory approaches and social inclusion in community interventions. c. Prioritize the delivery of training in citizenship values, positive attitudes and personal
responsibility. d. Facilitate awareness and delivery of mental health services. e. Identify and implement sustainable and effective strategies to socialization as an
approach to addressing cultural norms, myths, mind-set and behaviours that perpetuate poverty.
f. Facilitate capacity building in effective parenting principles and strategies, while providing a supportive environment for parents and families, as necessary.
g. Identify the needs and create access to basic services for poor and vulnerable. h. Promote acquisition of civil identity from birth to death for each citizen through access
to pertinent registration and identification processes for public documentation e.g. Birth Certificate, Taxpayer Registration Number, National Insurance Scheme number.
i. Provide relevant sensitization and training for service providers to enhance positive attitude towards the poor and strengthen skills in transferring hope and influencing positive mind-set, attitude and behaviour change, where required.
j. Encourage and facilitate positive mentorship and training in soft skills. k. Encourage and promote the sharing of positive values, attitudes, cultural practice,
knowledge, and coping strategies among the poor, where relevant.
7. Coordination and Institutional Strengthening Objective 7: Strengthen Coordination and Capacity Building for Poverty Reduction. Recognizing the importance of a coordinated and systematic approach to impacting, monitoring and supporting poverty reduction interventions, the Government shall ensure the following:
a. A single locus of institutional responsibility, under an assigned ministry (and/or Agency) remains in place for the issue of poverty reduction.
b. Informed and responsive mechanisms and instruments for monitoring and measuring poverty within the assigned ministry/agency are adequately resourced.
c. Evidence-based and responsive mechanisms for measuring poverty are established. d. Identification and provision of resources to support institutional strengthening and
capacity building of key stakeholders (including NGOs and CBOs) in the area of poverty reduction and social protection.
e. Development and strengthening of Management Information Systems (MIS) to support monitoring and evaluation capacities across agencies.
f. Increased use of objective selection mechanisms for targeted programmes.

December 2016 Page 29 of 104
g. The use of objective, reliable, accurate and timely data and information to guide programme development and modification.
h. The maintenance and strengthening of responsive budgeting to support new and existing poverty programmes.
i. Development and strengthening of mechanisms to support private sector involvement in poverty reduction programmes.
j. Facilitate a system of coordinating with International Development Partners (IDPs) to direct funding to prioritised poverty reduction programmes.
k. Facilitate research and best practice modelling for effective adoption of poverty interventions.
l. Strengthen networking among service partners to drive access to programmes and improve service efficiencies.

December 2016 Page 30 of 104
4. KEY STAKEHOLDERS AND THEIR ROLES (POLICY AND PROGRAMME) In support of an integrative approach to effective service delivery and resource mobilization, the importance of partnerships is underscored. The primary role of key partners is noted in Table 1 below:
Table 1: Partnerships for Poverty Reduction
Partners Roles
Individuals, Households & Communities
Main partners and beneficiaries of household/individual and community interventions.
Acknowledge and demonstrate personal and collective responsibility.
Partnership for sustainability of outcomes.
Government Consultatively define legislative/policy/programme priorities and institutional framework, as well as results-based monitoring and evaluation.
Provide and align resources for basic socio-economic services.
Strengthen the technical capacity of MDAs and other relevant partners that serve the poor.
Implement programmes and provide services.
Build, encourage, and maintain partnerships.
NGOs (CBOs, FBOs, PVOs etc.)
Support and enhance service provision efforts of the GOJ.
Establish partnership model to support key gaps identified in the policy and programme.
Mobilise communities for participation and provide leadership in identifying and articulating community needs.
Capacity building for project management, financial sustainability and service provision particularly for at risk groups.
Private Sector Develop, demonstrate, and maintain corporate social responsibility.
Establish public/private partnership model to support key gaps identified in the poverty policy and programme.
Programme support and incentives in crucial areas such as production and wealth- generation skills, technology, training, job creation, social entrepreneurship, research and development, marketing and other technical assistance.
Development Partners
International co-operation and technical assistance for the defined National Policy on Poverty and National Poverty Programme.
Using current mechanisms for IDP coordination, ensure information sharing between GOJ and IDPs, and alignment of IDP and national priorities in order to reduce overlaps, duplication/fragmentation and realise more effective focussing of resources.
Strengthen support to programmes through increased diaspora engagement in pertinent areas.

December 2016 Page 31 of 104
5. INSTITUTIONAL AND MONITORING & EVALUATION FRAMEWORKS (POLICY AND PROGRAMME) This section outlines the broad institutional arrangements and key components of a monitoring and evaluation (M&E) framework. A detailed M&E Plan (inclusive of Action Plan) will be developed for each medium-term.
5.1 Institutional Framework (Revised) Best practice approaches suggest the need for a structured process of coordination and monitoring of social policies and programmes. Such coordination will support the work of ministries and agencies involved in the wide range of strategic interventions, without encroaching on the immediate roles and responsibilities of each agency. The Ministry with responsibility for planning has responsibility to Cabinet for monitoring and implementation of the Policy on Poverty. Formally established December 2013, the Poverty Reduction Coordinating Unit (PRCU) within the Planning Institute of Jamaica will provide technical and secretariat support for the related medium-term programmes on behalf of the GOJ. Recognizing that poverty is a multidimensional and crosscutting development issue, the PRCU therefore supports the work of MDAs, the private sector and NGOs involved in poverty reduction. Appendix 13 outlines considerations that inform the PRCU’s functions outlined below. 5.1.1 Role of the PRCU: 1. Secretariat services for monitoring the implementation of the National Policy on Poverty
through the participatory preparation and implementation of Medium-Term Poverty Reduction Programmes, inclusive of a Monitoring and Evaluation Framework.
2. Perform technical managerial and coordination functions for the Poverty Reduction Programme Committee (PRPC).
3. Provide information to inform allocation of GOJ’s resources and cost-effective use for short
term, intermediate and long term poverty reduction initiatives to reap measurable and sustainable outcomes.
4. Provide technical advice to ensure coherence between social, economic and sustainable
development policy directions and the National Poverty Policy and Programme. The PRCU will facilitate synergy and integration needed to assist development partners in identifying key poverty reduction support areas aligned with the GOJ’s priorities.
5. Provide structured and objective approaches to assess and disseminate information on
poverty reduction interventions, and monitor and evaluate the overall reach of services and initiatives.

December 2016 Page 32 of 104
6. The PRCU will provide quarterly and annual reports on the status of the National Poverty
Reduction Programme to the relevant committees including Poverty Reduction Programme Committee (PRPC) and the National Social Protection Committee (NSPC). The PRCU will also provide annual and ad hoc reports to the Cabinet.
5.1.2 Policy Oversight The National Social Protection Committee (NSPC), for which the PIOJ has oversight, is the institutional structure for monitoring Social Protection and the implementation of the Social Protection Strategy (SPS). The NSPC has policy level oversight of poverty reduction, and will therefore receive input from the PRPC, while providing general direction for poverty reduction programming. 5.1.3 Programme Implementation and Monitoring Structures National: The Poverty Reduction Programme Committee (PRPC) will be established as the main body for monitoring the implementation of the policy at the national level. The multi-sectoral committee will be comprised of relevant organizations implementing and supporting the National Poverty Reduction Programme. The composition will be guided by the slate of programmes to be implemented and monitored under each Medium-term Poverty Reduction programme, and as such will be revisited with each cycle. The PRPC shall consist of programme heads (directors/managers) of Government Ministries Departments and Agencies implementing programmes under the medium term framework, as well as select programme partners from private sector organizations and non-government organizations (NGOs, CBOs and FBOs). The PRPC will meet on a bi-monthly basis, or more frequently initially. The PRPC may establish relevant sub-committees, for specific purposes, and invite the occasional participation of non-members as required. The functions of the PRPC will include, inter alia:
1. Providing policy and technical advice on poverty issues to Cabinet Ministers responsible for planning.
2. Discussing implementation progress of the Poverty Reduction Programme. 3. Identifying areas for partnership and strengthening. 4. Ensuring coherence in keeping with the Social Protection Strategy and other areas of
public policy. 5. Identifying policy-level issues to be brought to the attention of the National Social
Protection Committee (NSPC) as may be appropriate. 6. Fostering dialogue and partnerships towards streamlining programme coordination. 7. Developing annual poverty programme work plans in keeping with the Medium Term
Poverty Reduction Programme (including Action Plan and M&E Framework). 8. Provide oversight to the execution of midterm and final evaluation of the medium-
term poverty programmes. 9. Facilitate and promote data and information sharing among key stakeholders.
Local/Parish Level: The Poverty Reduction Programme will utilize the same local/parish structures for programme implementation and monitoring as those employed by the NSPC.

December 2016 Page 33 of 104
Figure 1: Institutional Framework for the Poverty Reduction Programme
Figure 1 depicts the proposed institutional framework for the National Policy and Programme, which is essentially a linking or merging with the approved institutional framework for the National Social Protection Committee approved for the Social Protection Strategy. This model was proposed, following consultation and further consideration of the institutional arrangement proposed in the Conceptual Framework for the Policy and Programme.
5.2 Monitoring and Evaluation Framework The National Policy and Programme will be operationalized through a series of 3-year medium-term national poverty reduction programmes. A detailed Monitoring and Evaluation (M&E) Framework to guide and monitor policy and programme implementation and track programme outcomes will be developed. The M&E Framework will include a work plan for the medium term programme supported by a results-based monitoring and evaluation Logical Framework. The M&E framework will identify key indicators, targets, deliverables, responsible partners/actors, and timelines. It will also detail the institutional arrangement for implementation and monitoring, as well as the reporting and communication formats and frequency, inter alia.
CABINET
Portfolio Ministry
PIOJ
NSPC
Income Security
Sub-Committee
Social Transfers
Sub-Committee
Human Resource Development
Sub-Committee
Social Services and Infrastructure
Sub-Committee
Parish NSP Committees
PIOJ
PRPC

December 2016 Page 34 of 104
6. CONTEXT FOR POVERTY REDUCTION (POLICY AND PROGRAMME)
The National Policy on Poverty and its associated National Poverty Reduction Programme recognizes that successful implementation and sustained poverty reduction will be influenced by a number of factors. These include global, regional and national environments, government priorities and policies, available resources, inter alia. This section underscores the importance of policy coherence, socio-economic linkages, resource mobilization and funding. Potential risks to the policy are also noted.
6.1 Policy Coherence – Linkages with Other Policies, Legislation and Programmes
Public policies aimed at reducing vulnerability to poverty and offering social protection spans over a century and dates back to the Poor Relief Law (1886). The policy tools have evolved from the traditional welfare-driven focus to more targeted human capital development. Of note, post-independence developments include:
- The National Insurance Scheme (NIS) in 1966;
- The National Minimum Wage in 1979;
- The Micro Enterprise Development Agency in 1991 (renamed Micro Investment Development Agency - MIDA);
- The Poverty Eradication Policy and the National Poverty Eradication Programme in 1995;
- Jamaica Drug For The Elderly Programme (JADEP) in 1996;
- National Health Fund Individual Benefits Programme in 2003;
- The Pensions Act of 2004 which introduced a regulatory framework for public and private pension schemes;
- The Secondary School Fee Cost Sharing Programme in 1994;
- Removal of the user fees for public health care in 2008; and
- The Social Safety Net (SSN) Reforms of the 2000s. The main achievements of the SSN reform5 include: 1. The designation by Cabinet of the Ministry of Labour and Social Security (MLSS) as the
central welfare focal point. 2. Introduction of PATH in 2002 to consolidate the Outdoor Poor Relief, Food Stamps
and Public Assistance programmes.
5 Characteristics prior to 2000 include several unrelated programmes, no central database of beneficiaries, varied
assessment mechanisms, subjective unscientific assessments, duplication of efforts, lack of transparency, inefficient
use of resources, high overheads, archaic legislation (1886) and varied/inadequate welfare payments (PIOJ 2005).

December 2016 Page 35 of 104
3. Development of the Beneficiary Identification System (BIS) as a transparent and objective screening mechanism used for PATH.
4. A central PATH database established by the MLSS. 5. A Benefits Review Mechanism (BRM) to maintain real value of benefit levels instituted. 6. The commencement of the process to draft a National Assistance Bill to modernize the
legislative framework. The overarching policy environment consists of the Vision 2030 Jamaica – National Development Plan; Vision 2030–Poverty Reduction Strategic Plan; the Medium Term Socio-Economic Policy Framework 2015-2018; and the Social Protection Strategy (2014) within the macroeconomic framework of the Growth Inducement Strategy (2011); and a four year International Monetary Fund Programme agreed in 2013.6Vision 2030 Jamaica is the country’s first long term social and economic policy framework. Vision 2030 Jamaica has four interrelated goals directly relevant to poverty reduction:
1. GOAL 1: Jamaicans are empowered to achieve their fullest potential 2. GOAL 2: The Jamaican society is secure, cohesive and just 3. GOAL 3: Jamaica’s economy is prosperous 4. GOAL 4: Jamaica has a healthy natural environment
Vision 2030 Jamaica, and its Poverty Reduction Strategic Plan, seeks to reduce poverty to ≤ 10 per cent by 2030 through improved human capabilities and opportunities to find sustainable livelihoods (Table 1). The establishment of the PRCU is a specific action from the Medium Term Socio-Economic Policy Framework (MTF 2012-2015) necessary to coordinate national poverty reduction through participatory processes. The MTF (2012-2015) has 4 themes: Development and Protection of Human Capital; National Security and Justice; Economic Stability, Competitiveness and Employment; and Environmental Resilience and Climate Change Response. The MTF themes are aligned to 8 of the 15 National Outcomes, under 4 National Goals of Vision 2030 Jamaica. The MTF has 8 prioritized national outcomes: A Healthy and Stable Population; World Class Education and Training; Effective Social Protection; Security and Safety; Effective Governance; A Stable Macro-economy; An Enabling Business Environment; and Hazard Risk Reduction and Adaptation to Climate Change. The 29 Sector Plans under Vision 2030 Jamaica also contain relevant strategies, supportive of poverty reduction outcomes. Table 2 shows the indicators and targets aligned to Vision 2030 Jamaica that are relevant to poverty reduction.
6 Appendix 13 synthesises the placement of poverty reduction within Government’s public policy framework.

December 2016 Page 36 of 104
Table 2: Poverty Reduction Indicators and Targets
Indicators Baseline Actual Targets
2007 2009 2010 2012 2012 2015 2018 2030
National Poverty Rate (prevalence) (per cent)
9.9 16.5 17.6 19.9 12.1 ≤10
Percentage of children in quintile 1 receiving PATH benefits (per cent) (1)
65.8 68.2 72 82.3 80 85
Percentage of PATH beneficiaries in consumption quintiles 1 and 2 (per cent)(1)
75 66.5 67.1 61.7 65 69
Source: MTF (2015-2018). Note :( 1) Targets for these indicators are provisional. Note: The Jamaica Survey of Living Conditions (JSLC) 2013 and 2014 are being prepared. The targets for the national poverty rate for 2015 and 2018 will be finalized once these reports are completed.
Poverty reduction is a cross-cutting issue of the Social Protection Strategy (SPS 2014). The overall strategy statement on poverty reduction presented in the SPS is to “Promote the attainment of living standards of persons or households above levels that are considered as being in poverty based on accepted national criteria” (SPS May, 2014, 88). The SPS promotes state policies geared at prevention, promotion, mitigation, protection and transformation. The social protection system provides a social safety net within the Social Protection Floor from conception to the elderly life stage. Health, education, labour market, housing, food security, and the natural environment anchor the system from which elements of the Social Protection Floor are derived to enable basic income security and basic social services. The SPS has clear synergy with the Vision 2030 Jamaica Poverty Reduction Strategic Plan where the outcomes and associated strategies are concerned. The strategies include:
“Equitable access to basic goods and services” – focus on access of the poor to quality services;
“Responsive public policy in place” – sensitivity to the needs of the poor e.g. minimum wage and asset formation;
“Economic opportunities for sustainable livelihoods created and/or expanded” – focus on human capital development and decent employment for the poor; and
“Social inclusion of the poor promoted” – in governance, justice and decision making (SPS May, 2014, 88).
The Growth-Inducement Strategy (GIS 2011) and the IMF Extended Fund Facility Agreement (2013) incorporate social protection and social sector spending as critical enablers of economic growth in the short and medium term. The unmet GIS (2011) growth projection and poverty reduction targets7provide an opportunity for revision in light of a National Policy on Poverty
7 With a baseline scenario of 2.1% real growth, the poverty rate in 2011 was “projected to be in the range of 16.5% -
18.1%, representing a decline of 2.0 - 2.2 percentage points, compared with 2010” (GIS 2011, 16). The projected

December 2016 Page 37 of 104
and Poverty Reduction Programme. The policy and programme will benefit from the improved long term competitiveness of the economy despite potential short-term negative impact on poverty. Beyond the Poor Relief Act, 1886 and overarching policy context outlined, there is absence of legislative support for diverse poverty related programme offerings and a locus of institutional responsibility for poverty since the termination of the NPEP (1995/1996) in 2007/2008. Notwithstanding, the tenets of the National Policy on Poverty are closely aligned with several existing policies in areas of education, family support, health, nutrition, migration and recognized vulnerabilities in relation to gender, children, the youth, elderly and persons with disabilities as examples (Table 4). In addition to the policies presented in Table 4, other supportive policies being prepared include the Agricultural Land Utilisation Policy; Community-based Tourism Policy; Craft Policy; Compulsory Education Policy; Safe Schools Policy; Special Education Policy; National Lifelong Learning Policy; National Housing Policy; National Squatter Management Policy; National Infant and Young Child Feeding Policy; National School Feeding Policy; National Fisheries and Aquaculture Policy; Foreign Trade Policy; Climate Change Policy Framework for Jamaica; Jamaica Hazard Mitigation Policy; National Identification System Policy; National Water Policy and Draft Diaspora Policy. Existing legislation such as the Education Act 1965, Employment (Equal Pay for Men and Women) Act 1975, Minimum Wage Act 1938, Housing Act 1969, Human Employment and Resource Training Act 1982, Public Health Act 1985, Child Care and Protection Act 2004 and Pensions Act 1976 provide an environment conducive to poverty reduction efforts (Table 3). The GOJ is also a signatory to international agreements which affirm the development of human capacities necessary to counter the antecedents of poverty. The International Covenant on Economic, Social and Cultural Rights; Convention on the Elimination of all Forms of Discrimination Against Women; Convention on the Rights of the Child; Convention on the Rights of Persons with Disabilities; the Millennium Development Goals; the 2030 Agenda on Sustainable Development Goals are indicative (Box 1).The National Policy on Poverty, therefore seeks to strategically marshal Jamaica’s international agreements, legislative and policy commitments into comprehensive statements of priority national efforts towards sustainable poverty reduction for ultimate eradication.
growth however did not occur and poverty prevalence has increased steadily since 2008 to 19.9% in 2012. The GIS
further forecasts, “higher growth rates are projected to further reduce poverty rates to a range of 14.8%-16.4%
(assuming a 3.7% growth rate) and 12.4% - 14.6% (assuming a 5.2% growth rate)” (GIS 2011, 17).

December 2016 Page 38 of 104
Table 3: Select Policies, Legislations and International Agreements
POLICIES/ STRATEGIES
ECONOMIC: Micro, Small and Medium-sized Enterprises (MSME) Policy (2013); Public Sector Pension Reform Policy (tabled 2013); and Growth Inducement Strategy for Jamaica in the Medium Term (2012)
EDUCATION: Competence-Based Transition Policy (2009) and National Policy on Reintegration of School-Aged Mothers into the Formal School System (2013)
FAMILY: National Parenting Support Policy (2010)
GOVERNANCE: Local Government Policy (1993)
POPULATION AND HEALTH: Ministry of Health Strategic Business Plan (2015-2018); National Population Policy (1995); Drugs for the Elderly Policy (1996); National Policy for the Promotion of Healthy Lifestyles in Jamaica (2004); and National Policy and Plan of Action on International Migration and Development (2015); National Integrated Strategic Plan on Sexual and Reproductive Health and HIV (2014-2019).
LAND/INFRASTRUCTURE: National Land Policy of Jamaica (1997)
NUTRITION: National Infant Feeding Policy (1995); National Food and Nutrition Security Policy (2013) and Food Safety Policy (2013)
VULNERABLE GROUPS: National Policy on Children (1997); National Policy for Senior Citizens (1997); National Policy for Persons with Disabilities (2000); National Youth Policy (2004) and National Policy for Gender Equality (2011).
SOCIAL PROTECTION: Jamaica Social Protection Strategy (2014)
LEGISLATION Poor Relief Act (1886, 1973); Pensions Act (1947, 2004); Housing Act (1955, 1968); Farm Loans Act (1965, 1974); Students’ Loan Act (1971, 1996); Employment (Equal Pay for Men and Women) Act (1975); Maternity Leave Act (1979); Education Act (1980); Human Employment and Resource Training Act (1982, 2003); Public Health Act (2003); National Health Fund Act (2003,2011); Child Care and Protection Act (2004, 2009); Maintenance Act (2005); Early Childhood Act (2007, 2009); Minimum Wage Act (2011); National Insurance Act (2011); Agro Investment Corporation Act (2009, 2013), and National Disability Act (2014)
INTERNATIONAL AGREEMENTS
Employment Policy Convention (1975); International Covenant on Economic, Social and Cultural Rights (1976); Convention on the Elimination of all Forms of Discrimination Against Women (1981); Convention on the Rights of the Child (1990); Convention on the Rights of Persons with Disabilities (2007); the Millennium Development Goals (2000-2015); 2030 Agenda on Sustainable Development (2015); International Conference on Population and Development (1994); and ILO Decent Work Agenda; Samoa Pathway (2014); World Summit for Social Development: Declaration and Programme of Action (1995).

December 2016 Page 39 of 104
Box 1: Select Goals and Targets – 2030 Agenda on Sustainable Development
Source: 2030 Agenda on Sustainable Development Goals: Government of Jamaica National Outcome Document (2015)
Proposed Goal 1 – End poverty in all its forms everywhere
Proposed Target 1.1 – By 2030, eradicate extreme poverty for all people everywhere, currently measured as people living on less than US$1.25 a day.
Proposed Target 1.2 – By 2030, reduce at least by half the proportion of men, women and children of all ages living in poverty in all its dimensions according to national definitions.
Proposed Target 1.3 – Implement nationally appropriate social protection systems and measures for all, including floors, and by 2030 achieve substantial coverage of the poor and the vulnerable.
Proposed Target 1.4 – By 2030 ensure that all men and women, particularly the poor and the vulnerable, have equal rights to economic resources, as well as access to basic services, ownership, and control over land and other forms of property, inheritance, natural resources, appropriate new technology, and financial services including microfinance.
Proposed Target 1.5 – By 2030 build the resilience of the poor and those in vulnerable situations and reduce their exposure and vulnerability to climate-related extreme events and other economic, social and environmental shocks and disasters.
Proposed Target 1.a – Ensure significant mobilization of resources from a variety of sources, including through enhanced development cooperation to provide adequate and predictable means for developing countries, in particular LCDs, to implement programmes and policies to end poverty in all its dimensions.
Proposed Target 1.b – Create sound policy frameworks, at national, regional and international levels, based on pro-poor and gender-sensitive development strategies to support accelerated investments in poverty eradication actions.
Proposed Goal 2 – End hunger, achieve food security and improved nutrition and promote sustainable agriculture
Proposed Target 2.1 – By 2030 end hunger and ensure access by all people , in particular the poor and people in vulnerable situations including infants, to safe, nutritious and sufficient food all year round.
Proposed Target 2.2 – By 2030 end all forms of malnutrition, including achieving by 2025 the internationally agreed targets on stunting and wasting in children under five years of age, and address the nutritional needs of adolescent girls, pregnant and lactating women, and older persons.

December 2016 Page 40 of 104
6.2 Economic Context Global data and experience have shown that poverty reduction results from a strategic and concerted set of efforts that focus attention on the enabling environment for economic growth, employment and income creation. This Policy document underscores the significant influence and impact that the macro-economy will have on the success of poverty initiatives, a lesson that Jamaica’s economic history has reinforced in the past decades. As outlined in the Situation Analysis, growth rates of Gross Domestic Product have been stymied by the country’s exposure to international shocks such as oil price rises and the global recession, which have negatively affected several industries including Mining & Quarrying, Construction and Manufacture. These, in addition to the impact of disasters caused by natural hazards, have created severe challenges which adversely impact the country’s efforts to attain sustained levels of economic growth. The results have been unfavourable to employment and productivity, and have impacted the incomes and circumstances of many vulnerable households.
The National Policy on Poverty therefore recognizes that there are several economic imperatives that will factor into sustainable achievements in poverty reduction, arising from the fact that economic growth is necessary for improved outcomes. These will include:
1. Strengthening the legislative and policy processes to support achievement of national poverty reduction goals.
2. Use of fiscally sound monetary and tax policies to stimulate growth, and to ensure equitable distribution through effective social and economic policies, and the targeting of the most vulnerable.
3. Adoption of measures to improve competitiveness of local markets. 4. Addressing debt accumulation and debt servicing through credible liability management. 5. Promotion of productivity and job creation, and protection from unemployment. 6. Facilitating private sector investments and strategic public investments to stimulate
growth. 7. Strengthening systems in support of economic resilience through improved access to
finance and credit opportunities, markets, and measures to reduce risks and volatility. 8. Maintenance of financing for core poverty reduction initiatives identified in the National
Poverty Reduction Programmes. 9. Ensuring minimal negative impacts of crises and external shocks on poverty reduction
gains.

December 2016 Page 41 of 104
6.3 Social Context The Social Context for poverty reduction and the eradication of hunger is multi-dimensional, requiring careful attention to several key dynamics. Many of these dynamics are spawned by the prevailing challenges of the economic context, while others arise from historical and cultural impacts. Included in the social context are:
1. High levels of unemployment of youth and females 2. Impact of crime on social interaction and economic activity 3. Insufficient employment opportunities being generated 4. Low educational attainment and skill levels 5. Weak social capital and cultural barriers that resist poverty reduction interventions
6.4 Lessons Learned Lessons learned from experiences gained both locally and internationally informed the Policy and Programme. These experiences provided insight for programme development and exposure to best practices which are suitably modified and adapted to the local context. The section below lists key lessons learned from national and international contexts. 6.4.1 National Poverty Eradication Programme. There have been several lessons learnt from Jamaica’s experience with the development, implementation, and coordination of the National Poverty Eradication Programme (NPEP). An evaluation of the NPEP indicated the following, inter alia:
a. Mechanisms for management and implementation of poverty coordination processes should be adequately discussed with stakeholders.
b. A direct link between poverty and sustainable growth in a climate of economic challenges is needed.
c. Coherence in programming and reporting is critical for programme implementers. d. The coordinating entity should adequately perform its designated role. e. The institutional arrangement for monitoring the national programme should not be
complex, duplicative, or lacking in the ability to make important decisions. This could lead to a lack of support on the part of implementing entities.
6.4.2 International and Regional Best Practice The National Poverty Reduction Programme is informed by international and regional best practice in programming and approaches. Through study tours and other knowledge-gathering activities, there have been several lessons learnt that are relevant to the Jamaican context. Approaches to poverty reduction and programming have been adopted from several countries including Brazil, Chile, Peru, Canada, United States of America, Ecuador, the Republic of South Korea, and Singapore. In general, there have been insights on, inter alia:
a. challenges related to policy and programme coherence; b. changes in thinking, approaches, and practice; c. how specific programmes (including Cash Transfer Programmes) can empower
individuals and households;

December 2016 Page 42 of 104
d. institutional arrangements for poverty reduction; The following are among the key lessons learnt8:
1. The importance of macroeconomic growth as the context for sustaining poverty reduction efforts is underscored. In particular, employment becomes critical in securing incomes for an adequate standard of living.
2. Robust data and information systems to guide policy and programmes are critical. Timely and effective use of data and information systems are also essential to informing the development, monitoring and evaluation of programmes.
3. Legislation is needed to support and protect poverty reduction and social protection base rights guaranteed to citizens. This ensures a high level of continuity and sustainability in the implementation programmes.
4. Results-based management and performance budgeting enhance responsive public policy.
5. Programme budget support must be adequate at the different points of implementation; otherwise the overall outcome is likely to be compromised.
6. While countries recognize the need for poverty alleviation programmes, the goal is to limit the continuing scope of these programmes to the poorest, while empowering labour participation and improved incomes for the majority. Significant focus should be placed on building the resilience of families, including building their capacity for income generation and linking them to employment.
7. Services should not necessarily be targeted to the poor as the primary means of combating poverty. There should be a general improvement in services, with greater access created for the poor.
8. Effective multi-sectoral collaboration is critical. A clearly defined role for each group of stakeholders and a facilitated mechanism for collaboration and reporting are required.
9. A gender-responsive approach to programming and interventions is important. Empowerment and productive inclusion of women in households is important for addressing poverty.
10. Youth inclusion and development is critical. Youth entrepreneurship, particularly in rural areas, is encouraged.
11. Interventions should be guided by urban and rural dynamics. Rural development is central to addressing poverty.
12. Local level institutions and governance structures have an important role to play. 13. Food security is an important element for poverty reduction programmes. 14. Mainstreaming and addressing the needs of persons with disabilities and other vulnerable
groups are important.
8 An extended list of lessons learnt is located in Appendix 14.
December 2016 Page 43 of 104
6.5 Resource Mobilization and Funding The National Policy on Poverty, and its associated Programme, recognizes the need for mobilization of adequate resources and financing to the relevant interventions to achieve and sustain poverty reduction outcomes. Resources include human resources, infrastructure, systems, and financial input to programmes and activities. The JSLC 2012 indicates that $22.6 billion was the minimum cost required to take the poor out of poverty, compared with $15.1 billion in 2010.9 The financing of the National Policy on Poverty and National Poverty Reduction Programme will be primarily through budgetary allocations to relevant MDAs. Allocations for poverty-related programmes and interventions are currently included in the budgets of several MDAs. The GOJ commits to maintaining and protecting the budgetary allocations and subventions to MDAs and NGOs that are implementing components of the National Poverty Reduction Programme. The programmes, projects, and interventions highlighted in the Medium-Term Poverty Reduction Programme 2015-2018 (Section 5.3, Table 2) will be given priority over the next three years. As indicated in Table 2, a total of $26.9 billion was allocated by the government to select poverty-related programmes in the Financial Year (FY) 2015/2016. Additional resources towards poverty reduction programming will be allocated to the Poverty Reduction Coordinating Unit (PRCU) of the Planning Institute of Jamaica, primarily to support coordination and institutional strengthening. The Ministry with responsibility for Planning will maintain overall responsibility for budget support to the Policy and Programme. The role of non-government entities in funding poverty programmes remains pertinent and critical. This includes International Development Partners (IDPs), NGOs, CBOs, FBOs, Private Sector companies, and individuals and volunteers. Funding decisions by these external partners will be guided by the priorities outlined in each rolling medium term poverty reduction programme. The Policy also recognizes that poverty reduction is situated within the wider context of social protection, and makes reference to the Financing Strategies (Chapter V) outlined in the Jamaica Social Protection Strategy document. These include:
1. Improving collection of outstanding taxes (including local property taxes) 2. Tax reforms 3. Imposing fines for breaches of environmental protection laws and regulations 4. Maximising access to grant funding 5. Building strong and sustainable partnerships with non-state sectors (NGOs, private
sector, FBOs and CBOs) 6. Increased prioritization of social protection (and Poverty Reduction) in the allocation
of state resources, particularly in respect of the Social Protection Floor.
9 This represents the total direct transfers to those below the poverty line for one year, with the assumption that the transfer is used for consumption, and does not account for the administrative costs to make such transfers.

December 2016 Page 44 of 104
To maximize funding and budget efficiency, strong Monitoring and Evaluation frameworks must be in place for programmes and interventions comprising the National Poverty Reduction Programme. This will ensure that programme outcomes are tracked and evaluated, and adequate resources are allocated to support implementation. The technical and financial resources made available to the government through international development partners continues to be significant in effecting projects and programmes for social protection. The experience of the last decade provides examples of valuable partnerships that have supported programme design and implementation, as well as research and institutional strengthening. These resources remain relevant to the poverty programmes, as in many instances they provide or afford the opportunity for greater levels of research, best practice observation and modelling, and technical input into programme definition and monitoring. Government efforts will be on securing sustainable sources of funding that counterpart efforts and responsibilities can be scaled up, expanded or maintained in the event that external resources are no longer available.

December 2016 Page 45 of 104
6.6 Risks to Policy/Programme Success
1. Economic Constraints: Any restrictions and factors affecting economic growth can impact negatively on the overall context in which the National Poverty Reduction Programme is being implemented. Slow or negative growth will have an impact on availability of jobs, household consumption, programme budgets, fiscal space, inter alia.
2. Lack of Political Will: Government administrations need to continue to see merit in the coordination and implementation of the National Poverty Reduction Programme, and consequently provide the necessary support and resources to facilitate successful implementation. The absence of political will and buy-in could lead to shift in policy focus, inadequate support and discontinuation of major programmes and initiatives.
3. Limited Buy-in and Resistance to Monitoring and Coordination: It is important that major stakeholders are on-board from the Policy/Programme development stage to facilitate ownership and commitment to policy direction, principles, goal, objective and strategies. Their identification, understanding and acceptance of their role is critical. Stakeholders must also understand the value of coordination, monitoring and evaluation to the success of their programmes and the National Programme overall.
4. Resistance to Change: The implementation of the National Poverty Reduction Programme will have implications for change at all levels. At the individual/household level, for example, programme beneficiaries must be willing to take up opportunities for training and be motivated to adapt to new environments and take on new challenges. At the community level, communities must be willing to change norms and cultural practices that go against what the policy/programme is attempting to achieve. At the national level, Government organizations must be willing to work closer with other MDAs and non-government entities in a joined-up manner that might be outside the usual way of operating.
5. Weakness in Supporting Social Sectors: Due to the multi-dimensional approach to poverty reduction, underperformance, limited access, and poor quality of certain social services are likely to negatively affect programme outcomes should these weaknesses present themselves. Sectors include education and training, health, agriculture, social security, water, housing, climate change, national security and local government. These sectors will be required to provide the environment to support and maintain poverty reduction efforts.
6. Repeated and Compounded Hazard Impact: Notable and persistent natural hazards (including drought, hurricane, floods, and fire) will threaten sustainable livelihoods, particularly those dependent on Agriculture, Forestry and Fishery. These also have adverse effects on the economy stemming from a slowdown of activities, and are likely to result in diversion of budget resource from development to recovery.

December 2016 Page 46 of 104
7. THE NATIONAL POVERTY REDUCTION PROGRAMME, 2030
7.1 Poverty Reduction Programme Parameters The National Poverty Reduction Programme is directly linked to and influenced by the National Policy on Poverty. The Programme is long-term, in keeping with Vision 2030 Jamaica, and will also be implemented and monitored over a 3-4 year medium-term cycle. Detailed medium-term poverty reduction programmes will be developed. The first will span the three-year period of 2015 – 2018, in line with the Vision 2030 Jamaica MTF. Defined criteria for interventions to be included in the National Poverty Reduction Programme will be developed. The interventions will be subject to periodic monitoring and evaluative performance review. Performance signals programme effectiveness, responsiveness and appropriateness. This will have implications for budgets and programme review and inclusion in the next poverty programme cycle. Strategic programming priorities identified as critical for policy implementation employs preventive, promotive, mitigative, protective, and transformative interventions (SPS 2014). Anchored within the macro-economic framework of Jamaica’s Growth Inducement Strategy, the Social Protection Strategy, Vision 2030 Jamaica, the national commitments under the Agenda 2030 Sustainable Development Goals, the commitment embodied in this National Policy on Poverty, inter alia, the Poverty Reduction Programme will consist of the synchronization of existing poverty-related programmes to effectively use available resources and capacities. It will also introduce new initiatives to address poverty-related programming gaps and/or weaknesses for the optimal benefit of the poor. This section outlines programme levels and priorities, the broad target groups (using a life-cycle approach), as well as the role of partners/stakeholders. An overview of the poverty situation along the life cycle provides the context for the wide range of interventions that a poverty reduction programme must address across various age-groups and over time.
7.2 Programme Levels and Priorities The National Poverty Reduction Programme embodies the commitments made by Government in the fight to eradicate extreme poverty and reduce absolute poverty, within the framework of the Vision 2030 Jamaica – National Development Plan. In this regard, the programme will address poverty at three levels (Figure 2):
i) Household/Individual ii) Community iii) National

December 2016 Page 47 of 104
Figure 2: Programme Levels
The following are the general programme areas to be addressed and the broad target groups under the National Poverty Reduction Programme. Level One (1): Household/Individual Poverty is measured by household level per capita consumption. The principal focus of poverty reduction must therefore address the determinants of poverty at the household level for the long term. This requires a sustainable combination of initiatives to facilitate the productive inclusion of poor individuals and households through building/strengthening personal assets. Best practice application and gap correction requires efficient targeting in the context of fragmented service provisions. At this level the programme will therefore enable the empowerment of individuals and households through livelihood creation and human capital formation, to build the resilience of household members and address vulnerability issues. Programming Priorities: The National Poverty Reduction Programme will address poverty at the household/individual level through a slate of interventions focused on: meeting basic needs, economic empowerment, addressing psycho-social, cultural and normative challenges, and providing opportunities for human capital development and livelihood creation.
Level Two (2): Community While poverty is currently measured by individual/household consumption, location correlates with the prevalence of poverty. Poverty data by region and parish (Table 1; Appendix 2) as well
NATIONAL
COMMUNITY
HOUSEHOLD/ INDIVIDUAL

December 2016 Page 48 of 104
as the Consumption Based Map and the Unsatisfied Basic Needs Maps (Appendices 14 and 15) reveal the geo-spatial characteristics of poverty in Jamaica. Spatial features of poverty also overlap with crime and violence particularly in urban areas in Kingston and St. Andrew (Moser and Holland 1997). Further, the poor are often found in areas susceptible to environmental shocks and stresses (PIOJ 2007, 3). Community driven poverty reduction strategic priorities will therefore facilitate localised responses to localised problems. Addressing current community-led initiatives will add value to a revamped poverty reduction focus through making interventions more sustainable; re-apportioning public/private poverty focus to strengthen multifaceted programmes with wealth and skills creation beyond basic public infrastructure; targeted funding and capacity building of CBOs; forming strategic partnerships for sustainability; and strengthening monitoring and evaluation (Moncrieffe 2013; Arcadis 2005; Gayle-Geddes et al. 2012; Mclean and Blake Lobban 2009; Henry-Lee 2001). Programming Priorities: Focus will be placed on building community infrastructure (physical, social and economic) to address poverty needs and create greater opportunities for improving standards of living and creating an enabling environment. Improving infrastructure for enhancing sustainable livelihoods, and addressing risk and resilience considerations in the context of environmental protection are imperative. Special emphasis will be placed on addressing the unique needs of poor and vulnerable rural and urban communities. The development and strengthening of community-based and other social organizations will be important to the effectiveness of the Poverty Reduction Programme at the community level. Level Three (3): National At the national level, the Government guides the prioritization, resource mobilization, effective coordination, monitoring and evaluation and institutional support to relevant organizations implementing and supporting the National Poverty Reduction Programme. Programming Priorities: The provision of technical support for institutional strengthening and effective management, monitoring and evaluation of the national (and sub-national) poverty reduction programming, research, resource mobilization and allocation, are prioritized at this level. The strengthening of key organizations to support the coordination and implementation of the Poverty Reduction Programme will be imperative. Knowledge and capacity building for MDAs and NGOs to facilitate sustainable poverty reduction outcomes will also be a key area for partnerships. This will have implications for improved effectiveness of programme management and programme outcomes.

December 2016 Page 49 of 104
8. MEDIUM-TERM POVERTY REDUCTION PROGRAMME, 2015-2018 The Medium-term Poverty Reduction Programme, 2015-2018 will focus on empowering poor and vulnerable individuals while addressing extreme poverty, and psychosocial advancement, through a mix of household and community (both rural and urban) interventions. While the National Poverty Reduction Programme recognizes the complexity of the issue and underscores the need for a wide range of interventions for a wide range of stakeholders, the medium-term programme will take a more selective and targeted approach. The targeted nature of the programme will include focusing on specific groups, and administering a slate of critical interventions. The programme will seek to reach, in the first instance, the extreme (food poor) in an effort to eradicate extreme hunger and poverty. Secondly, the programme will seek to build and strengthen the productive and earning capacity of the working-age population. The working-age population is the productive base of the family and economy, and as such, is a primary target group for affecting consumption. As indicated in the Situational Analysis, there is a need to strengthen the economic resilience of not only the structural poor, but also the vulnerable (or transient poor) which represent those consuming within 10 per cent above the poverty line (JSLC 2012). This group is typically susceptible to external shocks that easily reduce their overall consumption. The programme scope has been determined based on data and information, government priorities and policy focus, regional and international best practice, consultation with a wide range of stakeholders, and lessons learnt. A description of the programme is presented in the following section.
8.1 Specific Target Groups
The Medium-term Poverty Reduction Programme 2015-2018 will include two broad sets of interventions. The first set of interventions will target those who are in extreme poverty and need, aligned to Goal 1 of the National Policy on Poverty and Goal 1 of the 2030 Agenda on Sustainable Development. The second set of interventions will target those requiring economic empowerment and human capital development, aligned with Goal 2. The medium-term programme will also focus on psychosocial development of key stakeholders, building capacity of key organizations providing service to the poor and vulnerable, and improving community infrastructure in rural and urban areas. The extent to which individuals, households and communities are impacted by poverty and related socio-economic factors, as indicated by poverty trends and most recent available data (see Situational Analysis, Appendix 2), along with the following criteria has influenced the focus on specific target groups for the first poverty reduction programme:

December 2016 Page 50 of 104
Criteria for Selecting Specific Target Groups:
1. Extent to which the individuals/groups are impacted by poverty. 2. The multiplier effect on consumption of addressing the socio-economic needs of the
individuals or group/s. 3. Policy convergence, government priority and commitment. 4. Integrated and multi-dimensional approach to poverty reduction policy and programme,
for sustainable outcomes. 5. Direct impact on household consumption. 6. Ability to mitigate and break the inter-generational cycle of poverty. 7. Gender considerations. 8. Stakeholder feedback and consensus.
The specific target groups for intervention under each programme area in the first medium-term (2015-2018) Poverty Programme are presented below.
8.2 Key Strategic Interventions by Target Group PROGRAMME AREA 1: ADDRESSING EXTREME POVERTY AND BASIC NEEDS Related Policy Objectives: Objective 1: Strengthen social safety nets to address extreme poverty-induced deprivations (including hunger) Objective 4: Enhance food and nutrition security of the poor.
Target Groups: To address extreme poverty and basic needs, the medium term poverty reduction programme targets persons who are more likely to lack basic needs because of their specific vulnerabilities and risks related to poor health status, low educational outcomes, unemployment and lack of support systems. The target group listed below was selected based on their living conditions and inability to provide basic needs, and in the case of pregnant and lactating women, to ensure adequate nutrition for young children as part of the strategy for breaking the inter-generational cycle of poverty.
I) Destitute/Vulnerable Persons II) Persons Facing Food Poverty (including children and the elderly) III) Persons with Disabilities IV) Pregnant and Lactating Women

December 2016 Page 51 of 104
Key Strategies:
1. Design and implement appropriate programmes, mechanisms and facilities to ensure the availability, accessibility, safety, and stability of sufficient food supply for the extreme/food poor (food insecure) across the life cycle.
2. Formulate programmes to detect, prevent and mitigate malnutrition caused by inadequate intake of food.
3. Ensure the availability of emergency food stocks for time periods in keeping with the National Food and Nutrition Security Targets for emergency recovery and relief;
4. Institutional strengthening, integration and expanded coverage, reach and efficacy of the National School Feeding Programme from the early childhood to secondary levels in keeping with nutritional guidelines to ensure equity, adequacy and accessibility.
5. Ensure that basic amenities, public services and facilities are accessible to the poor, whether by means of targeted or universal interventions.
6. Provide social transfers in the form of cash or kind to support the poorest (individuals or families) identified through appropriate screening mechanisms.
7. Facilitate institutional care as required, for the infirm, indigent or homeless, to ensure that the basic needs of the most vulnerable are met.
8. Ensure programmes and interventions are in place to adequately respond to the needs of the temporary poor.
9. While meeting basic needs, support holistic development through promoting income security, human capital development and independence.
PROGRAMME AREA 2: ECONOMIC EMPOWERMENT AND HUMAN CAPITAL DEVELOPMENT Related Policy Objectives: Objective 2: Promote and expand human capital development among the poor and vulnerable (including children and persons with disabilities). Objective3: To enhance livelihood creation and income security among the poor and vulnerable Target Groups: Economic empowerment and human capital development are critical to the sustainability of poverty reduction efforts to enable the transitioning out of, and breaking the intergenerational cycle of poverty. Low educational attainment levels, low income earning capability, inability to access basic social services, lack of economic opportunities leading to underemployment, unemployment and low wage employment, are determinants of poverty in Jamaica. The medium term framework will therefore focus on the following group of persons who are vulnerable to poverty because of their employment and educational status.
I) Unemployed and Non-skilled (Female, Youth, Elderly, Persons with Disabilities)
II) Working Poor (Female, Youth, and Persons with Disabilities) III) Small Producers (Farmers, Fishers) and Small Entrepreneurs

December 2016 Page 52 of 104
Key Strategies/Actions: I). Unemployed and Non-skilled
1. Create greater access to education, training, and certification (including remedial education entrepreneurial and skills training) for members of the target group.
2. Strengthen the incorporation of certification/standards acquisition and employment transition support (school-to-work) into training modules that target the poor, and other low income earners.
3. Facilitate and encourage employment linkages and placement as well as apprenticeship programmes.
4. Include training component in government short-term public-works programmes (Trabajo Peru and Lift-Up Jamaica are examples of such model)
5. Build the capacities of poor households to become independent of social assistance programmes, through strengthened case management, and the appropriate linkages, referrals as well as training and employment opportunities.
6. Strengthen families through improved access to services, information and resources in response to needs.
7. Livelihood development and strengthening through access to business development services, micro-finance and social enterprise options for targeted clients.
II) Working Poor
1. Identification and improvement of personal assets; capacities, talents and skills for income generation and Decent Work.
2. Identification and improvement of community assets for income generation and Decent Work through the engagement of community-based and other non-government organizations to develop skills that enable active participation in the labour market.
3. Timely review and adjustments to the Minimum Wage, in response to changing economic realities.
4. Promote protection of workers, minimum conditions of work, and participation in social security schemes. Relevant sectors for consideration include Agriculture & Fishery and Wholesale & Retail.
5. The enhancement and promotion of active labour market policies and Labour Market Information Systems.
III) Small Producers (Farmers, Fishers) and Entrepreneurs
1. Improve road and water infrastructure at the local level (including farm roads and irrigation systems)
2. Increase access to potable water and sanitation connections in dwellings. 3. Increase access to electricity in rural areas and electricity regularization in urban areas. 4. Promote the development and expansion of community social enterprises (e.g. in
agriculture and agro-processing). 5. Increase access to suitable land for farming through divestment of available government
owned lands.
December 2016 Page 53 of 104
6. Facilitate access to micro-finance services and technical assistance for productive purposes through financial institutions.
7. Promote and facilitate productive inclusion of local agricultural producers, fishers and fish farmers within the safety net feeding programmes and other local markets.
8. Livelihood development and strengthening through access to business development services, micro-finance and social enterprise options for targeted clients.
9. Expand and support community niche products and industries. 10. Strengthen backward and forward integration; and expand value chain enhancement and
connection to markets. 11. Increase natural resource management through prevention and mitigation to strengthen
sustainable livelihoods of the poor in areas vulnerable to natural disasters and climate change through river training; rehabilitation of watersheds; slope stabilization; provision of break water systems etc.
12. Promote environmental friendly practices in farming and livelihood creation towards environmental preservation and poverty reduction.
13. Promote healthy environmental practices. 14. Promote participation in national health schemes, the National Insurance Scheme, and
other insurance and pension offerings
PROGRAMME AREA 3: PSYCHO-SOCIAL, CULTURAL, AND NORMATIVE ADVANCEMENT Related Policy Objectives: Objective 6: To address psycho-social, cultural and normative influences on poverty Target Groups: Recognizing the interrelationship of social factors and individual thought and behaviour, including norms, values, myths and cultural practises within the society that enable and perpetuate poverty, and the impact of poverty and deprivation on mental health and decision making, psycho-social cultural and normative advancement is a cross cutting element of this National Policy. This element focuses on enhancing parenting skills, providing mental health support services, building social capital, encouraging mind-set change, as well as considerations of the characteristics, behavioural and decision making patterns of the target group in the design and
implementation of programmes to increase uptake and enhance effective delivery. Psycho-social advancement is relevant across the lifecycle therefore the relevant institutions within various sectors of society must be engaged to facilitate its attainment. The following target groups are selected for the medium term poverty reduction programme:
I. Youth II. Children
III. Parents (Including Guardians and Household Heads) IV. Service Providers

December 2016 Page 54 of 104
Key Strategies/Actions: I) Children and Youth
1. Provide training, education and re-socialization on cultural norms in areas such as: self-control, transfer of hope beyond circumstances, mind-set change, character building, overcoming limits and challenges, personal and civic responsibility as well as trust and relationship building.
2. Create greater access to appropriate reproductive and mental health services and information.
3. Provide training in anger management, mediation, and conflict resolution. 4. Implement participatory approaches that engage this target group in the formulation and
implementation of strategies to address issues affecting them.
II) Parents (Including Guardians and Household Heads)
1. Provide training and support services in transformative parenting, coping strategies, and
management of family dynamics. 2. Provide financial education training and information for heads of households to change
attitudes towards management of household resources and assist financial decision making.
3. Create greater access to appropriate reproductive and mental health services and information
III) Service Providers (including MDAs and NGOs)
1. Provide training for service providers to strengthen skills in transferring hope and influencing positive behaviour change.
2. Provide training to improve service provision, efficiency in service delivery and encourage partnership and linkages to promote the wellbeing of clients in poverty.
PROGRAMME AREA 4: BASIC COMMUNITY INFRASTRUCTURE Related Policy Objectives: Objective 5: To strengthen basic social and physical infrastructure Target: The condition of basic infrastructure enables or inhibits access to basic social services and amenities and impacts the psycho social development. Access to infrastructure is not only important for social development but also economic development through provision of access to markets, inputs, distribution networks and transportation systems. Basic community infrastructure development is essential for balanced and sustainable rural and urban development. Though rural poverty rates are higher, the peculiar characteristics of both rural

December 2016 Page 55 of 104
and urban communities that impact their poverty profile warrants the development of basic community infrastructure for both rural and urban communities. Key Strategies/Actions
I) Rural and Urban Communities
1. Provide and facilitate equitable access to basic public infrastructure such as water, sanitation and solid waste disposal, electricity, schools, healthcare and other public facilities and services, in rural communities. The minimum available access should be in keeping with the specified social protection floor.
2. Institutionalize systems for the care and maintenance of public community infrastructure and promote community responsibility among citizens in poor rural communities.
PROGRAMME AREA 5: INSTITUTIONAL STRENGTHENING Related Policy Objectives: Objective 7: To strengthen coordination and capacity building for poverty reduction. Target: Institutional strengthening is critical to the sustainability of poverty reduction efforts. Recognizing the need for capacity building, strengthening monitoring and evaluation capabilities among the staff of agencies and NGOs that provide service to the poor, they are targeted for the medium term poverty reduction programme. Key Strategies/Actions
1. As part of the Monitoring and Evaluation Plan, identify clear targets and roles for stakeholder involvement, including the Private Sector.
2. Establish a Registry of national poverty reduction programmes/service providers. 3. Develop communication and monitoring systems and schedules for various stakeholders,
actively promoting information and data sharing, and networking among relevant organizations implementing programmes under each medium term framework.
4. Expand capacity development training and provision of resources to enhance service provision in: life-skill training, psycho-social training, parenting, crime and violence prevention and intervention (including domestic violence), and reproductive health awareness and responsibility.
5. Inter-sectoral collaboration within government to support and streamline selected programmes provided by NGOs, CBOs and FBOs.
6. Facilitate the streamlining and provision of services by the Private Sector and Private Sector Foundations at the community level in various areas, towards poverty reduction.
7. Assess the M&E gaps in key programmes and provide training (and follow-up evaluation of application of knowledge) in M&E towards the development and strengthening of M&E systems of relevant programmes and organizations.

December 2016 Page 56 of 104
Table 4 outlines relevant existing government funded programmes10, aligned to the components of the medium-term poverty reduction programme, through which the strategies and interventions may be implemented. These, along with others to be identified and agreed on based on further consultation with relevant stakeholders, will form the nucleus of interventions to be supported, monitored, and evaluated under the Medium-Term Poverty Reduction Programme 2015-2018. Further dialogue and consultation with programme partners will assist with finalizing Programme’s definition.
Table 4: Major Government Projects, Programmes, and Interventions Targeting Poverty Reduction and 2015/2016 FY Budget Allocation
Ministry Programmes/Projects/ Interventions
Programme Area (NPRP)
Target Group (NPRP)
FY 2015/2016 Budget
Allocation11 ($’000)
Labour and Social Security (MLSS)
Programme of Advancement Through Health and Education (PATH)12
Economic Empowerment and Human Capital Development
Children Youth
5,682,491.0
Steps-to-Work13 Economic Empowerment and Human Capital Development
Unemployed/ Non-skilled
-
Rehabilitation Grant Programme14
Extreme Poverty and Basic Needs
Destitute/ Vulnerable Persons
499,434.0
Social Intervention Programme (formerly Special Youth Employment and Training Project)
Economic Empowerment and Human Capital Development
Unemployed/ Non-Skilled Youth
93,622.0
Economic Empowerment Grant/ Assistive Aid Programme(Jamaica
Economic Empowerment and Human Capital Development
Destitute/ Vulnerable Persons (Persons with Disabilities)
27,000.0
10 The vast majority of these programmes were identified by MDAs as poverty-related programmes. These were included in the approved Conceptual Framework for Poverty Reduction Coordination in Jamaica, November 2014. 11 Source: Estimates of Expenditure 2015-2016 Jamaica Budget 12 This allocation to PATH is through the following Projects: Support to Improve the Lives of Persons with Disabilities (IDB){$8.3 million}; Integrated Social Protection and Labour Programme (IDB){ $140.0 million}; Social and Economic Inclusion of Persons With Disabilities (World Bank){ 40.0 million}; and Social Protection Project II (World Bank){$5.5 billion) 13 Budget allocation included in PATH budget 14 Amount includes $249.0 million for Direction and Administration)

December 2016 Page 57 of 104
Ministry Programmes/Projects/ Interventions
Programme Area (NPRP)
Target Group (NPRP)
FY 2015/2016 Budget
Allocation11 ($’000)
Council for Persons with Disabilities)15
Grants to Private Sector Social Welfare Organizations (Jamaica Red Cross)
Extreme Poverty and Basic Needs
Destitute/ Vulnerable Persons
4,233.0
Meals on Wheels Programme (National Council for Senior Citizens)16
Extreme Poverty and Basic Needs
Destitute/ Vulnerable Persons (Elderly)
14,409.0
Grants to Golden Age Homes
Extreme Poverty and Basic Needs
Destitute/ Vulnerable Persons
309,034.0
Local Government and Community Development (MLGCD)
Poor Relief Programme (Outdoor)17
Extreme Poverty and Basic Need
Destitute/ Vulnerable Persons
347,805.0
Poor Relief Programme (Indoor/ Infirmaries)
Extreme Poverty and Basic Needs
Destitute/ Vulnerable Persons
613,865.0
Homelessness (Street People) Programme
Extreme Poverty and Basic Needs
Destitute/ Vulnerable Persons (Homeless)
24,722.0
Health (MOH)
Sexual and Reproductive Health Services
Psycho-social, Cultural and Normative Development
Youth Parents
193,226.0
Agriculture and Fisheries (MOAF)
Jamaica Banana Accompanying Measures (JBAM) Project
Economic Empowerment and Human Capital Development
Small Producers (farmers)
172,329.0
Grants for Agricultural Extension Services (Rural Agricultural Development
Economic Empowerment and Human Capital Development
Small Producers (farmers)
1,219,744.0
15 Allocation represents Appropriations-In-Aide 16Allocation represents Appropriations-In-Aide 17 Provision included in the allocation to the MLSS; Allocation include amount for Direction and Administration ($193.9 million) and Appropriations-In-Aide ($45.0 million)

December 2016 Page 58 of 104
Ministry Programmes/Projects/ Interventions
Programme Area (NPRP)
Target Group (NPRP)
FY 2015/2016 Budget
Allocation11 ($’000)
Authority){RADA}
Grants for Agricultural Extension Services (Jamaica Agricultural Society)
Economic Empowerment and Human Capital Development
Small Producers (farmers)
1,219,744.0
Grants to the National Irrigation Commission
Economic Empowerment and Human Capital Development
Small Producers (farmers)
1,110,032.0
Low Income Housing
Extreme Poverty and Basic Needs
Working Poor 18 4,730.0
Education (MOE)
School Feeding Programme
Extreme Poverty and Basic Needs
Destitute/ Vulnerable Persons (Children)
4,369,884.0
Social and Economic Support Programme (Financial assistance to vulnerable students)
Extreme Poverty and Basic Needs
Destitute/ Vulnerable Persons Children
8,624.0
Grant for Student Assistance (High School)18
Economic Empowerment and Human Capital Development
Youth 2,693,401.0
Career Advancement Programme19
Economic Empowerment and Human Capital Development
Youth 591,513.0
Jamaican Foundation for Lifelong Learning (including Literacy Programme and High School Equivalency Programme
Economic Empowerment and Human Capital Development
Youth Women
25 1,651.0
18 Grant for tuition assistance (204,700 high school students) 19 Budget allocation includes stipend to students (161,513.0

December 2016 Page 59 of 104
Ministry Programmes/Projects/ Interventions
Programme Area (NPRP)
Target Group (NPRP)
FY 2015/2016 Budget
Allocation11 ($’000)
National Security (MNS)
Citizen Security and Justice Programme III
Psycho-social, Cultural and Normative Development Economic Empowerment and Human Capital Development
Youth Working Poor
880,000.0
Water, Land, Environment and Climate Change (MOWLECC)
Land Administration and Management Programme
Economic Empowerment and Human Capital Development Livelihood creation and income security.
Small Producers (farmers)
226,572.0
Pilot Programme for Climate Resilience II (PPCR II) – Adaptation Programme and Financing Mechanism
Economic Empowerment and Human Capital Development Livelihood creation and income security.
Small Producers (farmers)
15,000.0
Rain Water Harvesting and Catchment Tank Rehabilitation Programme
Economic Empowerment and Human Capital Development Livelihood creation and income security. Basic Social and physical infrastructure
Small Producers (farmers)
-
Office of the Prime Minister (OPM) (Jamaica Social
Rural Economic Development Initiative
Economic Empowerment and Human Capital Development
Small Producers (farmers)
246,765.0

December 2016 Page 60 of 104
Ministry Programmes/Projects/ Interventions
Programme Area (NPRP)
Target Group (NPRP)
FY 2015/2016 Budget
Allocation11 ($’000)
Investment Fund)
Jamaica Integrated Community Development Project
Basic Community Infrastructure
Children Youth Working Poor Parents
250,156.0
Poverty Reduction Programme III
Economic Empowerment and Human Capital Development Psycho-social, cultural and normative responses
464,000.0
Poverty Reduction Programme IV
Economic Empowerment and Human Capital Development Psycho-social, cultural and normative responses
Working Poor Youth Children
100,000.0
Petro Caribe Schools’ Sanitation Upgrade Project
Basic Community Infrastructure
Youth Children
76,500.0
Basic Needs Trust Fund 7
Basic Community Infrastructure Economic Empowerment and Human Capital Development
Small Producers (farmers) Children Youth Working Poor
305,000.0
Youth and Culture (MYC)
Youth and Adolescent Division (formerly National Centre for Youth Development)
Economic Empowerment and Human Capital Development
Youth 88,748.0

December 2016 Page 61 of 104
Ministry Programmes/Projects/ Interventions
Programme Area (NPRP)
Target Group (NPRP)
FY 2015/2016 Budget
Allocation11 ($’000)
Psycho-social, cultural and normative change
The Possibility Programme (Street Children)
Economic Empowerment and Human Capital Development Psycho-social, cultural and normative change
Children Youth
16,123.0
Youth Development Projects (Grants to Private Social Services Organizations)
Economic Empowerment and Human Capital Development
Youth 8,039.0
Social Security and Welfare Services (Child Development Agency)
Extreme Poverty and Basic Needs
Destitute/ Vulnerable Persons Youth (Children)
2,050,991.0
Finance and Planning (MOFP)
Community Renewal Programme (Planning Institute of Jamaica)
Basic Community Infrastructure Economic Empowerment and Human Capital Development
Destitute/ Vulnerable Persons Youth
50,000.0
Poverty Reduction Coordinating Unit (PRCU) (Planning Institute of Jamaica)
Coordination and Capacity Building
MDAs and NGOs
12,721.0
Grants to Students Loan Bureau
Economic Empowerment and Human Capital Development
Youth 2,915,000.0
GRAND TOTAL 26,900,727.00

December 2016 Page 62 of 104
APPENDICES Appendix 1: Stakeholder Consultations Conceptual Framework December 2013 to June 2014
Interviews
• Jamaica Social Investment Fund • Ministry of Labour and Social Security • Board of Supervision • Ministry of Education • Early Childhood Commission • Digicel Foundation • Cabinet Office • Ministry of Land, Water, Environment and Climate Change • Ministry of Local Government and Community Development • Food for the Poor • Jamaica Council for Persons with Disabilities • Social Development Commission • Jamaica Bauxite Institute • Ministry of Youth and Culture • University of the West Indies
PIOJ Think Tank (Internal)
• Economic Planning and Research Division • Social Policy Planning & Research Division • Sustainable Development and Regional Planning Division • External Cooperation Management Division
Technical Consultations: Policy and Programme Development – March - September
2015:-
Local Authorities (Four (4) Regions)
• Central: Clarendon; St. Elizabeth; and Manchester • Northern: St. Ann; St. Mary; and Portland • Eastern: Kingston and St. Andrew; St. Thomas; Portmore Municipal Council;
and St. Catherine • Western: St. James; Westmoreland; Hanover and Trelawny

December 2016 Page 63 of 104
Multi-sectoral Workshop
• Ministry of Education
• Jamaica Social Investment Fund
• Ministry of Land, Water, Environment and Climate Change
• Cabinet Office
• Ministry of Health
• Ministry of Youth and Culture
• Ministry of Transport Works and Housing
• National Council for Senior Citizens
• Office of the Prime Minister
• Ministry of Labour and Social Security
• Jamaica Council for Senior Citizens
• Jamaica Council for Persons with Disabilities
• Rural Agricultural Development Authority
• Board of Supervision
• Ministry of Local Government and Community Development
• Planning Institute of Jamaica
• Combined Disabilities Association
• Jamaica National Foundation
• Sagicor Jamaica Limited
• University of the West Indies
Focus Group Discussions
• National Council for Senior Citizens
• PATH beneficiaries
• Representatives from the Small Business Association, MSME Alliance,
Jamaica Household Workers Association and Ministry of Labour and Social
Security
Key Informant Interviews
• Board of Supervision
• Ministry of Labour and Social Security
Other Consultations
• Vision 2030 Jamaica - National Prioritization Workshop – Medium Term
Framework (MTF) 2015/2016 • Vision 2030 Jamaica MTF Workshop - Children • Vision 2030 Jamaica MTF Workshop - Youth
December 2016 Page 64 of 104
Inter-sectoral Committee for the Development of a National Poverty Policy and a
National Poverty Reduction Programme (Established August 2014): Agencies
Represented:-
• Board of Supervision (Division of the Ministry of Local Government)
• Cabinet Office
• Council of Voluntary Social Services
• Food For The Poor Jamaica
• Jamaica Council for Persons with Disabilities
• Jamaica Social Investment Fund
• Ministry of Agriculture
• Ministry of Education
• Ministry of Finance and Planning
• Ministry of Health
• Ministry of Industry, Investment and Commerce
• Ministry of Labour and Social Security
• Ministry of Land, Water, Environment and Climate Change
• Ministry of Local Government and Community Development
• Ministry of Transport, Works and Housing
• Ministry of Youth and Culture
• Office of the Prime Minister
• Private Sector Organization of Jamaica
• Statistical Institute of Jamaica
• University of the West Indies, Mona
• Planning Institute of Jamaica

December 2016 Page 65 of 104
Appendix 2: Situation Analysis
Profile of Poverty The prevalence, depth, and severity of poverty declined since the 1990s but reversed upward since 2008, and are consistent across geographical areas, sex, age groups, and disability status. Poverty (food and non-food consumption) declined from the highest rate of 44.6 per cent in 1991 to the lowest rate of 9.9per cent in 2007, and steadily increased thereafter to 19.9 per cent in 2012. Food poverty also declined from 22.7 per cent in 1991 to 2.9 per cent in 2007 then increased since 2008 and doubled the 2007 rate in 2010 and 2012 (6.3 per cent and 7.5 per cent respectively) (Appendix 3).The JSLC 2012 states, that in addition to the poor, 4.2 per cent of the population were vulnerable to poverty that is, consuming within 10.0 per cent above the poverty line in 2012 (PIOJ, 2012, 2.9). Rural poverty rates are consistently higher than the national poverty rate, while the KMA and Other Towns have consistently remained lower than the national poverty rates (Figure 3). Some 61.0 per cent to 74.0 per cent of the poor were located in Rural Areas for most years since 1990 (Appendix 4). Food poverty rates in Rural Areas were two or three times the rates in the KMA and Other Towns and was consistently higher than national rates. (Appendix 3).In 2012, poverty rates were 19.7 per cent of the KMA; 21.3 per cent of Rural Areas and to 16.6 per cent of residents in Other Towns. The heterogeneity of the poor is also evident beyond geographical differences. While only slightly higher proportions of males than females were poor, slightly greater proportions of female headed households compared to those headed by males were poor. The prevalence of poverty for households is usually 2.3 per cent to 9.9 per cent lower than individuals. The proportion of children in poverty is consistently higher than working age adults and the elderly. Persons with disabilities were also more likely to be poor than persons without disabilities. Prevalence of Poverty by Parish Data on the prevalence of poverty by parish are only available for the years 1992, 1998, 2002, 2008, and 2012. All parishes recorded reductions in poverty levels from 1992 to 2008. The data however, reveal some structural consistency of poverty. The more urbanized parishes of Kingston, St. Andrew, St. Catherine and St. James consistently recorded the lowest prevalence of poverty from 1992 to 2008. Conversely, the rural parishes of St. Mary, Portland, Trelawney and St. Elizabeth consistently feature among the parishes with the highest prevalence of poverty (Table 1). For the year 2012, the majority of parishes showed increased poverty prevalence relative to 2008, except St. Mary, Trelawney, Hanover and St. Elizabeth. Nine parishes had poverty rates exceeding the national average. Poverty rates for 2012 doubled the 2008 rates in Kingston (28.6 per cent), St. Andrew (17.7per cent), and St. Thomas (32.5 per cent); and more than tripled in St. Catherine (24.0 per cent). The prevalence of poverty for that year was lowest in St. Mary (9.4 per cent), Hanover (10.8 per cent), and St. James (11.1 per cent).

December 2016 Page 66 of 104
1990 1991 1992 1993 1994 1995 1996 1997 1998 1999 2000 2001 2002 2003 2004 2005 2006 2007 2008 2009 2010 2012
KMA 13.30 28.9 18.8 16.7 13.8 15.0 17.2 9.3 8.6 10.6 9.9 7.6 10.3 14.6 14.3 9.6 9.4 6.2 7.0 12.8 14.4 19.7
Other Towns 25.70 31.4 29.9 22.9 20.0 22.8 22.0 14.8 13.4 12.1 16.6 13.3 18.6 15.8 7.8 7.2 9.2 4.0 10.7 10.2 11.6 16.6
Rural Areas 37.50 57.2 42.2 29.6 28.8 37.0 32.8 27.4 19.5 22.0 25.1 24.1 25.5 24.2 22.1 21.1 19.8 15.3 17.0 22.5 23.2 21.3
Jamaica 28.40 44.6 33.9 24.4 22.8 27.5 26.1 19.9 15.9 17.0 18.7 16.8 19.7 19.1 16.9 14.8 14.3 9.9 12.3 16.5 17.6 19.9
0.00
10.00
20.00
30.00
40.00
50.00
60.00
70.00
Pe
rce
nt
(%)
Table 1: Prevalence of Poverty in Jamaica by Parish (1992, 1998, 2002, 2008 and 2012)
Parish 1992 1998 2002 2008 2012
Kingston 17.1 12.6 18.3 14.5 28.6
St. Andrew 19.8 7.7 14.8 8.7 17.7
St. Thomas 37.1 9.4 28.7 14.4 32.5
Portland 50.3 18.3 32.2 17.3 21.4
St. Mary 35.4 38.4 27.2 21.3 9.4
St. Ann 36.5 22.5 37.0 12.5 18.4
Trelawney 15.4 18.3 31.3 19.0 13.2
St. James 27.9 8.9 12.9 8.5 11.1
Hanover 52.4 13.3 14.1 15.5 10.8
Westmoreland 51.7 33.3 18.7 10.7 18.9
St. Elizabeth 47.2 18.4 20.0 30.6 23.8
Manchester 44.6 11.7 24.4 15.3 22.5
Clarendon 42.0 13.3 27.2 15.0 19.33
St. Catherine 28.2 8.2 6.2 7.5 24.0
Jamaica 35.2 15.9 19.7 12.3 19.9
Source: Compiled by the PIOJ from data supplied by STATIN.
Figure 3: Prevalence of Poverty in Jamaica by Region (1990-2012)

December 2016 Page 67 of 104
An examination of the poverty trend data in Table 1 evinces a somewhat fluctuating prevalence for each parish. Even with the periodic nature of the parish estimates, it can still be construed that there are underlying structural forces that have impacted the consumption status of households across time, and which appear to often counter gains made in previous years. This is supported by the Handa study (2010), which illustrates the vulnerable status of many households that slip in and out of poverty at each estimate, without the sustainable basis that would create lasting economic outcomes. Some of the impeding factors relate to the small island developing state economy and its consequent openness to the dynamics of international trade, and global financial trends, inter alia.
Other limiting factors are related to the economic base within parishes, most of which are founded on agriculture, mining and tourism. In the absence of viable diversification of this base, it is likely that ad hoc shocks, including natural occurrences or market failures would have immediate and continuing negative impacts on production, productivity, employment, and incomes. This has been the case for several parishes with agriculture as their main economic base. Primary and secondary markets, including the labour market, are affected, and the multiplier effect influences downturns in both formal and informal employment. Recognizing the often porous nature of parish boundaries, the trend data by parish also illustrates certain cultural and psycho-social aspects of poverty that are not understood by merely examining the numbers. There are still significant migratory flows within the job market, and the fortunes of many rural households are bound up with the potential employment opportunities in major towns and along the coasts. A fair degree of the fluctuation in parish poverty rates can therefore be explained by these structural nuances.
With respect to the parish survey periods in Table 1, the following analysis presents a summary picture of the periods 1992-1998 and 2008-2012, when there were corresponding trends of decline and increase in national poverty rates. The data provides a background to factors impacting on the variations seen at the parish level.
Except for St Mary and Trelawny, all parishes showed significant reductions in poverty between 1992 and 1998. This suggests that the factors driving poverty downwards may have been national in scale and not necessarily region or economic activity specific. Higher GDP may have played a significant role. Between 1990 and 1996 when the financial crisis began, real GDP increased by 3.6 per cent. Other factors that positively affected poverty during this time were low rates of inflation recorded between 1996 and 1998, as well as efforts to combat poverty by the National Poverty Eradication Programme (NPEP) launched in 1995, particularly projects implemented by the Jamaica Social Investment Fund (JSIF), and the Social Development Commission (SDC).
During the period 1992-1998, the hotel industry grew in terms of stop over arrivals, value added and number of persons employed, which would have positively impacted the tourist centres to the north and west of the island. However, the northern parishes of St Mary and Trelawny do not seem to have had a large enough share of increases in the tourism industry and by extension the associated multiplier effect, which may explain why these parishes did not experience declines in poverty during this period.

December 2016 Page 68 of 104
St Mary and Trelawny may have also been more adversely impacted by drought conditions that began in the latter part of 1996 and prevailed until early 1998, relative to other rural parishes in the north. The impact of the drought was manifested in decreased agricultural production in 1997 and 1998. In particular, sugar production in 1998 was lower than in 1992, which may have had more of a negative impact on Trelawny than in other sugar producing parishes (St Catherine, St Thomas, St Elizabeth, Clarendon and Westmoreland). For St Mary, this parish appeared to have been more responsive to the volatility of the banana industry between 1992 and 1998 compared with the other traditional banana producing parishes (St. Thomas, Portland and St. James). While banana production increased by over 18 per cent between 1992 and 1996, the drought resulted in banana production falling by over 30 per cent between 1996 and 1998, and being over 17 per cent lower in 1998 compared with 1992. This fall-off in banana production may have negatively impacted the poverty rate between 1992 and 1998 in St Mary.
The general increase in poverty between 2008 and 2012 could be explained by a real decline in GDP which fell by 3.7 per cent due to the onset of the global economic recession. This was reflected in significant fall-off in both the Goods Producing and Services industries by 8.5 per cent and 3.1 per cent respectively. The reduction in GDP was reflected in a decline of 12.5 per cent in real per capita consumption. However, there was a real increase in agriculture production which would have benefitted agricultural parishes positively. The agriculture industry grew by over 30 per cent in real terms between 2008 and 2012, which may have stymied the impact that the global economic crisis had, particularly on rural parishes since 2008/2009. In fact, overall, rural parishes registered a smaller increase in poverty compared with the Kingston Metropolitan Area.
The parishes of St. Mary, Trelawny, Hanover and St. Elizabeth appeared to have largely benefitted from the performance recorded in the agriculture industry between 2008 and 2012. There was a strong growth in agriculture output in 2009 and 2011 (over 10.0 per cent increases) while 2010 and 2012 showed modest but positive changes. With respect to St Elizabeth, the performance of agriculture may have tempered the impact that the decline in bauxite production had on this parish (see below).While other rural parishes may have also benefitted from the greater agriculture out-turn, other factors may have played a part in the poverty increase seen in these parishes. One of these factors could be the fall-off in sugar production that occurred between 2008 and 2012. This may have caused the poverty increase in parishes such as Westmoreland, Clarendon, St Thomas and St Catherine (which contains two sugar factories). Sugar production fell by approximately 17 per cent between 2009 and 2010, before recovering slightly between 2010 and 2012 to register an overall decline of 7 per cent between 2008 and 2012.
The slowing in the Mining & Quarrying industry stemming from the closure of bauxite factories in St. Elizabeth, Manchester and St. Catherine due to the global economic recession may have contributed to the increase in poverty between 2008 and 2012 in these parishes. GDP for the Mining & Quarrying industry fell by over 48 per cent between 2008 and 2012. The closure of bauxite plants in St. Elizabeth, St. Catherine and Manchester resulted in a reduction in employment of approximately 5 600 persons, which may have had a negative impact on households in these parishes. St. Catherine and Manchester may have been more adversely

December 2016 Page 69 of 104
impacted both directly and through the multiplier effect. Additionally, bauxite plants in Clarendon and St Ann scaled down operations in 2012 compared with 2008 which would have led to lower income being accrued in those parishes, which may have also contributed negatively to their poverty situation.
Similar to the 1992 to 1998 period, the hotel industry grew in terms of stopover arrivals and in value added. However, unlike the 1992 to 1998 period, fewer persons were employed in this industry in 2012 compared with 2008. This lower employment level may have helped to contribute to the increased poverty rate in parishes such as St James and St Ann, which recorded increased poverty figures. It should be noted, however, that despite the increase, St. James remained one of the parishes with the lowest poverty prevalence. In addition to this, these parishes have been home to the traditional cruise ship ports. However, stopover arrivals by cruise ship passengers fell markedly from the levels in 2008. The reduction in stopover arrivals in both parishes may have been due in part to the opening of a new port in Falmouth, Trelawny in 2012, which experienced record stopover arrivals from cruise ship passengers of 586 578 persons in 2012, compared with 456 442 in 2011. The opening of the Falmouth pier would have contributed to the reduction in poverty recorded for Trelawny between 2008 and 2012 and may have acted to counter the dampening effect of the reduction in sugar production on the Trelawny economy. Consumption Inequality, Depth and Severity of Poverty Differences in consumption across the population were also observed to be significant over the period. Despite the general decline in consumption inequality as measured by the Gini Coefficient for the period 1990 to 2012,20 the poorest 50 per cent of the population consumed 22-25 per cent of national consumption. The wealthiest 30 per cent consumed 57 per cent of national consumption from 1990 to 2000 and 2012; and 45 per cent of national consumption in 2001 to 2010. Comparatively, the wealthiest decile consumed 29 per cent – 31 per cent of national consumption in 1990 to 2012 versus 2-3 per cent for the poorest decile. Further analysis of the 2010 JSLC data also reveals that the poor had weaker socio-economic prospects in areas such as education, labour force participation, employment, and health insurance coverage. Policy-making and programming must therefore target the weaker socio-economic prospects and consumption inequality faced by the poor and vulnerable. The poverty gap index measures the depth of poverty or the average extent to which individuals are below the absolute poverty line as a percentage of the line itself. The poverty gap indices for the period 1990 to 2012 show a general decline with some fluctuation; the highest measures being 14.7 per cent and 11per cent in 1991 and 2002 respectively (Appendix 5).The years 2005 to 2008 show a consistent period of low poverty gap indices which then trended upwards from 2.9 per cent in 2008 to 5.8per cent in 2012. Computation based on the poverty gap shows that at minimum cost, $22 billion was required to take the poor out of poverty in 2012 compared to $15 billion in 2010 (PIOJ, 2012, 2.10).
20
The Gini fluctuated from a low of 0.3604 in 1996 to a high of 0.4164 in 1997 (Appendix 6). The Gini gradually
increased from 0.3675 in 2007 to 0.3813 in 2010; and slightly declined to 0.3748 in 2012.

December 2016 Page 70 of 104
Like Jamaica overall, the KMA, Other Towns and Rural Areas showed declines in the poverty gap indices from 1990 to 2012. Rural Areas generally recorded the highest poverty gap indices followed by Other Towns. In 2012 poverty gap indices were higher in KMA than in Other Towns (Appendix 5). This means that individual consumption will have to increase by a greater percentage of the poverty line for persons to be considered non-poor in Rural Areas. The squared poverty gap index measures the variation in consumption among the poor and indicates the severity of poverty (Appendix 6). The squared poverty gap indices show a similar trend to that of the poverty gap indices for 1990 to 2012. Squared poverty gap indices declined from 0.071 in 1991 and 0.049 in 2002 to the low levels of 0.009 in 2007 and 0.011 in 2008 (Appendix 6). The indices have trended upwards since 2008. Like Jamaica overall, the KMA, Other Towns and Rural Areas showed declines with some fluctuations in the squared poverty gap indices from 1990 to 2012 with the Rural Areas having the highest squared poverty gap indices overall. Prevalence of Poverty by Sex and Geographical Region There was a general decline in the prevalence of poverty among both males and females for the period 1990 to 2007, and an upward trend observed since 2008 (Appendix 9). For the period 2007 to 2012, poverty prevalence trended upwards for both sexes, and in all regions was consistently higher among males. Poverty prevalence increased from 6.5 per cent for males and 5.9 per cent for females in KMA, to 21 percent and 18.7 per cent respectively. For Other Towns, the prevalence of poverty among males increased from 5.3 per cent to 17.3 per cent and females 2.8 per cent to 15.9 per cent. In rural areas, 16.9 percent to 21.6 per cent for males, and 16.1 per cent and 20.9 per cent for females. Though the prevalence of poverty was higher for males for the period 1990 to 2012, greater proportions of female compared to male headed households were poor (Appendix 8). Poverty declined from 35.6 per cent and 33.8 per cent for male and female headed households in 1991 to 7.2 per cent and 8 per cent respectively in 2007. In 2012, 13.2 per cent of male headed households and 15.9 per cent female headed households were poor. Food poverty (adult equivalent) also declined in Jamaica for both males and females from the highest rate of 23.7 per cent and 21.7 per cent for males and females respectively in 1991 to 3.3 per cent and 2.4 per cent respectively in 2007. The decline was also evident for male and female headed households. Since 2008, food poverty increased and doubled the 2007 rates for both males and females in 2010 and 2012 (Appendix 3). At the national level, for the period 1990 to 2012, slightly higher proportions of males were food poor than females, however generally higher proportions of female-headed compared to male-headed households were food poor (Appendix 8). At the regional level, food poverty was generally higher among males.

December 2016 Page 71 of 104
Prevalence of Poverty and Vulnerability by Life-Cycle Groups Children The prevalence of poverty generally, and food poverty, was highest for children in all geographical regions for the period 1990 to 2012. Child poverty is usually higher than the national poverty prevalence; 25 per cent versus 19.9 per cent in 2012 (Appendix 11). The year 2012 converged and showed equal poverty prevalence among children in KMA and Rural Areas (26.1 per cent) and a slightly lower proportion in Other Towns (20.9 per cent). Among those considered indigent and are clients of the state, 4000 are children. Children in Jamaica are vulnerable to poverty because of their membership in low income families which are located in poor rural areas with limited access to basic services, or in vulnerable and volatile inner city communities. Given the higher unemployment rate and lower income earned by women, children who reside in single parent female headed households are more vulnerable to being poor. Some 74 per cent of female headed households have children present. The JSLC 2012 indicates that there is a higher age dependency ratio in female headed households than males, 63.4 per 100 and 49.9 per 100 for females and males respectively. One of the two contributing factors identified is the larger proportions of children in female headed households (30.4 per cent), than in male headed households (22.7 per cent). A one-unit increase in the child dependency ratio reduces household consumption by 5.6 per cent and leads to increased probability of being poor (Benfield 201, 72-73). The JSLC posits that “the larger number of dependants make female headed households more vulnerable to the effects of external stimuli, such as economic downturns and high inflation” (PIOJ, 2012, 2.6). Children in the poorest households are eight times more likely to be child labourers than those in rich households (MICS4 2011b, 9). Perpetuating the cycle of poverty, early child bearing is negatively associated with wealth where 20-24 year olds in the poorest households are 10 times more likely to have a child before the age of 18 than the richest (MICS4 2011b, 6). Children in state care are also vulnerable to poverty because of exposure to the risks of low educational outcomes, challenges with independent living, disability, stigma and social exclusion as well as unemployment and low wage jobs (PIOJ, 2013, 16). To break the intergenerational cycle of poverty, by arresting the nutritional deficiencies in children that affect physical and cognitive development, pregnant and lactating women are targeted for social protection programmes. In 2011, 1572 pregnant and lactating women were beneficiaries of the PATH programme. In reference to selection of beneficiaries, Gibson 2013 notes that “the best selection is among poor households with pregnant and lactating women, where the selection rate is over 74 percent”. The assessment further identified that 85.6 per cent of persons within this category of beneficiaries is below the poverty line and 94.1 per cent below the 150 per cent of the poverty line. The National Policy on Poverty and supporting Poverty Programme must therefore carefully target children that are poor, parents of reproductive age, recognising the multiple vulnerabilities faced. A case in point concerns households with children with disabilities that are more likely to

December 2016 Page 72 of 104
correlate with severe deprivations in areas such as health, shelter, and education (Gayle-Geddes 2010; Gayle-Geddes 2012; Witter et al. 2009). Youth Youth (15-24 years) represent 19.5 per cent of the population (STATIN 2012). Some 46.2 per cent of youth (15-29 years) described their household financial situation as being ‘around the national average,’ 20.7 per cent thought that they were ‘poor,’ 19.2 per cent ‘fairly poor’ and 13.8 per cent ‘well off or fairly well off’ (ILO, STATIN and PIOJ 2013, 28). The 39.9 per cent of youth who consider themselves poor or nearly poor is two times the national poverty prevalence in 2012. A large proportion of the youth (15–24 years) is significantly at risk as they leave school without adequate qualification for employment, and are not pursuing further education nor training. Marques, 2011 found that “drug trafficking and abuse, crime, extortion, prostitution and trafficking in persons are some types of deviant behaviour in which youth are engaged. The phenomenon of street children is a particular challenge. Estimates range from 2 000 to 6 000 children living and working on the streets in Jamaica with a male: female ratio of 70:30. On average they are 13 years of age, and from a household headed by a female who is in informal or domestic employment” (Marques 2011, 63). Groups showing the largest increase of persons on the streets are primarily younger persons, namely young men who are drug addicts (and often go on to become mentally ill) and children discharged from state care on attaining 18 years of age. Other expanding groups include children of HIV parents. Younger children hustling on the streets but not necessarily living there are also reported to be on the rise. Of some importance is the fact that the street children all reported the common characteristic of having a large number of siblings. This is consistent with findings that the number of children in a household is strongly correlated with poverty status and is the greatest household based source of inequality in Jamaica (PIOJ, 2014, 148). Youth unemployment (14-24 years) is therefore impacted as they face unemployment rates three times that of adults 25 years and over in 2012 and 2013. According to the ESSJ 2013, Youth unemployment (14-24 years) was 33.4 per cent in 2012 and 37.7 per cent in 2013 compared with adults (25 years and over) of 11.1per cent in 2012 and 2013 “Among the employed [youth 15-29 years], the majority were male (58.2 per cent), aged 25-29 years old (46.6 per cent) and from urban areas (57.9 per cent). Youth were working mainly in the informal sector (42.0 per cent). Approximately 25 per cent of youth were entrepreneurs” (ILO, STATIN and PIOJ 2013, 12). The data also shows that the unemployment rate decreases as the level of education increases. Of the estimated 307,200 youths who were outside the labour force, approximately 207,800 or 67.6 per cent were in school or training. The remaining 99,400 youths were neither seeking work nor enrolled in school/training (ILO, STATIN and PIOJ 2013, 13). An estimated 269,000 or 35.5 per cent of Jamaican youth have successfully transitioned21 from school to work; 310,800 or 41.0 per cent are still in transition and 23.5 per cent have not yet
21A young person is considered to be in transition if they are unemployed, employed in a temporary and non-satisfactory job, self-employed and not
satisfied with the work, or currently inactive and not in school, with future job aspirations.

December 2016 Page 73 of 104
started the transition (ILO, STATIN & PIOJ 2013, 13). The current duration of transition ranges from 73 months for the poorest quintile to 50 months for the wealthiest quintile. Some 58.4 per cent of young students indicated that “University/Tertiary” level education was the highest level that they expected to complete, with another 21.5 per cent expected to complete post-graduate studies. Females had a greater expectation of completing higher education than males (ILO, STATIN & PIOJ 2013, 11-12).The study notes that despite the desire to obtain higher education, 64.8 per cent or approximately 491,200 youth were not enrolled in a school or training programme at the time of the survey. Among youth not enrolled in school, 26.2 per cent were early school leavers and did not complete their education or training programme. Economic reasons were the primary response given when asked the reason for not completing the education or training programme (45.1 per cent) (ILO, STATIN & PIOJ 2013, 12). Effective poverty reduction must address the tremendous overlap between youth organisations in the type of programmes and services offered and the underserved areas which remain. The way forward includes capacity building in programme management and coordination, resource mobilization, programme monitoring and evaluation, institutional needs assessment and information systems management (Rhiney and Waller 2012, 6-10). Working-Age The Economic and Social Survey of Jamaica reports that working age (15-64 years) represents 67.4 per cent of the population (PIOJ 2013, 20.3). Some 17.8 per cent of working adults (18-64 years) were poor in 2012 (Appendix 11). The data indicated prevalence of poverty among the working age was highest in Rural Areas, 19 per cent, 17.8 percent in KMA and 14.8 per cent in Other Towns (Appendix 12). The JSLC report indicated larger proportions of working age (66.7 percent) in male headed households than in female headed households (61.2 per cent). There is a greater level of dependence in female headed households; age dependency ratio in female headed households in Rural Areas was (69.1 dependents) and in Other Towns, (68.9 dependents) which is above the national average of 56.5 dependents. (PIOJ 2012:1.5) Mean household size was larger for females and female headed households were largest in the poorest quintile (PIOJ 2012:1.8). Jamaica’s latest data show labour force participation rate of approximately 63.0 per cent, unemployment rates of 13.7 per cent, and employment rate of 86.0 per cent (PIOJ 2014, 21.2, 21.7, 21.3). Available data show lower labour force participation rate (58.8 per cent and 61.7 per cent) and employment rate (75.4 per cent and 87.5 per cent) of the poor versus non-poor in 2012. The poor had twice the unemployment rate of the non-poor (24.6 per cent and 12.5 per cent). Benfield (2010, 81-82), however, indicates that many of the poor classified as unemployed are instead underemployed. Further, between 2008 and 2012, construction, and wholesale and retail were among the industries exhibiting the highest rates of unemployment in the labour force which, in addition to agriculture and fisheries are the industries in which the greatest proportion of the poor is found.

December 2016 Page 74 of 104
Social protection programmes for the working age are also undersubscribed. The JSLC 2012 reports national registration rate in the NIS is 39.1 per cent; some 9.5 per cent in NHF and 26.3 per cent in JADEP. NIS coverage is highest amongst persons with higher education levels, in urban areas, with higher incomes, and younger workers between 25 and 44 years old (Christie 2013). Greater proportions of females than males, KMA residents than Other Towns and Rural Areas and quintiles 3-5 than quintiles 1-2 were registered with the NIS, NHF and JADEP. For NIS, some 37.6 per cent of males and 39.7 per cent of females were registered. Further, the two industries that employ the most workers in Jamaica have the lowest levels of NIS compliance, that is, agriculture, and wholesale and retail sectors (PIOJ, 2012, 6.6-6.7). These as well as other poverty correlated factors such as disability status of household heads; education level of the principal earner; and household size demonstrates that poverty reduction initiatives must use evidence to carefully target. Among the core focus must be the unemployed, underemployed, unskilled and low skilled poor and stimulation of informal sectors, MSMEs and the industries where most of the poor are found such as agriculture to strengthen pro-poor growth. Careful planning is required to take advantage of the demographic bonus of the working age population which, based on available 2012 data, is expected to increase to 1,888,000 (64.5 per cent) in 2030. The expected “bulge” in the working age population is regarded as a “window of opportunity” and means that there is an excess of persons in the working age relative to the dependent ages (children 0-14 years and old age 65 and over).22There is an urgent need for the current working age population to be adequately trained to meet these challenges. Elderly The ESSJ, 2013, records that the elderly 60 years and over represents 11.9 per cent of the population (PIOJ 2013).The Report on Module on Persons Aged Sixty Years and Older, reports that poverty among the elderly was 14.6 per cent with little difference in the prevalence of poverty between the sexes by age. The prevalence of poverty among the elderly was highest in the Rural Areas (16.2 per cent) and lowest in the other Towns (11.3 per cent) (PIOJ, 2012, 55). Jamaica is characteristic of more developed countries with an aging demographic profile however, majority of elderly persons (63.2 per cent) in 2012, made no preparation for retirement (PIOJ, 2012, 60). Currently, less than one-third of persons 65 years and older receive NIS pension benefits. Further, only 27 per cent of NIS pensioners qualify for the full flat rate benefit of $2,800 per week, and an additional 25 per cent of the elderly qualify for a limited ($225 per week) PATH old-age grant (Christie 2013, 6). The ESSJ 2014, indicates that 52.9 per cent of outdoor poor were elderly and 69.7 percent of indoor poor. Some 71.5 per cent of male Indoor Poor Relief clients were within the elderly cohort and 42.1 per cent of total indoor poor clients were elderly persons (PIOJ 2014, 25.31- 25.32). The aforementioned ‘bulge’ in the working age is expected to transition to the elderly age group and therefore requires careful development planning particularly for the areas of social
22
The dependency rate declined from 62.4% in 2003 to 48.3% in 2013 (ESSJ 2013).

December 2016 Page 75 of 104
protection generally and income security in particular. Policy initiatives to increase NIS compliance, mandatory enrolment in a supplementary pension plan for all workers, geriatric care and independent living enablement are strategic recommendations critical for poverty reduction prevention for an aging population. Other Vulnerable Groups: Persons with Disabilities The JSLC 2012 records that 3.6 per cent of the population reported having a disability. This is spread evenly across region, sex and quintile (JSLC, 2012, 3.6). The JSLC data for 2008 indicates that 13.8 per cent of persons with disabilities were poor, and majority, (42.9 per cent), of persons with disabilities who are poor are located in the Rural Areas. The 2001 Census data indicates that 14.1 per cent of persons with disabilities were employed with higher unemployment rates among males than females. The major risk factors identified for poverty among persons with disabilities are weak transitioning through educational levels, inadequate system for early detection of disabilities, limited access to employment, stigma, discrimination, and exclusion (PIOJ 2013, 31). Recognizing the special needs of persons with disabilities the MSME and Entrepreneurship Policy of MIIC has as one of its objectives the provision of “full inclusion, opportunities and support for persons with disabilities within the business community” through various strategies aimed at enabling disabled persons to develop and sustain their own businesses (MIIC, 2013, 84). Other social assistance programmes are available to the disabled through the Ministry of Labour and Social Security and Jamaica Council for Persons with Disabilities, in keeping with strategies outlined in Vision 2030 Jamaica Poverty Reduction Strategic Plan and the Jamaica Social Protection Strategy. The Indigent and Homeless The indigent is described as persons who are unable to provide their basic needs and fully require daily support. They are typically clients of the state through the Poor Relief Programme though services are also offered by agencies such as the National Council for Senior Citizens and the Jamaica Council for Persons with Disabilities as well as NGOs. Annually, support is provided to approximately 15000 persons, through residential care, financial allowances, health, housing and education support. For the 2014 period, the ESSJ reports 12 088 persons, 6 237 of which are female, on the Outdoor Poor Relief Programme and 1 462, on the Indoor Poor Relief Programme 861 of which are male, (PIOJ 2014, 25.31-25.32). Though representing a relatively small percentage of the population, persons who are homeless are among the vulnerable of the society particularly because of the risk factors associated with their condition. Low educational status, unemployment, lack of support systems, drug abuse, mental and other health problems, deportation status and likely criminal record are factors that contribute to the vulnerability of homeless persons (PIOJ, 2013, 37-38). Of the 645 persons homeless persons observed island wide, 87.6 per cent were male; 59.7 per cent were located in the urban centres of Kingston and St Andrew, 15.5 per cent in St James and

December 2016 Page 76 of 104
7.9 per cent in Clarendon. Majority, (84.3 per cent) of homeless persons lived on the streets. Others lived in shelters. (PIOJ, 2012, 37-38). The ESSJ reports that in 2014 the Board of Supervision served 1 465homeless clients, 1 206 of which were males (PIOJ, 2014, 25.32) Small Producers and Small Businesses Small producers are among those who are vulnerable to poverty. The STATIN Labour Force Survey 2014 identified 205,000 persons were employed in the occupation group of Skilled Agriculture and Fishery Workers representing 18.5 per cent of the labour force. Additionally, the informal sector accounted for 37.9 per cent of employment in 2014 (STATIN 2014, 4). Ballayram (2008), reporting on vulnerabilities faced by this category, identified significant risks to food security and livelihood. Among these risks are the lack of capital and credit, poor purchasing power, weak human and physical capacity, seasonality of available employment, weak social fabric, indebtedness and lack of capital to expand livelihood. The study found that 67 per cent of household heads in rural areas were employed in agriculture. Additionally, subsistence farmers accounted for 60 per cent of all farmers in Jamaica. This group is highly dependent on natural capital and is highly susceptible to climate change and natural hazards. They are also challenged by praedial larceny, little social security coverage and are characterized by a cycle of low nutritional and educational outcomes.
Small farmers are particularly vulnerable to environmental events such as hurricane, heavy winds, landslides, floods drought, which exacerbate their situation. The impact of extreme weather events has resulted in significant damage and losses to the agriculture sector. The FAO, in the Environment and Natural Resource Management Series #21, indicates that “Climate change is a major challenge to agriculture development in Jamaica due to the country’s small land mass, fragile ecosystems, high dependence on food imports and increasing impacts of frequent natural disasters… The damage and loss to the agriculture sector due to major climate events between 1994 and 2010 is estimated to have amounted to J$14.4 billion. On average, the impact of major climate extremes on agriculture accounts for nearly 20 percent of the total impact on the country (FAO, 2013, xi).
Micro and Small Enterprises contribute significantly to employment in Jamaica. The Ministry of Investment and Commerce, in the MSME and Entrepreneurship Policy 2013, noted that in 1996 there were 93,110 micro and small businesses in Jamaica, which accounted for 18.1 per cent of the employed labour force. Quoting data from the 2011 STATIN Labour Force Survey, MIIC indicated that the own worker category accounted for 35.9 per cent of the employed labour force, and that in 2008, MSMEs in Jamaica are mainly involved in the Wholesale and Retail Trade (55.7 per cent) and Community and Social and Personal Services sectors (23.3 per cent). (MIIC, 2013, 24, 25). Informality of a number of these enterprises creates a challenge in accessing capital. Other risks faced by SMEs are excessive bureaucracy in their performance of their business and lack of training among business owners. Access to international markets is also an area of concern. (PIOJ, 2013, 50)

December 2016 Page 77 of 104
Residents of Informal Settlements The location of the poor in informal settlements around marginal lands, in environmentally sensitive areas increases vulnerability in periods of disaster. The rapid assessment of squatting report conducting by the Ministry of Water and Housing indicated that squatter settlements are highly vulnerable to natural hazards specifically earthquakes, flooding, landslides and storm surges. These settlements are lacking in essential infrastructure and have poor social amenities (Ministry of Water and Housing, 2007, 3-4, 27). The report notes that squatting is “widely seen as a response to the low-income and unemployed inability to access affordable land and other housing services. The unplanned nature of squatter settlements gives rise to environmental degradation, public health issues, increased exposure to natural and man-made hazards, as well as a haven for criminal activities.” (Ministry of Water and Housing, 2007, 12) Informal settlement therefore speaks to need for increase in social and low income housing, and settlement regularisation and upgrade.
Socio-economic Determinants of Poverty The Vision 2030 Jamaica Poverty Reduction Strategic Plan, 2009, identifies that “the cyclical nature of poverty among households leads to similarity between causes and effects of poverty overtime. Many factors impacting poverty have an inter-generational dynamic that re-creates the manifestations of poverty where they are not arrested.” Among the main issues identified as the determinants of poverty in Jamaica are low educational attainment levels, low income earning capability, inability to access basic social services, lack of economic opportunities leading to underemployment, unemployment and low wage employment, poor rural development impacting the opportunities and livelihoods of rural households and high levels of risks due to natural hazards (PIOJ, 2009, 9). Risks faced by households below the poverty line also includes narrow range of occupations, limited access to goods and services and basic social services and amenities. This is particularly prevalent in rural areas. Labour Market: Low income, unemployment and higher dependency rates are characteristic of the poor in Jamaica. Analysis of the 2012 JSLC data indicates that the labour force participation rate of the poor was 58.9 per cent compared with 61.7 per cent for the non-poor. Likewise, the poor had a lower employment rate (75.4 per cent) than the non-poor (87.5 per cent). The unemployment rate of the poor was almost twice that of the non-poor (24.6 per cent and 12.5 per cent). Accordingly, the poor had a higher economic dependency ratio than the non-poor (2.2 and 1.3). Each economically active person was supporting on average 1 more economically inactive persons in poor households compared with non-poor households. The industries in which the poor mainly worked include Agriculture, Forestry and Fishing (24.4 per cent), Wholesale and Retail, and Repair of Motor Vehicle/Equipment (20.6 per cent); Construction (11.3 per cent); and Private Households with Employed Persons (8.7 per cent) which are traditionally associated with lower income occupations.
December 2016 Page 78 of 104
Education: Educational outcomes impact employment status and income and are critical for breaking the intergenerational cycle of poverty. The JSLC data for 2012 indicates that the heads of poor households had lower levels of educational attainment than heads of non-poor households. Some 3.5 per cent of poor household heads completed tertiary education, 20.2 per cent attained primary, 23.5 per cent completed secondary and 50.9 per cent completed some secondary schooling. Comparatively, 15.9 per cent of non-poor household heads attained tertiary education, 15.7 per cent attained primary, 28.7 per cent completed secondary and 40.5 per cent completed some secondary schooling. Further, the 70.9 per cent of poor persons of school age (3–24 years) were enrolled compared with 74.5 per cent of the non-poor. However, as poor persons of school age got older, the proportion enrolled at each age level decreased more sharply than those who were non-poor, and became distinct at 15-16 years. The JSLC 2012 report states that there is a positive relationship between school attendance and consumption status with children in the poorest quintile having an average attendance of 68.6 per cent while those in the wealthiest quintile attend 90.4 per cent on average (PIOJ, 2012, 4.7, 4.8). Poor households are also affected by access to education. “Children in Rural Areas continued to travel longer distances and pay more for transportation compared with children from Other Towns and KMA. The survey showed that there was a decline in the percentage of students who had all their text books required by the schools with this being more pronounced for students in Rural Areas. Additionally, students from Rural Areas had lower school attendance rates; 50.0 per cent reported absence from school because of money problems. The report points out the implications for quality education among children of poor households which is critical for breaking the intergenerational cycle of poverty” (PIOJ 2012, 4.17). Health: Vision 2030 Jamaica has as one of its outcomes, a healthy and stable population. Health affects productivity and ability to achieve one’s fullest potential. Access to quality healthcare is therefore critical to achieve this goal and ultimately to contribute to, and sustain, poverty reduction efforts. The JSLC 2012 reports that as socio economic status improves, the proportion of persons using public health facilities decreased ranging from 77.1 per cent in quintile 1 to 42.2 per cent in quintile 5. The main users of public health facilities were therefore persons in the first four quintiles, persons living in rural areas (63.4 per cent), those from the poorest quintile (77.1 per cent), males (64.5 per cent) and children 5-9 years old (70.4 percent) (PIOJ, 2012, 3.9).Socio-economic status was also related to health insurance coverage with an estimated 4.7 percent in quintile 1 having health insurance compared with 37.6 per cent of quintile 5. Further, persons who are more likely to have insurance coverage are those who are wealthier, older, female and living in an urban area (PIOJ, 2012, 3.12). The JSLC 2012 further reports that “waiting time is an important indicator in assessing the quality of health services. Persons for whom the longest waiting times were reported were from rural areas, elderly and from the poorest 40.0 per cent of the population.” Further, in 2012, financial constraint was the main reason cited by 22.4 per cent persons in rural areas, 20.8 percent in KMA and 13.4 per cent in Other Towns, for not seeking healthcare.(PIOJ 2012, 3.21)

December 2016 Page 79 of 104
Psycho Social Factors: There are psycho social cultural and normative features of society that perpetuate poverty. The family which is generally accepted as the primary agent of socialization providing the nurturing environment in which functional adults are grown has been faced with numerous challenges. Stability in the family is critical to healthy child development, failure of which results in juvenile delinquency, child abuse and poor educational performance (Le Franc, Bailey and Branch, 1998:1 as cited in Rickets and Anderson 2009, 5). Breaking the intergenerational cycle of poverty is therefore requires healthy family structures that enable children to function optimally in their adults years. Consultations with key stakeholders revealed that cultural norms and practices perpetuate poverty. Concepts associated with childbearing, gender definition and poor customer service enables practices whose consequences impact service delivery, household consumption, cognitive development and educational attainment levels.
Current Programmes Poverty Reduction Programmes Poverty Reduction Programmes span a range of interventions implemented through a number of government ministries departments and agencies as well as non-government organizations. Among the main programmes aimed at poverty reduction are: 1. PATH Programme 2. Steps To Work Programme (PATH) 3. Poor Relief Programme 4. School Feeding Programme 5. Social Housing Programme 6. The Possibility Programme 7. Community Investment Project 8. Integrated Community Development Project 9. Poverty Reduction Programme III & IV 10. Petro Caribe Schools’ Sanitation Upgrade Project 11. Basic Needs Trust Fund 7 12. Community Renewal Programme (CRP) 13. Sugar Area Development Programme 14. Rural Economic Development Initiative The merits and outcomes of programmes aimed at poverty reduction have been varied over the years. Below is a summary of the outcome or impact of these programmes which are at various levels of implementation. PATH: The Programme of Advancement through Health and Education (PATH) is in its thirteenth year of implementation, and is administered through the Ministry of Labour and Social Security. It is a conditional cash transfer programme designed to promote human capital formation especially among children and youth in an effort to break the intergenerational cycle of poverty. It is described as the “centrepiece of the government’s social protection system for

December 2016 Page 80 of 104
the poor and vulnerable especially children, young people, of school age, the elderly and persons with disabilities” (Marques 2011:214). It was designed to consolidate Food Stamp, Old Age and Incapacity Allowance-Public Assistance, and Outdoor Poor Relief. In 2014, the Economic and Social Survey of Jamaica reported that there were 372 751 beneficiaries of the PATH programme which represents 13.7 per cent of the population, 271 365 of which were children. Additionally, there was a 48.2 per cent increase in registration of Adult Poor Clients in 2014 (PIOJ 2014, 25.30-25.31) The evaluation report of the PATH Programme conducted in 2012 indicated that a greater proportion of PATH households were below the poverty line than those in non-PATH households, 59 per cent and 43 per cent respectively. A greater percentage of those on the programme who are below the poverty line were in other urban towns, 69 per cent of PATH households, compared with 52 per cent of non-PATH. In KMA, 60 per cent of PATH and 45 per cent of non-PATH households were below the poverty line and Rural Areas 58 per cent of PATH and 41 per cent of non-PATH households. A greater percentage of PATH households in all regions were also below the food poverty line (77 percent) than control households (69 per cent) (Sanigest 2012, 46, 47) The report indicated further that PATH has an important role in improving living conditions of households as well as increasing school attendance and health care visits. It has “increased children’s school attendance, reduced hunger, and produced intangible effects such as reducing stress and producing a greater sense of personal responsibility.” (Sanigest 2012, 37) School Feeding Programme: The School Feeding Programme administered by the Ministry of Education offers meals to students at a subsidized rate, and free to PATH beneficiaries. The ESSJ 2014 notes, that the objective of the programme is to encourage greater school attendance, alleviate hunger and enhance learning capacity, educate students on the value of food and encourage children to grow their own food as well supply at least one-third of the caloric requirements of the child (PIOJ 2014, 22.11). For the 2013/14 financial year, the total allocation to the school feeding programme was 3.6 billion (PIOJ, 2012, 25.3). MOE statistics indicate that 86,000 children in recognized community based basic schools and 311,000 in public schools at the primary level benefited from school feeding for the school year 2010/2011. The ESSJ 2014 records that cumulatively, 312,000 students benefited from the programme’s two components (PIOJ 2014, 22.11). The Operational Assessment of the School Feeding Programme 2012, identified major issues impacting the delivery of the programme. Absence of universally applied guidelines and standardized procedures which results in schools administering the programme according to interpretation and context, absence of enforced nutritional standards, emphasis on providing lunch though breakfast may be a more effective avenue for optimizing the intervention, insufficient use of local foods and absence of fruits and vegetables in meals, inadequate staffing of the unit to manage and monitor operations at all levels and in schools to implement the programme, discriminatory practice that stigmatize participants and low participation of

December 2016 Page 81 of 104
vulnerable students either from fear of discrimination and stigmatization or from lack of knowledge of the facility (Powell, Francis & Mundy-Parkes, 2012). Poor Relief: The Poor Relief programme was established to alleviate poverty and destitution and provides non-institutional as well as institutional care for adults and children. In non-institutional care, or Outdoor Poor Relief, clients may be on the registered roll as ward of the state, or they may be destitute persons receiving temporary assistance only. In institutional care, or Indoor Poor Relief, clients are wards of the state and receive total care in infirmaries or golden age homes. The Poor Relief Department also provides temporary assistance to all members of the society who require assistance at particular periods of time. According to the Economic and Social Survey of Jamaica, the outdoor aspect of the poor relief programme served 12 088 beneficiaries in 2014, 6 237 of which were females and 438 under the age of 20 years. The elderly has the largest percentage (52.9 per cent) of beneficiaries. Kingston and St Andrew, St Catherine and James had the highest number of beneficiaries in 2014, 5 510, 1 407 and 1 262 respectively. A total of $76.6 million was spent on this aspect of the programme. The indoor programme served 1462 persons, 861 of which were males. Majority, (69.7 per cent) were elderly. Expenditure on the indoor poor aspect of the programme amounted to $296.2 million dollars. (PIOJ, 2014, 25.31-25.32) PRP III: The purpose of the Poverty Reduction Programme III is to contribute to the implementation of the Community Renewal Programme (CRP) and aims to contribute to inclusive growth and equitable development by promoting economic well-being and enhanced quality of life for residents of volatile communities. The four components to which it contributes are physical transformation, governance, socio-economic development and youth development. Approximately JMD$155M was disbursed under the PRP III in 2014. Eight sub-projects were executed through the PRP III across volatile urban communities in the parishes of St. James, St. Catherine, Kingston & St. Andrew and Clarendon targeting 595 beneficiaries. School improvement projects accounted for majority, (75 per cent), of funding disbursed in 2014. PRP IV: The purpose of the Poverty Reduction Programme IV (PRP IV) is to contribute to inclusive growth and equitable development by promoting economic well-being and enhanced quality of life for residents of volatile communities in the parishes of Kingston, Clarendon, St. Andrew, St. Catherine, and St. James. It contains five result areas: improved quality and access to basic socio-economic infrastructure and services, increased capacity of communities to demand for, plan, implement and manage local development projects, increased income generation and employment opportunities, reduced deviant behaviour through work with socially and economically marginalized youth and improved coordination, monitoring and evaluation capacity of the Secretariat of the Community Renewal Programme. PRP IV is implemented at a total value of $13.08 million.

December 2016 Page 82 of 104
CIP: The Community Investment Project funded through the Caribbean Development Bank has as its primary objective improvement in the socio-economic conditions of poor rural communities by increasing their access to basic social and economic infrastructure, social services and organizational strengthening activities which meet their needs and priorities. Types of projects covered under the CIP are roads, schools, capacity building, education and training programmes, healthcare, and organization strengthening and training. The project targets all parishes except Kingston and is valued at US $14.513 million. Approximately $320 million was disbursed under the CIP during the 2014 period benefiting 14,767 beneficiaries. PDF: The PETRO CARIBE Development Fund (PDF) supports the implementation of the Community Renewal Programme (CRP) which is being managed by the Planning Institute of Jamaica. It consists of two components; Schools Sanitation Upgrade comprising sanitation units being constructed in in schools that have pit latrine and authorizing the execution of small grants and special projects on behalf of the PDF which provide psychosocial, health care & education interventions. The programme covers all parishes of Jamaica. Approximately JMD$32.9M was disbursed under the PDF in 2014, benefiting 5,787 persons. Basic Needs Trust Fund 7: The objective of the Basic Needs Trust Fund is to reduce poverty and vulnerability by improved access to basic social and economic infrastructure and human resource development services. The project targets rural areas and targets three main sectors namely, Education and Human and Resource Development, Access and Drainage, Water and Sanitation. The value of the project is US $7.6M. REDI: The Rural Economic Development Initiative (REDI) targets all parishes except Kingston. The objective of REDI is to provide micro and small-scale rural agricultural producers and tourism product and service providers with improved access to markets through technical support and capacity building in financial management, marketing, and business support services among others. National Technical Assistance and Capacity Building is another component of REDI which is aimed at strengthening relevant national organizations to increase their capacity to assist the rural enterprises and other project partners and ensure the sustainability of the rural enterprises. REDI is implemented through JSIF at a total value of US$17.5M inclusive of donor, GOJ and beneficiary values. (ICDP): The Integrated Community Development Project aims to enhance access to basic urban infrastructure and services, and contribute towards increased community safety in 18 selected economically vulnerable and socially volatile inner city communities of Jamaica, in the parishes of Kingston and St Andrew, Clarendon, St Catherine, St James, St. Ann and Westmoreland. The value of the project is US $42.0 million.

December 2016 Page 83 of 104
The ICDP is intended to strengthen and further expand the objectives of the Jamaica Inner City Basic Services Project. The related activities in each of the programme’s components are aimed at enhancing the quality of access to services for communities, transforming the physical environment within these communities, enhancing citizen security and strengthening institutional capacities for urban management and crime and violence reduction.
Poverty Reduction Challenges Despite the spread of state-led poverty related programmes, national poverty reduction outcomes are questionable and several challenges weaken the impact of the disparate initiatives. Inadequate legislation to support the multi-sectoral and crosscutting issues affecting poverty reduction programming across MDAs is the main challenge faced. The National Assistance Act, for example, is in train since the Social Safety Net reforms of the early 2000s. Absence of an overarching legislation impairs a coordinated approach to poverty reduction through an authoritative multi-sectoral institutional framework which effectively coordinate service delivery. This result in fragmentation, duplication and limited collaborative responses to programmes identified. Further, inadequate infrastructure, human and financial resources thwart long term sustainability of programmes. Accordingly, areas such as the unsustainable Public Sector Pension Scheme under present arrangements, low coverage in the National Insurance Scheme and private pension systems, limited utilization of systematic targeting mechanism of the Beneficiary Identification System in context of limited resources; unbalanced spending to the disbenefit of younger age cohorts; limited generosity/adequacy of social safety net programmes; limited pro-poor development in rural areas; limited case management capacity to bolster exit strategies for PATH households; weak economic growth and limited employment opportunities undercut the pace of poverty reduction. The sub-sections below outline select challenges identified. Disproportionate Spending by Age Cohort: Jamaica spends 4.4 per cent of GDP on social insurance. However, this share is not in keeping with the social risk management spring board expected for the younger age cohort. Of total social protection spending, GOJ’s public pension plan absorbs over one-fourth where the 60+ age cohort which accounts for 13 per cent of the poor absorbs over 62 per cent; whilst the 0-5 age cohort which has 12 per cent of the poor, 2.4 per cent. This suggests that programmes for the 0-5 age group may be underfunded. (Marques 2011, 18). Generosity/Adequacy: While Jamaica’s range of programmes is considered appropriate for the country’s needs, Marques (2011, 24) notes that there is “lack of generosity in the major social safety net programmes, the social safety net system is not very adequate to meet the needs of the various groups that require assistance and there is a significant coverage gap in terms of the NIS.” Sanigest (2013, 2) study notes that “PATH benefits per capita in households with at least one education-conditionality grant representing approximately 12 per cent of per capita education-related expenditures (under the assumption that the entire benefit amount is spent on education).” The current benefits formula and contribution densities show that the average weekly NIS pensions benefit is less than half the minimum wage (Christie 2013, 14).Comparative information regarding generosity and adequacy are unavailable for other grants

December 2016 Page 84 of 104
such as the MLSS’s Public Assistance programmes and MLGCD’s Poor Relief programme due to archaic, weak and unintegrated beneficiary management information systems. Targeting: The concentration indices calculated to evaluate the extent to which programme benefits are received by the poorest quintiles identified PATH, Poor Relief, Health Fee Waiver and NI Gold as pro-poor (Marques 2011, 20, 165).23The JSLC indicates marginally greater proportions of Rural Area residents followed by Other Towns and KMA respectively and quintiles 1-2 than quintiles 3-5 participated in Poor Relief. Comparatively, the majority (70 per cent) of PATH beneficiaries is located in Rural Areas, 17per cent in Other Towns and 13 per cent in the KMA (PIOJ 2012). Some 63.4 per cent of all beneficiaries are from Quintiles 1 and 2 (JSLC 2012). Gibbison (2013) finds that accuracy of targeting varies by parish with 61 per cent in St. Andrew, 73 per cent in Kingston and 92 per cent in Clarendon. The parishes of St. Ann (46 per cent), St. James (38 per cent), Manchester (43 per cent) and St. Elizabeth (51 per cent) had least coverage of poor applicants though the prevalence of poverty in St. Ann, Manchester and St. Elizabeth exceeded the national poverty prevalence in 2008 and 2012. The findings suggest the need for improved targeting of the PATH. In 2011, 44 programmes social safety net programmes were identified; 15 with high coverage; 13 with fair coverage; and 16 with low coverage” (Marques 2011, 20). Cost Effectiveness and Sustainability: Marques contends “more ‘bang for the bucks’ could be obtained” and that the “fragmentation and duplication of social protection programmes need to be eliminated as matter of urgency. The social security system in respect to the NIS is not sustainable without major reforms; and Jamaica‘s main social assistance programme, PATH, needs to gradually rely less on external financing” (Marques 2011, 24). Programme duplication and fragmentation presents a challenge in the delivery of social safety net programmes in a cost effective manner. In 2000 the Government of Jamaica sought to consolidate social safety net programmes however this was only partially accomplished and new programmes were created. Social insurance and social assistance programmes were spread across numerous ministries and entities with the same areas of action and target groups thus duplicating efforts and costs (Marques 2011, 20-21). Responsiveness and Emerging vulnerabilities: The social safety net has been responsive (increased coverage and benefits) during recent crises. Marques (2011, 24) however assesses that the social protection system “needs to be rationalized and further strengthened and adopt additional instruments (workfare, and home insurance and unemployment compensation) to be even more responsive and effective in future crises. It will need also to gradually evolve towards addressing household issues in a more holistic manner, to help poor families exit poverty permanently.” The social risk management approach which focuses on risk reduction in order to springboard the poor from persistent poverty is therefore critical. Further, urban poverty, crime and violence documented by Moser and Holland (1997) among others, present poverty policy imperatives which may be different from that of rural and peri-urban areas. The coordinated mobilization of programming resources at the community level through the Community
23
JADEP, NHF, NIS and GOJ Pension Scheme are not considered pro-poor (Marques 2011, 20, 165).

December 2016 Page 85 of 104
Renewal Programme (CRP), Jamaica Social Investment Fund (JSIF), Citizen Security and Justice Programme (CSJP) and others, is therefore critical to support the more holistic poverty programming at the household level. Institutional Challenges: The Marques study found that Jamaica has the resources and capacity to effectively implement social protection programmes evidenced in its best practice models, targeting and payment systems, technical and operational staff, well informed policies and partnerships between the PIOJ and researchers of the UWI. There are challenges however with the level of training of social workers who implement social protection programmes as their qualifications vary according to programme mandate and in general, there is a lack of trained staff with special skills. Monitoring and evaluation was also identified for improvement as existing information systems and monitoring and evaluation are inadequate. Coordination in the field has also proven to be a challenge because of the lack of clear definition of roles and overlap of programmes (Marques 2011, 23). The evaluation of NPEP also identified the need for appropriate institutional capacities and coordination in implementing social protection programmes. The impact evaluation conducted by SALESIS found that though the programmes contributed to ameliorating and even reducing poverty, NPEP faced many challenges such as weak ownership of the mechanisms for management and implementation of its processes; lack of integration and tension between NPEP and partners; complex administrative structures insufficiently sensitive to the culture of MDAs; unrealistic medium term targets to reduce by 50 per cent the proportion of persons in poverty in targeted communities in three years; lack of financial resources for proposed projects with partners; and low community involvement except with the JSIF. The report cautioned: “the experience of the PCMU has shown, that poverty reduction by moral suasion is unlikely to work in the face of ministerial and other vested interests. There is the need for a clear mandate, given under the national budget, for all relevant governmental agencies to pursue poverty reduction under agreed national objectives. By this it is meant that poverty reduction should become an integral part of national development policy across the board” (SALISES 2003, 11).
Legislative and Policy Environment- International, Regional and Local The National Poverty Reduction Policy and Programme is implemented within the overarching policy framework of Vision 2030 Jamaica National Development Plan, and other sectoral policies. The four year IMF programme 2013 and the Growth Inducement Strategy are important elements of the macro-economic framework in which the policy and programme will be implemented. Section 7 details the legislative and policy environment as well as linkages with other relevant policies and programmes.

PIOJ. March 5, 2015. Page 86 of 104
Appendix 3: Prevalence of Food Poverty by Region and Sex (1990-2012)
Year KMA Other Towns Rural Area Jamaica
Male Female Total Male Female Total Male Female Total Male Female Total
1990 2.0 2.1 2.0 7.2 7.2 7.2 16.6 16.6 16.6 11.0 10.7 10.9
1991 7.1 6.2 6.6 15.6 14.3 14.9 34.3 33.0 33.6 23.7 21.7 22.7
1992 4.5 4.6 4.6 7.7 7.4 7.6 18.6 18.1 18.3 13.1 12.3 12.7
1993 5.7 4.8 5.2 5.2 4.7 4.9 15.0 13.4 14.2 10.3 8.8 9.5
1994 4.3 3.8 4.1 4.0 4.9 4.4 12.0 11.0 11.5 8.2 7.5 7.8
1995 4.2 5.5 4.9 8.1 6.6 7.3 13.3 12.5 12.9 9.5 9.0 9.2
1996 3.3 2.2 2.8 7.9 7.9 7.9 12.7 11.5 12.1 8.8 7.8 8.3
1997 1.4 1.1 1.3 2.1 2.5 2.3 9.7 9.8 9.8 5.8 5.6 5.7
1998 2.4 1.9 2.1 4.5 5.0 4.8 6.7 6.4 6.6 5.3 5.1 5.2
1999 3.8 2.1 2.9 N/A N/A 0.1 7.6 8.0 7.8 5.2 4.6 4.9
2000 2.6 1.2 2.0 3.8 4.0 3.9 7.1 7.6 7.3 5.1 4.8 5.0
2001 0.7 0.9 0.8 3.7 3.0 3.4 8.5 7.8 8.2 5.3 4.6 4.9
2002 4.7 3.9 4.3 4.0 3.7 3.8 10.6 9.4 10.0 7.8 6.6 7.2
2003 2.0 1.6 1.8 5.4 3.9 4.6 8.9 7.6 8.3 6.8 5.3 6.0
2004 4.8 2.5 3.5 2.4 1.9 2.2 9.3 7.7 8.5 6.6 4.8 5.7
2005 2.8 1.9 2.3 1.2 1.4 1.3 7.4 6.4 6.9 4.8 4.0 4.3
2006 2.4 2.4 2.4 1.4 1.1 1.3 5.4 4.1 4.8 3.7 2.9 3.3
2007 1.7 1.8 1.7 1.5 0.8 1.1 5.2 3.7 4.5 3.3 2.4 2.9
2008 0.9 0.7 0.8 3.3 2.3 2.8 5.0 4.8 4.9 3.4 2.8 3.1
2009 2.8 2.8 2.8 1.5 1.6 1.5 8.3 7.8 8.1 5.0 4.7 4.9
2010 4.4 3.1 3.7 2.8 2.3 2.5 11.7 8.6 10.2 7.3 5.2 6.3
2012 8.5 5.9 7.1 4.3 4.9 4.6 9.0 8.9 8.9 7.9 7.1 7.5

PIOJ. March 5, 2015. Page 87 of 104
Appendix 4: Distribution of Poverty in Jamaica (1990-2012)
Year KMA OTHER TOWNS
RA JA
1990 12.8 15.8 71.4 100
1991 17.9 13 69.1 100
1992 14.6 15.8 69.6 100
1993 21.3 17.8 60.9 100
1994 17.3 17 65.7 100
1995 16.6 16.4 67 100
1996 19.5 16.3 64.2 100
1997 13.6 13.1 73.3 100
1998 12.5 15.1 72.5 100
1999 18.2 12.5 69.3 100
2000 17.2 16 66.8 100
2001 14.7 13.7 71.6 100
2002 15.8 15.7 68.5 100
2003 12.8 13.2 74 100
2004 26.3 9 64.7 100
2005 20.3 9.6 70.2 100
2006 21.2 13.1 65.7 100
2007 19.9 8.9 71.3 100
2008 18.9 19.7 61.4 100
2009 24.7 14.3 61 100
2010 27.6 15 57.4 100
2012 30.7 16.7 52.6 100
Source: Compiled by the PIOJ from data supplied by STATIN.

PIOJ. March 5, 2015. Page 88 of 104
Appendix 5: Poverty Gap Index (Poverty Depth) in Jamaica by Region (2001-2012)
1990 1991 1992 1993 1994 1995 1996 1997 1998 1999 2000 2001 2002 2003 2004 2005 2006 2007 2008 2009 2010 2012
Jamaica 7.9 14.7 9.6 7.3 6.0 7.3 9.4 4.7 3.6 4.3 4.4 7.2 11.0 10.9 4.4 3.7 3.2 2.5 2.9 3.9 4.5 5.8
KMA 2.3 6.8 4.8 4.8 3.8 4.1 6.9 1.8 1.9 2.9 2.1 2.6 5.3 4.7 3.6 2.2 2.2 1.7 1.6 3.1 3.9 6.0
Other Towns 6.6 11.5 7.6 5.5 4.8 6.5 5.1 2.6 3.4 2.5 4.2 5.0 8.9 7.6 2.3 1.8 1.5 1.0 2.8 1.5 1.8 4.6
Rural Areas 11.2 21.0 12.9 9.6 7.9 9.7 12.8 7.2 4.6 5.8 5.9 10.9 14.9 14.5 5.7 5.3 4.5 3.7 4.0 5.6 6.3 6.1
0.0
5.0
10.0
15.0
20.0
25.0
Po
vert
y G
ap In
de
x
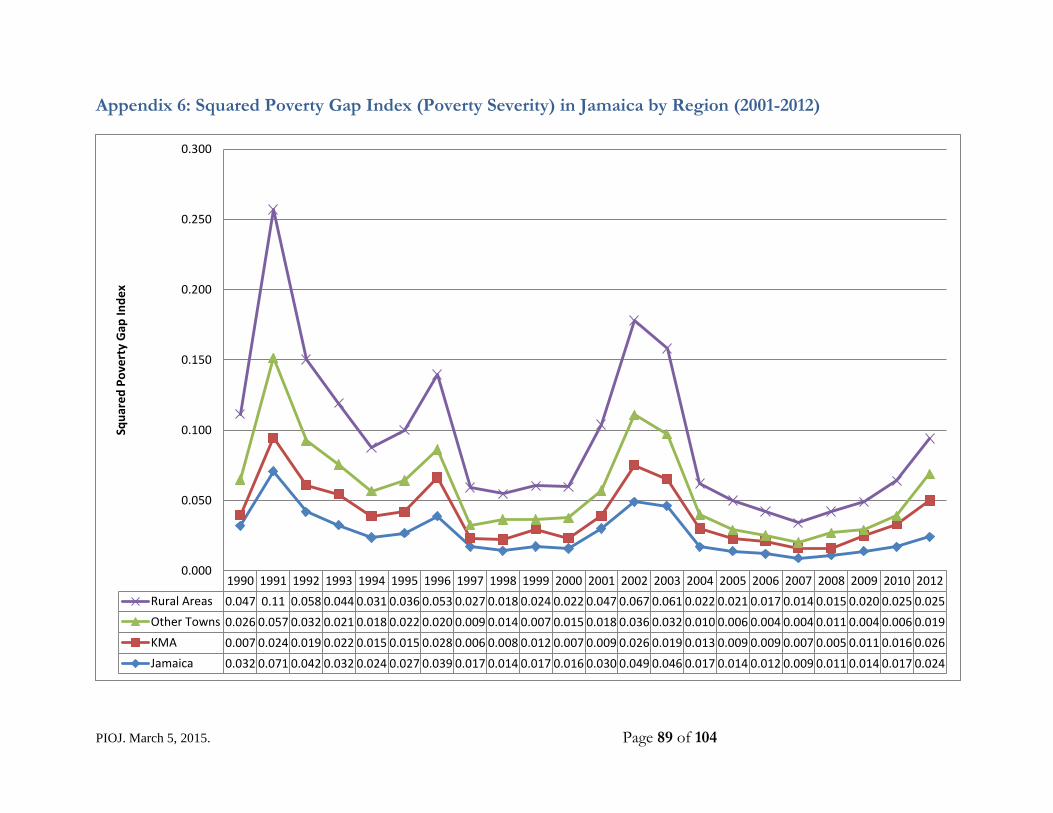
PIOJ. March 5, 2015. Page 89 of 104
Appendix 6: Squared Poverty Gap Index (Poverty Severity) in Jamaica by Region (2001-2012)
1990 1991 1992 1993 1994 1995 1996 1997 1998 1999 2000 2001 2002 2003 2004 2005 2006 2007 2008 2009 2010 2012
Rural Areas 0.047 0.11 0.058 0.044 0.031 0.036 0.053 0.027 0.018 0.024 0.022 0.047 0.067 0.061 0.022 0.021 0.017 0.014 0.015 0.020 0.025 0.025
Other Towns 0.026 0.057 0.032 0.021 0.018 0.022 0.020 0.009 0.014 0.007 0.015 0.018 0.036 0.032 0.010 0.006 0.004 0.004 0.011 0.004 0.006 0.019
KMA 0.007 0.024 0.019 0.022 0.015 0.015 0.028 0.006 0.008 0.012 0.007 0.009 0.026 0.019 0.013 0.009 0.009 0.007 0.005 0.011 0.016 0.026
Jamaica 0.032 0.071 0.042 0.032 0.024 0.027 0.039 0.017 0.014 0.017 0.016 0.030 0.049 0.046 0.017 0.014 0.012 0.009 0.011 0.014 0.017 0.024
0.000
0.050
0.100
0.150
0.200
0.250
0.300
Squ
are
d P
ove
rty
Gap
Ind
ex
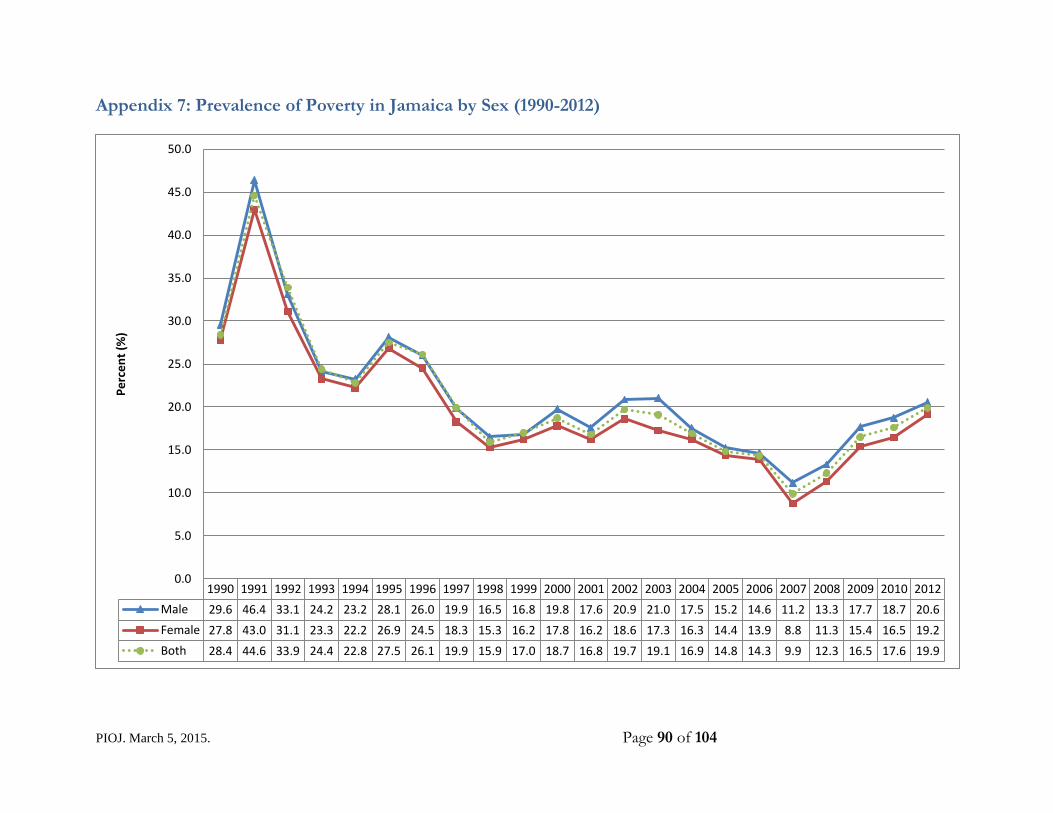
PIOJ. March 5, 2015. Page 90 of 104
Appendix 7: Prevalence of Poverty in Jamaica by Sex (1990-2012)
1990 1991 1992 1993 1994 1995 1996 1997 1998 1999 2000 2001 2002 2003 2004 2005 2006 2007 2008 2009 2010 2012
Male 29.6 46.4 33.1 24.2 23.2 28.1 26.0 19.9 16.5 16.8 19.8 17.6 20.9 21.0 17.5 15.2 14.6 11.2 13.3 17.7 18.7 20.6
Female 27.8 43.0 31.1 23.3 22.2 26.9 24.5 18.3 15.3 16.2 17.8 16.2 18.6 17.3 16.3 14.4 13.9 8.8 11.3 15.4 16.5 19.2
Both 28.4 44.6 33.9 24.4 22.8 27.5 26.1 19.9 15.9 17.0 18.7 16.8 19.7 19.1 16.9 14.8 14.3 9.9 12.3 16.5 17.6 19.9
0.0
5.0
10.0
15.0
20.0
25.0
30.0
35.0
40.0
45.0
50.0
Pe
rce
nt
(%)
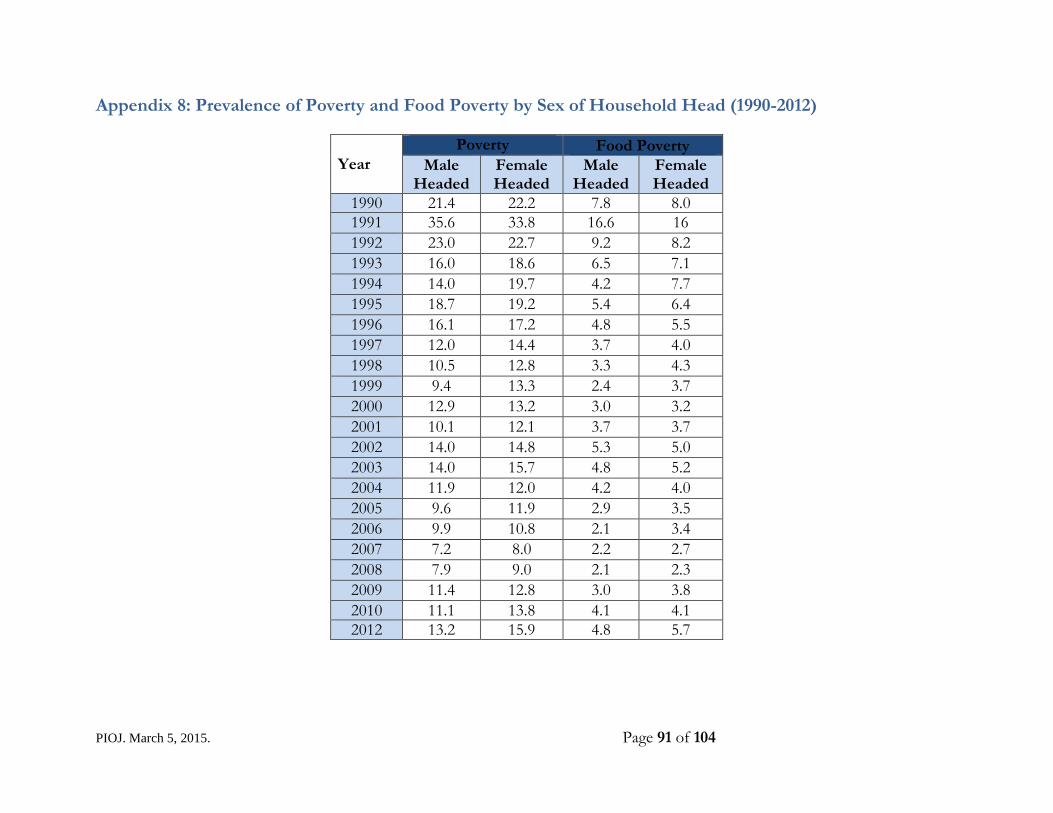
PIOJ. March 5, 2015. Page 91 of 104
Appendix 8: Prevalence of Poverty and Food Poverty by Sex of Household Head (1990-2012)
Year
Poverty Food Poverty
Male Headed
Female Headed
Male Headed
Female Headed
1990 21.4 22.2 7.8 8.0
1991 35.6 33.8 16.6 16
1992 23.0 22.7 9.2 8.2
1993 16.0 18.6 6.5 7.1
1994 14.0 19.7 4.2 7.7
1995 18.7 19.2 5.4 6.4
1996 16.1 17.2 4.8 5.5
1997 12.0 14.4 3.7 4.0
1998 10.5 12.8 3.3 4.3
1999 9.4 13.3 2.4 3.7
2000 12.9 13.2 3.0 3.2
2001 10.1 12.1 3.7 3.7
2002 14.0 14.8 5.3 5.0
2003 14.0 15.7 4.8 5.2
2004 11.9 12.0 4.2 4.0
2005 9.6 11.9 2.9 3.5
2006 9.9 10.8 2.1 3.4
2007 7.2 8.0 2.2 2.7
2008 7.9 9.0 2.1 2.3
2009 11.4 12.8 3.0 3.8
2010 11.1 13.8 4.1 4.1
2012 13.2 15.9 4.8 5.7

PIOJ. March 5, 2015. Page 92 of 104
Appendix 9: Prevalence of Poverty by Region and Sex (1990-2012)
Year KMA Other Towns Rural Area Jamaica
Male Female Male Female Male Female Male Female
1990 13.0 13.5 26.1 25.3 38.7 36.3 29.6 27.8
1991 30.7 27.3 31.9 31.0 58.5 55.9 46.4 43.0
1992 18.5 17.2 28.9 26.4 40.9 40.2 33.1 31.1
1993 16.7 16.4 22.5 22.4 29.3 28.5 24.2 23.3
1994 16.4 12.8 20.1 21.3 28.6 28.8 23.2 22.2
1995 14.9 15.6 24.4 23.3 37.8 36.4 28.1 26.9
1996 16.8 13.9 23.2 20.6 33.1 33.3 26.0 24.5
1997 9.9 7.9 14.2 13.5 27.5 27.0 19.9 18.3
1998 9.5 7.8 13.6 13.2 19.9 19.1 16.5 15.3
1999 12.3 8.3 11.4 13.4 21.3 22.4 16.8 16.2
2000 11.2 8.8 17.0 16.7 26.0 24.5 19.8 17.8
2001 8.4 6.9 14.4 12.5 24.1 24.1 17.6 16.2
2002 11.1 9.8 19.6 17.9 26.0 24.2 20.9 18.6
2003 11.7 7.7 16.8 14.9 25.7 22.8 21.0 17.3
2004 14.9 13.8 9.0 6.6 22.3 21.9 17.5 16.3
2005 10.7 8.8 7.8 6.6 20.8 21.4 15.2 14.4
2006 9.3 9.5 9.4 9.1 20.2 19.4 14.6 13.9
2007 6.5 5.9 5.3 2.8 16.9 13.7 11.2 8.8
2008 7.6 6.5 12.1 9.5 17.9 16.1 13.3 11.3
2009 13.9 11.7 10.0 10.3 24.1 20.8 17.7 15.4
2010 16.5 12.4 11.9 11.3 23.7 22.6 18.7 16.5
2012 21.0 18.7 17.3 15.9 21.6 20.9 20.6 19.2

PIOJ. March 5, 2015. Page 93 of 104
Appendix10: Prevalence of Poverty in Jamaica by Age Group (1990-2012)
1990 1991 1992 1993 1994 1995 1996 1997 1998 1999 2000 2001 2002 2003 2004 2005 2006 2007 2008 2009 2010 2012
Age (0-17) 32.5 49.0 37.0 28.6 27.2 33.7 30.8 24.0 18.6 20.7 23.0 21.8 23.4 22.1 20.6 17.4 17.4 12.0 15.3 20.4 21.9 25.0
Age (18-64) 25.0 41.3 28.2 19.3 19.0 23.1 21.5 15.2 13.5 13.0 16.0 13.9 17.0 16.9 14.4 12.8 12.4 8.4 10.6 13.6 14.8 17.8
Age (>=65) 30.6 43.3 31.9 25.7 23.6 22.9 20.5 18.9 17.9 18.6 16.6 13.3 19.8 19.3 15.3 15.5 12.1 10.8 10.3 18.7 16.8 14.5
All Ages 28.4 44.6 33.9 24.4 22.8 27.5 26.1 19.9 15.9 17.0 18.7 16.8 19.7 19.1 16.9 14.8 14.3 9.9 12.3 16.5 17.6 19.9
0.0
10.0
20.0
30.0
40.0
50.0
60.0
Pe
rce
nt
(%)
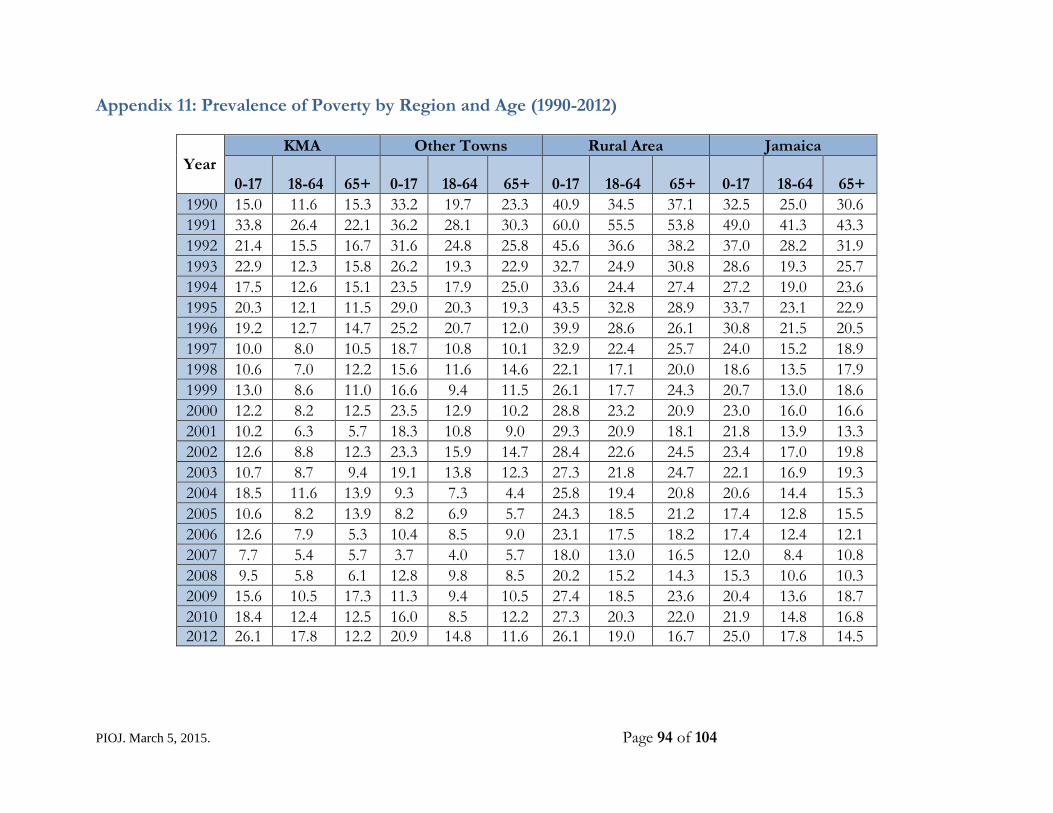
PIOJ. March 5, 2015. Page 94 of 104
Appendix 11: Prevalence of Poverty by Region and Age (1990-2012)
Year KMA Other Towns Rural Area Jamaica
0-17 18-64
65+ 0-17 18-64 65+ 0-17 18-64 65+ 0-17 18-64 65+
1990 15.0 11.6 15.3 33.2 19.7 23.3 40.9 34.5 37.1 32.5 25.0 30.6
1991 33.8 26.4 22.1 36.2 28.1 30.3 60.0 55.5 53.8 49.0 41.3 43.3
1992 21.4 15.5 16.7 31.6 24.8 25.8 45.6 36.6 38.2 37.0 28.2 31.9
1993 22.9 12.3 15.8 26.2 19.3 22.9 32.7 24.9 30.8 28.6 19.3 25.7
1994 17.5 12.6 15.1 23.5 17.9 25.0 33.6 24.4 27.4 27.2 19.0 23.6
1995 20.3 12.1 11.5 29.0 20.3 19.3 43.5 32.8 28.9 33.7 23.1 22.9
1996 19.2 12.7 14.7 25.2 20.7 12.0 39.9 28.6 26.1 30.8 21.5 20.5
1997 10.0 8.0 10.5 18.7 10.8 10.1 32.9 22.4 25.7 24.0 15.2 18.9
1998 10.6 7.0 12.2 15.6 11.6 14.6 22.1 17.1 20.0 18.6 13.5 17.9
1999 13.0 8.6 11.0 16.6 9.4 11.5 26.1 17.7 24.3 20.7 13.0 18.6
2000 12.2 8.2 12.5 23.5 12.9 10.2 28.8 23.2 20.9 23.0 16.0 16.6
2001 10.2 6.3 5.7 18.3 10.8 9.0 29.3 20.9 18.1 21.8 13.9 13.3
2002 12.6 8.8 12.3 23.3 15.9 14.7 28.4 22.6 24.5 23.4 17.0 19.8
2003 10.7 8.7 9.4 19.1 13.8 12.3 27.3 21.8 24.7 22.1 16.9 19.3
2004 18.5 11.6 13.9 9.3 7.3 4.4 25.8 19.4 20.8 20.6 14.4 15.3
2005 10.6 8.2 13.9 8.2 6.9 5.7 24.3 18.5 21.2 17.4 12.8 15.5
2006 12.6 7.9 5.3 10.4 8.5 9.0 23.1 17.5 18.2 17.4 12.4 12.1
2007 7.7 5.4 5.7 3.7 4.0 5.7 18.0 13.0 16.5 12.0 8.4 10.8
2008 9.5 5.8 6.1 12.8 9.8 8.5 20.2 15.2 14.3 15.3 10.6 10.3
2009 15.6 10.5 17.3 11.3 9.4 10.5 27.4 18.5 23.6 20.4 13.6 18.7
2010 18.4 12.4 12.5 16.0 8.5 12.2 27.3 20.3 22.0 21.9 14.8 16.8
2012 26.1 17.8 12.2 20.9 14.8 11.6 26.1 19.0 16.7 25.0 17.8 14.5

Page 95 of 104
Appendix 12: Prevalence of Food Poverty by Region and Age (1990-2012)
Year KMA Other Towns Rural Area Jamaica
Age (0-17)
Age (18-64)
Age (65+)
All Ages
Age (0-17)
Age (18-64)
Age (65+)
All Ages
Age (0-17)
Age (18-64)
Age (65+)
All Ages
Age (0-17)
Age (18-64)
Age (65+)
All Ages
1990 2.2 1.8 1.8 2.0 9.8 4.2 11.7 7.2 18.4 15.3 14.7 16.6 12.5 9.3 11.8 10.9
1991 7.6 6.0 5.7 6.6 17.5 12.9 15.6 14.9 36.4 31.7 30.7 33.6 25.7 20.2 23.1 22.7
1992 5.6 3.8 4.8 4.6 8.2 6.6 10.3 7.6 21.2 15.9 18.3 18.3 14.9 10.7 14.3 12.7
1993 6.8 4.0 6.2 5.2 6.6 3.6 4.4 4.9 16.2 12.3 14.2 14.2 11.6 7.6 10.7 9.5
1994 6.1 2.6 5.7 4.1 5.4 3.3 7.1 4.4 14.4 8.5 13.2 11.5 10.4 5.4 10.2 7.8
1995 7.9 3.0 2.2 4.9 8.7 6.7 4.3 7.3 15.9 10.8 9.9 12.9 12.1 7.2 7.0 9.2
1996 3.5 2.3 2.1 2.8 9.8 7.2 2.6 7.9 14.3 10.2 12.2 12.1 10.1 6.9 7.8 8.3
1997 1.2 0.9 4.4 1.3 3.6 1.4 2.0 2.3 12.8 7.1 9.3 9.8 8.0 3.9 6.7 5.7
1998 2.2 1.9 3.7 2.1 5.6 4.2 4.3 4.8 7.6 5.6 6.9 6.6 6.1 4.4 6.0 5.2
1999 3.8 2.3 3.8 2.9 N/ A N/ A N/ A 0.1 9.8 6.3 6.4 7.8 6.4 3.8 4.8 4.9
2000 1.9 1.7 3.5 2.0 5.3 3.1 2.7 3.9 9.0 5.8 7.9 7.3 6.3 3.8 5.7 5.0
2001 0.9 0.7 1.6 0.8 4.4 2.8 2.7 3.4 10.5 6.3 7.6 8.2 6.6 3.6 5.2 4.9
2002 5.2 3.5 6.0 4.3 4.8 3.1 4.0 3.8 11.6 8.7 10.3 10.0 8.7 6.0 8.2 7.2
2003 1.3 1.9 2.7 1.8 5.8 3.7 4.6 4.6 8.7 7.6 10.3 8.3 6.5 5.4 7.7 6.0
2004 3.7 3.0 5.9 3.5 2.9 2.0 0.7 2.2 10.1 7.1 8.7 8.5 6.9 4.7 6.2 5.7
2005 1.6 2.1 5.6 2.3 1.2 1.5 0.6 1.3 8.2 5.7 7.4 6.9 5.0 3.7 5.3 4.3
2006 3.2 1.7 2.9 2.4 1.1 1.2 2.1 1.3 5.4 3.7 7.4 4.8 3.9 2.5 4.8 3.3
2007 2.5 1.2 2.5 1.7 1.3 1.1 0.6 1.1 5.0 3.8 5.8 4.5 3.5 2.3 3.7 2.9
2008 1.0 0.5 1.8 0.8 3.3 2.5 2.7 2.8 5.7 4.5 4.5 4.9 3.8 2.6 3.2 3.1
2009 2.5 2.1 8.5 2.8 1.7 1.3 2.0 1.5 11.1 5.9 7.5 8.1 6.6 3.5 6.6 4.9
2010 4.5 3.4 3.0 3.7 3.8 2.0 0.6 2.5 12.7 8.7 8.1 10.2 8.1 5.3 4.8 6.3
2012 8.3 6.9 5.1 7.1 6.3 3.7 3.7 4.6 10.9 8.0 7.6 8.9 9.2 6.8 6.1 7.5

Page 96 of 104
PRCU
Vision 2030 –
aligned poverty
programme and
policy
Medium Term
Framework (3
years) developed
Monitor
implementation of
structured
programmes.
Priority areas for
IDP, MDAs,
Private Sector &
NGO
interventions
Vision 2030
Poverty
Framework
Poverty
Estimates &
related
research
Existing
programme
initiatives
International
Best Practices
approaches
Economic &
Social
Development
theories
Consultations:
MDAs, Non-
Government
stakeholders and
Civil Society
Poverty
programme
addresses public &
private poverty
Appendix 13: Key Workflow Considerations of the Poverty Reduction Coordinating Unit
Source: Poverty Reduction Coordinating Unit (2014)
Reduction in
poverty
prevalence &
public
poverty

PIOJ. March 5, 2015. Page 97 of 104
Appendix 14: International and Regional Best Practices The National Poverty Reduction Programme is informed by international and regional best practice in programming and approaches. Through study tours and other knowledge-gathering activities, there have been several lessons learnt that are relevant to what Jamaica is embarking on. Approaches to poverty reduction and programming have been adopted from several countries including Brazil, Chile, Peru, Canada, United States of America, Ecuador, the Republic of South Korea, and Singapore. In general, there have been insights on, inter alia:
e. challenges related to policy and programme coherence; f. changes in thinking, approaches, and practice; g. how specific programmes (including Cash Transfer Programmes) can empower
individuals and households; h. institutional arrangements for poverty reduction;
The following are among the key lessons learnt:
1. Legislation is needed to support and protect poverty reduction and social protection base rights guaranteed to citizens. Major policies and programmes should be enshrined in law, which makes them legal and binding. This ensures a high level of continuity and sustainability in the implementation of these programmes. The passing of these laws should be done in a timely manner.
2. Robust data and information systems to guide policy and programmes are critical; in this regard, unique identification numbers have greatly facilitated accountability and monitoring. The interconnectedness of the information system was based on: inter-ministerial collaboration, heavily driven by strong leadership directives; understanding the dynamics of each Ministry in an effort to avoid duplication and maximize the use of resources; and for the standardization of data across Ministries. Strong focus should be placed on the use of data and information to inform programme development, programme focus, and allocation of resources. A comprehensive and functional database is a useful component of successful and responsive programming. Timely and effective use of data and information systems are also essential to informing the development, monitoring and evaluation of programmes.
3. Results-based management and performance budgeting enhance responsive public policy. The use of monitoring and evaluation reports to inform budget allocation to programmes has been noted.
4. Networking and integration are critical for the best use of resources in the system, and for complimentary joined-up government. ‘Joined-up Government’ approaches are essential in effecting poverty reduction and broader social policy outcomes. Areas for integration include political, economic, social, institutional, environmental and infrastructural. Investments should be made to strengthen inter-sectoral and inter-ministerial collaboration.
5. Clear institutional frameworks that anchor the roles of Government (various levels), non-state and private sector are necessary.
6. Committed political will and resources is critical to sustaining any initiative. 7. Flexibility to adjust and improve programmes in response to emerging dynamics, shocks,
and persistent challenges is important for programme success.

Page 98 of 104
8. Programme budget support must be adequate at the different points of implementation; otherwise the overall outcome is likely to be compromised.
9. Extreme poverty requires distinct measures that are geared towards objectives including alleviation of immediate needs, and linking of individuals and families to services most needed by them.
10. The importance of macroeconomic growth as the context for sustaining poverty reduction efforts is underscored. In particular, employment becomes critical in securing incomes for an adequate standard of living. An example cited in the Peru interaction was that of ‘productive elasticity’, where a 1 per cent growth in GDP was responsible for a 0.4 per cent reduction in poverty. It has been argued that both economic growth and effective social programmes were equally responsible for poverty reduction. It is therefore evident that all sectoral policies are critical to strong and sustainable achievements.
11. While countries recognize the need for poverty alleviation programmes, the goal is to limit the continuing scope of these programmes to the poorest, while empowering labour participation and improved incomes for the majority.
12. Significant focus should be placed on building the resilience of families, including building their capacity for income generation and linking them to employment.
13. Psycho-social support to families and individuals (including parents, children and persons with disabilities) is an integral element in the treatment of poverty. Individual responsibility and positive approaches are emphasised, as despair has been described as a “learnt behaviour”.
14. The State taking a more proactive role in reaching the poorest and most vulnerable families and individuals is important for increasing success. It is important to implement special measures for reaching excluded groups, for example, through geographic targeting. In recent years, Peru has been placing increasing emphasis on reaching the poor and vulnerable families, particularly socially excluded groups in some geographical regions. This is evident in the areas of healthcare, nutrition for infants and young children.
15. Focus on early stimulation and nutrition is important for addressing long-term effects. 16. Clear articulation of roles/functions, responsibilities and accountability systems for
central, regional and/or municipal governance structures 17. The ability of established national coordinating mechanisms to leverage state resources in
keeping with the defined social protection and poverty reduction programme imperatives determines the extent to which success is possible
18. Linkages between various initiatives serve to strengthen the programmes, provide for and increase the likelihood of achieving outcomes.
19. A human capital development approach to poverty reduction is critical. Poverty can be seen as a loss of capacity, whether economic, social or political.
20. Building the assets of poor families and communities takes the concerted effort of individuals, state and non-state actors. One of the fundamental concerns is that of assisting in identifying those assets, some of which are physical, and others of which are innate strengths and capacities. Poverty reduction strategies have therefore to pay specific attention to human capital empowerment, and to equity of information, opportunities and services.
21. Prevention is an important factor in breaking the intergenerational cycle of poverty.

Page 99 of 104
22. The poor should be empowered to participate in political and other decisions related to their future.
23. Services should not necessarily be targeted to the poor as the primary means of combating poverty. There should be a general improvement in services, with greater access created for the poor.
24. Effective multi-sectoral collaboration is critical. A clearly defined role for each group of stakeholders and a facilitated mechanism for collaboration and reporting are required. There are also critical roles for public-private sector partnerships in mobilizing resources, creating effective delivery systems, and expanding the reach of public policy interventions through collaboration. As in the case of Singapore, “many helping hands” are required.
25. A gender-responsive approach to programming and interventions is important. Empowerment and productive inclusion of women in households is important for addressing poverty.
26. Youth inclusion and development is critical. Youth entrepreneurship, particularly in rural areas, is encouraged.
27. Interventions should be guided by urban and rural dynamics. Rural development is central to addressing poverty. Rural development may be achieved through the provision of loans for entrepreneurship in the rural areas, which would stem the tide of the rural-urban drift. These loans would be targeting poor vulnerable groups who live in the rural areas, and could be offered at low interest rates and longer repayment periods. Support should be given to farmers to increase production through guidance and technical assistance, inputs, water supply, and access to markets and financing. Some of the main objectives therefore are to ensure access to food, strengthen family agriculture, increase income generation, production and sustainability of rural income from farming.
28. Development and promotion of initiatives that encourage the adoption of alternative and/ or sustainable livelihoods is important. Particularly in rural communities located within or near sensitive environmental areas so as to foster sustainable management of natural resources while supporting income generation and growth.
29. Local level institutions and governance structures have an important role to play. 30. Poverty reduction programmes and interventions are one of the factors that contribute
to economic development and social improvement. The economic value of effective poverty reduction for Jamaica should be determined and promoted.
31. Food security is an important element for poverty reduction programmes. 32. Focus on children and youth is important for breaking the cycle of poverty. It is
important to include in school curricula the issue of children and youth becoming more aware of their responsibility towards their own social security, even ahead of them becoming part of the labour market. This is an important element of public awareness and education, and should not be underestimated as a viable intervention for breaking the cycle of poverty.
33. Mainstreaming and addressing the needs of persons with disabilities and other vulnerable groups are important.

Page 100 of 104
GLOSSARY OF TERMS
TERM DEFINITION
Gini Coefficient Poor
The Gini Coefficient is a measure of inequality and ranges from 0 (represents perfect equality) to 1 (represents perfect inequality). Persons consuming below the poverty line (JSLC, 2012)
Poverty Line
Jamaica uses an absolute measure of poverty represented by a poverty line. The poverty line indicates the minimum level of consumption needed to maintain the lowest acceptable standard of living. Persons whose consumption is at or below the poverty line are considered poor (PIOJ).
Social Protection Social Protection is the set of provisions that employ public
and private initiatives, guided by state policies, to prevent, address, and reduce the risks of poverty and vulnerability brought about by lack of, losses or interruptions to income. Its objective is to ensure living standards above specified levels, through effective social, economic and labour market policies that support income security across the life span (Jamaica Social Protection strategy, 2014).
Working Poor Individuals engaged in either paid employment or self-employment that belongs to households with an adult equivalent per capita household expenditure (or income) that falls below a specified poverty line.

Page 101 of 104
REFERENCES Arcadis BMB. 2005. “Feasibility Study for A Continuation Poverty Reduction – Poverty
Reduction Programme in the Non-State Actor Sector in Jamaica.” Unpublished (Prepared for the European Union).
Bachelet, Michelle. Social Protection Floor: for a Fair and Inclusive Globalization. Report of the
Advisory Group. International Labour Organization, 2011. Beckford, G. 1972. Persistent Poverty: Underdevelopment in Plantation Economies of the
Third World. London: Oxford University Press. Benfield, W. 2010. Poverty and Perception in Jamaica: A Comparative Analysis of Jamaican
Households. Kingston: UWI Press. Blake Lobban, S. and Mclean, A. 2009. “Assessment of Community and Security and
Transformation Programmes in Jamaica.” Unpublished (Prepared for the PIOJ). Carvalho, S and White, H. 1997. Combining the Quantitative and Qualitative Approaches to
Poverty Measurement and Analysis. Washington: World Bank. Christie, T. 2013. “Pension Coverage in Jamaica, Final Report.” Unpublished. (Prepared for the
Ministry of Labour and Social Security). Deepa Narayan, 1999. “Bonds and Bridges: Social Capital and Poverty”. The World Bank.
FAO (2013) Environment and Natural Resource management Series #21. “Climate Change and
Agriculture in Jamaica: Agriculture Sector Support Analysis”, FAO.
Gayle-Geddes, A., Gillings, S., and Chen, K. 2012. “Beyond Developmental Rhetoric:
Unearthing Best Practices for Sustainable Social Investment in Inner City Communities in Jamaica.” Paper presented at the UWI 50/50 Conference, Kingston. Jamaica. August 20-24, 2012.
Gibbison, G. 2013. Targeting Assessment of the Programme of Advancement through Health
and Education. Unpublished (Prepared for the Ministry of Labour and Social Security). Government of Jamaica. 1995. National Poverty Eradication Programme: A Community Based
Partnership Approach. Kingston: National Poverty Eradication Programme. ———.2015. 2030 Agenda on Sustainable Development: Government of Jamaica National
Outcome Document (unpublished).

Page 102 of 104
Handa, S. 2010. Moving on Up? The Dynamics of Poverty in Jamaica. In “Framing Social Development Policy Through Research. Papers presented at the 20th Anniversary Conference of the Jamaica Survey of Living Conditions. Kingston, Jamaica: Planning Institute of Jamaica.
Henry-Lee, Aldrie. 2001. “The Dynamics of Poverty in Jamaica, 1989-1999”. Social and
Economic Studies, 50, No. 1 (March 2001): 199-228. Holland, J and Moser, C. 1997. Urban Poverty and Violence in Jamaica. Washington: World
Bank. International Labour Organization, Statistical Institute of Jamaica and Planning Institute of
Jamaica. 2013. Labour Market Transition of Young Women and Men in Jamaica: Summary Report 2013. Kingston: ILO/PIOJ/STATIN
Jamaica Social Protection Project, Study Tour to Ontario, Canada July 13-17, 2009. “Study Tour Implementation Report.” Unpublished Marques, Jose. “Diagnostic Study: Review of the Social Safety Net Provisions and Capacity”.
Prepared for the Planning Institute of Jamaica, 2011 (unpublished). Mathematica. 2007. Evaluation of Jamaica’s PATH Programme. Kingston: Ministry of Labour
and Social Security. Ministry of Labour and Social Security, 2015. Social Protection Progress Report, April-July
2015(unpublished) Ministry of Water and Housing (2007). Rapid Assessment of Squatting Report, MWH.
Moncrieffe, J. 2013. “Impact Assessment of the Grants to Non-State Actors (NSAS) and Grants of Low Amount (GOLAS) in Jamaica.” Unpublished (Prepared for the JSIF).
Planning Institute of Jamaica. 2014. Conceptual Framework: Poverty Reduction Coordination in Jamaica.
Kingston, Jamaica: Planning Institute of Jamaica. ———.2013.A review of Current and Emerging Vulnerability in Jamaica in the Context of Risks to Income,
Poverty and Food Security. Kingston, Jamaica: Planning Institute of Jamaica ———.2014. Jamaica Social Protection Strategy. Kingston, Jamaica: Planning Institute of Jamaica. ———. 2010. Medium Term Socio-Economic Policy Framework 2012-2015. Kingston: PIOJ ———. 2011. A Growth Inducement Strategy for Jamaica in the Short and Medium Term.
Kingston: PIOJ ———. Economic and Social Survey Jamaica. Various Editions. Kingston: PIOJ.

Page 103 of 104
———. Jamaica Survey of Living Conditions. Kingston: PIOJ. Various Editions.
———. Social Protection and Poverty Reduction Study Tour Report, Chile and Peru, October 5-16, 2014 Unpublished. ———. “Building the Assets of the Poor” Brazil Study Tour. Component 4, GoJ/World Bank Social Protection Project Report September 12-16, 2011. Unpublished
———. Vision 2030 Jamaica – National Development Plan. Kingston: PIOJ, 2009.
———. Vision 2030 Jamaica - Social Welfare and Vulnerable Groups Sector Plan, 2009c (unpublished).
———. Vision 2030 Jamaica – Poverty Reduction Strategic Plan, 2009d (unpublished).
———. Vision 2030 Jamaica – Social Security Sector Plan, 2009e (unpublished).
———. Vision 2030 Jamaica – Persons with Disabilities Sector Plan, 2009f (unpublished). Ricketts, Heather and Patricia Anderson, 2009. Parenting in Jamaica, Kingston; PIOJ Sir Arthur Lewis Institute of Social and Economic Studies. 2003. Report on the Evaluation of the National Poverty Eradication Programme (NPEP) in Jamaica. Unpublished. Statistical Institute of Jamaica. 2012. Demographic Statistics. Kingston: STATIN Statistical Institute of Jamaica. 2011. Jamaica Multiple Indicator Cluster Survey, 2011, Kingston, STATIN. Thomas, C. Y. 1988. The Poor and the Powerless: Economic Policy and Change in the Caribbean. London: Latin America Bureau. United Nations. 2013. The Millennium Development Goals Report 2013. New York: UN. ———. 2013. A New Global Partnership: Eradicate Poverty and Transform Economies through Sustainable Development. New York: UNDP. United Nations Development Programme. 2013. Humanity Divided: Confronting Inequality in Developing Countries. New York: UNDP. United Nations Development Programme et al. 1998. Implementing the 20/20 Initiative Achieving Universal Access to Basic Social Services. New York: UNICEF.

Page 104 of 104
Witter, M, et al. 2009. “Child Poverty and Disparities in Jamaica.” Unpublished (PIOJ). World Bank Group 2015. World Development Report. “Mind Society and Behaviour.”