Embed Size (px)
Citation preview
NATIONAL MINIMUM WAGE AND NATIONAL LIVING WAGE IMPACT ASSESSMENT Counterfactual research
A report by the National Institute of Economic and Social Research
February 2018

Acknowledgements The Department for Business, Energy and Industrial Strategy (BEIS) would like to thank the National Institute of Economic and Social Research (NIESR) for carrying out this research project and producing this report. In particular, the project team consisting of Dr Monique Ebell, Dr Stefan Speckesser, Dr Heather Rolfe, Dr Matthew Bursnall and Andreina Naddeo.
BEIS and NIESR would also like to express thanks to the ten businesses, the labour market academics and regulatory policy experts who were interviewed by NIESR for this research report.
2

Contents Acknowledgements _________________________________________________________ 2
Executive summary _________________________________________________________ 5
Aims and objectives of counterfactual wage research _____________________________ 5
Findings and update of current practice ________________________________________ 5
Key issues and recommendations ____________________________________________ 7
Detailed findings from different strands of our research ____________________________ 8
Concluding set of recommendations__________________________________________ 11
1. Introduction ____________________________________________________________ 13
1.1 UK minimum wages and impact assessments _______________________________ 13
1.2 The role of counterfactuals in impact assessments ___________________________ 14
1.3 Purpose and structure of the report _______________________________________ 15
2. Review of the literature____________________________________________________ 16
2.1 Low paying sectors and their employees ___________________________________ 16
2.2 Determinants of wage growth for low paid workers ___________________________ 19
2.3 Impact of the minimum wage on the earnings distribution and inequality ___________ 23
2.4 Wage trends before and after the introduction of the minimum wage ______________ 26
2.5 Summary of findings ___________________________________________________ 27
3. Qualitative evidence ______________________________________________________ 28
3.1 Introduction __________________________________________________________ 28
3.2 Use of the NMW and NLW ______________________________________________ 29
3.3 Factors relevant to pay determination ______________________________________ 31
3.4 Impact of the NMW/NLW on pay levels and structures _________________________ 34
3.5 Impact of the NMW/NLW on investment and non-pay areas of expenditure ________ 38
3.6 The counterfactual: setting wages in the absence of NMW/NLW _________________ 39
3.7 Pressures on pay in absence of NMW & NLW _______________________________ 41
3.8 Conclusions from the qualitative research with employers and stakeholders ________ 42
4. Review of the current model ________________________________________________ 44
4.1 The current approach to modelling counterfactual wage growth _________________ 44
4.2 Assessment by academics and further suggestions from interviewing experts ______ 47
4.3 Re-setting the counterfactual for each uprating ______________________________ 50
4.4 Recommendations for counterfactual wages ________________________________ 55
3
5. Estimating the counterfactual _______________________________________________ 56
5.1 Introduction __________________________________________________________ 56
5.2 Approach 1: Estimate the impact of the change in the bite of the NMW along the wage distribution _________________________________________________________ 57
5.3 Approach 2: Growth of counterfactual using observed wage growth ______________ 64
6. Applying the estimated Counterfactual ________________________________________ 73
Synopsis of Key issues/ recommendations in light of the evidence __________________ 75
References _______________________________________________________________ 76
Appendix tables ___________________________________________________________ 79
Full models estimating the impact of the change in the bite of the NMW on real hourly earnings growth along the wage distribution (Approach 1) _________________________ 79
Description of Labour Force Survey pseudo panel data (Approach 2) ________________ 89
Deriving the Estimated Counterfactuals (Approach 1) ____________________________ 96
4

National Minimum Wage and National Living Wage impact assessment: counterfactual research
Executive summary
Aims and objectives of counterfactual wage research
Over the summer, the National Institute of Economic and Social Research (NIESR) conducted an independent review of the methodology used by the Department for Business, Energy and Industrial Strategy (BEIS) for estimating the cost to business of upratings to the National Minimum Wage (NMW) and National Living Wage (NLW) rates, focusing on the counterfactual underpinning the costs estimate.
We then provide recommendations for how best to the estimate counterfactual and apply this in the BEIS Impact Assessment (IA) model. The counterfactual is what would have occurred in the absence of the intervention and so comparing the profile of the counterfactual wage with the increase in the minimum wage allows one to estimate the impact of the intervention. The profile of the counterfactual is both a function of the wage level low paid workers would receive in the absence of the policy and the wage growth they would have experienced over the course of the minimum wage uprating. The project sought to uncover both an estimate of the counterfactual based on a parametric regression model and to deliver empirical estimates of the growth of the counterfactual.
This research project comprised five stages:
• A review of the literature relevant to estimating counterfactual wages;
• Interviews with low-wage employers, employer representatives and trade unions on the role of the minimum wage in wage-setting;
• A review of the existing BEIS methodology to estimate counterfactual wages and estimate the increased costs to business of the NMW/NLW uprating; and further consultations with academics and regulatory policy experts on how to improve upon these methods;
• A quantitative analysis aimed at developing new methods for estimating counterfactual wage growth;
• Updating the BEIS model by taking the results of our recommended approach for estimating the counterfactual wage and revising the BEIS impact assessment model accordingly.
Findings and update of current practice
The first three stages – the literature review; interviews with low-wage employers, trade body representatives and trade unions; and the review of the existing method – were used to inform an alternative empirical strategy for estimating counterfactual wages, which had originally aimed to deliver both an estimate of the counterfactual wage distribution and the empirical growth rates of wages in low pay jobs. However, the empirical implementation of the models suggested that existing data sources were only sufficiently informative to devise an empirical growth rate of wages in low pay employment, but not to obtain a credible estimate of all aspects of the counterfactual wage distribution, which the Regulatory Policy Committee (RPC) have previously referred to as the ‘shadow wage curve’ (see below for more detail).
5

National Minimum Wage and National Living Wage impact assessment: counterfactual research
The empirical infeasibility of uncovering the counterfactual wage back to the 2000s, even with an exhaustive specification, is an important finding. Nonetheless, the empirical investigation of the counterfactual added value to the current practice used by BEIS, by offering a model-based approach of identifying the average wage growth in low pay employment in the absence of NMW/NLW uprating. We use the evidence obtained from the model to rerun the BEIS impact assessment model, and derive updated cost estimates for last year’s impact assessment for the April 2017 minimum wage upratings, which we contextualise with existing estimates.
6

National Minimum Wage and National Living Wage impact assessment: counterfactual research
Key issues and recommendations
Stage of the IA Issue Pros and Cons Recommendation
Estimating counterfactual
Use growth in the median wage or growth in highest percentile not affected by spillovers of the minimum wage.
Highest percentile unaffected more reliable as growth rates of median pay considerably above segment affected by the NMW/NLW upratings.
Econometric estimates required to identify point in wage distribution to represent counterfactual growth; over time, impact of NMW/NLW bite will change; updates required.
Estimates of the econometric model to be obtained annually to understand impact of upratings on distribution.
Choice of different segment of wage distribution if needed.
Estimating counterfactual
Time period used for empirical estimate of wage growth.
Choice of period accounts for business cycle wage growth differences, which significantly change NMW/NLW impact.
Requires judgement of the state of the business cycle based on a variety of sources.
Review of available forecasts (Bank, OBR, IMF, OECD, NIESR) to adapt IA to business cycle outlook (use empirically observed growth for most recent period corresponding to medium term outlook).
Applying the counter-factual model
Whether to reset the counterfactual at each uprating or use a previous counterfactual.
Long-term impact of the upratings would be incorporated in the IA
No data available to update forecast for past upratings based on actual outcomes (accuracy declines).
Minimum wage upratings changes composition of jobs; i.e. longer term impacts would need to incorporate substitution between skill levels and/or technology.
IA should continue to focus on individual uprating.
Applying the counter-factual model
Use separate counterfactuals for different parts of the low wage distribution or for different groups (youth, apprenticeships, etc.).
Potentially increases accuracy of the IA predictions in monetary terms.
Fewer data points available for empirical estimates; reduced model accuracy; higher complexity of IA with likely little gain in accuracy (costs: 95% NLW uprating).
Assumptions unlikely to hold: Composition of low paid employment would remain unchanged; suggests that counterfactual growth would differ by socioeconomic groups.
Suggest using one empirical model and applying counterfactual wage growth across groups.
7
National Minimum Wage and National Living Wage impact assessment: counterfactual research
Detailed findings from different strands of our research
Findings from the literature and research with employers
In the literature review and qualitative interviews, two key themes emerged. First, the state of the business cycle is an important determinant of wage growth, which should be taken into account when constructing an appropriate counterfactual. Employers were acutely aware of competition from employers in their localities for labour and adjusted rates accordingly, as well as according to inflation and their own profitability. Second, the qualitative research found that the minimum wage does not only affect workers directly covered by an uprating. It also influences the timing of pay increases and places pressure on wages of workers higher up in the wage distribution, creating a spillover or ripple effect. Employers reported a narrowing of differentials which they might need to correct, particularly if recruitment becomes more difficult as they currently anticipate it will. We expand on the role of these two key themes, as well as a number of other factors, in our quantitative strategy.
The conclusions from the employer research, which improved our understanding of the hypothetical counterfactual wage distribution and the increase in wages in the absence of NMW/NLW upratings, is the significance of the business cycle on wage setting behaviour and the importance of the competitive environment. In addition, any counterfactual distribution and growth of wages in low pay employment cannot be straightforwardly estimated because of the influence of upratings on other segments of the wage distribution. This suggests an extended empirical estimation of the effect of upratings across the distribution is needed. Employers were unable to offer any insight into how they might have set wages in the absence of national minimum wage policy as they appear to take the uprating as given, and instead focus on the extent of the increase over the level set in the previous uprating only.
Findings from the quantitative analysis
We reviewed current practice of the BEIS IA methodology for estimating the cost of a minimum wage uprating and focused on the key input parameters, the level of low pay assumed for the IA and an empirical growth rate of the counterfactual. Our initial proposal was to estimate the counterfactual wage using a two-stage process:
• In the first stage we aimed to estimate the effect of increases on the minimum wage at different percentiles of the wage distribution at different points in time since the early 2000s (none of the data sources extend back further than 2001 and most extend back only to 2004 ). Estimates in the lower part of the distribution would expose the impact of the NMW upratings on low wages, while the diminishing and eventually insignificant estimates further up the wage distribution would represent the percentile of the wage distribution no longer affected by “spill over” effects of the minimum wage.
• The model included demographic and firm-demographic variables, such as changes in the share of workers with low qualifications and in the share of small and medium enterprises (SMEs), and had the aim to explain wage growth at different parts of the distribution. As a second stage, it was therefore also planned to use the coefficients obtained from the model excluding the coefficient associated with the previous upratings themselves to uncover the counterfactual wage level and its growth rate.
Both stages were based on evaluating the impact of the minimum wage on wages at specific percentiles, exploiting a large dataset of observed wages in local areas for demographic groups and by gender. The dataset made use of all available data from the Annual Survey of
8
National Minimum Wage and National Living Wage impact assessment: counterfactual research
Hours and Earnings (ASHE), the Labour Force Survey (LFS) and the Annual Business Survey (ABS) to create a database at this level of aggregation.
We used the wage information in the ASHE data and obtained robust estimates to suggest that NMW upratings had a statistically significant effect on wages up to and including the 15th percentile. Consequently the results suggest that wages from the 20th percentile onwards are not affected by minimum wage upratings. However, in the second stage of the approach, the model’s predictive power was low. That is, the results indicated that estimating counterfactual wages based on changes in firm and worker characteristics was not appropriate. As a consequence, we had to adjust the original strategy and focus on using the empirical data for a suitable prediction of the counterfactual wage growth.
Based on the model estimates, conversations with labour market experts proposed that an appropriate measure of counterfactual wage growth should be wage growth at the lowest percentile of the wage distribution no longer affected by minimum wage spillovers, estimated in the first stage of our previous approach to be the 20th percentile. Next, we need to find empirical measures of wage growth at the 20th percentile, and compare it to alternative measures of wage growth for low-wage workers. We do this by constructing pseudo-panels of wages and wage growth using data from the Quarterly Labour Force Survey (LFS). This shows how wages evolve for groups of jobs with a specific set of fixed characteristics over time, based on mean of median wages from repeated cross-sections.1 Observed wage growth in the lower parts of the distribution is thus a well-founded and easy-to-obtain measure for estimating counterfactual wage growth using empirical data for the reasoning given above, and supported by messages that emerged from the consultation with academic experts on appropriate methodologies for constructing counterfactual wage growth measures.
Our regression results also indicated that wage growth is sensitive to the business cycle, so that counterfactual wage growth forecasts need to be adapted to the business cycle outlook. We recommend that BEIS review the publicly available forecasts of leading UK and international institutions, including the Bank of England, the Office for Budget Responsibility (OBR), the International Monetary Fund (IMF), the OECD and NIESR. As a consequence, the upcoming IA using the counterfactual wage growth as the wage growth at the 20th percentile should be based on a recent period with similar business cycle outlook and/or show the sensitivity of the costs of the uprating when considering different medium-term business cycle forecasts (high/low growth).
Implications
Our original intention was to use the model in stage two to obtain a credible estimate of a counterfactual for the minimum wage using the coefficients obtained from the model, excluding the coefficient associated with previous upratings themselves to uncover the counterfactual wage and its growth. However, the low predictive power of the model suggests that since the NMW has affected levels and distribution for almost two decades, the impact on wage growth at the lower part of the wage distribution influenced production technology and skills composition of the workforce, in addition to more general changes in technology over time, making it extremely challenging to estimate a counterfactual wage level or distribution due to this endogeneity. This view is supported by discussions with employers who generally looked at the differential with the most recent level of the NMW/NLW rather than any earlier levels
1 A pseudo-panel follows the evolution of wages for workers with the same characteristics, i.e. the wages of workers in a specific industry or at a specific percentile of the wage distribution, using repeated cross-sections. In contrast, a panel would use longitudinal data to follow the evolution of wages for the same workers over time.
9

National Minimum Wage and National Living Wage impact assessment: counterfactual research
when setting wages. In addition, the model suggests a structural break for the period after 2008 and generally lacks predictive power, so using the model to predict counterfactual wage levels and distributions – even in the presence of the exhaustive parametric set-up – does not seem acceptable.
While the counterfactual wage growth is the key measure for the impact assessment, this leaves us with the problem of a suitable level of counterfactual wage levels before the uprating. Current BEIS IA practice is to reset the counterfactual for each uprating. That is, apply a counterfactual wage growth assumption to the most recent data available on the wage distribution, which naturally includes the impact of previous minimum wage upratings. This may however be a strong assumption as some of the workers affected by an uprating might subsequently show lower or no growth, depending on how the uprating affects their specific segment of low pay wages.
Therefore, we further explore whether and to what extent including estimates of costs to business arising from previous upratings may impact on the IA’s predictions. The issue is illustrated in Figure 1 where the blue lines represent the NMW uprating and the green lines the counterfactual wage growth. The dotted lines indicate NMW and counterfactual wage in the period after each uprating. The dotted red lines and letters delineate areas that can be used to explain the current and alternative methodologies.
In the current IA model the cost to employers is calculated as d + e. That is, each year, the minimum wage is reset, and the cost to employers is calculated relative to the counterfactual wage growth departing from the current level of the minimum wage (green dashed line). An alternative view is that in the absence of the previous uprating(s), the wage growth would follow the original trend of the counterfactual wage (red dashed line) as shown in the illustration (d + e) + (c + f). Indeed it was our original intention to uncover this counterfactual empirically as far back as possible as discussed above.
Figure 1: Applying the counterfactual
In order for this approach to give an accurate assessment of the long term impact of the minimum wage, the red dashed line would need to represent the counterfactual path of wages in the absence of any type of minimum wage policy. As a result, the alternative approach relies
10

National Minimum Wage and National Living Wage impact assessment: counterfactual research
on the availability of a credible estimate of the counterfactual path of wages in the absence of any type of minimum wage policy. It would also be possible to consider a red dashed line which represents the counterfactual path of wages departing from the level of the minimum wages which was in effect one, two, or more years ago.
There are four reasons to recommend that the current approach of the per-period appraisal should be followed, including a consideration of alternatives for estimating the counterfactual wage distribution suggested by academics and others (although this may deliver a lower bound of costs of upratings):
1) An alternative approach could be to use data from before the introduction of the minimum wage (1999) and project this forward to give an implied counterfactual wage level. There are numerous reasons why the pre-1999 wage distribution may not be an appropriate comparison which are discussed in the report. However, it is important to note that forecast accuracy also declines markedly as the horizon increases. This is particularly important when forecasting a counterfactual, where no data is available to update and improve the forecast based on actual outcomes (by definition no such actual outcomes for a counterfactual exist).
2) A second alternative could be to modify the estimated counterfactual by imposing the kink that existed at the lower part of the wage distribution prior to the introduction of national wage policy, possibly using a Bayesian approach.
Neither of these approaches are sensible for the reasons given below:
3) Asymmetries in forecast errors: As with any forecast, the counterfactual wage forecast is subject to forecast errors. One issue with an IA of multi-period upratings is that the impact of forecast errors is asymmetric. Estimates of counterfactual wage growth that are too low lead to larger overestimates of the costs to business than vice versa as the period it would take for the counterfactual to catch up with the incoming levels would be prolonged. In this way, the IA of several upratings would lead to an upward bias in estimating the costs of minimum wage upratings.
4) Underlying labour market trends: As the minimum wage increases, the composition of jobs in the economy changes, as firms substitute for sub-minimum wage workers either using technology (i.e. automation) or more highly skilled workers, or both.
Concluding set of recommendations
To summarise, based on current conditions, we recommend:
• Using average nominal wage growth at the 20th percentile of the wage distribution between 2011 and 2016 as an estimate for counterfactual wages;
• Taking into account the costs to business arising from the impact of an individual uprating as multi-period cost estimates would introduce further sources of bias;
• Using the 2011-2016 for the empirical growth of the counterfactual feeding into the model assuming that GDP growth will correspond to the average growth rate since the recovery in 2011;
• Showing some sensitivity relation to changes in the business cycle (higher/lower growth);
11

National Minimum Wage and National Living Wage impact assessment: counterfactual research
In future years, we recommend:
• Re-estimating the first stage model, to obtain an updated estimate of the lowest percentile 𝑝𝑝∗ at which there are no spillovers from minimum wage upratings, using the most recent data available;
• Consulting forecasts for average wage growth and overall economic growth from respected and independent institutions such as the Bank of England, the Office for Budget Responsibility, NIESR, the OECD and the IMF, to take a view on the likely state of the business cycle over the next year;
• Using nominal wage growth at the 𝑝𝑝∗th percentile over the most recent time period with a similar GDP growth rate as forecast by independent institutions and provide sensitivity in relation to this.
We have implemented our recommended approach to estimate the costs to business of the NMW and NLW uprating using the BEIS IA model. This provides alternative cost estimates which can be compared to the results from existing IA approaches.
12

National Minimum Wage and National Living Wage impact assessment: counterfactual research
1. Introduction In this report, we review the methodology used by the Department for Business, Energy and Industrial Strategy (BEIS) for estimating the cost to business of upratings to the National Minimum Wage and National Living Wage (NMW and NLW respectively). We then provide recommendations for how best to estimate counterfactual wage growth and apply this to the BEIS Impact Assessment (IA) model.
1.1 UK minimum wages and impact assessments
Since its introduction in 1999, the UK National Minimum Wage (NMW) has set a wage floor for workers, whilst allowing for lower rates for younger workers aged below 22 or 21 years.2 The introduction of the New Living Wage (NLW) in April 2016 has led to a further distinction between the adult NMW rate applicable to workers aged 21-24 and to those aged 25 and over. The NLW rate introduced in April 2016 is of £7.20 was initially a jump of 7.5% over the rate of £6.70 for 21-24 year olds, and increased further to £7.50 in April 2017, is now 6.4% higher than the current rate of £7.05 for workers aged 21 to 24.
Each year, the LPC uses the research it has conducted and commissioned to form a recommendation on the appropriate uprating for the NMW and NLW. This year, the recommendations are planned for November 2017, ahead of the next potential uprating for the NMW and NLW in April 2018.
Once the LPC has made its recommendation for the NMW and NLW upratings, the Department for Business, Energy and Industrial Strategy (BEIS) conducts an impact assessment (IA), including estimates of the cost of the uprating to employers. In order to assess the costs for employers of each uprating in the NMW or NLW, it is necessary to obtain a reliable estimate of the counterfactual evolution of wages, particularly at the lower end of the distribution, for the case that the NMW or NLW had been maintained at its previous level. Providing a methodology for estimating the counterfactual wage distribution is the objective of this project.
In the past, BEIS and its predecessor the Department for Business, Innovation and Skills (BIS) have used a variety of assumptions on the estimated rate of wage growth in the absence of and NMW or NLW uprating. Two assumptions used in the past have been the Office for Budget Responsibility’s (OBR) forecast of average nominal earnings growth, or the midpoint between the forecast average nominal earnings growth and the rate of inflation.
Although the BEIS/BIS has received an opinion of ‘fit-for-purpose’ from the Regulatory Policy Committee (RPC) for its latest impact assessments of the NMW and NLW, some concern was raised about the assumed counterfactual wages. At the same time, progress has been made recently in estimating wage distributions, and in estimating the impact of increasing the minimum wage on wage inequality and on different segments of the wage distribution (see Butcher, et. al., 2012 for the UK and Autor, et. al. for the US). This progress raises the possibility of basing the assumed counterfactual wage distribution on a wider and more up-to-date evidence base.
2 The age threshold for the adult rate of the NMW was lowered from 22 to 21 years in October 2010.
13

National Minimum Wage and National Living Wage impact assessment: counterfactual research
1.2 The role of counterfactuals in impact assessments
Regulatory appraisal can be defined as the forward-looking assessment of the future changes in outcomes of individuals and institutions if a particular programme or project is implemented. The focus of these analyses is to compare future outcomes in the presence and in the absence of the intervention.
Since we can only observe each group of individuals either in the presence of a minimum wage uprating or not at any one time, the analysis is conducted through the construction of a counterfactual. Counterfactuals cannot be observed, and the economic literature presents different approaches to their construction by statistical or econometric estimation of what is most likely to have happened in the absence of the intervention.
The most common form of counterfactual used in the literature assessing the ex post impact of upratings to the NMW or NLW is to compare those affected by a minimum wage uprating (i.e. those earning between the old and new levels of the minimum wage) with a control group of workers who have not been directly affected by the uprating. Commonly used control groups include those earning a wage just above the minimum, for example, those earning up to 25 pence (or cents) above the minimum, those earning between 25 pence above and the 25th percentile of the distribution or even everybody earning above the minimum wage. The counterfactual wage growth rate is then taken to be the wage growth of workers in the control group.
Regulatory appraisal of minimum wage upratings however, require that we compare ex ante forecasts of wage growth with and without the uprating. Although forecasting introduces additional complications, the underlying logic remains the same.
14

National Minimum Wage and National Living Wage impact assessment: counterfactual research
1.3 Purpose and structure of the report
This project aims to review both the literature relevant to the estimation of counterfactual wage growth and the current BEIS IA methods for constructing counterfactual wages. We also propose to consult with stakeholders, including low wage employers, industry and trade union representatives, as well as academic experts on minimum wages and their impact on the labour market and experts in regulatory policy. Then we use this background research to inform a new strategy for constructing counterfactual wage growth estimates, and show how to apply them appropriately to BEIS’ impact assessment model.
As a consequence, the report is structured as follows. We begin by providing a literature review in section 2. This review covers a wide range of topics on wage determination, wage inequality and trends in wage growth, with a particular focus on how these topics are relevant to the construction of counterfactual wage estimates. Next, in section 3 we report on qualitative evidence gathered from interviews with employers of low-wage workers, to understand how wages are determined in practice, which factors influence wage growth, and how employers might set wages in the absence of a minimum wage uprating, or indeed in the absence of any minimum wage policy at all. Section 4 reviews the current BEIS IA model, focusing on the methods employed for estimating counterfactual wages. In addition, section 4 presents qualitative evidence gathered from interviews with academic experts in low wage labour markets, as well as experts in regulatory policy. The main objective of these interviews was to gather expert advice on how counterfactual wages should be estimated. The findings of the literature review and the consultations with low wage employers, academics and regulatory policy experts lead us to two main approaches to estimating counterfactual wages, which we implement in section 5. We then test the implications of our preferred method on the introduction of the NLW in April 2016, and compare the results for the costs to business with the results from the corresponding BEIS IA.
15

National Minimum Wage and National Living Wage impact assessment: counterfactual research
2. Review of the literature This section reviews the literature on specific aspects of the minimum wage relevant to our project, which aims to understand how wages at the lower end of the distribution would develop in the absence of regular uprating of the National Minimum Wage (NMW) and the National Living Wage (NLW). It is structured as follows: we begin in section 2.1 by discussing the literature on the structure of low paying sectors and the characteristics of its employees, while section 2.2 presents the literature on determinants of wage growth for low paid workers. In section 2.3 we review literature on the impact of the minimum wage on the earnings distribution and earnings inequality. Section 2.4 explores the evidence on wage trends before and after the introduction of the minimum wage, and section 2.5 summarises how the findings from the literature have informed our quantitative strategy.
The literature review uses the concept of the ‘bite’ of the minimum wage. The bite is defined as the minimum wage as a proportion of median earnings, and is one indicator for the extent to which employers and the labour market in general will be impacted by an increase in the minimum wage. The literature typically focuses on real wage increase but in some cases, nominal increases are reported. We have reported the increases consistent with the figures used in the original papers.
2.1 Low paying sectors and their employees
To build a counterfactual it is important to know the characteristics of individuals affected, as this will inform the strategy one uses to identify the counterfactual group. For example, some people will be paid at or around the NMW because of market forces and even in the absence of the minimum wage would have been paid around this level. Others will be paid at or around the NMW because of the NMW policy itself and would have been paid less than this in its absence. Of course, the observable characteristics of individuals affected may also be proxies for unobservable characteristics which also influence pay.
We will use the findings of the literature on the characteristics of low-paid workers and firms to inform our quantitative analysis presented in section X, particularly our choice of control variables which may impact upon wage growth for low-paid workers.
Bryan and Taylor (2004):
This study uses data from the British Household Panel Survey (BHPS) to explore the characteristics of the households in which minimum wage workers live, and the position of such households in the income distribution. They find that an equal proportion of NMW and all working households have a woman as head of the household, but women leading NMW households tend to be older and less educated than women leading other working households. Furthermore, the NMW earner tends to be the spouse of the head of the household rather than the head of household him/herself.
Jones, Jones, Murphy, Sloane (2006):
Their analysis uses ASHE and New Earnings Survey (NES) data to understand which individuals are most likely to be affected by the NMW. They also assess the factors associated with leaving NMW employment and whether the chances of leaving NMW jobs are affected by the time spent in NMW employment, which we cover in section 3 of this literature review. The
16

National Minimum Wage and National Living Wage impact assessment: counterfactual research
authors find that gender, part-time work, age and job tenure are factors linked to the risk of employment in a minimum wage job. With women and younger individuals being more likely to be paid the minimum wage, while workers in large companies are less likely to earn the minimum wage.
Brewer, May, Phillips (2009):
The characteristics of minimum wage recipients and NMW households are also explored in Brewer, May, Phillips (2009) using LFS data for the years 2007-08 and Family Resources Survey (FRS).
The authors find that NMW earners are more likely to be women, to be aged under 25, to be less educated, have older children than other workers, and in part-time employment concentrated in sectors such as retail and hospitality.
Low Pay Commission (2012, 2016):
Using data for the UK in 2011, the LPC finds that firm size is related to the proportion of workers at the minimum wage. In particular, nearly 10% of jobs in micro firms (firms with 1 to 9 employees) are paid at the minimum wage compared with around 3% in large firms. High proportions of minimum wage workers are found in the following sectors: hospitality, social care, employment agencies, food processing, leisure, travel and sport, cleaning, agriculture, security, childcare, textiles and clothing, and hairdressing.
The LPC apply the same approach to a later data set using 2016 data. Again they find the main sectors that would be affected in the short-term by changes in the NMW are: social care providers; convenience stores; small firms in general; some food manufacturers; and horticulture and other labour-intensive traded sectors, such as textiles.
The report lists some characteristics of minimum wage employees, emphasising that they tend to be from groups with lower employment rates. In particular, over 60% of NMW workers in 2016 were female (while women compromise 50% of the workers in the whole economy). 90% of NMW workers are employed in the private sector and around 14% had a temporary job (compared with 8% for the whole economy).
Resolution Foundation (2016):
As with LPC (2012, 2016), the Resolution Foundation (RF) find that in 2015 the majority of employees earning at or near the NMW are female (58%); of the age group 16-24 (32%); and part-time workers (61%). Combining working hours and gender, the statistics show that part-time women represent 40% of workers earning near or at the minimum wage. There is some geographic variation in the proportion of residents paid near or at the NMW with the North of England and the Midlands having the highest rates (7 to 8%) and London has the lowest rate (3%).
D’Arcy and Hurrel (2013):
This study quantifies the share of NMW workers who have persistently found themselves in NMW paying roles over time in the UK. Their analysis for 2012 indicates that women account for 73% of the individuals who have held only minimum wage jobs in the previous five years. Individuals in the age range 46-55 represents 30% of the total number of workers who had only minimum wage jobs in the previous five years. Again, firm size and industry have an important role in defining the share of minimum wage workers. In fact, 14% of workers in firms employing up to 10 workers earn the minimum wage, but 16% of workers in minimum wage jobs at small
17

National Minimum Wage and National Living Wage impact assessment: counterfactual research
firms seem to be persistently earning the minimum wage. Wholesale and Retail has the largest share of long term minimum wage workers (37%), while accommodation and food service has a share of 19%. However, ASHE doesn’t come with a longitudinal weight and the authors conduct their analysis without sample weights. An important improvement in such analyses in future would be the creation of a longitudinal weight to reduce bias in any analysis of longer term transitions.
Synthesis
The evidence suggests that low paid workers are more likely to be female, younger and part-time. We use variation of shares of workers with these demographic characteristics across regions in our quantitative analysis.
In addition, low-wage workers seem to be concentrated in a relatively small group of industries and occupations. We will use the Low Pay Commission’s definitions of low paid occupations and industries when constructing alternative methods for wage counterfactuals.
18

National Minimum Wage and National Living Wage impact assessment: counterfactual research
2.2 Determinants of wage growth for low paid workers
The literature review on the determinants of wage growth for low paid workers identifies a range of observable factors which are correlated with being paid at or just above minimum wage levels, namely:
• On the job training
• Job switching
• Work commitment
• School completion
• Industry
• State of the business cycle
In this section, we present the literature underpinning this list of determinants. The empirical analysis on estimating the counterfactual wage distribution aims to include these factors as further conditioning variables. Of course, there are unobservable factors which might also influence wage determination, but which cannot be explicitly included in empirical analysis.
Evidence on job training and job switching
Grossberg and Sicilian (1999) explain the determinants of wage growth in the U.S. using data collected in the 1980s for about 3,000 firms. They address the question of whether employers compensate for the imposition of a minimum wage by providing less training and find no evidence of a difference in training rates between people on the minimum wage and those around 25 cents above it. They do however conclude that people paid at the minimum wage experience slower wage growth than those just above it. This is a very different picture to that found in later US studies.
In particular, Even and Macphersont (2003) pool data from 1980 to 1999 and find that on average over successive one year periods the group of people on the minimum wage experience a median pay increase of 3.5% while their comparison group (everybody paid above the minimum wage) experience an increase of just 0.9%. This suggests that minimum wage upratings play a key role in wage growth for directly affected low-wage workers.
In addition, Even and Macpherson (2003) find that switching employer, especially when combined with a change in occupation and industry, is particularly important for increasing an individual’s wage. They compare the group of people on the minimum wage with a group comprised of everybody else. Both groups show an increase in median wages in the year between measurements. For minimum wage workers the increase is 3.6 percentage points higher when they have switched jobs and for the higher-wage comparison group the increase is only 2.0 percentage points higher for job-switchers. If the minimum wage employee switches both employer and industries, the differential wage rise compared to those who do not is 10.8 percentage points but the same choice amongst the comparison group leads a differential of -0.1 percentage points. This pattern suggests that the large increases are due to people actively sorting themselves into the most appropriate employment for their skills and experience and is consistent with the view that for many people low wage employment is an important stepping stone in their career progression. An important caveat to this work, and indeed any empirical analysis based on pre-existing data, is that we do not know which job changes are voluntary and which are due to dismissal or redundancy.
19

National Minimum Wage and National Living Wage impact assessment: counterfactual research
Some papers use observed patterns in the data to define redundancy. For example, Carrillo-Tudela et al. (2016) using data from LFS 1997-2012, define a job move due to redundancy by exploiting the fact that a person who is redundant may experience an unemployment spell before finding a new occupation. Their results also suggest that moves due to redundancy have a poorer wage outcome compared to voluntary moves.
In Even and Macphersont (2004) the results suggest that the percentage of workers with job training by occupation has an important positive effect on the probability of observing a positive wage growth above the minimum-wage. In addition to training, full time workers are four times more likely to see their pay rise above the minimum wage compared to employees working 10 or fewer hours per week.
Aralampulan et al (2004) use the British Household Panel Survey to estimate the impact of the NMW on job training for low paid workers. They find that NMW increases the training probability by 8.0 percentage points (statistically significant at 10% level), using workers just above the minimum wage as control group.
However, using LFS data, Dickerson (2007) finds no evidence to suggest that employers had reacted to the introduction of the minimum wage or its subsequent upratings by changing the amount of employer-provided training, using workers who earn between the NMW and 15% above the relevant (adult or youth) NMW as control group.
Synthesis
There is some evidence to suggest that employers might respond to minimum wage increases by increasing worker training, which suggests a potential channel by which minimum wage increases raise productivity. Neglecting any potential minimum-wage induced productivity increases would tend to bias counterfactual wages upwards, as we would be ignoring a potential further channel by which wage growth might have been lower in the absence of an increase in the minimum wage. However, the evidence base is thin and the results are mixed, so we do not take any impacts of training and productivity on counterfactual wages into account.
There is also some evidence that switching jobs leads to higher wage increases for low-paid workers. If the wage increases from job-switching are due to improved matching of workers’ skills with industries and occupations, then it is difficult to see how this individual effect would have an impact on the aggregate costs to businesses of minimum wage upratings. However, it is also conceivable that when workers are feeling more bullish about employment prospects due to favourable aggregate labour market and business cycle conditions, they might be more willing to switch jobs, putting upward pressure on wages in the aggregate.
The effect of minimum wage upratings on wage growth
A number of studies focus on the impact of minimum wage upratings on wage growth. Here we review studies focusing only on the direct impact of minimum wage upratings on those directly affected (i.e. those whose wages were previously below the new rate). We discuss studies which also examine the indirect effects on workers higher up in the wage distribution in a separate section.
Swaffield (2014) assesses the impact of the UK NMW to analyse how low-wage employers adjust their wage setting behaviour under a binding minimum-wage. The results are mixed: based on ASHE, findings suggest that introducing and increasing the NMW had a positive and
20

National Minimum Wage and National Living Wage impact assessment: counterfactual research
significant effect on wage growth for minimum wage workers for both males and females. However, the estimates using the LFS are not significant, although generally positive.
A positive impact of the uprating of the adult rates of the NMW on earnings was also found by London Economics (2016). Using ASHE data covering the period 2004 to 2014, their analysis shows that on average, across all upratings, average hourly earnings increase by an additional £0.11 per hour for those affected by the NMW compared to workers earning up to 10% in excess of the incoming rate. This implies that the uprating resulted in a 2 percentage point faster wage growth for the former group compared to the latter.
The studies by Machin et al. (2003) and Giupponi, et al. (2016) provide further evidence for wage dynamics of the low paid for the health and social sector, especially for care homes, which have been much affected by upratings of the NMW and the introduction of the national living wage (NLW). Machin et al. (2003) found evidence of larger wage increases in care home workplaces with larger shares of low-wage workers. Care homes with one-third of employees paid less than the minimum-wage had an average wage growth of 3.3% higher than care homes with one-tenth of worker paid below the minimum-wage. The recent update of this study (Giupponi, et al. (2016)) confirms these findings. In particular, an increase of 10% in the proportion of workers paid below NMW leads to an increase in real average wage growth of circa 0.8%.
Using time series analysis on U.S. data, Belman and Wolfson (2004, 2010) analyse the response of mean wages and employment at the industry level to minimum wage changes. The 2004 study found that the minimum wage upratings increase mean wages, but found no evidence of a negative employment effect. The 2010 study using simulation analysis, also found a significant effect of the increase of minimum wage on the nominal wage growth, which is increasing over time. In particular, the estimates indicate that an increase in the minimum wage results in an increase in industry average wages for two-thirds of the considered industries, while the effect on employment and hours is far less certain. However, the industries do not all respond in the same manner to a change in the minimum wage.
Significant point estimates of elasticities of wage growth to minimum wage increases range from 0.04 to 0.43. That is, a 10% increase in the minimum wage boosts the average wage by between 0.4% and 4.3%. However, the majority of the significant estimates fall in the range 0.04 to 0.2 with two exceptions being auto-services (excluding repairs) and variety stores. More importantly, the significant elasticities are only found in a few broad areas of the economy: retail, some hospitality sub-sectors, textiles and leather goods and two care related industries (nursing facilities and child day care).
Synthesis
The studies cited in this section provide evidence that minimum wage upratings do indeed have positive impacts on wage growth for directly affected workers compared to low-wage workers who are not directly affected (i.e. workers who were already earning just above the incoming minimum wage rate). As a result, it is reasonable to assume that wage growth for directly affected workers would have been lower in the absence of a minimum wage uprating, so that actual wage growth should be seen as an upper bound for counterfactual wage growth. However, these increases in wages might be concentrated in a relatively narrow set of industries, such as retail, care-related industries and some parts of hospitality. We will use definitions of low-wage industries from the Low Pay Commission in our quantitative analysis.
21
National Minimum Wage and National Living Wage impact assessment: counterfactual research
The business cycle and minimum wages
Economic theory suggests there will be a downward pressure on wages during a downturn because a reduction output is associated with lower employment and lower bargaining power for workers. Similarly, theory suggests that there might be upward pressure on wages during an expansion, as labour demand increases and firms compete for workers.
Dickens et al. (2013) re-assess the impact of the NMW on earnings, employment and hours to understand differences over the business cycle and by firm size. Their results support economic theory and their findings suggest that during the recession years low paid workers experience slower wage growth in the presence of changes of NMW. In particular, minimum wage upratings during the 2008-2009 recession had a statistically significant negative impact on the probability of wage growth for employees working in firms of any size, with coefficients ranging from -0.011 to -0.021. This indicates that NMW upratings led to wage increases for affected groups that were smaller during recessions by 1.1 to 2.1 percentage points.
Synthesis
The limited evidence suggests that wage growth is lower during a recession, which supports standard economic theory. This would indicate that taking account of the state of the business cycle is also important for counterfactual rates of wage growth. In the quantitative analysis of section 5, we find that the state of the business cycle is indeed an important determinant of wage growth. We incorporate this into our recommendations.
22
National Minimum Wage and National Living Wage impact assessment: counterfactual research
2.3 Impact of the minimum wage on the earnings distribution and inequality
A small number of papers try to estimate the entire wage distribution that would have occurred if the minimum wage had never been introduced. This approach is motivated by a hypothesis that the minimum wage might not only have an impact on the wages of those directly affected, but might also have spillover effects to higher-wage groups. DiNardo, Fortin and Lemieux (1996) explore how minimum wage and/or unionisation affect the shape of the wage distribution in the U.S. by estimating and analysing counterfactual earnings distributions. Their approach adapts the Oaxaca decomposition which allows one to apportion overall changes in prices and quantities between changes in sub-groups. This provides a useful tool to obtain the counterfactual densities associated with a change in the real value of the minimum wage. The authors use the value of the real minimum wage in 1979 to construct a counterfactual density of wages, which is used to assess whether a decrease in the real value of the minimum wage had an impact on the wage inequality between 1979 and 1988. They find that the change in minimum wage explains 25% of the change in the standard deviation of log wages of men and 30% for women in the time period of interest. While the approach of DiNardo, Fortin and Lemieux (1996) is an interesting one, it is difficult to see how it could be applied to the UK, where minimum wages are nationwide.
Minimum wage and the earnings distribution
Neumark et al. (2004) adopts an estimation strategy allowing the effects of minimum wages to differ across the wage distribution. The strategy also incorporates the impact of historical changes in the minimum wage. Using US data, they find significant and positive effects for workers at or just above the minimum wage, and positive but much smaller effects for workers higher up the wage distribution. The size of the effect decreases as starting wage increases. The net elasticity of wages with respect to the minimum is about 0.8. That is, a 1% increase in the minimum wage results in a change in wages of about 0.8% for workers at or just above the minimum wage. However, in subsequent years the increase leads to a decline in hours and employment for lower paid workers with the overall effects being a net loss in earned income.
To understand the impact of the minimum wage on the wage distribution the concept of spillovers is often used. Spillover effects may be observed where the minimum wage introduction/increase has an impact on the earnings of employees working at/ below the minimum wage and this has a knock-on effect on other parts of the earnings distribution. The results obtained so far have achieved mixed conclusions. For example, Card and Krueger (1995) show that the 1990 and 1991 increases in the U.S. federal minimum wage had significant positive spillover effects at the 5 and 10 percentiles, but an insignificant effect at the 25 percentile of the wage distribution. Positive spillover effects on certain percentiles of the wage distribution are also found by Lee (1999). However, Autor et al. (2010) address the omitted variable bias of Lee’s specification, due to the exclusion of fixed effects for trends in states, and division bias, and argue that the previous findings reflect measurement error in the Current Population Survey used for the study. The papers do not consider the mechanism for the spillovers in great detail and generally assume a ripple effect, one such mechanism being people in more senior positions feel justified in arguing for a wage rise to preserve wage differentials with less senior colleagues.
However, there are important contextual differences between the minimum wage regimes in the UK and the US. First, the minimum wage was introduced much earlier in the US. Second, the US minimum wage actually declined in real terms during the 1980s. As a consequence,
23

National Minimum Wage and National Living Wage impact assessment: counterfactual research
caution should be exercised when generalising this US evidence to draw conclusions for the UK.
For the UK, Dickens and Manning (2004) estimate the effect on the distribution of wages by checking for the presence of spillover effects due to the introduction of the minimum wage, but find no evidence for this mechanism, similar to Stewart (2012).
In contrast, Manning (2012) argues that spillover effects were not present when the minimum wage was first introduced but began to occur in later years as the NMW approached 50 percent of the median wage. A more recent study by Giupponi, et al. (2016) using data for care home employment suggests the presence of spillover effects for people aged under 25 in the care sector. However, the paper only considers the specific case of care homes and there are some methodological issues in the approach taken, consequently this evidence is weighted lightly in our overall conclusion.
Butcher, Dickens and Manning (2012) use NES and ASHE to explore the impact of the NMW introduction in 1999. In contrast to earlier studies, Butcher et al. (2012) find some spillover effects onto higher wage groups. In particular, the minimum wage variable lagged by one year is significantly different from zero (at 10% significance level) for the 25th percentile of the wage distribution, (40% above the level of the minimum wage in 2010). The authors argue that this finding can explain the absence of any spillover effects in previous papers, as it might take time for the full effect of the minimum wage further up the wage distribution to unfold.
To summarise, the evidence indicates that there may be spillovers of the minimum wage further up the wage distribution for the UK. Moreover, there is some indication that these spillovers may operate with a lag, persisting into the future. If the impact of minimum wage increases does persist into the future then the implication of multiple minimum wage increases may be underestimated if one only considers the short or medium term implications of each increase in isolation. As such, we explore persistence over time empirically in section 5.
Minimum wages and wage inequality
Dickens and Manning (2004) aim to understand whether a minimum wage contributes to reduced wage inequality, but conclude that the introduction of the NMW in 1999 did not significantly affect the wage distribution in the UK, presumably because of the low level initially set for the NMW, which directly affected only 6-7% of the working population. By comparison, in April 2016 7.1% of employee jobs in the economy were paid at the minimum wage3 (both NLW and age-related NMW) (LPC, 2016, p.55).
Exploiting geographical variation in the bite of the minimum wage, Dolton et al. (2010) assess the impact of the NMW in the UK on wage inequality and employment and find evidence of a narrowing effect of the NMW on wage inequality. In particular, the coefficients on wage-inequality measures are almost all significant, all negative and increasing over time (ranging from -0.035 in 1999 to -0.102 in 2007 for the 50:5 ratio). This indicates a stronger decrease in inequality where the minimum wage had greater ‘bite’. These findings were confirmed in an extension of the study (Dolton et al., 2012).
Autor and Manning (2010) also make use of the larger available dataset to discuss previous findings in the literature (Lee, 1999). With the new available set of data and adjusting previously used econometric specifications, the authors arrive to new conclusions for the
3 LPC define coverage as being paid within five pence of the relevant rate or below.
24
National Minimum Wage and National Living Wage impact assessment: counterfactual research
cause of the U.S. wage inequality. In particular, they show that if the minimum had been at its real 1988 level in both 1979 and 1988, then female 50/104 inequality (percent wage differential between workers at the 50th percentile and the worker at the 10th percentile of the wage distribution, e.g. ‘middle’ salary workers and low earnings workers) would have risen by 15 log points (which is approximately equivalent to 15% because it is a small value), and male and pooled gender inequality by 7 log points (circa 7%) each. These estimates suggest that falls in the real value of the minimum wage played a much smaller role in defining U.S. wage inequality than previously thought.
For the UK, Butcher et al (2012) present a model that can explain the impact of the NMW on wage inequality. The model is used to obtain estimates suggesting that over half of the change in the log 50/5 ratio (the percent wage differential between workers at the 50th and 5th percentiles of the wage distribution) for the period 1998-2010 is due to the NMW for younger workers. The results for older workers are smaller.
A positive impact of the minimum wage on wage inequality is also found by Dickens et al. (2004) for the UK. They estimate that a 10 percentage point increase in the proportion of workers affected by an increase in the NMW will reduce the 50/5 ratio (wage differential between workers at the 50th percentile and workers at the 5th percentile of the wage distribution as explained above) by 1.8%. A greater reducing effect is found after controlling for unobservable time invariant characteristics (i.e. by using dummies for industry and occupation); a 10 percentage point increase in the proportion affected by the NMW reduced the 50/5 ratio by 4%.
Synthesis
While the evidence on the presence of spillovers from minimum wage increases onto workers higher up in the wage distribution is mixed, the most recent evidence for the UK (Butcher, Dickens and Manning, 2012) does find evidence that minimum wage upratings lead to wage increases for workers up to the 25th percentile of the wage distribution, albeit with a lag of one year. The evidence also suggests that wages of workers up to the 25th percentile might be higher than in the counterfactual without a minimum wage uprating, so that workers earning between the incoming minimum wage rate and the 25th percentile might not be an appropriate counterfactual group. We will return to this point in sections 4 and 5.
4 For example if the log of the median and the tenth percentile were 2 and 0.8 respectively the ration would be 2.5.
25

National Minimum Wage and National Living Wage impact assessment: counterfactual research
2.4 Wage trends before and after the introduction of the minimum wage
Only a small number of studies exist on trends for wages in the UK before and after the introduction of the minimum wage.
As Butcher (2005) observes, wages grew faster in the period 1998-2003 compared to 1992-1997 (growth rate was 22.1% compared to 19%). Moreover, since the introduction of the NMW, the wage growth for the lowest paid workers has been higher than for the median worker. Such a differential in wage growth was not registered in the period before the introduction of the minimum wage. In addition, Butcher (2005) finds that higher wage growth for women than men earning at the bottom end of the wage distribution has been an important factor that contributed to narrowing the gender pay gap.
The Office for National Statistics (ONS) presented detailed information of wage growth for the last four decades in their 2014 report (ONS, 2014). During the period 1975-1998 real earnings growth for the bottom 1% of full-time earners was 63%. Earners at the middle enjoyed 74% real wage growth, while the top 1% saw their real wages grow by 138%. However, looking at the period 1998-2013 the growth across the distribution changed completely. Real wage growth for the bottom 1% was 49%, while the wage growth for the middle 80% of the earning distribution was substantially lower at around 15%. Wage growth was also different for full and part time workers.
Some statistics on real wage growth are also reported in Machin (2015). The report shows that real wages grew consistently by around 2% per year from 1980 to the early 2000s. The economic downturn which began in 2008 caused a strong fall in real wages, with real wages of the median worker falling by around 8-10% since 2008. This implies a drop of almost 20% relative to the trend in real wage recorded between 1980 and the early 2000s.
Synthesis
The evidence on long-term wage trends before and after the introduction of the NMW in the UK is complementary to the evidence cited in the previous section that minimum wages do tend to increase the wages of affected workers relative to those higher in the wage distribution. Importantly for our approach, real wages have been falling overall in the UK since 2008. This will inform the specification of our regression model in the quantitative section, as not accounting for the overall downward trend in real wages since 2008 would introduce bias to counterfactual wages.
26

National Minimum Wage and National Living Wage impact assessment: counterfactual research
2.5 Summary of findings
From the summary of the determinants of low pay employment provided above, we suggest that the empirical analysis to estimate the counterfactual wage distribution should include key demographic characteristics of the workforce and industry characteristics relevant to understanding how much local employment is affected by the NMW/NLW upratings. Key demographic characteristics associated with wages at or near the minimum wage include gender, age and part-time status. In addition, the evidence suggests that low-wage work is concentrated in a relatively small number of industries and occupations. As a result, we will use the current (as of September 2017) Low Pay Commission definitions of low-wage occupations and industries in our quantitative analysis.
Further, the literature also gives us some guidance in choosing appropriate counterfactual groups. Recent evidence on the existence of minimum wage spillovers for the UK – in particular the work of Butcher, Dickens and Manning (2012) – suggests that it is important to take the impact of minimum wage increases on workers with somewhat higher wages into account. That is, it is important to consider that workers whose wages lie just above the minimum wage might not be the most appropriate group upon which to base counterfactual wages. As a result, it is important to estimate the impact of minimum wage increases on the wage distribution, in order to ascertain which groups might be appropriate ‘control groups’ when constructing counterfactuals. This motivates both our approach of following Butcher, Dickens and Manning (2012) in estimating the impact of minimum wage upratings on different points in the wage distribution, and our alternative approach of basing counterfactual wage growth on wage growth higher up in the wage distribution.
Finally, the evidence on counterfactual growth of wages in the absence of a minimum wage regime suggests that wages of low-paid workers experience higher growth rates than the median in the presence of the minimum wage, but lower growth rates than the median in the absence of a minimum wage (Butcher, 2005). This indicates that counterfactual wage growth for low-wage workers is likely to be lower than growth in median wages. At the same time, the evidence also indicates that some (non-zero) real wage growth occurred in the absence of the NMW/NLW. Even in the post-crisis period, when real wage growth was negative, nominal wage growth was positive.
27

National Minimum Wage and National Living Wage impact assessment: counterfactual research
3. Qualitative evidence
3.1 Introduction
The project included a qualitative stage to explore how, in practice; firms determine their workers’ pay in low paid sectors and the extent to which this follows expectations based on economic theory. Interviews were also aimed at understanding the influence that NMW/NLW has exerted on wages and pay setting; how their practices might change in their absence; and whether the rates affect non-pay expenditure. These questions were explored through interviews with ten employers in the sectors of hospitality, retail, social care and food and drink manufacturing, employer bodies for those sectors and two trade union bodies.
We drew our sample from employers who have previously taken part in NIESR research and, in the retail sector, from referrals through the industry body. Interviews were by telephone, either with the head of Human Resources (HR) or similar and were an average of 45 minutes in length. Interviews with employer bodies were either with the director or policy lead. Table 1 lists the 10 case study employers by sector, showing size and location. These are not intended to form a representative sample but to illustrate a range of practices in relation to pay determination and responses to the NMW/NLW. As the table shows, 3 were in the hospitality sector, 3 in food and drink processing, 2 in care services and 2 in the retail sector. A number of employers were located in more than one sector, for example the breweries. The case study firms varied in size from 80 employees, in the case of a care home, to around 200,000 in the case of a supermarket chain. However, while varying, most were large firms with only two SMEs in the sample. The research therefore largely provides insights into how larger firms set wage rates and the influence of the NMW/NLW. These do, of course employ the majority of low paid workers, although their concentration is higher in SMEs.
Table 1: The 10 case study firms
Code Type of business Sector Location in UK Number of employees
Emp1 Fish Processing Food & Drink Scotland 500
Emp2 Budget holiday chain Hospitality North and South England 4000
Emp3 High Street Chain Retail National 50-100K
Emp4 Brewery, Pubs & Hotels Hospitality SW England 14k-18K (seasonal)
Emp5 Healthcare Group Care Services National 20-30K
Emp6 Brewery Food & Drink East England 500
Emp7 Healthcare Group Care Services SW England 80
Emp8 Supermarket Chain Retail National 150-200K
Emp9 Food Production Food & Drink East & NE England 600
Emp10 Resort Hotel Hospitality SW & NW England 375
In this section we first describe the use of NMW/NLW in these sectors, we then explore the factors relevant for pay determination and how a counterfactual might be conceptualised.
28

National Minimum Wage and National Living Wage impact assessment: counterfactual research
3.2 Use of the NMW and NLW
We asked employers about their use of the NLW and NMW. Table 2 shows the (rough) proportions of employees paid at these rates in the case study firms. As the table shows, most employers did not provide precise figures, either giving percentages or stating that ‘most’ or ‘many’ were paid at these levels, with the NMW applying to under 25s and the NLW to those aged 25 and older. Reasons for the lack of clarity around proportions paid at various rates included the practice of setting pay rates at small margins above NMW/NLW rather than at the levels themselves, making it difficult to give a precise figure. Employers also described the groups of staff involved in general terms, for example as in lower skilled roles, kitchen and bar staff and others in customer-facing roles. Depending on the sector, many workers paid at, or around, the minimum and living wage levels were women – for example in retail and social care and much of the hospitality sector. Higher proportions of men were employed in food processing and in warehouse work within retail companies. These jobs were generally paid above NMW/NLW.
Case study employers were able to be more specific about whether they varied rates by region or by age. In relation to region, employers varied their rates where they had national coverage or had locations in different regions and labour markets. However, this was not necessarily the case, with one resort hotel paying the same rates in an area of high unemployment in South West England to its other location in North West England with very low unemployment (Emp10). In relation to age, most of the case study employers did not pay age rates or apprentice rates but a small number paid the lower rate for younger workers. These included seasonal workers in the hospitality sector, for example working in pubs paid above NMW but below NLW (Emp6). A supermarket paid a recruitment rate for under-18s for their first 6 months of employment (Emp8) but otherwise felt that differentiating by age was not fair employment practice (see later). A few employers said they paid all staff at the National Living Wage rate and others said that this is their goal, though felt they could not currently afford the rates. A supermarket employer explained the considerations surrounding decisions about pay:
‘There is a trade-off in terms of what we invest in colleagues, how many colleagues we have, what we put into prices and what we put into profit etc. and so there is a very complicated dynamic that we need to balance in terms of doing the right thing for our colleagues, being legally compliant and being able to afford what we need to do’.
29

National Minimum Wage and National Living Wage impact assessment: counterfactual research
Table 2: Use of the NMW/NLW in the case study firms
Code Type of business Proportion on NMW/NLW
Occupations on NMW/NLW
Regional rates?
Age
Emp1 Fish Processing 65-80% Lower skilled No >25 - NLW 21-25 - NMW 18-21 - NMW
Emp2 Budget holiday chain
60-70% Entry level No >25 - NLW 21-25 - NMW 18-21 - NMW
Emp3 High Street Chain None 16-25 (12,000) on £8 per hour
No 16 – 25 years - £8
Emp4 Brewery, Pubs and Hotels
Many Seasonal bar& kitchen staff.
Yes >25 - NLW 16-21 - NMW
Emp5 Healthcare Group Most Healthcare assistants
On trial NLW +5p irrespective of age
Emp6 Brewery 20-25% Bar staff Yes 20-25% on NLW 20-30 seasonal employers under 21 years paid between NMW & NLW
Emp7 Healthcare Group All entry level Support Staff No 18-25 – NMW (7.20) (before QCS 3 and 4) After QCS - £7.60
Emp8 Supermarket Chain 33% on base rate
Entry level customer focused
Yes Under 18 6 month recruitment rate. All ages £8
Emp9 Food Production Few Young age, low experience.
Yes Skill rates rather than age rates.
Emp10 Resort Hotel 30% Across areas No Under 18s NMW, all others NLW
30

National Minimum Wage and National Living Wage impact assessment: counterfactual research
3.3 Factors relevant to pay determination
We asked employers and representative bodies how pay rates are set. The overall strategy varied between companies but in larger ones the overall budget was set at senior, often board, level which includes assumptions about percentage increases. Decisions are then made about allocation to groups of employees and to individuals. Decisions in SMEs were reported to be made at owner or director level alongside the HR and finance functions. There were few wage agreements in the case study companies, although rates set by engineering councils applied for some jobs in the hospitality and food sectors.
Only one of the case study companies formally negotiated wages with a trade union through collective bargaining arrangements. However, a small number of others did engage with unions and discuss pay issues. The NMW/NLW have been introduced alongside the declining involvement of trades unions and some employers commented on the fact. At the same time, it was also thought that the NMW/NLW have changed the negotiating environment, as an employer in the food processing industry explained:
‘There is a union involved but back in the day before minimum wage came in wage negotiations used to be a heated discussion in October and now it’s a discussion over a cup of coffee because minimum wage is X and therefore wages are X. There’s no discussion about it’.
In the social care sector employer representatives reported the involvement of trade unions in pay particularly of nursing staff but our social care case studies did not have such arrangements.
General factors determining pay rates
We asked about the factors that determine pay rates. As we explained above, the NLW in particular had considerable influence on the rates set. However, other influences were important in determining whether, and by how much, employers exceeded the NMW/NLW. In many cases profitability of the business was cited as a key factor in decisions about pay increases, particularly for jobs above national minimum and national living wage levels. Employers in the food and drink sector in particular commented that any substantial increase in the pay bill would need to be passed on in the costs of products and that their supplier arrangements made this difficult. In terms of general influences and factors, it was common for employers to say they are guided by inflation rates from concern not to effectively reduce real pay rates.
Skills and productivity were mentioned as a factor in exploring changes in pay rates, in particular in the context of how to ensure that the costs of paying the NLW are recovered. Therefore, a number of employers across sectors were looking at how they could upskill some roles. At the same time, there were downward pressures on skills, for example widespread use of online shopping was reported to require less technical product knowledge at store level, since customers increasingly make purchase decisions through their own online research.
Current and anticipated pressures on pay
Employers and employer bodies also talked of other current pressures on pay, including affordability of the apprenticeship levy, pension auto-enrolment and business rates. Looking ahead to the coming year, all of the research participants raised the potential influence of the UK’s departure from the EU. Depending on future immigration policy, many expected to
31

National Minimum Wage and National Living Wage impact assessment: counterfactual research
experience difficulty recruiting new employees but also felt that other cost pressures on their business made pay increases problematic. Therefore some employers talked more generally about how EU exit was introducing more uncertainty into their business rather than impacting directly on pay decisions. A number of employers referred to the fall in the value of sterling. The continuation of constraints on social care funding was cited as a particular issue by the care sector respondents. Unions also reported that EU exit is commonly raised in discussions about pay, but more in the context of creating a climate of uncertainty for businesses and trade, than in placing specific pressures on pay.
The influence of competition
We have described how many employers pay slightly higher rates than the NMW and NLW, largely for competitive reasons. Therefore employers across sectors were mindful of their competitors’ pay rates and adjusted theirs accordingly. These included decisions about non-pay benefits which form part of the employment package. In general, for staff at lower levels of skill and pay, employers compared their rates with those of other employers locally. These comparisons appeared to be made on an informal process rather than through any sharing of pay and benefits data. However, one employer body reported more formal sharing of pay increases between members of its Human Resources forum and another employer referred to sharing information via local HR networks. Employers also monitored turnover rates and used exit interviews to establish what pay and non-pay factors lead to decisions to leave and how turnover might be reduced. As explained elsewhere, competitors were from outside as well as inside sectors, with care homes especially concerned at losing staff to supermarkets.
Some employers purposefully positioned their rates slightly above the NLW and did so for competitive reasons, in order to attract a higher standard of employee in terms of qualities such as general education and work ethic. As a large retailer explained:
‘We want [our employees] to have a certain level of knowledge and experience, and therefore we recognise that through pay…We want to be in that place where we recognise experience and skills that we’re looking to develop’.
It was apparent that employers across sectors were very aware of rates offered by competitors and wanted to position themselves carefully in terms of the rates they offer. This was particularly true for employers with large workforces, including the large retailers but also the large social care provider; whose resourcing team gathers intelligence about competitors’ rates of pay, which it combines with information on recruitment from the operational team to decide when to increase pay rates.
Supermarkets appeared to have a particularly strong influence on other employers’ pay policies, especially where local labour markets are tight. This is possibly explained by the size of the sector and number of vacancies. In addition, employers in sectors such as hospitality and care were aware that their jobs were more demanding than those offered by supermarkets and that they could not therefore offer substantially lower rates, or lower rates at all.
Local labour market variation
The location of businesses had a strong impact on pay. Some employers varied their rates according to location, for example a brewery with a site in Essex paid slightly higher rates than in Norfolk and employers with national coverage, for example supermarkets, paid slightly higher rates in London and various locations in the South East. These rates were not fixed but varied according to local factors such as costs of renting and competitors’ rates. Similarly, a
32

National Minimum Wage and National Living Wage impact assessment: counterfactual research
social care provider paid an additional 50p or £1 per hour in ‘hot spot homes’ in expensive areas such as Surrey. This employer explained:
‘We are piloting some regional hotspots where you know everybody at that level in that care home will get a supplement that reflects that they are living in a region where we don’t think the national living wage is very sustainable’.
One employer body remarked on the number of regional rates used by employers, which are in some cases as high as six which they felt to be excessive. An employer body representing the hospitality sector expressed the view that few employers in London and the South East pay as low as the NMW for young workers because of tight local labour markets. As we explain below, some employers felt quite strongly that the NMW/NLW should vary by location.
Local labour market conditions affected decisions not to pay age rates. Seasonality of some businesses was also a factor, with competition for staff spiking at certain times of the year and leading employers to increase their rates. As an employer in the food and drink and hospitality sector explained:
‘We are fighting for staff, good staff. So very often, due to the competitiveness of the industry in this part of the world (South West of England), in the height of the season we wouldn’t get any staff if we offered National Minimum Wage’.
Some employers in very tight labour markets also argued that they had little choice but to pay the NLW to all employees because they would otherwise not be able to recruit. One employer therefore expressed the view that statutory requirements are currently not needed in practice since market pressures would increase wages to roughly NMW/NLW levels.
Where employers and representatives expressed dissatisfaction with the NMW/NLW, it was largely with the lack of regional differentiation in rates. A common view was that pay rates should reflect costs of living and that these vary across the UK.
One employer in the food processing sector argued:
‘It is unrealistic to expect a minimum wage to be relevant across the whole country.
Similarly an employer in the West Country stated:
‘It’s a darn sight more expensive to live in London than it is down here or in Wales, but it’s the same National Living Wage’.
A similar comment was made by the representative of a large social care company, who referred to different costs of housing and travel:
‘Having a flat UK national living wage does seem a bit counter-intuitive to me’.
This point was also made by the representative of an employer organisation for the hospitality industry who argued that employers in London and the South East are better able to absorb the costs of pay increases than those in other areas of the country because customers will pay higher prices. In addition, it was argued by some respondents that larger companies are more able than SMEs to pay higher rates without impacting on their business.
33

National Minimum Wage and National Living Wage impact assessment: counterfactual research
3.4 Impact of the NMW/NLW on pay levels and structures
We asked employers what difference the NMW/NLW made when they were introduced, a question which they interpreted in financial terms. No employer knew how much difference the NMW had made since they were not with the company at the time. However, some employers associated with the food industry made the point that their sector had been covered by wage councils until 1993 and that the NMW had not made a substantial difference.
It was generally agreed that the NLW had made a difference to how employers set wages. In many cases NMW/NLW were described as setting the level of lower skilled jobs, although rates might be slightly above rather than at those levels. In general, employers described their approach as setting wages at the level they can attract employees of the quantity and quality that they need. While NMW/NLW were seen as pushing wages up, in some sectors and areas it was apparent that local competition for labour would have this effect in any case.
In many cases it was reported the NLW was also superseding the NMW in terms of importance in guiding wage policy and practice. The NLW had also made changes to employers’ treatment of the pay package.
The financial impact of NLW in its first year
All employers had needed to pay some increase, or to change their pay package with the introduction of the NLW. Many employers were able to provide a figure of the cost of the NLW, with amounts varying according to company size and level of uplift required. The additional cost was clearly higher in companies with larger proportions of staff on the minimum wage. A food processing company with 500 employees increased its pay bill by £400,000 in the first year, and £250,000 in 2017. A large High Street retailer reported an increase of over £7 million in its pay bill in the first year and a large healthcare provider incurred an increase of around £17 million in 2016 over its pre-NLW pay bill. Since this was not matched by an increase in fees paid by local authorities, this had an impact on company profits. A few companies said the impact had been small because they were already paying above NLW rates. However, they had needed to increase holiday pay.
Changes to non-pay benefits
Some employers had responded to the NLW by reducing non-pay benefits in order to make increased pay rates more affordable. A representative of the food and drink industry reported that employers are removing some of their lowest paid employees from salary sacrifice schemes, for example childcare and enhanced pensions. A large retail company had changed access to some of its bonus schemes. This employer had found that:
‘Actually, for those hourly paid colleagues, they really valued that higher increase in base pay because that’s what gives them the reassurance and that commitment each month of what they will receive’.
This adjustment had reduced the costs of the NLW from around £19 million to just over £7 million in the first year. A representative of a supermarket chain reported widespread restricting of employment contracts by its competitors, for example shift premiums and paid breaks, but said it had not made such changes itself. In the care sector, a representative of an employer body reported that employers were concerned that offering benefits such as accommodation or healthcare might lead them to fall foul of the national and living wage rates.
34

National Minimum Wage and National Living Wage impact assessment: counterfactual research
In the hospitality industry employers have needed to remove the allowance for tips within rates of pay, a change which was reported to be significant in terms of setting pay, particularly in London, the South East and other more affluent areas of the UK.
Impact of NMW/NLW on the timing of pay increases
In most of the case study companies the NMW/NLW had changed the time of year when pay adjustments are made to April. This initial movement entailed some additional cost within the first year. However, some advantages were experienced by companies making this change. For example a large social care company explained that it used to adjust pay for carers in April and for nurses in October but had moved the process to April. It had found:
‘It allows us to look at relativity because, even though the National Living Wage didn’t apply to nurses because they are all paid significantly more, they will look at their salary benefit since they are working in the same home. It allows us to take a view across the patch’.
There were some exceptions to the practice of setting increases in April. For example, a brewery chain made its general pay increases in January, finding that applying the NLW increases to relevant staff in April was little additional work. Otherwise, pay rounds themselves were reported to now largely take place in April to correspond with increases in the minimum wage. Adjustments to comply with these rates therefore had minimal implications for administrative resources because pay was adjusted annually in any case. Although a large retail chain carried out its pay review in November in line with the practice of its overseas parent company, incurring additional administration costs.
The NLW was also reported to have the effect of allowing for pay increases to be planned, since rates are known in advance. There was also a view that the NMW/NLW had introduced closer scrutiny to the process of wage setting, to ensure that settlements and pay rates are fair and in compliance with legislation, as well as rewarding skills and productivity.
Adjustments were made during the year to individual salaries, for example to recognise achievement or potential. Two employers, in the food and drink and hospitality sectors, made small adjustments throughout the year in response to competitor activity, for example the opening of a new hotel in its area or difficulties sourcing specific skills, such as chefs.
Spillover effects
We explored the spillover effects of the NMW/NLW in the literature review. The qualitative research found evidence of these in the case study firms. First, in terms of age, the NLW appeared to have the effect of raising pay of workers below the age threshold of 25 in some cases. Employers reported a range of influences behind the decision not to apply age differentials. Some employers in the food sector reported pressure from supermarkets on equality grounds, and implemented this in various ways. A few research participants expressed the view that age rates, for the NMW at least, are discriminatory. Others were reluctant to pay the lower age rates, except temporarily for new starters, on grounds of fairness. Some employers also regarded it as unfair, or at least sometimes problematic, to pay the NMW for under-25s and NLW for over-25s where they are carrying out the same work. One employer in the hospitality sector explained:
‘It felt quite unjust to us to have somebody of 23 doing exactly the same role as somebody of 25, adding just as much value to business, so it felt a little bit immoral really to pay them lower. So we made the decision that everybody over 21 would receive the national living wage.’
35
National Minimum Wage and National Living Wage impact assessment: counterfactual research
Employers in tight labour markets also said it would be difficult to recruit young staff if they paid age rates. A further reason for not paying age rates was the administrative complexity of having different rates which change when employees hit age thresholds.
Paying the NLW to all workers under 25 was not seen as feasible by others. For example a food processing plant with only 500 employees (emp1) calculated it would cost an additional £75,000 a year to uprate NMW workers to NLW and that this would impact negatively on the business.
Negative spillover effects were also reported. A number of employers across sectors reported giving slightly lower pay increases for employees higher up the skill ladder. One effect was to reduce pay bands, since the lowest levels had been moved upwards. Most employers saw this as a temporary measure, planning to increase rates for more skilled and supervisory staff when affordable. This was seen as necessary to give employees an incentive to stay rather than see their relatively higher pay fall. A representative of an employer body for the food processing sector expressed the views of a number of employers in explaining:
‘As the base gets higher, you see a squeeze on those mid-level roles…. People just aren’t willing to take that added responsibility for what is pretty much like a 5p pay rise or something like that.’
The squeeze on differentials was seen as presenting a challenge for affordability in industries where individuals can become more productive very quickly, at a relatively young age, and expect to be rewarded accordingly. As an employer in the hospitality sector explained:
‘You can have, for example, a 22 year old bar team leader who’s been working in the industry since they left college at eighteen and they’re really, really good and they’ve progressed their salary and then you take on somebody brand new, no bar experience and they happen to be twenty six and suddenly they’re coming in on more than their boss…. So we’ve had to hike up a lot of the salaries for lower level supervisory positions.’
Some employers therefore felt they had little choice but to pass on increases higher up the pay and skills ladder.
Impact on skills and productivity
Employers tended to agree with the aim of the NLW of raising skills, productivity and labour quality. This included boosting motivation and job satisfaction. A number of employers said they are aware of the difficulties faced by their employees of living on a tight budget and that job satisfaction, which can improve productivity, is important to their business. In particular, one supermarket employer emphasised the importance of job satisfaction and morale among employees in customer-facing roles.
To some extent the NLW was seen as encouraging recognition of the existing skills and responsibility of some low paid workers rather than boosting productivity and skill levels. For example, an employer in the social care sector said that the company welcomed the implementation of the NLW, feeling it was appropriate for their care staff, given their level of responsibility. One employer in the hospitality sector saw the NLW as encouraging a smaller, but more skilled workforce. Otherwise, employers did not generally feel that the NMW/NLW in themselves lead to productivity increases. Some employers saw limitations to increases in productivity which could be realised through pay mechanisms. Factors other than pay were seen to act as constraints on productivity. For example high turnover was seen as unavoidably high in low skilled work which reduces productivity. Employers in the hospitality sector believed
36

National Minimum Wage and National Living Wage impact assessment: counterfactual research
that the perception of the industry presented challenges in terms of recruiting people who believe the sector does not offer them suitable career opportunities.
A number of employers expressed the view that the NMW/NLW had reduced or removed the opportunity to use other approaches to payment, for example linked to productivity or to more finely grade roles and pay. As one employer in the holiday industry explained:
‘Something we want to do is introduce three grades of pay for different rates, for different job roles, so that when somebody first starts with us they would be on the basic rate and then move up and then move up again. But because we are fighting to stand still on just these increases, that’s not been an option we have been able to explore further’.
Another employer in the same industry had made a decision to delay introducing career and salary progression in its food and drink outlets because of the cost of the NLW to its business. However, it was revisiting this now because of anticipated labour shortages in the light of the UK’s departure from the EU.
However, one employer reported the reverse effect, with the NLW encouraging the introduction of a more graded banding system for care and nursing roles. This new structure more closely tied skills to pay bands and, by offering higher rates and career opportunities, improved recruitment and retention.
37
National Minimum Wage and National Living Wage impact assessment: counterfactual research
3.5 Impact of the NMW/NLW on investment and non-pay areas of expenditure
We asked employers whether, if being obliged to pay the NLW/NMW, they were less able to make investments or expenditure in areas of their business other than staffing. We also asked the same question of industry bodies. Responses were mixed, with a large retail company reporting that because of the increase in the pay bill resulting from NMW/NLW:
‘...money isn’t available for development; whether that’s employee development, whether that’s in developing the customer offer, whether that’s making investment in technology and digital capability that customers are expecting, there’s only so much funds that are available to do all of those things and, at the moment, payroll is being a priority’.
Similarly, a respondent from a large supermarket chain said that a reduction in pay expenditure would allow for more expenditure elsewhere and, on being pressed, referred to reviewing product ranges and technology.
A range of perspectives were found in the social care sector. A large employer in the hospitality sector said that having to pay the NMW/NLW makes choices about other areas of expenditure harder but that it had not affected such decisions in practice. Whilst a representative of the social care sector reported that some care homes had reduced expenditure on items such as entertainment and activity organisers. However, another representative from a different sector body in the social care sector felt that such constraints have resulted from inadequate funding for care rather than the NMW/NLW. Some impacts were reported in the hospitality sector: a representative of an employer body believed there had been an impact on expenditure in areas such as maintenance and refurbishment of hotel rooms. A brewery chain reported reduced interest in public house management as a result of higher wage costs which squeeze profit margins.
Employers in food manufacturing did not report impacts on non-pay areas of expenditure. Aside from the employers referred to above, many found it hard to engage in such discussion since they had already budgeted for future pay increases, as well as for capital expenditure.
More generally, while supporting the NMW/NLW, employers and representative bodies said that the NLW presented challenges in terms of affordability. As an employer representative for the social care sector stated:
‘In any other sector you would be able to transfer the cost to the consumer. But what we’ve seen is, because our major customer is local government, they just refuse to pay it so that’s where it squeezes the sector…. But we would like to see our staff on significantly more than the national living wage because of the complexity of the work they do’.
38
National Minimum Wage and National Living Wage impact assessment: counterfactual research
3.6 The counterfactual: setting wages in the absence of NMW/NLW
We asked employers about how they might set wage levels in the absence of the NMW/NLW. A number of employers, particularly larger ones, said they would continue to pay the rates since they believe they are both fair and work from a market perspective. However, they said they would also be very mindful, as always, of their competitors’ rates and would be influenced by these. A large employer in the retail sector said they anticipated that while some, including themselves, would expect to continue to increase wages, others would hold or reduce them. They cited budget supermarkets would be most likely to follow this route, pressurised by affordability and an emphasis on keeping product prices down. This could result in greater differentiation in pay both between and within sectors. Another large retail employer said they would expect to increase pay but not at the projected rate of increase in the NMW/NLW. They expected that ‘competitive positioning’ would take over. This was also the prevailing view of representatives of the employer bodies who cited current competition for labour, especially between the retail and social care sectors, as factors which could prevent large-scale reductions in pay.
Some employers stated that they would be looking to make much smaller increases in pay, of around 2 or 3 percent rather than the uplift that the NLW provides. They would therefore aim to increase pay in line with inflation.
Employers also thought it possible that they would look at freezing pay, at least for a while. One employer said that freezing the NMW/NLW at their current level would give them more flexibility around benefits involving salary sacrifice and paid holidays.
When asked if they would pay employees less, only one – an SME in the social care sector – said it definitely would. This respondent anticipated that it would lead to recruitment difficulties but that the board members making pay decisions would reduce pay nonetheless. At the same time, the view from an employer body for the care sector was that competitors in sectors such as retail would make the first move to reduce pay and that this would make the rates offered by the social care sector more attractive, although they might even fall. This respondent therefore argued ending the NMW/NLW would make it possible for employers to reward more highly for skills, funded by a fall in unskilled rates.
The response of many employers was that they would wait for others to make the first move. While some expected this to happen, such action was seen to potentially result in very high staff turnover and an extremely risky strategy to adopt. As one employer explained:
‘One firm would have to be the first to bid and they would lose all their staff. Now people are getting £7.50 in their pocket, it would be utterly impossible to come back from there. If I said to you, your wage is going to halve over night because the law has changed, you’d walk out’.
Some employers anticipated that businesses in their locality might reduce their pay rates and that theirs would become more competitive and attractive. They welcomed this prospect, at least to a degree. However, they felt it would also be a retrogressive step for the UK and its economy. As an employer in the hospitality sector expressed a personal view that:
‘Our business will only be as healthy as the communities they are in and if people haven’t got disposable income they are not going to eat in our pubs and drink in our restaurants are they? So yes, I would be horrified to see it go personally and probably commercially as well.’
39
National Minimum Wage and National Living Wage impact assessment: counterfactual research
This view was also expressed by other respondents, who believed that withdrawal of the NMW/NLW would lead to a low pay, low spend cycle which would damage the economy at a challenging time. In addition, as we discussed earlier, many of the employers interviewed expressed commitment to fair rates of pay and were broadly supportive of the NMW and NLW on those grounds. This view was expressed by employers across the industries covered.
In response to the question of what they might do if the NMW/NLW were frozen at their current rates, employers said this would depend on profitability over the course of the coming year. The UK’s withdrawal from the EU resulted in additional uncertainty for many respondents. However, employers did not believe that it would make a reduction in their wage bill possible.
Many employers expected that, whatever action they might take, discontinuing or freezing the NMW and NLW would lead to greater variation in pay at the lower end. They believed that a greater disparity would develop in the rates paid by larger organisations compared to SMEs. It was thought that smaller employers would be especially likely to cut wage rates for younger workers. However, at the same time, cutting wages of any group of workers was seen to run the risk of losing staff to higher paying competitors.
One employer, in the hospitality sector with a wage bill of £17 million, said they would introduce stronger banding of salaries than currently by introducing more difference by skill level. This was currently seen as difficult given the levels of the lowest rates of pay. This action would involve holding the base rate constant and introducing two new rates on top and would be done immediately. As this employer explained:
‘It would probably cost us the same, percentage wise, but actually give our team some sort of incentive to improve’.
The view from the trade union bodies was that the protection from low and exploitative pay provided by the NMW/NLW would end should they be discontinued. One representative referred to the impact of the abolition of wages councils in the 1993. They believed the way in which wages would be impacted could not be predicted, with the initiative as likely to come from larger as well as smaller employers. One view was that new rates would be likely to affect new hires rather than existing staff. The sectors most potentially affected were seen as including those covered by the qualitative research: agriculture and food, hospitality, retail and social care. Union representatives also predicted that such a move would lead to a widening of the gender pay gap, which had been narrowed by the introduction of the NMW and NLW. Employer bodies felt differently, that employers were generally supportive of the NMW/NLW and did not anticipate many would reduce pay. They cited interest in the Living Wage Foundation model5 as evidence for this.
5 According to the Living Wage Foundation there are 3,600 living wage employers across the UK.
40

National Minimum Wage and National Living Wage impact assessment: counterfactual research
3.7 Pressures on pay in absence of NMW & NLW
We asked employers, industry bodies and trade unions about what pressures might be exerted on pay in the absence of the NMW and NLW. The main pressure was seen as competition between employers for labour. As we described earlier, this was seen as a strong factor in preventing significant pay reduction should the NMW/NLW be discontinued. Employers expected that larger employers in particular would pay more and that this would put pressure on smaller employers. A number of respondents expressed the view that employers who reduced pay would place their businesses at risk by lowering employee quality and having unfilled vacancies.
We asked whether, for example, trade unions would gain more bargaining power through increased membership or support, or whether employees might simply vote with their feet. One employer in the food sector believed that unions would have more say over wage issues, building on an earlier point that the NLW and NMW had taken the heat out of pay negotiations. A large employer in the social care sector felt that any reductions in pay, including through wage freezes, would lead to increased unionisation in the sector. Some respondents thought that industry bodies might exert some pressure on pay, from their interest in increasing skills, productivity and the status of their sector. However, most respondents felt that individual decision-making would be the strongest source of pressure on pay in their respective sectors than either unions or industry bodies.
Trade union representatives themselves did not believe that withdrawal of the NMW and NLW would increase the power of trade unions by encouraging new membership. As evidence for this they cited lower rates of membership among workers who endure the poorest pay and conditions. The representative of an employer body remarked that, since young workers are likely to be most affected by changes in policy in relation to the NMW, unions would need to target their recruitment, campaigning and negotiations work at this group. This was seen as challenging given historically lower rates of unionisation among younger workers. At the same time, a higher minimum wage driven by government policy was seen to take credit away from unions as an influence on wage setting and its withdrawal might make unions appear more relevant to pay outcomes.
Interviews explored reputational influences: Pressure from consumers was discounted as a potential influence on pay. However, employer representatives were mindful of the ‘reputational risk’ to employers and sectors of low pay. One employer representative cited the media ‘naming and shaming’ of employers who breach the NMW as a deterrent on employers to pay unacceptably low rates. Another, in the food sector, cited widespread cooperation from employers in addressing the issue of modern slavery. This was driven, at least in part, from concern at the reputation of the sector.
One respondent from a large retailer argued that pressures on pay would remain broadly similar:
‘There are a lot of factors that go into our pay decision and you are just suggesting one of them is removed…. All of the conversations that happen around what is the right rate to be paying people would stay the same. The only difference is that there is a compliance issue to factor in’.
41

National Minimum Wage and National Living Wage impact assessment: counterfactual research
3.8 Conclusions from the qualitative research with employers and stakeholders
The NMW/NLW were used extensively by our case study companies and also commonly paid slightly above the rates for competitive reasons. Pay in the food and drink sector, including production roles in hospitality companies was somewhat higher. Employers did not like the proliferation of rates based around age because of the complexity they introduced but also from concerns of perceived fairness. Therefore, many employers operated more streamlined systems, paying most employees the NLW, or simply NMW for all workers under 25 years old. Employers were acutely aware of competition from employers in their localities and the propensity of employees to move jobs for small increases in rates, as well as for intrinsic rewards. Competition was reported to be particularly acute between the social care and retail sectors. A number of employers with multiple sites varied their rates between regions, taking account both of competition for staff and differences in cost of living.
Case study employers, and representative bodies, were generally favourable towards the NMW/NLW although the cost of uplifting to the NLW had been very high in many cases. While they agreed with the rates on the grounds of addressing low wage poverty, there was also a view that, without changes in job content and skills, they do not have a positive impact on productivity or on staff turnover.
A number of downsides to the NMW/NLW were raised. The first was the affordability of other benefits, including salary sacrifice for childcare, staff discounts, paid holiday and other non-pay benefits. Some employers said they had reduced these with the introduction of the NLW. Employers also reported that the NMW/NLW had led to a concertina effect on rates paid to supervisors and other semi-skilled jobs. This had affected incentives for low skilled workers to seek progression. Thirdly, employers argued that rates should not be national, giving variation in costs of living across the UK. Some employers also said they had been less able to afford to make investments in the business, but few examples were given of when pay pressures had such an impact.
Employers’ pay setting strategies and practices vary but a number reported establishing an overall budget and then making allocation decisions. The involvement of trade unions was not significant in the case study firms. Where they were involved, the nature of discussions was reported to have changed somewhat as a result of the NMW/NLW. In most of the case study companies the rates were treated as the standard for under and over 25s. Discussions therefore took place around the extent of uplift and whether increases were carried through to jobs at higher levels. The rates also impacted on employers’ practices in relation to non-pay benefits, as described earlier.
Employers had also generally moved the timing of increases to April, rather than increase pay at two or more points during the year. Individual, and sometimes small additional, adjustments were made in between time. The NLW was reported to have the effect of allowing pay increases to be planned, since rates are known in advance – subject to potential revisions.
We have described how the NMW/NLW have influenced decisions surrounding pay. However, other influences were important, especially in determining whether, and by how much, pay exceeded the rates. Profitability of the business was a deciding factor, and the possibility of passing on pay increases in the price of products and services. Employers also looked closely at inflation and costs of living. As described earlier, employers were highly attuned to rates paid by competitors. They also monitored turnover rates and used exist interviews to establish the role of pay in staff departures.
42

National Minimum Wage and National Living Wage impact assessment: counterfactual research
The research found evidence of spillover effects, first on the pay of younger workers who benefited from some employers’ practices of extending the NLW to all. Secondly, there was evidence of some negative spillover in decisions not to raise the pay of supervisory and other more skilled employees in line with the NMW/NLW increases. However, employers also believed they would have to address imbalances to avoid skill and labour shortages.
Employers and stakeholder organisations referred to other current pressures on pay, including the costs of the apprenticeship levy, pension auto-enrolment and business rates. All employers were nervous about the impact of the UK’s departure from the EU. Many anticipated future recruitment difficulties which might potentially be eased by an increase in the pay offer. However, other cost pressures on their business made it unlikely that they would increase pay, and that such measures would not ease recruitment difficulties in any case. A number of employers were looking at how they could upskill some roles and increase productivity to recoup higher wage costs, however the demand for low skilled labour remained very strong for many.
Some employers, in particular the larger ones, said that they would continue to pay the NMW/NLW should they be discontinued. Others thought it more likely that they would hold pay rates at their current level and consider changes to non-pay benefits. At the same time, it was clear that employers across sectors and of varying sizes, would be strongly influenced by competitors’ rates and would act accordingly. A number hoped that their competitors would act first, leading their employees to leave and easing their own recruitment difficulties.
A common view was that withdrawal of NMW/NLW would lead to greater differentiation in pay rates both between and within firms. The view from a trade union was that the gender pay gap would increase. One view, from employers was that pay rates for younger workers would be reduced first.
In the absence of NMW/NLW, the main pressure on pay was predicted to come from workers’ own choices. Trade unions, as well as employers, did not expect that reductions in pay would necessarily fuel increases in unionisation. Employer bodies were seen to exert some influence over issues such as skills, but less so on pay issues. Pressure from consumers was not seen as a factor although employers and representative bodies were aware that paying unacceptably low rates attracts bad publicity and is something that employers would wish to avoid. Nonetheless, the issue of most concern to employers was that reducing their pay rates might make recruitment difficult, unless competitors were to reduce theirs further.
43

National Minimum Wage and National Living Wage impact assessment: counterfactual research
4. Review of the current model
4.1 The current approach to modelling counterfactual wage growth
The existing BEIS impact assessment (IA) model estimates the costs to employers associated with an increase in the UK minimum wage. The model is predicated on a forecast of counterfactual wage growth, which is defined as the expected wage growth if the most recent national minimum wage uprating had not been applied. The costs of the minimum wage uprating are measured as the difference between the proposed minimum wage rate and the counterfactual, until the counterfactual catches up to the proposed minimum wage rate.
The current model follows the recommendation of academics (see below) and takes as a starting point that counterfactual wage growth should lie between a lower bound, defined by the rate of CPI inflation, and upper bound defined by average earnings growth, as forecast by the Office for Budget Responsibility (OBR). In the absence of guidance as to where between these lower and upper bounds counterfactual wage growth should lie, the model assumes that counterfactual wage growth is given by the midpoint between CPI inflation and the OBR’s forecast for the rate of average earnings growth.
Importantly, the approach then discards the estimated effect of previous minimum wage increases which would accrue following the most recent uprating if employers were still able to pay at the counterfactual wage related to the previous uprating. Thus, the current approach only assesses the impact of the current NMW/NLW uprating, rather than the cumulative impact of previous upratings.
The estimated costs are dependent on the OBR forecasting. As pointed out in the 2017 impact assessment, BEIS use different forecasts compared to what is used by LPC for the autumn report 2016. While the LPC provides estimates of coverage of the new rate using the median of the forecasts produced by HM Treasury panel of independent forecasts, BEIS uses the OBR average hourly earnings forecasts. In our view, it would be useful to include a sensitivity analysis in which the forecast for counterfactual wage growth used in the model is based on the median wage growth of independent forecasters (the LPC approach).
A previous approach used by BEIS/BIS made an estimate of the costs for the mid-point of the appraisal period, based on the difference between observed and counterfactual wage at that point, and multiplied this by the number of quarters it was estimated it would take until the counterfactual wage increased to equal the new national minimum wage. The new approach uses the difference at multiple time points to account for the reduction of the gap as the counterfactual wage increases, for a more granular estimate of the costs of the minimum wage uprating over time.
In addition, the cost to business estimated by the current model is the result of direct and indirect effects of the NMW/NLW on wages. This distinction is due to the role played by spillover effects on wages of workers who are already earning above the proposed level of the minimum wage. Such spillovers might, for example, be motivated by the desire of some employers to maintain wage differentials between workers with differing levels of skill or responsibility. The current model assumes a maximum spill-over impact of 20%, decreasing to zero at the 25th percentile of the wage distribution.6 Some UK studies find no evidence of
6 See the literature review for a more detailed discussion of the empirical evidence on minimum wage spillovers.
44
National Minimum Wage and National Living Wage impact assessment: counterfactual research
spillovers, including Stewart (2012), who finds little evidence of any spillover effects beyond the 5th percentile between the NMW introduction and 2007. However, Manning (2012) argues that spillover effects of the NMW could be larger than previously estimated in the future (relative to 2012), as the minimum wage increases relative to the median wage. This has become particularly relevant with the introduction of the NLW, which aims to reach 60% of the median wage by 2020, subject to sustained economic growth. Butcher et. al. (2012) finds some evidence of spillovers up to the 25th percentile, albeit with a lag. Butcher, et. al. (2012) also argues that spillover effects might increase as the bite of the minimum wage increases. Further, preliminary evidence in Machin et al (2016), based on care homes, suggests the presence of spillover effects for people aged under 25.
Meanwhile the qualitative evidence is mixed: Some employers reported positive spillover effects, particularly on the pay of younger workers who benefited from the practice of extending the NLW to all, but there was also evidence of negative spillovers whereby employers held down the wages of supervisors to recoup some of the increased costs of employing more junior workers.
In light of the mixed evidence in terms of the qualitative research and empirical work for the UK, we believe that a 20% spillover is an appropriately conservative assumption.
Given the important role that measurement error can play in producing biased estimates, the choice of a database that may reduce such risk is fundamental. The current practice of using ASHE as the primary source for wage data seems the most appropriate. ASHE data for employee wages is provided by employers, who seem more likely to report correct wages, earnings and working times, as their record-keeping is likely to be superior to that of households, which is the case with the LFS.
The second set of costs associated with the NMW/NLW upratings is “non-wage” costs such as pension contributions and employers’ National Insurance Contributions (NICs). Such costs are obtained by uprating the wage bill impacts by 20.2%. This figure is from Eurostat analysis for 2015 and is likely to be an overestimate because it does not account for the fact that some workers do not meet the national insurance contribution threshold. This could potentially be addressed using ASHE data which allows for the identification of whether the NIC threshold is met.7 However, this figure does not seem to account for auto-enrolment for pensions, which is being rolled out progressively, and will add up to 4% of the wage bill to employment costs by 2018.
Lastly, following the recommendation of the Better Regulation Framework Manual (March 2015), the model implementation assumes 100% compliance. Evidence from care home sectors provided by Dickens and Manning (2004) gives evidence that is consistent with this finding, suggesting the assumption could be realistic, although the study reflects an earlier stage in the history of the minimum wage and may be less appropriate in today’s context.. However, this is a highly regulated sector and it is difficult to assess whether firms use of NMW avoidance strategies such as the use of the ‘self-employment’ status in the gig-economy has increased over the last decade. In addition, assuming full compliance is a conservative estimate, as it tends to overstate the costs to businesses from NMW/NLW upratings.
The element of the current model to which estimated costs are most sensitive is the construction of the counterfactual which currently follows the suggestion of academics and
7 However, the limitation of ASHE data in this context is that employees who do not meet the NIC threshold are not necessarily included in the sample.
45

National Minimum Wage and National Living Wage impact assessment: counterfactual research
uses a wage growth between the inflation rate and the average earnings growth for workers directly affected, in addition to a correction for spillovers up to the 25th percentile of the earnings distribution.
In the next sub-section, we first report on interviews with academic and regulatory policy experts, in order to obtain expert advice on the suitability of the current method and of alternatives. Then, in the next section, we go on to implement some of these alternative methods for constructing wage counterfactuals.
46

National Minimum Wage and National Living Wage impact assessment: counterfactual research
4.2 Assessment by academics and further suggestions from interviewing experts
As part of the review of the current model, we conducted a number of interviews with experts on UK labour markets and impact assessments. Table 3 gives a full list of experts consulted.
Table 3: Experts consulted
Name Title Affiliation
Tim Butcher Chief Economist Low Pay Commission
Richard Dickens Professor of Economics Commissioner
University of Sussex Low Pay Commission
Steve Machin Professor of Economics Director
London School of Economics Centre for Economic Performance
Hiroko Plant Head of Secretariat Regulatory Policy Committee
Ken Warwick Member Regulatory Policy Committee
Views of academic experts
The first group of interviewees was composed of academic experts in empirical labour economics, with a focus on leading academics who had published on the impact of the NMW on UK wages and other labour market outcomes. All of the experts consulted have led studies on the impact of the NMW on the UK labour market for the Low Pay Commission. We consulted with academic experts on two main areas: their opinion of the simple rules for counterfactual wage growth used in the current and recent impact assessments, and their opinions on proposed improvements. In some cases, academic experts were able to provide us with alternative strategies for constructing the wage counterfactuals, which we have then sought to implement.
Most of the academic experts consulted emphasised that constructing counterfactual wages for low-wage workers was a very difficult task indeed. This task is made particularly difficult for the UK due to the lack of regional or sectoral variation in NMW/NLW upratings or coverage. This makes finding appropriate counterfactual groups quite difficult. Most of the experts consulted were not convinced that looking at UK wage growth for the pre-1999 period, before the NMW was introduced, was very useful, as too much had changed in the intervening two decades.
It was put forth that a common approach to defining the counterfactual in difference-in-differences studies was to use the wage growth of workers with initial wages just over the incoming NMW or NLW rate. However, all of the academic experts also expressed concern about spillovers of the NMW or NLW to workers somewhat higher up in the wage distribution, perhaps due to a desire to maintain pay differentials. This is consistent with the findings from discussions with employers reported in a previous section in this report, as many employers indicated concern that wage differentials between workers with differing levels of skill or responsibility were being eroded, and that wages would soon need to be adjusted for workers currently earning above the current NLW. Employers also indicated that maintaining wage differentials might be important for providing incentives for workers to progress.
One emerging suggestion was that estimates of the impact of NMW/NLW upratings on the wage distribution be used to define the appropriate counterfactual group. In particular, it was
47

National Minimum Wage and National Living Wage impact assessment: counterfactual research
suggested that if there was evidence of spillovers up to the 25th percentile of the wage distribution, then using the growth of wages immediately above the 25th percentile would make for an appropriate counterfactual. However, it was noted that BEIS would need to re-run the underlying regressions each year, to ensure that spillovers did not begin to encroach on wages above the 25th percentile. This was seen to be a particular concern if the pace of upratings in the NLW were to continue, as this would lead to substantially larger shares of workers covered by the NLW, and hence potentially lead to spillovers even further up the wage distribution.
It was suggested that in future, recent rates of wage growth for workers under 25, who are not eligible for the NLW, might be a useful proxy for wage growth of workers aged 25 and over, who are affected by NLW increases. However, it was also suggested that this might not be an appropriate counterfactual group due to the presence of spillovers. One potential spillover that was described was that firms might fail to take advantage of the ability to differentiate pay across ages.8 Another concern was that firms might be limited in their ability to shift employment to workers aged under 25 by the relatively small size of this group, pushing up demand and hence inducing positive spillovers of NLW upratings onto wages of this group.
The academic experts consulted generally took the view that using the Office of Budget Responsibility’s forecasts of average earnings as a proxy for the counterfactual was inappropriate. One view expressed was that average earnings growth was likely to overstate wage growth for workers at the lower end of the distribution. Another concern was that the OBR’s average earnings forecasts had been consistently too optimistic, perhaps due to an assumption that UK productivity would return to its pre-crisis trend, when in fact this reversion to trend has yet to materialise. This would seem to be a reasonable criticism in light of the OBR downward revision to their productivity estimates in October 2017.
Views on the appropriateness of the assumption that counterfactual wages might not increase at all, or might only increase at the rate of inflation were more nuanced. While most academic experts consulted expressed the view that real wage growth in the absence of the NMW or NLW might be very low, they also believed that it was important to underpin such an assumption empirically. Because the Impact Assessment is predicated on nominal wage growth, the view that real wage growth could be close to zero translates into nominal wage growth close to the rate of inflation. This would support the current BEIS approach which considers zero nominal wage growth to be an unlikely counterfactual.
One particularly useful suggestion which emerged was to take wage growth among workers in low-paid occupations and/or industries, as defined by the Low Pay Commission, in between annual NMW/NLW upratings. One challenge in implementing this approach is that truly longitudinal wages are only observed at an annual frequency: ASHE data is annual, and the Quarterly Labour Force Survey (QLFS) only collects wage data at an annual frequency (i.e. in the first and fifth quarters for each individual). One of the academic experts consulted suggested that one could construct pseudo-panels consisting of average quarterly wages for workers in low wage occupations and/or industries. One could then use the quarterly growth rates in wages for periods which do not span a minimum wage uprating as a proxy for counterfactual wage growth. However, another academic expert consulted cast doubt on the validity of this strategy. The concern was that any counterfactual wage growth rates constructed using such ‘interstitial’ pseudo-panels might be biased downwards, as many employers now time their wage increases for all workers to coincide with NMW/NLW upratings. Indeed, this is supported by the qualitative interviews with employers discussed earlier in this
8 In fact, this concern is borne out by the qualitative research conducted with low pay employers reported earlier in this report.
48

National Minimum Wage and National Living Wage impact assessment: counterfactual research
report. In addition, it might be the case that firms might not increase the wages of NMW/NLW workers in between upratings due to anticipation of future upratings, a finding that was borne out by the qualitative research.
Views of experts from the Regulatory Policy Committee regulatory policy
Our second group comprised experts in regulatory policy, both of whom are affiliated with the Regulatory Policy Committee (RPC). Our discussion was led by Ken Warwick, an external member of the RPC and former chief economist at the Department for Business, Innovation and Skills, and by Hiroko Plant, Head of Secretariat for the RPC. They were accompanied by two more junior members of the RPC Secretariat. The discussion with Ken Warwick and the RPC Secretariat focused around the RPC’s concerns from previous reviews of the impact assessments about the current methodology for constructing wage counterfactuals, and whether our proposed improvements would address those concerns.
The RPC experts expressed two main concerns. First of all, concern was raised that the OBR’s forecasts for average earnings would be inappropriately high proxies for the counterfactual wage growth of low-paid workers, and would hence bias the estimated costs of NMW/NLW upratings on businesses downwards. The quantitative approach taken in this report was described to the RPC members, and agreement was reached that if implemented correctly, this approach had the potential to address the concerns about the downward bias on the costs of NMW/NLW upratings.
The second main issue concerned the cumulative effects of previous NMW/NLW upratings. That is, one of the RPC experts found it inappropriate to take the current NMW/NLW rate as a baseline for estimating the costs to the current uprating. Rather, the view was expressed that BEIS should include the costs to employers from previous upratings, if the counterfactuals used for those previous upratings implied that wages would not yet have ‘caught up’ to the current NMW/NLW level. It was agreed that it would be desirable to investigate the feasibility of producing the counterfactuals in such a way as to estimate the expected duration until wages had caught up to the NMW, and to investigate the feasibility of including the costs to business accruing from past NMW upratings, although the impact assessment still needs to be a marginal appraisal. However as we discuss below, this would be difficult to estimate robustly and is complicated by the adjustments to technology and the mix of jobs that occurs following a minimum wage uprating.
49
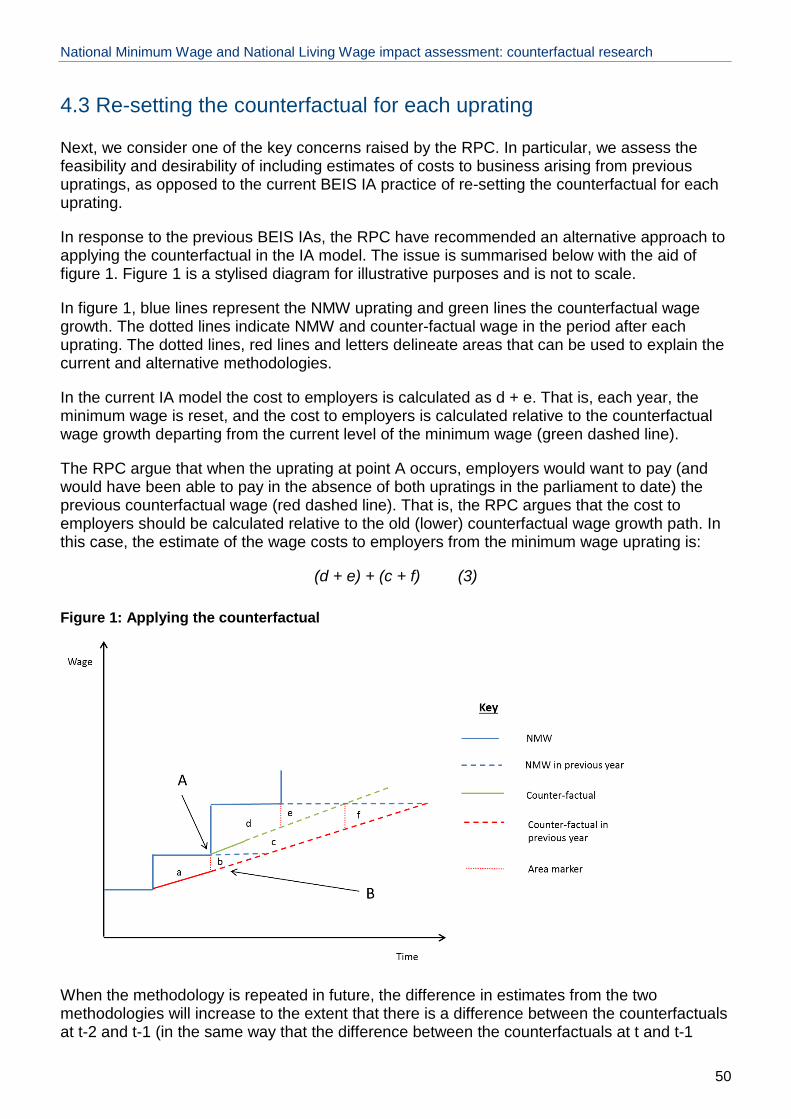
National Minimum Wage and National Living Wage impact assessment: counterfactual research
4.3 Re-setting the counterfactual for each uprating
Next, we consider one of the key concerns raised by the RPC. In particular, we assess the feasibility and desirability of including estimates of costs to business arising from previous upratings, as opposed to the current BEIS IA practice of re-setting the counterfactual for each uprating.
In response to the previous BEIS IAs, the RPC have recommended an alternative approach to applying the counterfactual in the IA model. The issue is summarised below with the aid of figure 1. Figure 1 is a stylised diagram for illustrative purposes and is not to scale.
In figure 1, blue lines represent the NMW uprating and green lines the counterfactual wage growth. The dotted lines indicate NMW and counter-factual wage in the period after each uprating. The dotted lines, red lines and letters delineate areas that can be used to explain the current and alternative methodologies.
In the current IA model the cost to employers is calculated as d + e. That is, each year, the minimum wage is reset, and the cost to employers is calculated relative to the counterfactual wage growth departing from the current level of the minimum wage (green dashed line).
The RPC argue that when the uprating at point A occurs, employers would want to pay (and would have been able to pay in the absence of both upratings in the parliament to date) the previous counterfactual wage (red dashed line). That is, the RPC argues that the cost to employers should be calculated relative to the old (lower) counterfactual wage growth path. In this case, the estimate of the wage costs to employers from the minimum wage uprating is:
(d + e) + (c + f) (3)
Figure 1: Applying the counterfactual
When the methodology is repeated in future, the difference in estimates from the two methodologies will increase to the extent that there is a difference between the counterfactuals at t-2 and t-1 (in the same way that the difference between the counterfactuals at t and t-1
50

National Minimum Wage and National Living Wage impact assessment: counterfactual research
leads to the increase in costs represented by the area c + d). As such a clear recommendation about which is the most sensible approach is required to avoid the difference becoming a bigger issue over time.
Strictly speaking, in order for this approach to give an accurate assessment of the long term impact of the minimum wage, the red dashed line would need to represent the counterfactual path of wages in the absence of any type of minimum wage policy. As a result, the alternative approach relies on the availability of a credible estimate of the counterfactual path of wages in the absence of any type of minimum wage policy. It would also be possible to consider a red dashed line which represents the counterfactual path of wages departing from the level of the minimum wages which was in effect one, two, or more years ago. It is this latter approach which we consider more carefully in what follows.
In theory, this approach allows for the broadest definition of the costs to business from the existence of minimum wages. However, counterfactual wage growth paths are inherently unobservable, and hence not falsifiable. As a result, it is not possible to assess how accurate past counterfactual wage growth paths have been. In what follows, we discuss three issues that are important in deciding whether to reset the counterfactual for each uprating or to include the impact of past upratings: forecast accuracy over longer horizons, asymmetries in forecast errors and changes in the composition of jobs.
4.3.1. Forecast accuracy and forecast horizon
Our main concern is that the RPC alternative method’s reliance on long-term estimates of counterfactual wage growth could introduce substantial uncertainty into the estimate of the costs to business of a minimum wage uprating, rendering them less meaningful.
The RPC’s alternative approach relies on the counterfactual wage forecasts of past years. Thus, in order to implement the RPC approach, accurate forecasts of the counterfactual wage growth for two, three or more years would be necessary. However, as the Bank of England’s fan charts for its inflation forecast demonstrate, forecast errors become progressively larger as the forecast horizon increases.9 For example, in the August 2017 fan chart (reproduced below), the error bands around the Bank’s forecast of inflation of 2.2% at a 3-year horizon are quite substantial. The Bank’s best judgement as of August 2017 is that inflation 3 years ahead will lie between about 1% and 3.5% with 60% probability, while the 90% confidence band appears to span a range of 5 percentage points, between just under 0% and just under 5%. The uncertainty of the Bank’s GDP growth forecasts is even greater, with a 90% confidence band around the 3-year ahead point forecast of 1.8% covering GDP growth lying between -1% and nearly 5%.
9 Bank of England Quarterly Inflation Report, August 2017.
51

National Minimum Wage and National Living Wage impact assessment: counterfactual research
Chart 1: CPI inflation projection based on market interest rate expectations, other policy measures as announced
Source: Bank of England, August 2017, Quarterly Inflation Report.
Moreover, the Bank of England considers its own forecasts of nominal wage growth have been subject to a bias towards overly optimistic estimates of future nominal wage growth since 2014.10 The Bank’s February 2017 Inflation Report includes a helpful figure (reproduced below) which shows how wage growth forecasts are updated each year (or quarter), as new information on outturns becomes available.11 That is, the 3-year ahead forecast of February 2014 for wage growth in 2017 is updated in February 2015, using information on outturns between those dates. As a result, the February 2015 forecast for 2017 is transformed into a more accurate 2-year ahead forecast.
Chart 2: Wage growth has failed to pick up in line with past projections
Source: Bank of England, February 2017, Quarterly Inflation Report
10 Any asymmetries in forecast errors would be a further complication, which we discuss in the next point. 11 Bank of England Quarterly Inflation Report, February 2017, Charts A and B on page 18.
52
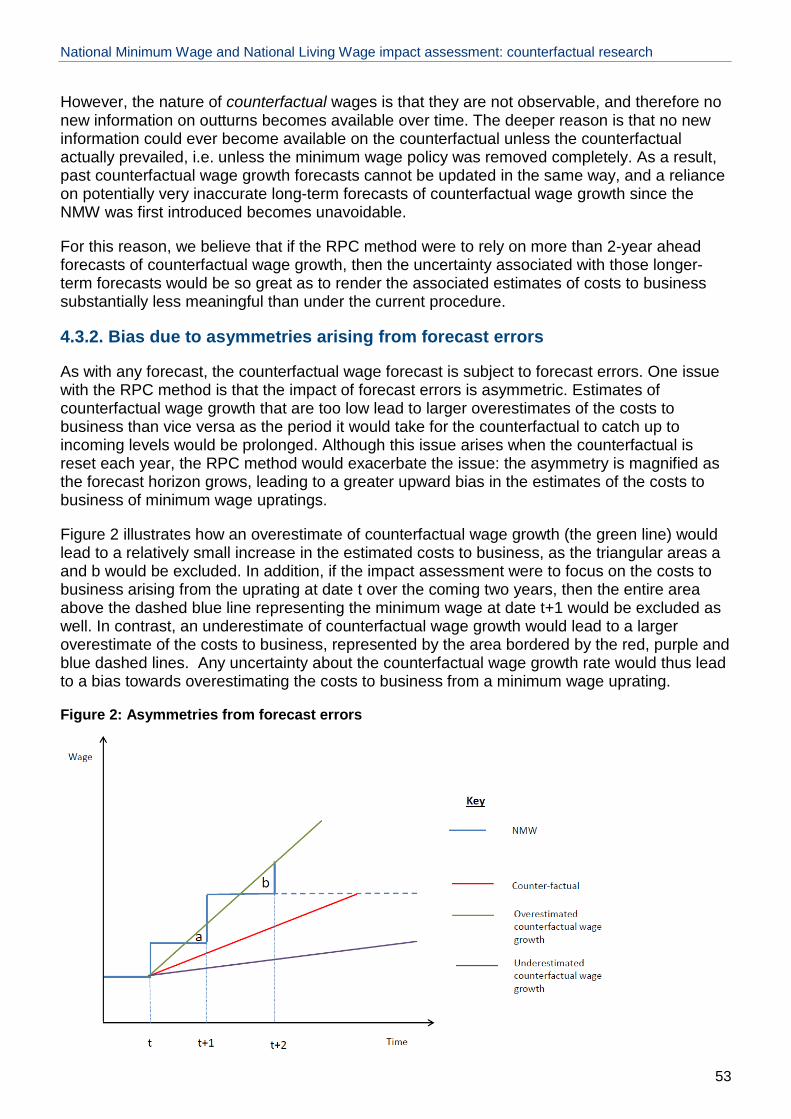
National Minimum Wage and National Living Wage impact assessment: counterfactual research
However, the nature of counterfactual wages is that they are not observable, and therefore no new information on outturns becomes available over time. The deeper reason is that no new information could ever become available on the counterfactual unless the counterfactual actually prevailed, i.e. unless the minimum wage policy was removed completely. As a result, past counterfactual wage growth forecasts cannot be updated in the same way, and a reliance on potentially very inaccurate long-term forecasts of counterfactual wage growth since the NMW was first introduced becomes unavoidable.
For this reason, we believe that if the RPC method were to rely on more than 2-year ahead forecasts of counterfactual wage growth, then the uncertainty associated with those longer-term forecasts would be so great as to render the associated estimates of costs to business substantially less meaningful than under the current procedure.
4.3.2. Bias due to asymmetries arising from forecast errors
As with any forecast, the counterfactual wage forecast is subject to forecast errors. One issue with the RPC method is that the impact of forecast errors is asymmetric. Estimates of counterfactual wage growth that are too low lead to larger overestimates of the costs to business than vice versa as the period it would take for the counterfactual to catch up to incoming levels would be prolonged. Although this issue arises when the counterfactual is reset each year, the RPC method would exacerbate the issue: the asymmetry is magnified as the forecast horizon grows, leading to a greater upward bias in the estimates of the costs to business of minimum wage upratings.
Figure 2 illustrates how an overestimate of counterfactual wage growth (the green line) would lead to a relatively small increase in the estimated costs to business, as the triangular areas a and b would be excluded. In addition, if the impact assessment were to focus on the costs to business arising from the uprating at date t over the coming two years, then the entire area above the dashed blue line representing the minimum wage at date t+1 would be excluded as well. In contrast, an underestimate of counterfactual wage growth would lead to a larger overestimate of the costs to business, represented by the area bordered by the red, purple and blue dashed lines. Any uncertainty about the counterfactual wage growth rate would thus lead to a bias towards overestimating the costs to business from a minimum wage uprating.
Figure 2: Asymmetries from forecast errors
53

National Minimum Wage and National Living Wage impact assessment: counterfactual research
4.3.3. Composition of jobs
Another issue concerns the dynamic impact of the minimum wage on the production process, in particular the composition of jobs in the economy. The costs to business being assessed are the direct costs of increased wages to currently existing jobs, assuming that those jobs would continue to exist after the increase in the minimum wage.
However, the level of the minimum wage may have an influence on the types of jobs in the economy. From first principles, a higher minimum wage will make some kinds of low-productivity jobs unprofitable, and we can expect the technologies employed in the production of goods and services to shift to favour higher-productivity jobs. The larger the gap between the current or prospective level of the minimum wage and the ‘deep’ counterfactual minimum wage (i.e. in the absence of any minimum wage policy), the larger we would expect the impact on the types of jobs in the economy.
If the lowest productivity jobs are destroyed due to a minimum wage increase, it is not appropriate to count increased wage costs from jobs which no longer exist as a ‘cost’ to businesses. Moreover, it is not at all clear whether shifting to a technology which creates higher productivity jobs imposes any cost at all on employers. In the longer term, production technology is endogenous, that is, wages affect the firm’s choice of technology. In particular, significant wage increases from the introduction of the NLW might accelerate technological or organisational change, as firms seek to increase productivity in line with mandated wage increases (Riley and Rosazza Bondibene, 2015). That is, we would need to understand at a much deeper level how wages are determined for different kinds of technologies. In principle, the employer surplus from higher productivity jobs could be smaller, the same size, or even larger than the surplus from the lower productivity jobs that were destroyed.
Synthesis
Taking all of these factors into account, we recommend that BEIS continue to use its current method of re-setting the counterfactual, so as to take the current level of the minimum wage as the starting point for the counterfactual analysis.
54

National Minimum Wage and National Living Wage impact assessment: counterfactual research
4.4 Recommendations for counterfactual wages
From the review of the model, including consultations with academic experts in minimum wages and labour markets and with regulatory policy experts, and supported by findings from the stakeholder interviews and the literature review, we formulate a quantitative approach for estimating counterfactual wages. The key elements of the quantitative approach are:
• Obtaining an estimate of the lowest percentile 𝑝𝑝∗ of the wage distribution at which there are no spillovers from minimum wage upratings
• Using demographic and firm demographic variables which are known from the literature to be important for wage growth to estimate counterfactual wages
• Focusing mainly on the current counterfactual
55

National Minimum Wage and National Living Wage impact assessment: counterfactual research
5. Estimating the counterfactual
5.1 Introduction
In this section we consider two approaches to estimating counterfactual wage growth. Approach 1 uses the methodology in Butcher et al (2012) which exploits area, age and gender variation in average wages, interacted with the aggregate change in the bite of the NMW, to estimate the impact of minimum wage upratings on wages at different points in the wage distribution. Approach 1 also estimates the impact of a range of demographic and firm-demographic control variables on wages at different points in the wage distribution. Counterfactual wages could then be estimated using only the control variables, excluding the impact of the minimum wage. Approach 2 uses the LFS to construct a pseudo panel to estimate wage growth for Low Paying Occupations, as defined by the LPC, at different points in the wage distribution.
As we show below, we find that the control variables in approach 1 have insufficient explanatory power to provide a viable estimate of counterfactual wage growth. However, there is consistency in terms of which points in the wage distribution are affected by the minimum wage upratings and we can conclude that to date minimum wage upratings appear to affect wages up to the 15th percentile of the distribution but do not affect wages at the 20th percentile.
The descriptive approach 2 is sensitive to the measure of wages used and the proximity of the quarters used to the next uprating. However, we find that using growth in ‘hourly rates’ (using only those people who report wages on an hourly basis) rather than ‘hourly pay’ (for whom wages are reported on some other basis and hourly pay is estimated from reported working hours) provide plausible measures of the wage growth at different percentiles of the wage distribution. Approach 1 can therefore be employed to understand at which percentiles the wage growth is significantly affected by the uprating of minimum wages, and empirical growth rates at the lowest percentile of the wage distribution unaffected by the upratings would represent a measure of counterfactual wage growth in the absence of NMW/NLW uprating applied in the impact assessment.12
There is evidence that wage growth followed a very different trajectory before and after the financial crisis of 2008. For the period 2001 to 2007 we estimate quarterly nominal wage growth at the 20th percentile of 1.1% compared to 0.6% for the period 2008 to 2016, and 0.8% for 2001 to 2016 (tables 7, 8 and 6, respectively). There is also some tentative evidence that the pattern has varied since the crisis, possibly due to the uneven path of the return to recovery. For the period 2010 to 2016 we estimate wage growth at the 20th percentile of 0.5% compared to 0.9% for the period 2014 to 2016. Tables A2.2 and A2.3 in the annex respectively).
12 We check for spillovers in 5-percentile steps, i.e at the 10th percentile, the 15th percentile, the 20th percentile and so on.
56

National Minimum Wage and National Living Wage impact assessment: counterfactual research
5.2 Approach 1: Estimate the impact of the change in the bite of the NMW along the wage distribution
Data and modelling approach
This section explores the construction of counterfactual wage growth forecasts using the results from a panel regression model designed to estimate the impact of increases in the minimum wage on different points in the wage distribution. The model allows for wage growth at each point in the wage distribution to be influenced by both changes in the bite of the minimum wage and by demographic and firm-demographic control variables. Counterfactual wages (i.e. wages that would be observed in the absence of a change in the minimum wage level) could then be estimated by excluding the impact of the minimum wage bite, and focusing only on the impact of the control variables. By estimating wage growth at different points in the wage distribution, this approach allows us to take into account spillovers of minimum wage upratings on the wages of higher paid workers who are not directly affected by the minimum wage uprating.
The model employed is based on the model presented in Butcher, et al (2012), which takes the form:
Where:
• is the change in wages in the p-th percentile of the wage distribution in labour market segment r in year t,
• is the change in the bite of the minimum wage between years t and t-1,
• I is a measure of average wages in labour market segment r, and
• is a vector of segment-year specific controls.
The labour market is divided into roughly 900 different market segments by age (under 25 and at/over 25), by gender, and by travel to work area. Thus, the model exploits segment level variation in average pay, interacted with aggregate change in the bite at the NMW), to estimate the impact of minimum wage upratings on wages at different points in the wage distribution. As discussed by Butcher et al (2002), this identification strategy is based on the idea that the changes in the bite of the NMW should have a larger effect in low-wage areas than high-wage ones.
We used a range of databases to obtain the variables of interest, in particular the Annual Survey of Hours and Earnings (ASHE), the Labour Force Survey (LFS) and the Annual Business Survey (ABS). In particular, we used ASHE to extract information on hourly wages. We preferred the wage measure contained in ASHE because it contains data on wages provided by employers and, as consequence, is less subject to misreporting than the household survey data in the LFS. However, ASHE contains very little demographic data. Instead, the more detailed demographic data in the LFS is used to obtain information on segment level control variables such as education level, the unemployment rate, the share of permanent and part-time workers and the share of workers in low paid occupations (as defined by the LPC). We also use the LPC list of low pay industries to obtain the share of firms in low pay industries for travel to work areas using ABS data. Other variables extracted from ABS include the share of local area employment in SMEs and/or large firms, a measure of wage costs, and measures of firm profitability.
57

National Minimum Wage and National Living Wage impact assessment: counterfactual research
The construction of a dataset including all the above variables presented some challenges. It was not possible to define time-consistent segments using the datasets in their original form. For example, the travel to work areas changed over time with the ONS using new definitions in 2006 and 2011.
We constructed consistent travel to work areas by mapping the most recent definition of travel to work areas to postcode sectors (postcodes excluding the last two letters) for ASHE and ABS13. Similarly, to construct a consistent series for the LFS, the latest definition of travel to work areas (which changed in 2011) was mapped to lower layer super output areas (LSOA)14.
Merging the three datasets generated a database for the period 2004-2016. We were unable to construct a database for earlier years due to the inconsistency of the travel to work areas over time. Our final data set contains a pseudo panel of cross sections that is complete back until 2004, covers 2004 onwards for the LFS and ABS and covers 2000 onwards for ASHE.
Using the constructed dataset and equation (1), we estimated separate regression models for the 5th, 10th, 15th, 20th and 25th percentiles of real hourly earnings excluding overtime (base year 2015). Because of the different measure of average wages per segment used in Butcher et al (2012), our specification uses a linear term for average wages instead of the exponential term. The authors state in the paper that using average earnings instead of the exponential gave similar results.
Moreover, our database includes the years of the financial crisis and this could potentially lead to a structural break in our dependent variable. This is due to a strong shift in the pattern of real wage growth after the crisis which could cause the model to become invalid unless it is controlled for. We address this issue by proposing the following revised version of equation (1):
where 1 is an indicator variable which takes the value one for years 2008 onwards and zero otherwise. Interacting this post-crisis dummy variable with the change in the bite of the minimum wage variable and the covariates , allows the effect of these variables on wage growth to differ between pre- and post-crisis periods.
Exploring the data: summary statistics
As previously mentioned, the panel dataset covers the period 2004-2016 and it is the result of a merging exercise using travel to work areas and involving ASHE, LFS and ABS databases. In the following we present the period averages and standard deviations for the variables used in the estimated models.
The summary statistics for the percentiles of the average hourly earnings in real terms (CPI 2015=100, and expressed in pence) show that the mean for the period of interest is 530.14 for the 5th percentile, and increases to 776.67 pence for the 25th percentile. The average of the
13 ONS Travel to work areas represent local areas in which of the resident economically active population three quarters work in the area and of everyone working in the area 75% live in the area (228 areas, 149 TTWAs in England, 45 in Scotland, 18 in Wales, 10 in Northern Ireland and 6 cross-border TTWAs), see www.ons.gov.uk/employmentandlabourmarket/peopleinwork/employmentandemployeetypes/articles/traveltoworkareaanalysisingreatbritain/2016. 14 Lower Layer Super Output Areas (LSOA) can be linked to Travel to work areas as they represent small local aggregates. There are at present 34,753 lower layer super output areas (LSOAs) in England and Wales, which form the empirical database used in the following, see ( www.ons.gov.uk/methodology/geography/ukgeographies/ censusgeography).
58
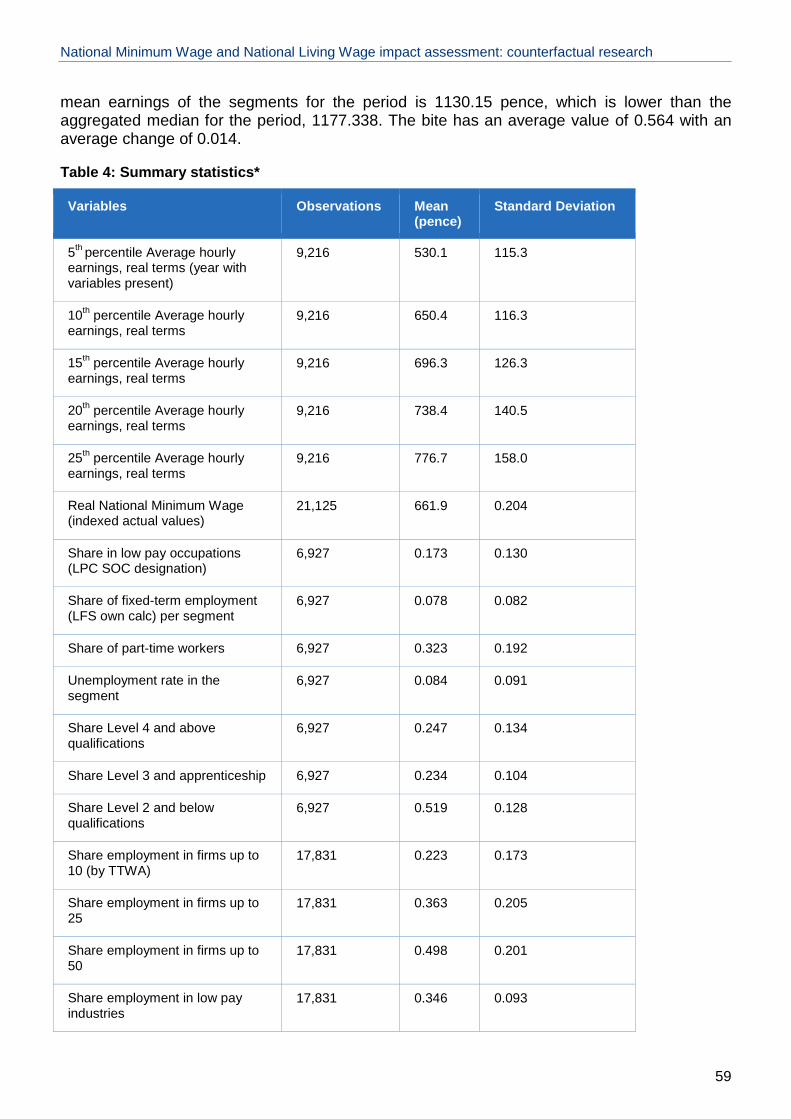
National Minimum Wage and National Living Wage impact assessment: counterfactual research
mean earnings of the segments for the period is 1130.15 pence, which is lower than the aggregated median for the period, 1177.338. The bite has an average value of 0.564 with an average change of 0.014.
Table 4: Summary statistics*
Variables Observations Mean (pence)
Standard Deviation
5th percentile Average hourly earnings, real terms (year with variables present)
9,216 530.1 115.3
10th percentile Average hourly earnings, real terms
9,216 650.4 116.3
15th percentile Average hourly earnings, real terms
9,216 696.3 126.3
20th percentile Average hourly earnings, real terms
9,216 738.4 140.5
25th percentile Average hourly earnings, real terms
9,216 776.7 158.0
Real National Minimum Wage (indexed actual values)
21,125 661.9 0.204
Share in low pay occupations (LPC SOC designation)
6,927 0.173 0.130
Share of fixed-term employment (LFS own calc) per segment
6,927 0.078 0.082
Share of part-time workers 6,927 0.323 0.192
Unemployment rate in the segment
6,927 0.084 0.091
Share Level 4 and above qualifications
6,927 0.247 0.134
Share Level 3 and apprenticeship 6,927 0.234 0.104
Share Level 2 and below qualifications
6,927 0.519 0.128
Share employment in firms up to 10 (by TTWA)
17,831 0.223 0.173
Share employment in firms up to 25
17,831 0.363 0.205
Share employment in firms up to 50
17,831 0.498 0.201
Share employment in low pay industries
17,831 0.346 0.093
59

National Minimum Wage and National Living Wage impact assessment: counterfactual research
Variables Observations Mean (pence)
Standard Deviation
Mean real hourly earnings excluding overtime
15,262 1130.1 445.5
Median hourly earnings excluding overtime
21,125 1177.3 62.6
Bite: NMW/median 21,125 0.564 0.046
Mean change in bite 19,500 0.014 0.057
Ratio of approximate Gross Value Added (aGVA) to total output (percentage)
17,098 25.5 899.5
Gross Operating Rate (£ 000's) 17,155 -36.5 442.9
Approximate Gross Value Added (aGVA) per unit turnover (percentage)
17,155 21.4 358.2
Unit wage cost (ratio) 17,155 2865.8 182082.4
Purchases per unit turnover (ratio, percentage)
17,155 45.5 357.7
Net capital expenditure as a share of aGVA at factor cost(percentage)
17,129 46.5 2671.8
Ratio of aGVA at factor cost to total turnover (percentage)
17,143 28.6 70.1
*Note: Average hourly earnings from ASHE; labour market and demographics from Labour Force Survey; value added, capital wage costs and profitability measures from ABS
Specifications
Controlling for business cycle effects First, we check whether it is appropriate to control for the state of the business cycle using the post-crisis dummy. After estimating equation (2), we used an F-Test to determine whether interactions with the post-crisis dummy are needed as an additional set of covariates. Based on the test results, we were not able to reject the null hypothesis of the absence of joint significance of the controls interacted with the post-crisis dummy. As a consequence, we drop the interaction term from the remaining regressions.
However, the joint significance test for the change in the bite of the minimum wage and its interaction with the crisis dummy resulted in a p-value equal to zero or close to zero. This means that we are able to reject the null hypothesis of joint insignificance at 1% significance level. As a consequence, the interaction with the post-crisis dummy for the minimum wage bite term, our main independent variable, should be included in the regression. The inclusion of the interaction between the post-crisis dummy and the minimum wage bite term was also informed by inspection of regression results for the period before 2008 and 2008 onwards and the graphical inspection of the trend in wages during the time periods of interest.
60

National Minimum Wage and National Living Wage impact assessment: counterfactual research
Further specification issues We worked with different specifications of the model for wage growth at the 5th, 10th, 15th, 20th and 25th percentiles as dependent variables, which are reported in full in Tables A1.1 – A1.5 in the Appendix. We choose a preferred specification based on a test of the joint significance of the coefficients. The preferred specification is a model with demographic and firm characteristics, and is shown in column (4) of Appendix Tables A1.1 – A1.3. This regression model produces estimates that are robust to serial correlation and clustering of errors.
In all the specifications, however, the reported coefficients of determination (R2), which suggest how much of the overall variance observed for the dependent variable can be explained by the model, indicate that our models only manage to account for a relatively small portion of the variance of our dependent variables, ranging from about 3% to around 9% for our preferred specification. We test for the validity of each model using an F-test. In all five specifications reported in Appendix Tables A1.1 to A1.5, we can reject the null hypothesis of model invalidity at 1% significance level. Therefore, although the models are valid and likely to represent the relationship between the bite (and other covariates included) and the wage growth adequately, the low predictive power of the model does not allow us to use the estimated coefficients on the demographic and firm-demographic control variables to find fitted values of counterfactual wage growth. That is, it does not seem sensible to derive counterfactual wages from the fitted estimates wage growth using the covariates and excluding the minimum wage bite measure, . Therefore we do not recommend this approach for estimating growth in the percentile at which the increase no longer impacts. However, we can still use the regression results to guide our strategy for obtaining counterfactual wage growth estimates, as discussed in the next section.
Findings
For all specifications estimated, we reject the null hypothesis of model invalidity at the 1% significance level. This is an appropriate test for model validity, i.e. the model can robustly represent the relationship between the bite of the minimum wage (and other covariates) and the wage growth. Then again, because of the low predictive power of the model, we advise that the model should not be used to fit a counterfactual wage growth excluding the minimum wage measure as the overall fit is poor, see above on R2.
However, we can still use the regression results to guide our strategy for obtaining counterfactual wage growth estimates. In line with suggestions by the expert interviews (see section 4.2 above), we could use wage growth from wage groups whose wages are not affected by spillovers from minimum wage upratings as a proxy for counterfactual wage growth.
The regression results in Appendix Tables A1.1 to A1.5 can be used to understand the parts of the wage distributions at which the parameter coefficient representing spillovers from minimum wage upratings are significant – and for which parts they are not. In particular, we use the model to estimate how far up the wage distribution the spillovers from minimum wage increases reach. When changes in the bite of the minimum wage have a significant impact on wages at the p-th percentile, we conclude that the p-th percentile is affected by minimum wage spillovers. By finding the lowest percentile p* for which there are no longer any statistically significant spillovers from minimum wage increases, we can define the lowest percentile of the wage distribution which provides an appropriate counterfactual for wage growth in the absence of a minimum wage uprating. That is, we are choosing the lowest wage workers who are not affected by spillovers as the most appropriate group for constructing a counterfactual.
61

National Minimum Wage and National Living Wage impact assessment: counterfactual research
Findings over the business cycle Next, we assess the impact of the post-crisis dummy on the variables of interest for different percentiles of the wage distribution for our preferred specification including with the specific covariates included (see Table A1.5 of the Appendix). We show these results in Table 5 for the lower parts of the wage distribution including key tests statistics. The results are reported for real wage growth at the 5th, 10th, 15th, 20th and 25th percentiles. There are two main findings:
• First, as expected, an increase in the bite of the minimum wage is associated with an increase in real wage growth at the lower end of the wage distribution. In the pre-crisis period up to 2007, an increase of 1 percentage point in the minimum wage bite leads to an increase in quarterly real wage growth at the 5th percentile of 0.41%, at the 10th
percentile of 0.32% and at the 15th percentile of 0.20% (first row of Table 5).15 From the 20th percentile onwards, the bite of the minimum wage has no statistically significant impact on quarterly real wage growth.
• Second, consistent with the findings of the literature review, the effect of a change in the bite of the minimum wage depends on the business cycle. In the post-crisis period beginning in 2008, a 1 percentage point increase of the minimum wage bite leads to a smaller increase in quarterly real wage growth than before the crisis. For the 5th percentile, adding the coefficient of -0.0040 on the post-crisis interaction term to the overall coefficient on the minimum wage bite of 0.0041 yields an increase in quarterly real wage growth of only 0.01% for every percentage point increase in the bite of the minimum wage measure. At the 10th percentile, the post-crisis impact on quarterly real wage growth is 0.06% (obtained by adding the post-crisis interaction term of -0.0026 to the overall coefficient of 0.0032). At the 15th percentile, however, there is no difference between the pre- and post-crisis impacts of the minimum wage bite, as the coefficient on the post-crisis interaction term is not significant.
• Third, and again in line with the literature summarised earlier in this report, the effect of the minimum wage is decreasing over the wage distribution. Furthermore, our results suggest that a change in the bite of the minimum wage has an impact up to and including the 15th percentile of the wage distribution.
• Taken together, our results indicate that an increase in the change in the bite has a statistically significant positive impact on the wage growth of the 5th, 10th and 15th percentiles, but that this impact is smaller in magnitude for the post-crisis period for the 5th and 10th percentiles (Table 5).
• There is no significant evidence of a lagged effect from previous upratings, as shown by the row “lagged interaction between negative average earnings and change in bite”. This indicates that there is no effect on future wage growth of having increased the minimum wage, weakening the case for taking multiple upratings into account in the cost estimates, as suggested by the RPC.
15 This interpretation of the regression coefficient holds exactly when mean and median wages are equal in each segment. It only holds approximately when mean and median wages are not equal.
62

National Minimum Wage and National Living Wage impact assessment: counterfactual research
Table 5: Impact of the change in the bite of the NMW on real hourly earnings growth
5th %ile (1)
10th %ile (2)
15th %ile (3)
20th %ile (4)
25th %ile (5)
Minimum wage bite16 0.0041** 0.0032*** 0.0020*** 0.0011 .00078
(0.0016) (0.0009) (0.0008) (0.0006) (.00062)
Same Interaction for 2008 onwards
-0.0040** -0.0026*** -0.0010 0.000006 -.0001
(0.0017) (0.0009) (0.0008) (0.0007) (.0006)
Lagged interaction between negative average earnings and change in bite
-0.00036 0.00007 0.00003 0.0002 .0004
(0.0007) (0.0004) (0.0004) (0.0003) (.0003)
Constant 0.0864*** 0.0712*** 0.0532*** 0.0364*** 0.0284***
(0.0259) (0.0136) (0.0120) (0.0096) (.0091)
Additional Controls YES YES YES YES YES
Time Fixed effect YES YES YES YES YES
Observations 4,800 4,800 4,800 4,800 4,800
R squared 0.034 0.053 0.068 0.081 0.086
F test full model 9.97 14.60 16.22 19.31 19.42
p value (full model) 0.00 0.00 0.00 0.00 0.00
F-test main var. 2.76 5.10 4.60 4.25 2.07
p-value (F-test main var) 0.041 0.002 0.003 0.005 0.101
F-test other var. 3.64 2.83 2.19 1.52 1.77
p-value (F-test other var.) 0.00 0.00 0.006 0.094 0.037
Note: * p-value <0.10, ** p-value <0.05, *** p-value <0.001. Standard errors in brackets. The nature of the RHS and LHS variables leads to a semi-elasticity model. Results should be read as follow: if we change the main independent variable by 1 (unit), we expect the LHS variable to change by 100⋅coefficient percent.
Source: Results obtained using ASHE, LFS, and ABS databases.
Use of this evidence to estimate the counterfactual
The estimates obtained from equation (2) suggest that growth rates of real wages at the 20th and 25th percentiles are no longer affected by the upratings because the coefficients of the interaction term in the first row, the variable representing the effect of the uprating, are not statistically significant. The observed real wage growth in this part of the distribution is appropriate for estimating counterfactual wage growth using empirical data, e.g. from LFS or ASHE in line with the rationale behind the model as explained above. This will be done in the following section of this report.
16 As shown in equation (2), the minimum wage bite variable is scaled by negative average earnings.
63

National Minimum Wage and National Living Wage impact assessment: counterfactual research
5.3 Approach 2: Growth of counterfactual using observed wage growth
Aim
This part of the report looks into the empirically observed nominal wage growth for different parts of the wage distribution and labour market segments for people of the age 21-65. The aim of the analysis is to estimate nominal wage growth for the lower part of the wage distribution over different time periods, in particular pre- and post-2008. Based on the analysis presented above, which shows wages in the lower percentiles of the wage distribution are to a large extent affected by the NMW/NLW uprating, at present the observed empirical growth rate of the 20th percentile is appropriate to estimate the growth of the counterfactual. The 20th percentile wage group is the lowest percentile wage group which is not affected by spillovers from minimum wage upratings.
Data
The empirical analysis uses quarterly Labour Force Survey (LFS) data for all quarters between Q2: 2001 and Q3:2016 for workers aged 21 and over. We then restricted the sample to private sector employees in the adult population (21-65 or 25-65-year olds). We exclude public sector employees for two reasons. First, the remit of the impact assessment is to estimate the costs of raising the minimum wage for businesses, so counterfactual public sector wage growth would seem to be irrelevant. Second, a public sector pay cap of 1% annually was in effect over much of the period covered by our data, i.e. from 2010 onward. For simplicity, we only look into main jobs for this analysis. Like the Annual Survey of Hours and Earnings (ASHE), LFS data includes the 4-digit occupational code (SOC-2010), which we mapped to the group of low pay occupations as identified by the Low Pay Commission.
We then aggregate the quarterly LFS data (applying the LFS’s population weights17) to repeated cross-sections to create a “pseudo panel” to show various averages and distributional wage measures over time for people in Low Pay Occupations (LPO), outside LPO and for all workers in the lower parts of the empirically observed quarterly wage distribution.
More specifically, we focus on the following low pay measures:
• Mean wages for people in LPO of the age group 21-65 as observed in the “basic hourly rate” variable (hrrate). The variable hrrate applies to all employees reporting an hourly pay rate and excludes overtime payments, etc.18
• Mean wages in LPO (based on hrrate) for employees aged 25-65.
• Mean wages for all employees outside Low Pay Occupations work (based on hourly rate and hourly pay from the LFS) for employees aged 21-65 and 25-65.
17 We used population weights (PWT**) consistently and not population income weights (PIWT**) because model approach 1 is based on populations in labour market segments (and hence requires the application of PWT** to create labour market measures for the regression model) and we wanted to avoid differences in weighting. For the descriptive statistics, we also ran a specification with PIWT**, which the ONS recommends for earnings. For some of the growth rates, we observed very small differences when running the descriptions for different populations (i.e. for the Low Pay occupations), but obtained identical results for the 20th percentile, used for the growth of the counterfactual. 18 We focus on the hrrate variable throughout the main body of this report. An alternative wage measure is the LFS variable “gross hourly pay” (hourpay), which is derived from the individual’s reported hours and earnings for all employees. Hourpay is considered to be less reliable than hrrate, due to greater measurement error for this derived variable. We also report data based on hourpay in the Appendix.
64
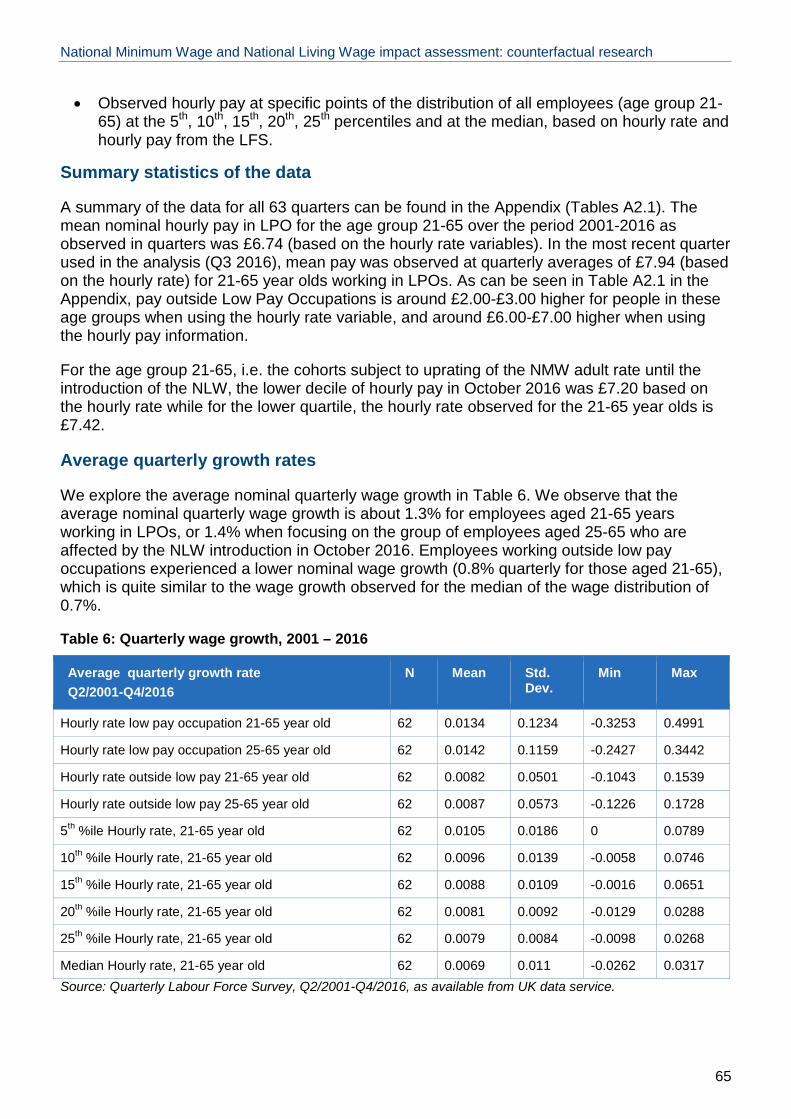
National Minimum Wage and National Living Wage impact assessment: counterfactual research
• Observed hourly pay at specific points of the distribution of all employees (age group 21-65) at the 5th, 10th, 15th, 20th, 25th percentiles and at the median, based on hourly rate and hourly pay from the LFS.
Summary statistics of the data
A summary of the data for all 63 quarters can be found in the Appendix (Tables A2.1). The mean nominal hourly pay in LPO for the age group 21-65 over the period 2001-2016 as observed in quarters was £6.74 (based on the hourly rate variables). In the most recent quarter used in the analysis (Q3 2016), mean pay was observed at quarterly averages of £7.94 (based on the hourly rate) for 21-65 year olds working in LPOs. As can be seen in Table A2.1 in the Appendix, pay outside Low Pay Occupations is around £2.00-£3.00 higher for people in these age groups when using the hourly rate variable, and around £6.00-£7.00 higher when using the hourly pay information.
For the age group 21-65, i.e. the cohorts subject to uprating of the NMW adult rate until the introduction of the NLW, the lower decile of hourly pay in October 2016 was £7.20 based on the hourly rate while for the lower quartile, the hourly rate observed for the 21-65 year olds is £7.42.
Average quarterly growth rates
We explore the average nominal quarterly wage growth in Table 6. We observe that the average nominal quarterly wage growth is about 1.3% for employees aged 21-65 years working in LPOs, or 1.4% when focusing on the group of employees aged 25-65 who are affected by the NLW introduction in October 2016. Employees working outside low pay occupations experienced a lower nominal wage growth (0.8% quarterly for those aged 21-65), which is quite similar to the wage growth observed for the median of the wage distribution of 0.7%.
Table 6: Quarterly wage growth, 2001 – 2016
Average quarterly growth rate Q2/2001-Q4/2016
N Mean Std. Dev.
Min Max
Hourly rate low pay occupation 21-65 year old 62 0.0134 0.1234 -0.3253 0.4991
Hourly rate low pay occupation 25-65 year old 62 0.0142 0.1159 -0.2427 0.3442
Hourly rate outside low pay 21-65 year old 62 0.0082 0.0501 -0.1043 0.1539
Hourly rate outside low pay 25-65 year old 62 0.0087 0.0573 -0.1226 0.1728
5th %ile Hourly rate, 21-65 year old 62 0.0105 0.0186 0 0.0789
10th %ile Hourly rate, 21-65 year old 62 0.0096 0.0139 -0.0058 0.0746
15th %ile Hourly rate, 21-65 year old 62 0.0088 0.0109 -0.0016 0.0651
20th %ile Hourly rate, 21-65 year old 62 0.0081 0.0092 -0.0129 0.0288
25th %ile Hourly rate, 21-65 year old 62 0.0079 0.0084 -0.0098 0.0268
Median Hourly rate, 21-65 year old 62 0.0069 0.011 -0.0262 0.0317 Source: Quarterly Labour Force Survey, Q2/2001-Q4/2016, as available from UK data service.
65

National Minimum Wage and National Living Wage impact assessment: counterfactual research
Given the importance of the business cycle on the impact of the NMW uprating, we decided to split the empirical data and provide a description of the average quarterly growth rate before 2008 (Table 7) and since 2008 (Table 8). We also present wage growth rates for the periods 2010-2016 and 2014-2016, as growth rates might vary at different stages of the recovery from an economic downturn (Tables A2.2-A2.3). Comparing the statistics for the 4 periods (i.e. pre-2008, post-2008, 2010-2016 and 2014-2016), we notice that the average wage growth rate is higher for the pre-crisis period. The lowest level of mean hourly rate wage growth for low pay occupation is registered for the 2008 – 2016 period, while for 2014-2016 we observe a negative mean growth of the hourly rate.
Comparing tables 7 and 8, the mean wage growth rate is much higher in the pre-crisis period. For example, the growth rate of the 20th percentile goes from 1.1% in 2001-2007 to 0.6% in 2008-2016, while median hourly pay growth goes from 1.0% in the pre-crisis period to 0.5% post-crisis.
This descriptive exercise confirms the importance of accounting for the business cycle when modelling wage growth, as supported by evidence from the literature review.
Table 7: Quarterly wage growth, 2001 – 2007
Average quarterly growth rate Q2/2001-Q4/2007
N Mean Std. Dev.
Min Max
Hourly rate low pay occupation 21-65 year old 26 0.0184 0.159 -0.3253 0.4991
Hourly rate low pay occupation 25-65 year old 26 0.0187 0.1301 -0.2056 0.2699
Hourly rate outside low pay 21-65 year old 26 0.0137 0.0648 -0.1043 0.1539
Hourly rate outside low pay 25-65 year old 26 0.0148 0.074 -0.1226 0.1728
5th %ile Hourly rate, 21-65 year old 26 0.0143 0.0252 0 0.0789
10th %ile Hourly rate, 21-65 year old 26 0.0125 0.0116 -0.0058 0.0417
15th %ile Hourly rate, 21-65 year old 26 0.0113 0.0088 0 0.0267
20th %ile Hourly rate, 21-65 year old 26 0.0107 0.0091 0 0.0288
25th %ile Hourly rate, 21-65 year old 26 0.0106 0.0086 0 0.0268
Median Hourly rate, 21-65 year old 26 0.0100 0.0133 -0.0262 0.0317 Source: Quarterly Labour Force Survey, as available from UK data service
66

National Minimum Wage and National Living Wage impact assessment: counterfactual research
Table 8: Quarterly wage growth, 2008 – 2016
Average quarterly growth rate Q1/2008-Q4/2016
N Mean Std. Dev.
Min Max
Hourly rate low pay occupation 21-65 year old 36 0.0097 0.092 -0.1998 0.2809
Hourly rate low pay occupation 25-65 year old 36 0.0109 0.1062 -0.2427 0.3442
Hourly rate outside low pay 21-65 year old 36 0.0042 0.0366 -0.0708 0.1014
Hourly rate outside low pay 25-65 year old 36 0.0042 0.0419 -0.075 0.1057
5th %ile Hourly rate, 21-65 year old 36 0.0078 0.0114 0 0.0448
10th %ile Hourly rate, 21-65 year old 36 0.0075 0.0151 -0.0054 0.0746
15th %ile Hourly rate, 21-65 year old 36 0.0070 0.0121 -0.0016 0.0651
20th %ile Hourly rate, 21-65 year old 36 0.0063 0.009 -0.0129 0.0286
25th %ile Hourly rate, 21-65 year old 36 0.0059 0.0078 -0.0098 0.0224
Median Hourly rate, 21-65 year old 36 0.0047 0.0085 -0.0127 0.0274 Source: Quarterly Labour Force Survey, as available from UK data service
Box 1: Are there differences in wage growth among low wage occupations? An empirical test
As a further robustness check on our recommendation to use an average counterfactual wage growth for the full group of occupations affected by the NMW/NLW upratings, we looked into individual low-wage occupations and how their wages have developed since the early 2000s. The aim of this analysis is to understand whether wages in occupations which were affected by a larger increase at the NLW introduction (i.e. those at the lower end of the wage distribution ahead of the introduction of the NLW) had been growing historically at a slower rate. If that was the situation, applying the average growth of the counterfactual for these groups would result in the counterfactual to too rapidly adjusting to incoming NLW/NMW levels and hence underestimate the costs of business to the uprating. More specifically, we exploit the fact that wages of individual occupations were closer to or more distant from the incoming level of the NLW in Q2/2016, and analyse whether this was correlated with differential growth in the years ahead of the NLW introduction.
Data
Using all quarters of the Labour Force Survey (LFS) between Q2/2001 and Q4/2016, we first create a pseudo-panel of all occupations using the Standard Occupation Classification (SOC) at four digit level, which offers the highest level of detail. Theoretically, this would result in more than 350 wage observations per quarter, i.e. for every individual SOC, but we restrict the analysis to cells with no fewer than 100 observations of people of the age 25-65 in the quarter. The resulting database is an unbalanced pseudo panel of 141 occupations, which are observed between 1 and 63 quarters.
We then look more closely into the occupations which have been affected recently by the introduction of the NLW. We retrieve these from the data by identifying all occupations with wages below the incoming £7.20 NLW in Q2/2016 based on the average of the median reported for these occupations in the year before the introduction of the NLW, see Table B1.1. They represent about 12.5% of all dependent employment in Q4/2016. Although these are all low pay occupations in the data, some of these occupations were paid closely to the incoming level of the NLW in 2015/16, while others had pay that was further below the incoming rates. Bar staff and waiters had median pay right at the level of the previous NMW, while sales and retail assistants and food process operatives were paid much more closely to the incoming level of the NLW (based on the hour rate variable reported for people knowing their hourly pay exactly).
67

National Minimum Wage and National Living Wage impact assessment: counterfactual research
Table B1.1: Observed median pay in selected Low Pay Occupations 2015/16 (average of four quarters before NLW introduction)
Occupations Estimated number of employees 25-65
Median pay before NLW (hour rate)
Difference to incoming NLW in April 2016 (£7.20)
Food, drink and tobacco process operatives 171,600 £7.18 0.02
Sales and retail assistants 1,315,300 £7.05 0.15
Retail cashiers and check-out operators 210,700 £6.98 0.22
Kitchen and catering assistants 506,500 £6.92 0.29
Cleaners, domestic 526,100 £6.84 0.36
Packers, bottlers, canners, fillers 146,300 £6.81 0.39
Waiters, Waitresses 297,400 £6.70 0.50
Bar staff 198,400 £6.61 0.59
Total 3,372,300 Source: Quarterly Labour Force Survey , frequencies Q4/2016 (rounded to nearest 100) and median pay averaged over four quarters Q2/2015-Q1/2016
Empirical analysis
Looking into the growth of the median hourly rates observed for these occupations (Figure B1.1), both observed wages and two quarter moving averages developed very much in parallel across occupations, despite being differentially affected by the incoming NLW (Figure B1.1).
Figure B1.1: Quarterly median pay (nominal) observed in 4-digit SOC for occupations affected by NLW introduction
Source: Quarterly Labour Force Survey, Q2/2001-Q4/2016
68

National Minimum Wage and National Living Wage impact assessment: counterfactual research
We then empirically test the significance of differences in wage growth trends prior to NLW introduction (until Q1/2016) to understand whether there was differential wage growth (Main hypothesis).
We do this by regressing wages on a linear time trend, which we interact with variables indicating whether the pay observed in 2015/16 was closer or distant to the incoming NLW level of £7.20. Based on the observed growth due to the NLW introduction, we define low pre-NLW wages as the quartile of the highest increase and high pre-NLW wages as the one with the lowest increase. We focus on the eight selected occupations and the period between Q1/2006-Q1/2016, which results in a pseudo-panel of 320 occupations to support the empirical estimate.
The findings (Table B1.2) show clear level differences, consistent with the observation that the lower paid occupations operated almost exactly at NMW rate (which was £5.35) in 2006 just as they do today. The trend growth for nominal wages is positive and significant (row 3 in bold). The differential growth suggests a negative sign for lower wages, but the difference in the trend growth was not significantly different from zero (Hypothesis tested).
Table B1.2 Regression analysis testing trend differences in wage growth
Coefficient Std. Err. t P>t
Lower pre-NLW level -0.27 0.05 -5.23 0.00
Higher pre-NLW level 0.16 0.05 2.97 0.00
Quarter growth (nominal) 0.03 0.00 25.52 0.00
Lower pre-NLW quarter growth 0.00 0.00 0.16 0.87
Higher pre-NLW quarter growth 0.00 0.00 1.24 0.22
Intercept 5.57 0.03 184.38 0.00
Number of obs. 318.00
F(5, 312) 325.50
Prob > F 0.00
R-squared 0.84
Adj R-squared 0.84
Root MSE 0.19 Source: Labour Force Survey, Q1/2006-Q1/2016
In summary, this analysis supports the use of an average growth rate applied to the counterfactual in the IA, as no significant evidence for differential growth was found in the data.
Result: Expected growth of counterfactual
Our analysis shows that using the observed wage growth of pseudo-cohorts, which can be easily obtained from LFS data and updated frequently, leads to a range of counterfactual wage growth estimates based on the different measures available from LFS data. However, when combining the evidence from the econometric analysis above (i.e. that real wage growth at the 20th percentile is unaffected by the minimum wage uprating) and the empirical data obtained for the different time periods, the quarterly growth rates of the 20th percentile would currently be the best measure to estimate the growth of the counterfactual.
However, this still leaves open the question of which retrospective period of wage growth is most appropriate. Application of some amount of judgement as to the state of the business cycle over the forecast horizon is unavoidable. This judgement should, in our opinion, be
69

National Minimum Wage and National Living Wage impact assessment: counterfactual research
informed by a range of forecasts for average earnings and GDP, including the OBR, the Bank of England, the IMF and NIESR, along with other independent forecasters. For example, if an economic downturn is judged by these forecasters to be likely or if the economy is experiencing a downturn which is expected to persist for the following year, then it might be appropriate to use the nominal wage growth at the 20th percentile which has been observed in the most recent downturn which is likely to be the most representative of economic conditions for a the foreseeable future. If, however, it is judged that the economy has been in an upswing for the past 2 years and that this is likely to continue, then extrapolating average wage growth from the past 2 years might be most appropriate.
The time elapsed until the counterfactual wage reaches the new level of the NLW/NMW varies quite substantially depending on which of the empirical growth rates we apply. As an illustrative example of our recommended approach, take the scenario of the April 2017 uprating from £7.20 to £7.50:
• If the business cycle is not accounted for (Table 6), using the LPO definition and applying the observed average quarterly growth rates in the period 2001-2016, it would have taken about four quarters for the counterfactual wage to reach the new NLW level. Instead, five quarters are required if we use the 15th percentile average growth rate, while for the 20th or 25th percentile the time required is 6 quarters.
• When we do account for the business cycle, the results are quite sensitive to whether we conduct the analysis for the pre-crisis or crisis/post-crisis period:
o Using the pre-crisis measures from Table 7, the counterfactual wage reaches the new level of the NLW within 3 quarters when we use the mean wage growth of the low pay occupations, while it takes one quarter more for the counterfactual to reach the proposed new level of wages when we use the average wage growth observed during 2001-2007 for the 15th, 20th, and 25th percentiles.
o In contrast, using the periods 2008-2016 and 2010-2016 and the average wage growth of the 20th percentile, it would take the counterfactual wage 7 quarters to reach the proposed wage floor. Conducting the analysis using the same counterfactual measure but for the period 2014-2016, we observe that 5 quarters would be required to achieve the new wage floor.
Table 9: Quarters required to catch-up with NLW uprating using the wage growth of different periods as reference, example of the April 2017 uprating
Counterfactual reference period
Mean LPO P15 P20 P25
2001-2016 4 5 6 6
2001-2007 3 4 4 4
2008-2016 5 6 7 7
2010-2016 5 7 7 7
2014-2016 – negative growth
4 5 5
Source: Quarterly Labour Force Survey, Q2/2001-Q4/2007
70
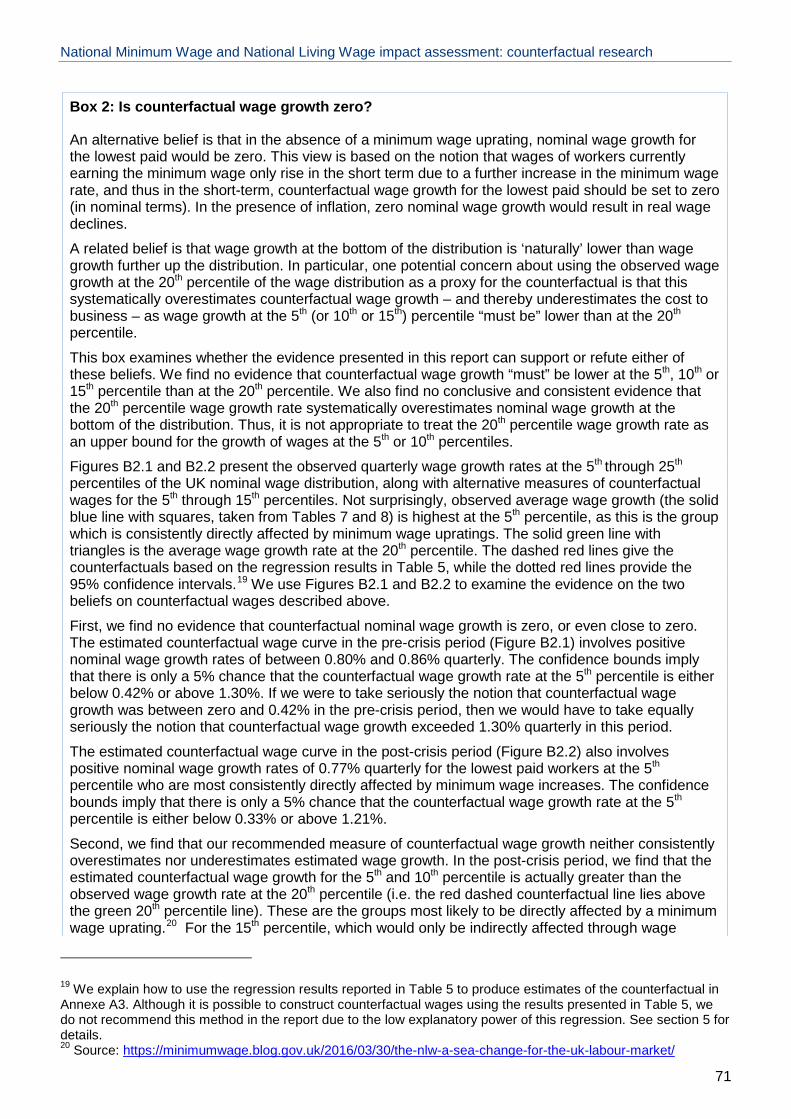
National Minimum Wage and National Living Wage impact assessment: counterfactual research
Box 2: Is counterfactual wage growth zero?
An alternative belief is that in the absence of a minimum wage uprating, nominal wage growth for the lowest paid would be zero. This view is based on the notion that wages of workers currently earning the minimum wage only rise in the short term due to a further increase in the minimum wage rate, and thus in the short-term, counterfactual wage growth for the lowest paid should be set to zero (in nominal terms). In the presence of inflation, zero nominal wage growth would result in real wage declines.
A related belief is that wage growth at the bottom of the distribution is ‘naturally’ lower than wage growth further up the distribution. In particular, one potential concern about using the observed wage growth at the 20th percentile of the wage distribution as a proxy for the counterfactual is that this systematically overestimates counterfactual wage growth – and thereby underestimates the cost to business – as wage growth at the 5th (or 10th or 15th) percentile “must be” lower than at the 20th percentile.
This box examines whether the evidence presented in this report can support or refute either of these beliefs. We find no evidence that counterfactual wage growth “must” be lower at the 5th, 10th or 15th percentile than at the 20th percentile. We also find no conclusive and consistent evidence that the 20th percentile wage growth rate systematically overestimates nominal wage growth at the bottom of the distribution. Thus, it is not appropriate to treat the 20th percentile wage growth rate as an upper bound for the growth of wages at the 5th or 10th percentiles.
Figures B2.1 and B2.2 present the observed quarterly wage growth rates at the 5th through 25th
percentiles of the UK nominal wage distribution, along with alternative measures of counterfactual wages for the 5th through 15th percentiles. Not surprisingly, observed average wage growth (the solid blue line with squares, taken from Tables 7 and 8) is highest at the 5th percentile, as this is the group which is consistently directly affected by minimum wage upratings. The solid green line with triangles is the average wage growth rate at the 20th percentile. The dashed red lines give the counterfactuals based on the regression results in Table 5, while the dotted red lines provide the 95% confidence intervals.19 We use Figures B2.1 and B2.2 to examine the evidence on the two beliefs on counterfactual wages described above.
First, we find no evidence that counterfactual nominal wage growth is zero, or even close to zero. The estimated counterfactual wage curve in the pre-crisis period (Figure B2.1) involves positive nominal wage growth rates of between 0.80% and 0.86% quarterly. The confidence bounds imply that there is only a 5% chance that the counterfactual wage growth rate at the 5th percentile is either below 0.42% or above 1.30%. If we were to take seriously the notion that counterfactual wage growth was between zero and 0.42% in the pre-crisis period, then we would have to take equally seriously the notion that counterfactual wage growth exceeded 1.30% quarterly in this period.
The estimated counterfactual wage curve in the post-crisis period (Figure B2.2) also involves positive nominal wage growth rates of 0.77% quarterly for the lowest paid workers at the 5th percentile who are most consistently directly affected by minimum wage increases. The confidence bounds imply that there is only a 5% chance that the counterfactual wage growth rate at the 5th percentile is either below 0.33% or above 1.21%.
Second, we find that our recommended measure of counterfactual wage growth neither consistently overestimates nor underestimates estimated wage growth. In the post-crisis period, we find that the estimated counterfactual wage growth for the 5th and 10th percentile is actually greater than the observed wage growth rate at the 20th percentile (i.e. the red dashed counterfactual line lies above the green 20th percentile line). These are the groups most likely to be directly affected by a minimum wage uprating.20 For the 15th percentile, which would only be indirectly affected through wage
19 We explain how to use the regression results reported in Table 5 to produce estimates of the counterfactual in Annexe A3. Although it is possible to construct counterfactual wages using the results presented in Table 5, we do not recommend this method in the report due to the low explanatory power of this regression. See section 5 for details. 20 Source: https://minimumwage.blog.gov.uk/2016/03/30/the-nlw-a-sea-change-for-the-uk-labour-market/
71

National Minimum Wage and National Living Wage impact assessment: counterfactual research
spillovers, we do find that the estimated counterfactual lies below the 20th percentile wage growth rate, but still just within the 95 percent confidence interval.
In the pre-crisis period, we do find that the estimated counterfactual wage growth rate for the 5th to 15th percentiles lies below the 20th percentile nominal wage growth rate of 1.07%. However, the 20th percentile growth rate lies within the 95% confidence bounds, albeit just on the upper bound at the 10th and 15th percentiles.
Thus, we find that the estimated counterfactual sometimes implies higher and sometimes lower wage growth rates than at the 20th percentile of the wage distribution. This indicates that treating the 20th percentile of the wage growth distribution as an upper bound for counterfactual wage growth at the 5th and 10th percentiles is not appropriate, although it might be appropriate at the 15th percentile. Figure B2.1: Observed vs Counterfactual Wage Growth Rates, pre-Crisis
Figure B2.2: Observed vs Counterfactual Wage Growth Rates, post-Crisis
72

National Minimum Wage and National Living Wage impact assessment: counterfactual research
6. Applying the estimated Counterfactual This section will discuss the cost estimates produced by the BEIS IA model when we apply our empirical estimates for counterfactual wage growth of workers at the 20th percentile of the wage distribution.
Our recommended method for estimating counterfactual quarterly nominal wage growth is based on quarterly nominal wage growth in the 20th percentile of the hourly pay rate distribution. We have calculated growth in the 20th percentile for three different periods and these provide three options for the central estimate of cost to business. Deciding between these three options requires a judgement about the current position in the business cycle. The options are summarised in table 10.
Table 10: Options for quarterly nominal wage growth assumptions
Business cycle assumption Period covered
Quarterly growth rates at the 20th percentile (nominal)
Back to pre-crisis growth 2001-2007 1.07
Post crisis growth will continue 2010-2016 0.68
Growth beginning to increase 2014-2016 0.92
We apply these three options to the introduction of the NLW in April 2016. If one assumes the post-crisis growth rate will continue in the short to medium terms (the second row in table 10) the estimated cost to business is £520 million. Table 11 shows how this estimate compares to the BEIS central, low and upper estimates for the introduction of the NLW in April 2016. Table 12 shows how the quarterly growth rates vary between our estimate and the BEIS lower estimate.
Table 11: Comparison of our central estimate with BEIS estimates
Sources of estimate Assumption Estimated Costs (£m)
Our estimate Average growth in 20th percentile of hourly 520
Lower OBR average earnings 535
BEIS estimates Central Mid-point between inflation and average 640
Upper Inflation (CPI) 740
73

National Minimum Wage and National Living Wage impact assessment: counterfactual research
Table 12: Quarterly Growth rate assumption
2017 Q2
2017 Q3
2017 Q4
2018 Q1
2018 Q2
2018 Q3
2018 Q4
2019 Q1
2019 Q2
Quarterly Growth rate assumption
BEIS lower estimate 0.82 0.54 0.52 0.55 0.84 0.82 0.75 0.82 0.99
Quarterly Growth rate assumption
Our estimate 0.68 0.68 0.68 0.68 0.68 0.68 0.68 0.68 0.68
In light of the evidence produced in this report, we have come to a number of recommendations for the use of counterfactual wages in the impact assessments for minimum wage upratings. These recommendations cover two key issues: how to choose an appropriate counterfactual wage growth rate and over which time period to estimate the costs to business arising from the uprating.
We recommend that the counterfactual wage growth rate be chosen as the wage growth rate from the lowest percentile of the wage distribution which is no longer affected by spillovers from the minimum wage. We further recommend that the regression Approach 1 (whose results are reported in Table 5 of this report) be used to pin down this lowest spillover-free percentile of the wage distribution. Using the most up to date data at the time of writing, our recommendation is thus that the nominal growth rate of wages at the 20th percentile of the distribution be taken as a proxy for counterfactual wage growth. In future years, as the NLW may begin to cover a greater (or smaller) percentage of the workforce, the extent of spillovers might change. As a consequence, we recommend updating the appropriate regressions each year. A choice must also be made as to which time period wage growth at the 20th percentile should be measured. This choice will inevitably involve judgement on the current state of the business cycle, informed by independent forecasts of key institutions (Bank of England, OBR, IMF, OECD and NIESR).
Our second recommendation concerns whether to reset the counterfactual at each uprating or to use a previous counterfactual. We recommend resetting the counterfactual at each uprating. Our main concern in using previous counterfactuals relates to the accuracy of longer term forecasts, particularly in the case of counterfactuals whose forecast accuracy could never be properly assessed.
74

National Minimum Wage and National Living Wage impact assessment: counterfactual research
Synopsis of Key issues/ recommendations in light of the evidence
Stage of the IA Issue Pros and Cons Recommendation
Estimating counterfactual
Use growth in the median wage or growth in highest percentile not affected by spillovers of the minimum wage.
Highest percentile unaffected more reliable as growth rates of median pay considerably above segment affected by the NMW/NLW upratings.
Econometric estimates required to identify point in wage distribution to represent counterfactual growth; over time, impact of NMW/NLW bite will change; updates required.
Estimates of the econometric model to be obtained annually to understand impact of upratings on distribution.
Choice of different segment of wage distribution if needed.
Estimating counterfactual
Time period used for empirical estimate of wage growth.
Choice of period accounts for business cycle wage growth differences, which significantly change NMW/NLW impact.
Requires judgement of the state of the business cycle based on a variety of sources.
Review of available forecasts (Bank, OBR, IMF, OECD, NIESR) to adapt IA to business cycle outlook (use empirically observed growth for most recent period corresponding to medium term outlook).
Applying the counter-factual model
Whether to reset the counterfactual at each uprating or use a previous counterfactual.
Long-term impact of the upratings would be incorporated in the IA
No data available to update forecast for past upratings based on actual outcomes (accuracy declines).
Minimum wage upratings changes composition of jobs; i.e. longer term impacts would need to incorporate substitution between skill levels and/or technology.
IA should continue to focus on individual uprating.
Applying the counter-factual model
Use separate counterfactuals for different parts of the low wage distribution or for different groups (youth, apprenticeships, etc.).
Potentially increases accuracy of the IA predictions in monetary terms.
Fewer data points available for empirical estimates; reduced model accuracy; higher complexity of IA with likely little gain in accuracy (costs: 95% NLW uprating).
Assumptions unlikely to hold: Composition of low paid employment would remain unchanged; suggests that counterfactual growth would differ by socioeconomic groups.
Suggest using one empirical model and applying counterfactual wage growth across groups.
75

National Minimum Wage and National Living Wage impact assessment: counterfactual research
References Arulampalam W, Booth A L, Bryan M L (2004), ‘Training and the new minimum wage’, The Economic Journal, 114(494).
Autor D H, Manning A, Smith C L (2016), ‘The contribution of the minimum wage to US wage inequality over three decades: a reassessment’, American Economic Journal: Applied Economics, 8(1), 58-99.
Belman D, Wolfson P (2004), ‘The minimum wage: Consequences for prices and quantities in low-wage labor markets’, Journal of Business & Economic Statistics, 22(3), 296-311.
Belman D L, Wolfson P (2010), ‘The effect of legislated minimum wage increases on employment and hours: A dynamic analysis’, Labour, 24(1), 1-25.
BEIS (2017), Amendment to the National Minimum Wage regulations 2017 - increase in National Minimum and National Living Wage rates, BEIS Report.
Brewer M, May R, Phillips D (2009), Taxes, benefits and the national minimum wage. Low Pay Commission research paper.
Bryan M, Taylor M (2004), An analysis of the household characteristics of minimum wage recipients. Report prepared for the Low Pay Commission.
Butcher T (2005), ‘The hourly earnings distribution before and after the national Minimum Wage’. Labour Market Trends.
Butcher T, Dickens R, Manning A (2012), Minimum wages and wage inequality: some theory and an application to the UK. Centre for Economic Performance.
Card D, Krueger A B (1995), ‘Myth and Measurement: The New Economics of the Minimum Wage’, Princeton: Princeton University Press.
Carrillo-Tudela C, Hobijn B, She P, Visschers L (2016), ‘The extent and cyclicality of career changes: Evidence for the UK’, European Economic Review, 84, 18-41.
D’Arcy C, Hurrel A (2013), Minimum stay: Understanding how long people remain on the minimum wage. Resolution Foundation report.
Dickerson, A (2007), Longer Term Implications of the NMW: A Re-Examination of Employer-Provided Training.
DiNardo J, Fortin N M, Lemieux T (1996), ‘Labor Market Institutions and the Distribution of Wages, 1973-1992: A Semiparametric Approach’, Econometrica, 64 (5):1001-1044.
Dickens R, Riley R, Wilkinson D (2013), National Minimum Wage: re-examining its impact on earnings, employment and hours, Research report for the Low Pay Commission
Dickens R, Manning A (2004), ‘Has the national minimum wage reduced UK wage inequality?’ Journal of the Royal Statistical Society: Series A (Statistics in Society), 167(4), 613-626.
76
National Minimum Wage and National Living Wage impact assessment: counterfactual research
Dolton P, Bondibene C R, Wadsworth J (2010), ‘The UK national minimum wage in retrospect’, Fiscal studies, 31(4), 509-534.
Dolton P, Lin L, Makepeace G, Tremayne A (2011), An In-depth Assessment of the Impact of the Recession on the Distribution of Pay Settlements and Earnings. Report to the Low Pay Commission.
Dolton P, Bondibene C R, Wadsworth J (2012), ‘Employment, Inequality and the UK National Minimum Wage over the Medium‐Term’, Oxford Bulletin of Economics and Statistics, 74(1), 78-106.
Even W E, Macpherson D A (2003), ‘The wage and employment dynamics of minimum wage workers’, Southern Economic Journal, 676-690.
Even W E, Macpherson D A (2004), ‘Wage growth among minimum wage workers’, Employment Policies Institute, Washington, DC.
Giupponi G, Lindner A, Machin S, Manning A (2016), The Impact of the National Living Wage on English Care Homes, Research Report for the Low Pay Commission.
Grossberg A J, Sicilian P (1999). ‘Minimum wages, on-the-job training, and wage growth’, Southern Economic Journal, 539-556.
Jones M K, Jones R J, Latreille P L, Murphy P D, Sloane P J (2007), Further Analysis of Flows into and out of the National Minimum Wage. Report for the Low Pay Commission
Lee D S (1999), ‘ Wage inequality in the United States during the 1980s: Rising dispersion or falling minimum wage?’ The Quarterly Journal of Economics, 114(3), 977-1023.
London Economics (2016) An examination of the impact of the NMW on earnings, the bite and wage differentials
Low Pay Commission (2012), National minimum wage: Low Pay Commission report 2012
Low Pay Commission (2016), National minimum wage: Low Pay Commission autumn report 2016
Machin S, Manning A, Rahman L (2003), ‘Where the minimum wage bites hard: Introduction of minimum wages to a low wage sector’, Journal of the European Economic Association, 1(1), 154-180.
Machin S (2015), Real Wages and Living Standards. Centre for Economic Performance
Manning A (2012), Minimum wage: maximum effect. Resolution Foundation report
Neumark D, Schweitzer M, Wascher W (2004), ‘Minimum wage effects throughout the wage distribution’ Journal of Human Resources, 39(2), 425-450.
Office for National Statistics (2014), UK wages over the past four decades: 2014
Patrignani et al. (2017): The Earnings differentials associated with vocational education and training using the Longitudinal Education Outcomes data. ‘Centre for Vocational Education Research’ discussion paper 007. http://cver.lse.ac.uk/textonly/cver/pubs/cverdp007.pdf
77
National Minimum Wage and National Living Wage impact assessment: counterfactual research
Resolution foundation (2016), Industrial strategies? Exploring responses to the National Living Wage in low-paying sectors, Research report for the Low Pay Commission
Resolution foundation (2012), Low Pay Britain 2012
Resolution foundation (2016), Low Pay Britain 2016
Riley, R. and C. Rosazza Bondibene, 2015, “Raising the standard: minimum wages and firm productivity,” NIESR Discussion Paper 449.
Stewart M B (2012), ‘Wage inequality, minimum wage effects, and spillover’, Oxford Economic Papers, 64(4), 616-634.
Swaffield J K (2014), ‘Minimum Wage Hikes and the Wage Growth of Low‐Wage Workers’, Bulletin of Economic Research, 66(4), 384-405.
78

National Minimum Wage and National Living Wage impact assessment: counterfactual research
Appendix tables
Full models estimating the impact of the change in the bite of the NMW on real hourly earnings growth along the wage distribution (Approach 1)
Table A1.1: Impact of the change in the bite on change in log real hourly earnings (5th percentile)
(1) (2) (3) (4)
Interaction between negative average earnings of labour
-.00004 .0022*** .0015 .0041***
market segment r and change in bite of the minimum wage
(.00003) (.0004) (.0018) (.0015)
Same Interaction for 2008 onwards
-.0022*** (.0004)
-.0023 (.0018)
-.0039** (.0017)
Lagged interaction between negative average earnings and change in bite
.0008 (.0007)
-.0004 (.0007)
Change share low pay workers in segment
.0059 (.0255)
Change share in fixed term employment
.0773** (.0318)
Change share in part time employment
.0097 (.0307)
Change share educated at L3 and apprenticeships
-.1057*** (.0360)
Change share educated at L2 and below
.0085 (.0312)
Change share workers in firms with up to 25 employers
.1838 (.1543)
Change share workers in firms with up to 50 employers
.1385 (.098)
Change share workers in low pay occupations
.0525 (.0521)
Change share workers in firms with up to 10 employers
-.3101* (.1866)
Change unemployment rate -.0965*** (.0368)
Change aGVA as per unit turnover
-.000011 (.00002)
Change aGVA at factor cost as ratio of total turnover
.00002 (.00002)
79

National Minimum Wage and National Living Wage impact assessment: counterfactual research
(1) (2) (3) (4)
Below 25 Segment -.0222*** (.0058)
Men Segment -.0001 (.0041)
Constant .004 (.0025)
.005** (0.002)
.02 (0.03)
.086*** (.025)
Additional Control Variables
NO NO NO YES
Time Fixed effect NO NO YES YES
Observations 8,301 8,301 7,595 4,800
R squared 0.0001 0.0028 0.0136 0.0345
F test model 17.63 19.34 12.71 16.88
p-value for F-test 0.00 0.00 0.00 0.00
Notes: * p-value <0.10, ** p-value <0.05, *** p-value <0.001. Standard errors in brackets.
The nature of the RHS and LHS variables leads to a semi-elasticity model. Results should be read as follow: if we change the main independent variable (RHS) by 1 (unit), we expect the LHS variable to change by 100⋅coefficient percent.
Source: Results obtained using ASHE, LFS, and ABS databases
80

National Minimum Wage and National Living Wage impact assessment: counterfactual research
Table A1.2: Impact of the change in the bite on change in log real hourly earnings (10th percentile)
(1) (2) (3) (4)
Interaction between negative average earnings of labour market segment r and change in bite of the minimum wage
.00008*** (.00002)
.00067*** (.00021)
.0026** (.0010)
.0032*** (.0008 )
Same Interaction for 2008 onwards
-.00059*** (.0002)
-.0029*** (.0010)
-.0026*** (.0010)
Lagged interaction between negative average earnings and change in bite
.00007 (.00042)
.00006 (.00044 )
Change share low pay workers in segment
.0113 (.0150)
Change share in fixed term employment
.0482** (.0189)
Change share in part time employment
.0241** (.0113)
Change share educated at L3 and apprenticeships
-.0283 (.0207)
Change share educated at L2 and below
.0030 (.0176)
Change share workers in firms with up to 25 employers
.1833* (.1045)
Change share workers in firms with up to 50 employers
-.0282 (.0611)
Change share workers in low pay occupations
-.0182 (.0350)
Change share workers in firms with up to 10 employers
-.1404 (.1144)
Change unemployment rate -.0186 (.0186)
Change aGVA as per unit turnover -.000003 (.000013)
Change aGVA at factor cost as ratio of total turnover
.000021 (.000014)
Below 25 Segment -.0101*** (.0032)
Men Segment -.0010 (.0023)
Constant .0023*** (.0013)
.0025* (.0013)
.0555*** (.0148)
.0712*** (.0137)
Additional Control Variables NO NO NO YES
Time Fixed effect NO NO YES YES
Observations 8301 8301 7,595 4,800
81

National Minimum Wage and National Living Wage impact assessment: counterfactual research
(1) (2) (3) (4)
R squared 0.0011 0.0017 0.0245 0.0541
F test model 10.38 9.10 16.36 22.15
p-value 0.0013 0.0001 0.00 0.00
Notes: * p-value <0.10, ** p-value <0.05, *** p-value <0.001. Standard errors in brackets.
The nature of the RHS and LHS variables leads to a semi-elasticity model. Results should be read as follow: if we change the main independent variable (RHS) by 1 (unit), we expect the LHS variable to change by 100⋅coefficient percent.
Source: Results obtained using ASHE, LFS, and ABS databases.
82

National Minimum Wage and National Living Wage impact assessment: counterfactual research
Table A1.3: Impact of the change in the bite on change in log real hourly earnings (15th percentile)
(1) (2) (3) (4)
Interaction between negative average earnings of labour market segment r and change in bite of the minimum wage
.00020*** (.00002)
.00057** (.0002)
.00220** (.0010)
.00077 (.0006)
Same Interaction for 2008 onwards
-.00037** (.0002)
-.0023** (.0001)
-.00013 (.0006)
Lagged interaction between negative average earnings and change in bite
.00002 (.0003)
.0004 (.0003)
Change share low pay workers in segment
.0055 (.0112)
Change share in fixed term employment
.0314** (.0149)
Change share in part time employment
.0164* (.0092)
Change share educated at L3 and apprenticeships
-.0140 (.0163)
Change share educated at L2 and below
-.0025 (.0140)
Change share workers in firms with up to 25 employers
.0512 (.1066)
Change share workers in firms with up to 50 employers
.0456
Change share workers in low pay occupations
-.0300 (.0307)
Change share workers in firms with up to 10 employers
-.0581 (.1010)
Change unemployment rate -.0448*** (.0156)
Change aGVA as per unit turnover -0.000005 (0.000012)
Change aGVA at factor cost as ratio of total turnover
0.000018 (0.00001)
Below 25 Segment -.0048** (.0025)
Men Segment -.0023 (.0019)
Constant .0025** (.0010)
.0027** (.0010)
.0492*** (.01394)
.0533*** (.0120)
Additional Control Variables NO NO NO YES
Time Fixed effect NO NO YES YES
83

National Minimum Wage and National Living Wage impact assessment: counterfactual research
(1) (2) (3) (4)
Observations 8301 8301 7,595 4,800
R squared 0.0093 0.0096 0.0376 0.067
F test model 78.85 41.70 23.73 16.22
p value 0.00 0.00 0.00 0.00
Notes: * p-value <0.10, ** p-value <0.05, *** p-value <0.001. Standard errors in brackets.
The nature of the RHS and LHS variables leads to a semi-elasticity model. Results should be read as follow: if we change the main independent variable (RHS) by 1 (unit), we expect the LHS variable to change by 100⋅coefficient percent.
Source: Results obtained using ASHE, LFS, and ABS databases.
84

National Minimum Wage and National Living Wage impact assessment: counterfactual research
Table A1.4: Impact of the change in the bite on change in log real hourly earnings (20th percentile)
(1) (2) (3) (4)
Interaction between negative average earnings of labour market segment r and change in bite of the minimum wage
.00027*** (.00002)
.00044** (.00017)
.00168* (.0009)
.0008 (.00057 )
Same Interaction for 2008 onwards
-. 0002 (.0001702)
-.00147 (.0008943)
-.0001 (.00061)
Lagged interaction between negative average earnings and change in bite
.000208 (.00034)
.00039 (.00029)
Change share low pay workers in segment
.0163 (.0108)
Change share in fixed term employment
.0267** (.0121)
Change share in part time employment
.0140 (.0089)
Change share educated at L3 and apprenticeships
-.0093 (.0143)
Change share educated at L2 and below
-.0051 (.0129)
Change share workers in firms with up to 25 employers
.0737 (.0908)
Change share workers in firms with up to 50 employers
.0293 (.0525)
Change share workers in low pay occupations
-.0327 (.0320)
Change share workers in firms with up to 10 employers
-.0796 (.0929)
Change unemployment rate -.0167 (.0137)
Change aGVA as per unit turnover
-.00001 (.00001)
Change aGVA at factor cost as ratio of total turnover
.0000115 (0.000009)
Below 25 Segment -0.0019 (0.0021)
Men Segment -0.0026 (0.0017)
Constant .0033*** (.0009)
.0034*** (.0009)
.0492*** (.0139)
0.0364*** (.0096)
Additional Control Variables NO NO NO YES
Time Fixed effect NO NO YES YES
85
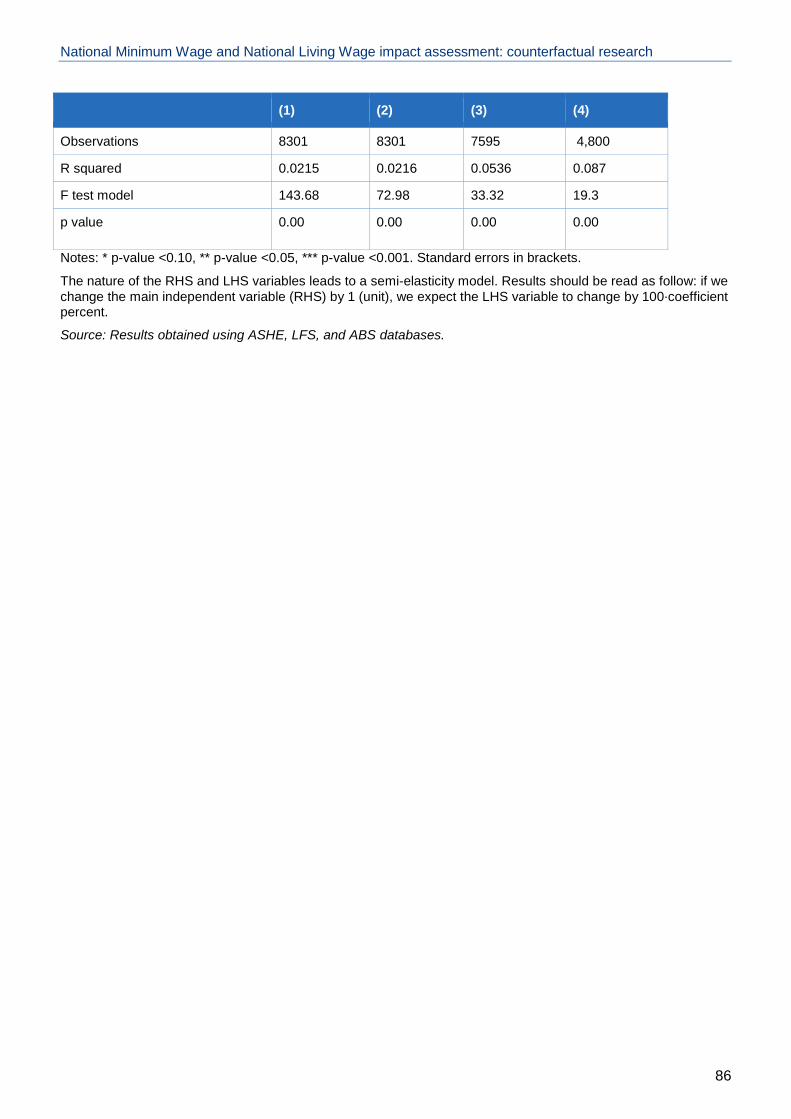
National Minimum Wage and National Living Wage impact assessment: counterfactual research
(1) (2) (3) (4)
Observations 8301 8301 7595 4,800
R squared 0.0215 0.0216 0.0536 0.087
F test model 143.68 72.98 33.32 19.3
p value 0.00 0.00 0.00 0.00
Notes: * p-value <0.10, ** p-value <0.05, *** p-value <0.001. Standard errors in brackets.
The nature of the RHS and LHS variables leads to a semi-elasticity model. Results should be read as follow: if we change the main independent variable (RHS) by 1 (unit), we expect the LHS variable to change by 100⋅coefficient percent.
Source: Results obtained using ASHE, LFS, and ABS databases.
86

National Minimum Wage and National Living Wage impact assessment: counterfactual research
Table A1.5: Impact of the change in the bite on change in log real hourly earnings (25th percentile)
(1) (2) (3) (4)*
Interaction between negative average earnings of labour market segment r and change in bite of the minimum wage
.00031*** (.00002)
.00033** (.0001)
.0013** (.00067)
.00077 (.0006 )
Same Interaction for 2008 onwards -.00001 (.0001)
-.0009 (.0007)
-.00012 (.00061)
Lagged interaction between negative average earnings and change in bite
.00057** (.0003)
.00039 (.00029)
Change share low pay workers in segment
.0210** (.0092)
Change share in fixed term employment
.0256** (.0108)
Change share in part time employment
.0023 (.0079)
Change share educated at L3 and apprenticeships
-.0068 (.0133)
Change share educated at L2 and below
-.0106 (.0125)
Change share workers in firms with up to 25 employers
.1503 (.0940)
Change share workers in firms with up to 50 employers
-.0213 (.0546)
Change share workers in low pay occupations
-.0204 (.0319)
Change share workers in firms with up to 10 employers
-.0887 (.0855)
Change unemployment rate -.0135 (.0115)
Change aGVA as per unit turnover -.000013 (.00001)
Change aGVA at factor cost as ratio of total turnover
0.00002 (0.00001)
Below 25 Segment -.0004 (.002)
Men Segment -.003 (.002)
Constant .0039*** (.0008)
.00389*** (.0008)
.0328*** (.0094 )
0.028*** (.009)
Additional Control Variables NO NO NO YES
87
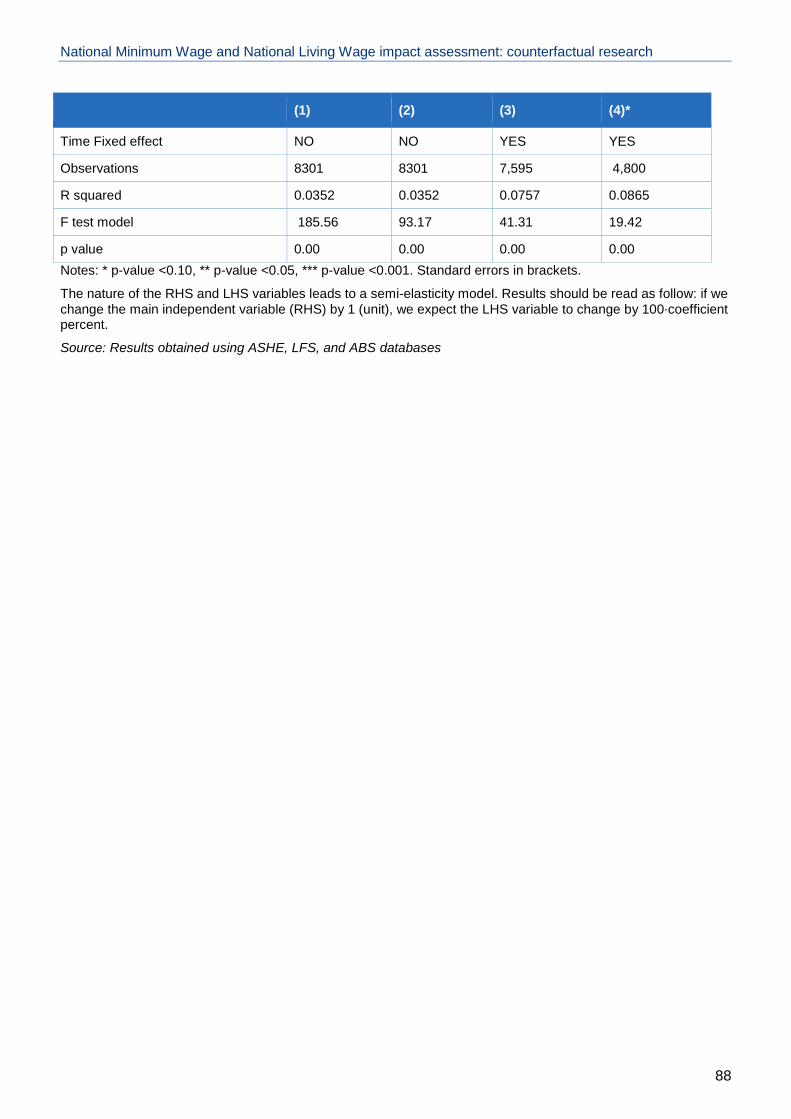
National Minimum Wage and National Living Wage impact assessment: counterfactual research
(1) (2) (3) (4)*
Time Fixed effect NO NO YES YES
Observations 8301 8301 7,595 4,800
R squared 0.0352 0.0352 0.0757 0.0865
F test model 185.56 93.17 41.31 19.42
p value 0.00 0.00 0.00 0.00 Notes: * p-value <0.10, ** p-value <0.05, *** p-value <0.001. Standard errors in brackets.
The nature of the RHS and LHS variables leads to a semi-elasticity model. Results should be read as follow: if we change the main independent variable (RHS) by 1 (unit), we expect the LHS variable to change by 100⋅coefficient percent.
Source: Results obtained using ASHE, LFS, and ABS databases
88

National Minimum Wage and National Living Wage impact assessment: counterfactual research
Description of Labour Force Survey pseudo panel data (Approach 2)
Table A2.1: Summary Statistics of hourly pay variables (nominal)
Q2/2001-Q4/2016 Averages Latest quarter (Q4/2016)
N Mean Std. Dev.
Min Max Mean
Hourly rate low pay occupation 21-65 year old
63 6.74 0.84 4.99 8.61 7.94
Hourly pay variable low pay occupation 21-65 year old
63 6.97 0.84 5.43 8.58 8.29
Hourly rate low pay occupation 25-65 year old
63 6.82 0.90 4.99 8.91 8.03
Hourly pay variable low pay occupation 25-65 year old
63 7.11 0.87 5.54 8.92 8.47
Hourly rate outside low pay 21-65 year old
63 8.62 0.96 6.68 10.60 10.60
Hourly pay variable outside low pay 21-65 year old
63 12.95 1.68 9.94 15.88 15.34
Hourly rate outside low pay 25-65 year old
63 8.80 1.03 6.77 10.90 10.90
Hourly pay variable outside low pay 25-65 year old
63 13.41 1.77 10.23 16.43 15.93
5 Percentile hourly rate 21-65
63 5.49 0.88 3.80 7.20 7.20
10 Percentile hourly rate 21-65
63 5.56 0.84 4.00 7.20 7.20
15 Percentile hourly rate 21-65
63 5.6705 0.7829 4.2 7.2 7.20
20 Percentile hourly rate 21-65
63 5.83 0.76 4.40 7.25 7.25
25 Percentile hourly rate 21-65
63 5.99 0.76 4.56 7.42 7.42
Median hourly rate 21-65 63 7.10 0.81 5.50 8.40 8.40
89
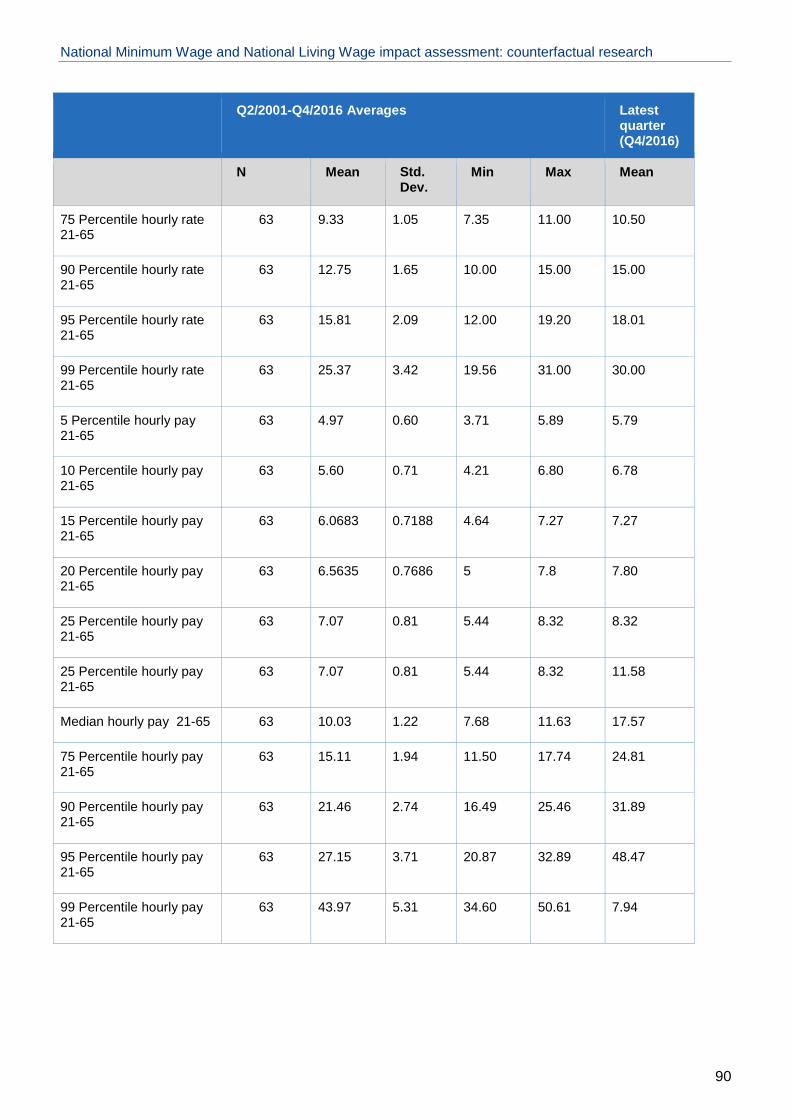
National Minimum Wage and National Living Wage impact assessment: counterfactual research
Q2/2001-Q4/2016 Averages Latest quarter (Q4/2016)
N Mean Std. Dev.
Min Max Mean
75 Percentile hourly rate 21-65
63 9.33 1.05 7.35 11.00 10.50
90 Percentile hourly rate 21-65
63 12.75 1.65 10.00 15.00 15.00
95 Percentile hourly rate 21-65
63 15.81 2.09 12.00 19.20 18.01
99 Percentile hourly rate 21-65
63 25.37 3.42 19.56 31.00 30.00
5 Percentile hourly pay 21-65
63 4.97 0.60 3.71 5.89 5.79
10 Percentile hourly pay 21-65
63 5.60 0.71 4.21 6.80 6.78
15 Percentile hourly pay 21-65
63 6.0683 0.7188 4.64 7.27 7.27
20 Percentile hourly pay 21-65
63 6.5635 0.7686 5 7.8 7.80
25 Percentile hourly pay 21-65
63 7.07 0.81 5.44 8.32 8.32
25 Percentile hourly pay 21-65
63 7.07 0.81 5.44 8.32 11.58
Median hourly pay 21-65 63 10.03 1.22 7.68 11.63 17.57
75 Percentile hourly pay 21-65
63 15.11 1.94 11.50 17.74 24.81
90 Percentile hourly pay 21-65
63 21.46 2.74 16.49 25.46 31.89
95 Percentile hourly pay 21-65
63 27.15 3.71 20.87 32.89 48.47
99 Percentile hourly pay 21-65
63 43.97 5.31 34.60 50.61 7.94
90

National Minimum Wage and National Living Wage impact assessment: counterfactual research
Table A2.2: Quarterly growth rate, 2010 - 2016
Average quarterly growth rate Q1/2010-Q4/2016
N Mean Std. Dev. Min Max
Hourly rate low pay occupation 21-65 year old
28 0.0088 0.0807 -0.1618 0.1919
Hourly pay variable low pay occupation 21-65 year old
28 0.0068 0.033 -0.0892 0.0805
Hourly rate low pay occupation 25-65 year old
28 0.0093 0.0896 -0.177 0.2089
Hourly pay variable low pay occupation 25-65 year old
28 0.0069 0.036 -0.1116 0.0886
Hourly rate outside low pay 21-65 year old 28 0.006 0.0374 -0.0708 0.1014
Hourly pay variable outside low pay 21-65 year old
28 0.0046 0.0186 -0.0236 0.056
Hourly rate outside low pay 25-65 year old 28 0.0061 0.0418 -0.075 0.1057
Hourly pay variable outside low pay 25-65 year old
28 0.0046 0.0181 -0.0221 0.054
5th %ile Hourly rate, 21-65 year old 28 0.0081 0.0116 0 0.0448
10th %ile Hourly rate, 21-65 year old 28 0.0079 0.0162 0 0.0746
15th %ile Hourly rate, 21-65 year old 28 0.0066 0.0135 -0.0016 0.0651
20th %ile Hourly rate, 21-65 year old 28 0.0068 0.0095 -0.0129 0.0286
25th %ile Hourly rate, 21-65 year old 28 0.0063 0.0084 -0.0098 0.0224
Median Hourly rate, 21-65 year old 28 0.0041 0.0082 -0.0127 0.0194
5th %ile Hourly pay, 21-65 years old 28 0.004 0.0161 -0.0266 0.0274
10th %ile Hourly pay, 21-65 years old 28 0.0054 0.0086 -0.0101 0.0212
15th %ile Hourly pay, 21-65 years old 28 0.0054 0.0089 -0.0134 0.0291
20th %ile Hourly pay, 21-65 years old 28 0.0047 0.0098 -0.0115 0.024
25th %ile Hourly pay, 21-65 years old 28 0.0044 0.011 -0.0166 0.0253
Median Hourly pay, 21-65 years old 28 0.0036 0.0112 -0.0204 0.0227
91

National Minimum Wage and National Living Wage impact assessment: counterfactual research
Table A2.3: Quarterly growth rate, 2014-2016
Average quarterly growth rate Q1/2014-Q4/2016
N Mean Std. Dev. Min Max
Hourly rate low pay occupation 21-65 year old
12 -0.0055 0.0502 -0.1618 0.0245
Hourly pay variable low pay occupation 21-65 year old
12 0.0076 0.043 -0.0892 0.0805
Hourly rate low pay occupation 25-65 year old
12 -0.0072 0.0547 -0.177 0.0269
Hourly pay variable low pay occupation 25-65 year old
12 0.0082 0.0491 -0.1116 0.0886
Hourly rate outside low pay 21-65 year old
12 0.0088 0.0306 -0.0445 0.0454
Hourly pay variable outside low pay 21-65 year old
12 0.0043 0.0225 -0.0197 0.056
Hourly rate outside low pay 25-65 year old
12 0.009 0.032 -0.0443 0.0497
Hourly pay variable outside low pay 25-65 year old
12 0.0042 0.0218 -0.0178 0.054
5th %ile Hourly rate, 21-65 year old 12 0.0114 0.0158 0 0.0448
10th %ile Hourly rate, 21-65 year old 12 0.0113 0.0231 0 0.0746
15th %ile Hourly rate, 21-65 year old 12 0.0107 0.0196 -0.0016 0.0651
20th %ile Hourly rate, 21-65 year old 12 0.0092 0.0102 0 0.0286
25th %ile Hourly rate, 21-65 year old 12 0.0088 0.0079 0 0.0224
Median Hourly rate, 21-65 year old 12 0.0052 0.0085 -0.0127 0.0182
5th %ile Hourly pay, 21-65 years old 12 0.004 0.0163 -0.0266 0.0274
10th %ile Hourly pay, 21-65 years old 12 0.0068 0.0074 -0.0064 0.0212
15th %ile Hourly pay, 21-65 years old 12 0.0062 0.0069 -0.0058 0.0155
20th %ile Hourly pay, 21-65 years old 12 0.0052 0.0084 -0.0107 0.0145
25th %ile Hourly pay, 21-65 years old 12 0.0045 0.0065 -0.0076 0.0139
Median Hourly pay, 21-65 years old 12 0.0024 0.0071 -0.0095 0.0118
92

National Minimum Wage and National Living Wage impact assessment: counterfactual research
Table A2.4: Quarterly growth rate of hourly pay, 2001-2016
Average quarterly growth rate Q1/2001-Q4/2007
N Mean Std. Dev. Min Max
Hourly pay variable low pay occupation 21-65 year old
62 0.0071 0.0274 -0.0892 0.0805
Hourly pay variable low pay occupation 25-65 year old
62 0.0073 0.0297 -0.1116 0.0886
Hourly pay variable outside low pay 21-65 year old
62 0.0072 0.0184 -0.0261 0.056
Hourly pay variable outside low pay 25-65 year old
62 0.0073 0.0186 -0.0258 0.0549
5th %ile Hourly pay, 21-65 years old 62 0.0073 0.0139 -0.0266 0.04
10th %ile Hourly pay, 21-65 years old 62 0.0077 0.0084 -0.0101 0.0265
15th %ile Hourly pay, 21-65 years old 62 0.0073 0.0092 -0.0134 0.0291
20th %ile Hourly pay, 21-65 years old 62 0.0072 0.0094 -0.0115 0.0249
25th %ile Hourly pay, 21-65 years old 62 0.0069 0.011 -0.0166 0.0272
Median Hourly pay, 21-65 years old 62 0.0067 0.0138 -0.0323 0.0423
Source: Quarterly Labour Force Survey, 2001-2016
93
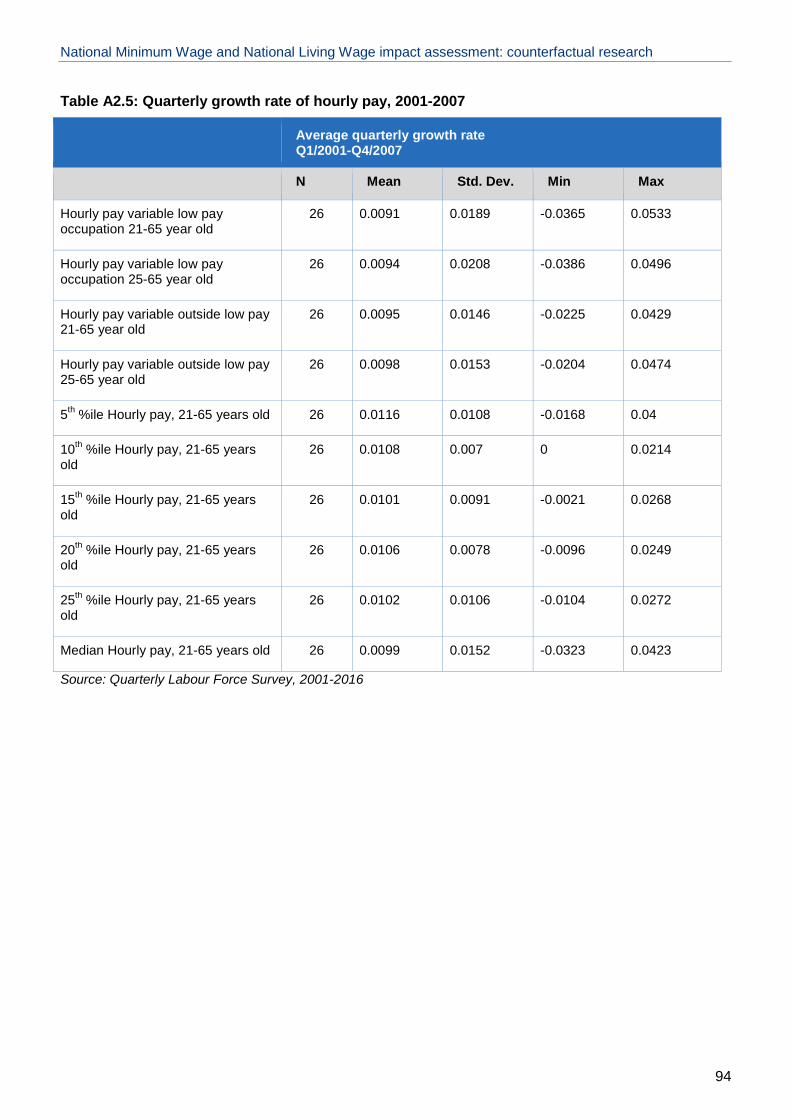
National Minimum Wage and National Living Wage impact assessment: counterfactual research
Table A2.5: Quarterly growth rate of hourly pay, 2001-2007
Average quarterly growth rate Q1/2001-Q4/2007
N Mean Std. Dev. Min Max
Hourly pay variable low pay occupation 21-65 year old
26 0.0091 0.0189 -0.0365 0.0533
Hourly pay variable low pay occupation 25-65 year old
26 0.0094 0.0208 -0.0386 0.0496
Hourly pay variable outside low pay 21-65 year old
26 0.0095 0.0146 -0.0225 0.0429
Hourly pay variable outside low pay 25-65 year old
26 0.0098 0.0153 -0.0204 0.0474
5th %ile Hourly pay, 21-65 years old 26 0.0116 0.0108 -0.0168 0.04
10th %ile Hourly pay, 21-65 years old
26 0.0108 0.007 0 0.0214
15th %ile Hourly pay, 21-65 years old
26 0.0101 0.0091 -0.0021 0.0268
20th %ile Hourly pay, 21-65 years old
26 0.0106 0.0078 -0.0096 0.0249
25th %ile Hourly pay, 21-65 years old
26 0.0102 0.0106 -0.0104 0.0272
Median Hourly pay, 21-65 years old 26 0.0099 0.0152 -0.0323 0.0423
Source: Quarterly Labour Force Survey, 2001-2016
94

National Minimum Wage and National Living Wage impact assessment: counterfactual research
Table A2.6: Quarterly growth rate of hourly pay, 2008-2016
Average quarterly growth rate Q1/2008-Q4/2016
N Mean Std. Dev. Min Max
Hourly pay variable low pay occupation 21-65 year old
36 0.0056 0.0324 -0.0892 0.0805
Hourly pay variable low pay occupation 25-65 year old
36 0.0058 0.0349 -0.1116 0.0886
Hourly pay variable outside low pay 21-65 year old
36 0.0055 0.0208 -0.0261 0.056
Hourly pay variable outside low pay 25-65 year old
36 0.0055 0.0207 -0.0258 0.0549
5th %ile Hourly pay, 21-65 years old 36 0.0042 0.0152 -0.0266 0.0274
10th %ile Hourly pay, 21-65 years old 36 0.0055 0.0087 -0.0101 0.0265
15th %ile Hourly pay, 21-65 years old 36 0.0053 0.0088 -0.0134 0.0291
20th %ile Hourly pay, 21-65 years old 36 0.0048 0.0098 -0.0115 0.024
25th %ile Hourly pay, 21-65 years old 36 0.0045 0.0108 -0.0166 0.0253
Median Hourly pay, 21-65 years old 36 0.0045 0.0125 -0.0231 0.0266
Source: Quarterly Labour Force Survey, 2008-2016
95
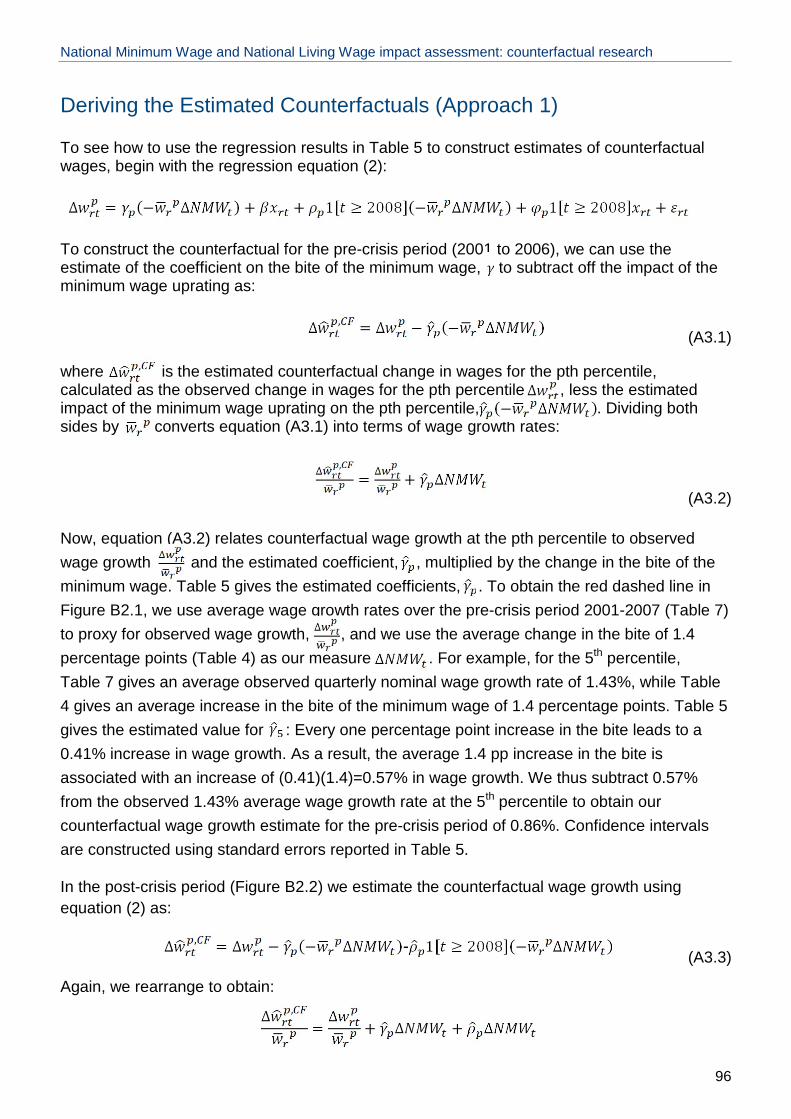
National Minimum Wage and National Living Wage impact assessment: counterfactual research
Deriving the Estimated Counterfactuals (Approach 1)
To see how to use the regression results in Table 5 to construct estimates of counterfactual wages, begin with the regression equation (2):
To construct the counterfactual for the pre-crisis period (2001 to 2006), we can use the estimate of the coefficient on the bite of the minimum wage, to subtract off the impact of the minimum wage uprating as:
(A3.1)
where is the estimated counterfactual change in wages for the pth percentile, calculated as the observed change in wages for the pth percentile, , less the estimated impact of the minimum wage uprating on the pth percentile, . Dividing both sides by converts equation (A3.1) into terms of wage growth rates:
(A3.2)
Now, equation (A3.2) relates counterfactual wage growth at the pth percentile to observed wage growth and the estimated coefficient, , multiplied by the change in the bite of the minimum wage. Table 5 gives the estimated coefficients, . To obtain the red dashed line in Figure B2.1, we use average wage growth rates over the pre-crisis period 2001-2007 (Table 7) to proxy for observed wage growth, , and we use the average change in the bite of 1.4 percentage points (Table 4) as our measure . For example, for the 5th percentile, Table 7 gives an average observed quarterly nominal wage growth rate of 1.43%, while Table 4 gives an average increase in the bite of the minimum wage of 1.4 percentage points. Table 5 gives the estimated value for : Every one percentage point increase in the bite leads to a 0.41% increase in wage growth. As a result, the average 1.4 pp increase in the bite is associated with an increase of (0.41)(1.4)=0.57% in wage growth. We thus subtract 0.57% from the observed 1.43% average wage growth rate at the 5th percentile to obtain our counterfactual wage growth estimate for the pre-crisis period of 0.86%. Confidence intervals are constructed using standard errors reported in Table 5.
In the post-crisis period (Figure B2.2) we estimate the counterfactual wage growth using equation (2) as:
(A3.3)
Again, we rearrange to obtain:
96

National Minimum Wage and National Living Wage impact assessment: counterfactual research
In the post-crisis period, the impact of the bite is much smaller at the 5th percentile, at 0.01% for each percentage point increase in the bite (obtained from Table 5 as = 0.41% − 0.40% = 0.01%). Now, the average 1.4 pp increase in the bite is associated with an increase of (0.01)(1.4)=0.01% in wage growth. We thus subtract 0.01% from the observed 0.78% average wage growth rate at the 5th percentile (Table 8) to obtain our counterfactual wage growth estimate for the post-crisis period of 0.77%.
97

© Crown copyright 2018
This publication is licensed under the terms of the Open Government Licence v3.0 except where otherwise stated. To view this licence, visit nationalarchives.gov.uk/doc/open-government-licence/version/3 or write to the Information Policy Team, The National Archives, Kew, London TW9 4DU, or email: [email protected] we have identified any third party copyright information you will need to obtain permission from the copyright holders concerned.
This publication is available from: www.gov.uk/beis
Contacts us if you have any enquiries about this publication, including requests for alternative formats, at: [email protected]