Embed Size (px)
Citation preview
Learn more about ArcGIS 3D Analyst featuring ArcGlobe at www.esri.com/3Danalyst
Making Geographic Data and Maps Accessible to Museum Visitors
National Geographic Society
Problem
Need to build a fail-safe application that allows museum visitors to view geographic data in an easy-to-understand manner.
Goals
• Present vast amounts of data.• Integrate many types of data
including satellite imagery, demographic, terrain, and National Geographic Society data.
• Make an interactive display easy to use for those with little understanding of geography or computers.
Results
• Large amounts of data presented in an easy-to-understand manner
• Fail-safe, kiosk application created for general public use
“ArcGlobe has added a new
dimension to the way visitors can view and interact with maps and data. ArcGlobe is a powerful technology for museums looking for an intuitive way to realistically
present data about our world.”
Allen Carroll, Chief Cartographer,
National Geographic Society
For more than 90 years, one of the leaders in helping people understand and
enjoy the rich variety, complexity, and integrated nature of the world has been
the National Geographic Society (NGS). NGS has championed and preserved
the art and science of cartography through magazines, books, exhibits,
and programs.
NGS produces and maintains a vast library of maps and globes. These include
historical geographic representations such as two rare globes made in 1831 by
James Wilson, the fi rst commercial globe maker in the United States; a map of
Antarctica signed by polar explorer Richard Byrd; and a map of Mount Everest
signed by Sir Edmund Hillary.
The Challenge
The mission of NGS is to increase and diffuse geographic knowledge. One consistent tool in this endeavor has been maps and, increasingly, mapping technology. When the staff of the National Geographic Museum created the exhibit Mapping with Paper and Pixel for the gallery at its headquarters in Washington, D.C., it needed an intuitive way to present various types of geographic data to people who are unfamiliar with computer mapping and geo-graphic information system (GIS) technology.
The Solution
NGS looked to ESRI’s ArcGIS® Engine and ArcGIS 3D AnalystTM featuring ArcGlobeTM featuring ArcGlobeTM featuring ArcGlobe to present more than seven gigabytes of mapping data in a user-friendly way.
“ArcGIS and ArcGlobe were a low-cost solution for us to display this incredible amount of data in such an exciting way,” says Allen Carroll, chief cartographer, National Geographic Society.
NGS created three applications to showcase National Geographic atlas plates and satellite images. The exhibit featured four ArcGlobe application-powered stations that allowed users to explore the earth from a global level to the local level by zooming in to Washington, D.C., and also trace the climbing routes on Mount Everest. Dell® computers running Windows® XP housed these mouse-driven, fail-safe applications.
Twin stations featured a global perspective where users could pan, zoom in and out, and turn on or off 10 layers of data including satellite imagery of the earth with land masses, cloud cover, and night lights as well as population density. Help buttons allowed users to access the various layers of data to learn more.
Copyright © 2005 ESRI. All rights reserved. ESRI, the ESRI globe logo, ArcGIS, 3D Analyst, ArcGlobe, @esri.com, and www.esri.com are trademarks, registered trademarks, or service marks of ESRI in the United States, the European Community, or certain other jurisdictions. Other companies and products mentioned herein are trademarks or registered trademarks of their respective trademark owners.
G17125 7/05vr
ESRI Software UsedArcGIS EngineArcGIS 3D Analyst featuring ArcGlobe
ESRI
380 New York StreetRedlands, CA 92373-8100Phone: 800-447-9778Fax: 909-307-3082Web: www.esri.com
For More Information
Learn more about ArcGIS 3D Analyst featuring ArcGlobe at www.esri.com/3Danalyst
National Geographic SocietyMaking Geographic Data and Maps Accessible to Museum Visitors
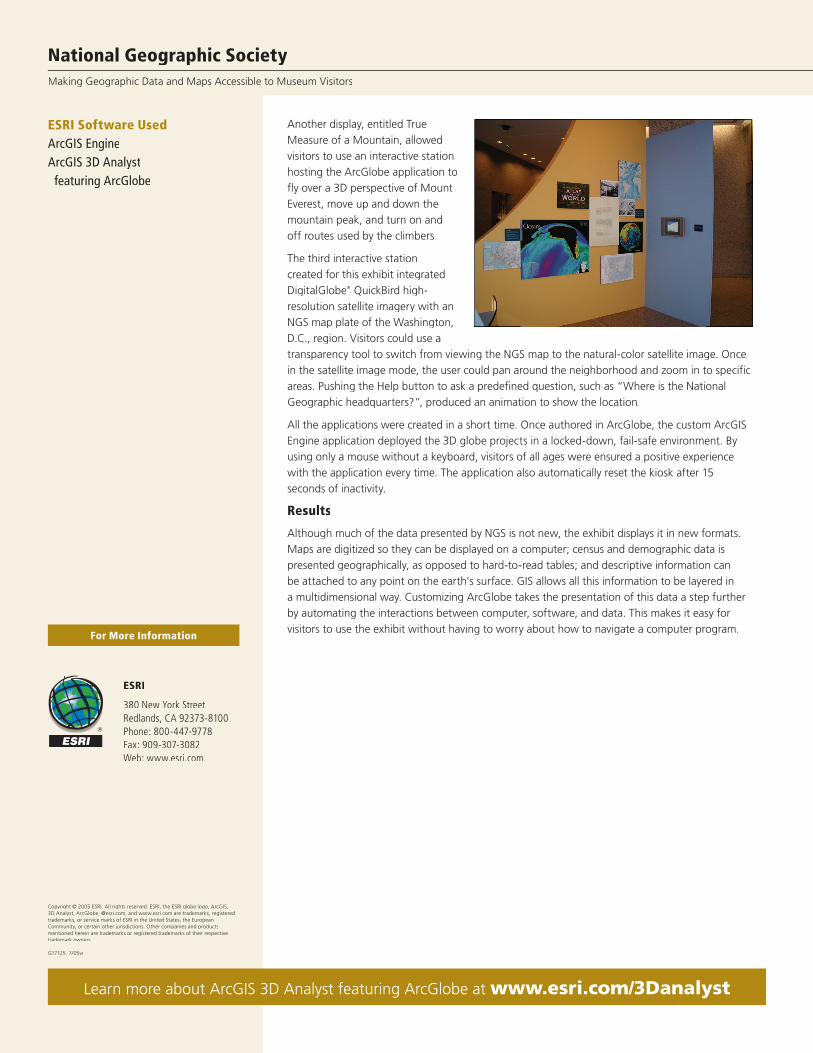
Another display, entitled True Measure of a Mountain, allowed visitors to use an interactive station hosting the ArcGlobe application to fly over a 3D perspective of Mount Everest, move up and down the mountain peak, and turn on and off routes used by the climbers.
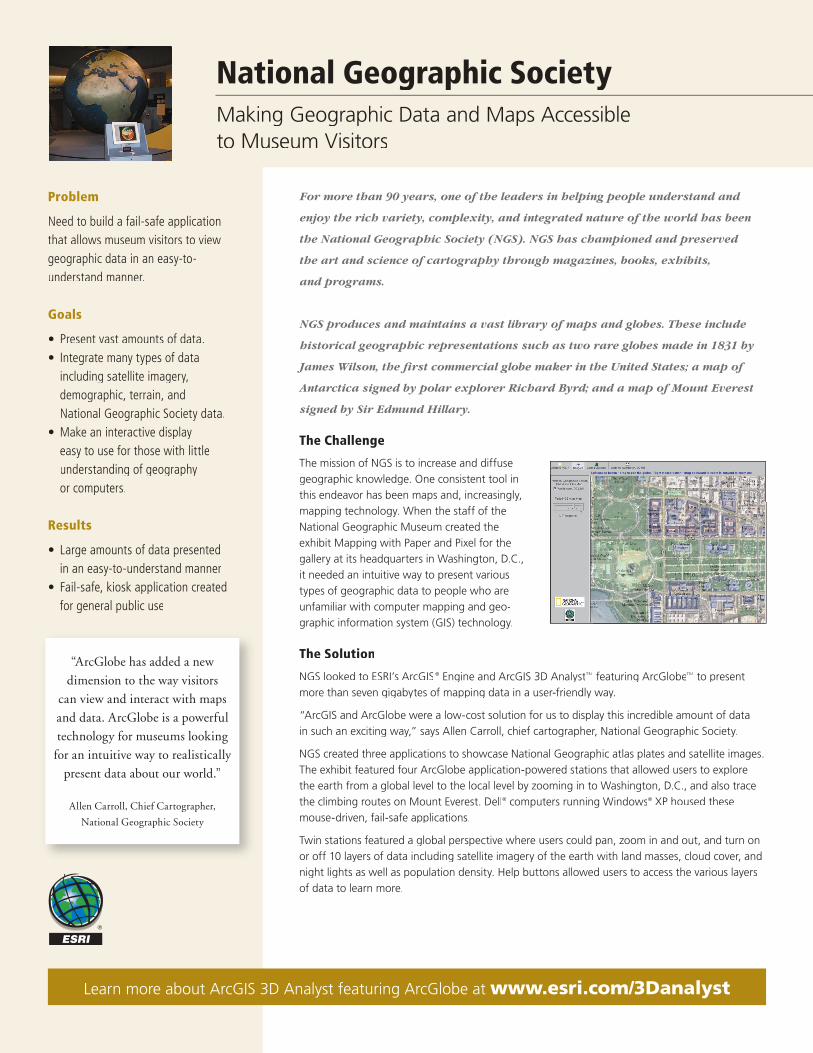
The third interactive station created for this exhibit integrated DigitalGlobe® QuickBird high-resolution satellite imagery with an NGS map plate of the Washington, D.C., region. Visitors could use a transparency tool to switch from viewing the NGS map to the natural-color satellite image. Once in the satellite image mode, the user could pan around the neighborhood and zoom in to specific areas. Pushing the Help button to ask a predefined question, such as “Where is the National Geographic headquarters?”, produced an animation to show the location.
All the applications were created in a short time. Once authored in ArcGlobe, the custom ArcGIS Engine application deployed the 3D globe projects in a locked-down, fail-safe environment. By using only a mouse without a keyboard, visitors of all ages were ensured a positive experience with the application every time. The application also automatically reset the kiosk after 15 seconds of inactivity.
Results
Although much of the data presented by NGS is not new, the exhibit displays it in new formats. Maps are digitized so they can be displayed on a computer; census and demographic data is presented geographically, as opposed to hard-to-read tables; and descriptive information can be attached to any point on the earth’s surface. GIS allows all this information to be layered in a multidimensional way. Customizing ArcGlobe takes the presentation of this data a step further by automating the interactions between computer, software, and data. This makes it easy for visitors to use the exhibit without having to worry about how to navigate a computer program.