Embed Size (px)
Citation preview
NASSAU COUNTY OFFICE OF THE COMPTROLLER
PRELIMINARY ANALYSIS OF NASSAU COUNTY’S OPPORTUNITIES TO INCREASE NONTAX, NONGRANT
REVENUES
George Maragos Nassau County Comptroller
September 7, 2010
This report is posted on the Comptroller’s website http://www.nassaucountyny.gov/agencies/comptroller/index.html
For more information, call (516) 5712386
NASSAU COUNTY OFFICE OF THE COMPTROLLER
George Maragos Comptroller
Francis X. Moroney Chief Deputy Comptroller
Joy M. Watson Jostyn Hernandez Deputy Comptroller for Communications Director Audits and Special Projects
Kathy Kugler Lisa Tsikouras Director of Accounting Director of Field Audit
Research Staff
Anthony Dedousis Gabriel Marques Intern Inspector
Other Contributors
Susan Cohen Ellen Misita Field Auditor Field Auditor Supervisor
Page 2 of 21
PRELIMINARY ANALYSIS OF NASSAU COUNTY’S OPPORTUNITIES TO INCREASE NONTAX, NONGRANT
REVENUES
1.0 Executive Summary
Nassau County revenues are derived from five sources: Taxes, Government Grants, Charges for
Services, also known as NonTax, NonGrant (NTNG), Investment Income and Other General
Revenues. For the purposes of this study, we will refer to the Charges for Services revenue as
NTNG; Taxes account for about 73% of revenues, grants account for about 19%, NTNG account
for about 6.5% and Investment Income and Other General Revenues account for less than 1.5%. 1
The Office of the Comptroller undertook a review of the County’s third largest revenue source,
NTNG. These revenues account for a small but significant percentage of Nassau County’s annual
revenues. At a time when our taxpayers are overburdened with property taxes and government
grants are expected to decline, the County must look for opportunities to increase revenue. The
County’s NTNG revenues in 2009 amounted to $178.2 million or 6.5% of total County revenues
($2,737.60 million). The objective of the review was to identify opportunities to increase NTNG
revenues and to quantify the potential size of those opportunities.
The approach taken in this review is to assess the performance of Nassau County in generating
NTNG revenues as compared to its two closest suburban Counties, Suffolk and Westchester. As
a basis of this comparison, we utilized the Comprehensive Annual Financial Reports (CAFR) of
the respective counties. We specifically examined fiscal years 2006 to 2009 where the CAFRs
followed similar accounting principles used in Nassau for assembling the NTNG Revenue
category. However, 2008 is the latest year that financial reports are available for comparison
amongst all three of the Counties (the Westchester CAFR is not available for 2009).
In 2008, Nassau County earned $174 million in NTNG revenues or 6.5% of total revenues. By
contrast, Suffolk County earned $184.42 million (6.88%) and Westchester County earned
1 Nassau County CAFR, 2009.
Page 3 of 21
$234.74 million (11.14%) 2 . Suffolk and Westchester had smaller budgets than Nassau in 2008
yet they earned higher percentages of NTNG Revenues, outperforming Nassau County. This
pattern of underperformance by Nassau County in generating alternative NTNG Revenues has
persisted since 2006.
Assuming that Nassau County could perform as well as the 2008 average between Suffolk
(6.88%) and Westchester (11.14%) of 9.01%, Nassau would increase its NTNG revenues by $67
million. Even a 1% increase would raise an additional $26 million 3 .
Nassau County is underperforming due to lack of management focus and lack of priority by
individual County departments. In some cases, the departments look upon generating revenues as
secondary to their primary missions. This needs to change. Consideration must be given to
creating a new department with the primary mission of better management of current NTNG
revenues and finding new revenue opportunities.
2 According to the 2008 CAFRs of each respectable County. 3 Information obtained from sourcing the CAFR of each respective County for 20062009 (Westchester CAFR not available for 2009).
Page 4 of 21
2.0 Nassau’s NTNG Revenue Performance vs. Suffolk and
Westchester
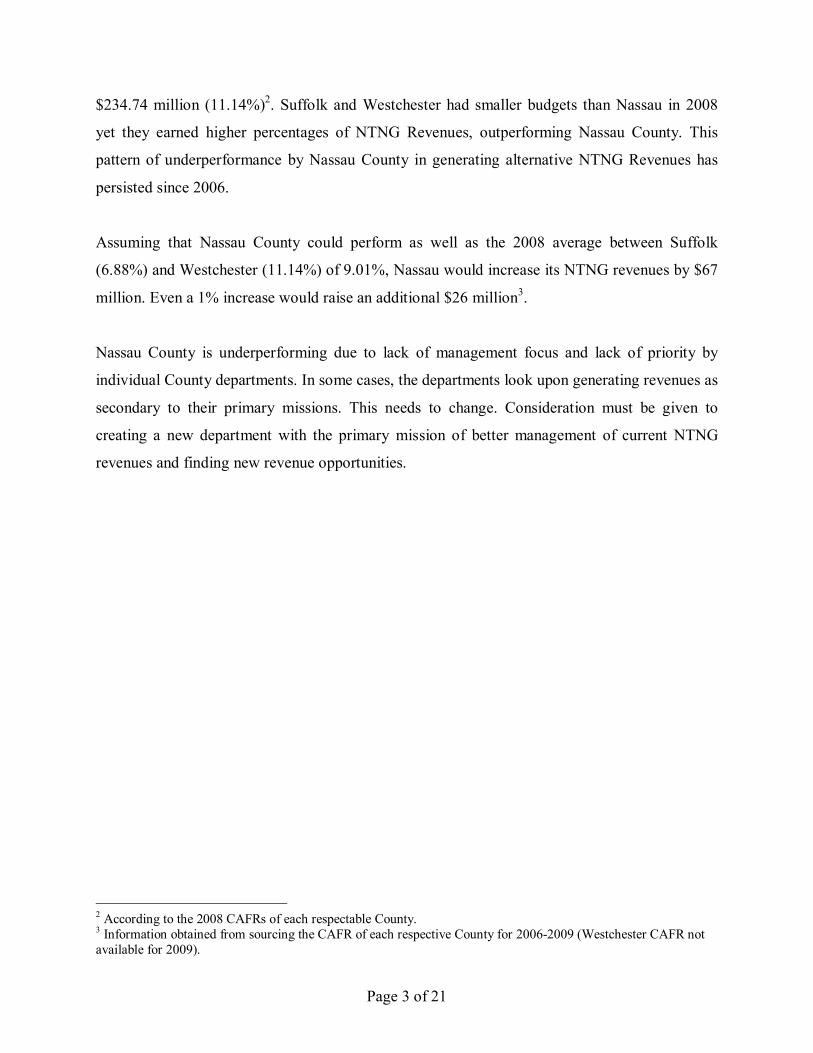
Table 2 of Nassau County’s CAFR categorizes the five major revenue sources:
1. Taxes 2. Grants 3. Charges for Services (NTNG ) 4. Investment Income 5. Other General Revenues
By far the largest revenue producer is Taxes, followed by Grants, NTNG, Investment Income,
and Other General Revenues. Our primary focus was on the NTNG revenue category. Figure 1
below illustrates the relative size of the County’s NTNG Revenue category. In 2009, this revenue
amounted to $178.2 million (6.5%) of the total County revenue ($2,737.60 million) 4 .
As Indicated in the Executive Summary, this report refers to the Charges for Services category as
NTNG revenues. In some figures we may use the term “Charges for Services” to better relate to
the CAFR reference data.
Figure 1
Nassau County 2009 Revenue Sources by Category
Tax 72.8%
Charges for Services 6.5%
Investment Income 0.5%
Other 0.9%
Grant 19.2%
4 Nassau County CAFR, 2009.
Page 5 of 21
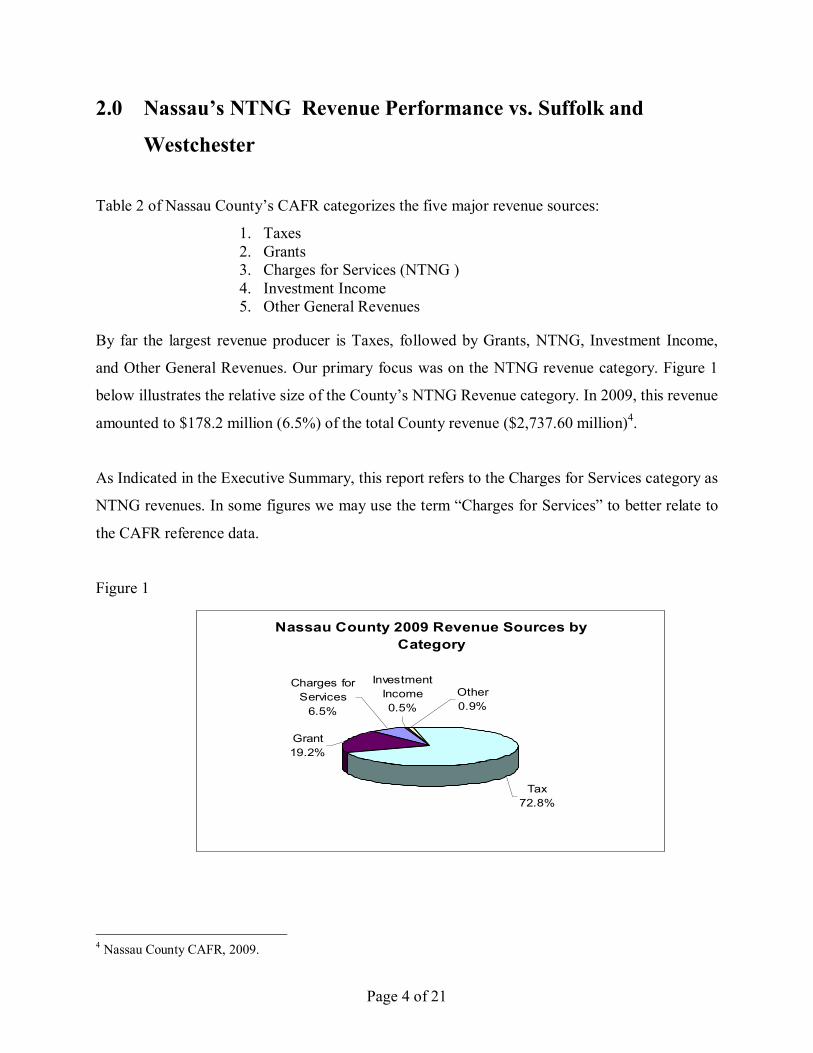
Figure 2 below illustrates that Nassau County’s NTNG revenue has been steadily decreasing
every year as a percentage of total revenue since at least 2006 when it made up over 7.3% of the
County’s Income.
Figure 2
Nassau County NTNG Revenue as a % of Total Revenue
6.51% 6.50%
7.21% 7.38%
6.00% 6.20%
6.40% 6.60% 6.80% 7.00% 7.20% 7.40% 7.60%
2006 2007 2008 2009
Nassau County has experienced a $17.2 million NTNG revenue (8.8%) decrease from 2006
revenue levels. At the same time, Suffolk and Westchester counties have seen increases of
$11.23 million (5.81%) and $48.57 million (26.09%) 5 respectively (See Figure 3 below).
5 Figure represents 20062008 data only, 2009 CAFR was not available.
Page 6 of 21
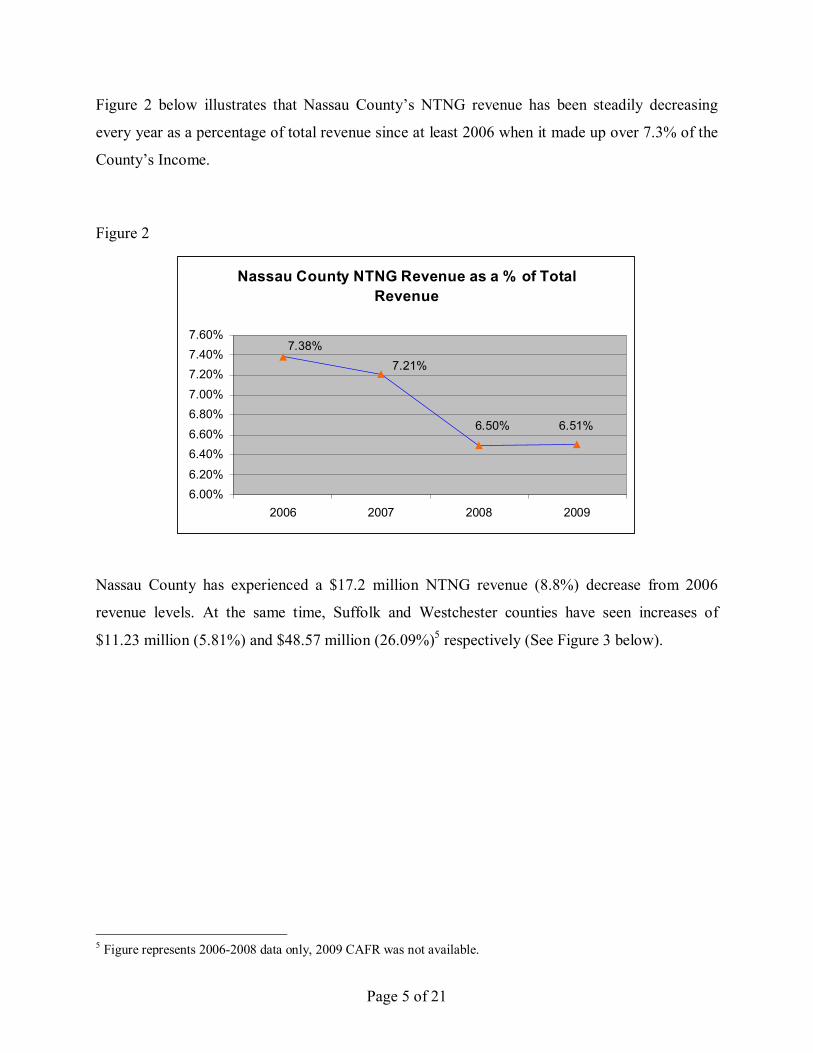
Figure 3 6
NTNG Revenue as a Percentage of Total Revenue
4.00%
8.00%
12.00%
2006 2007 2008 2009
Nassau Suffolk Westchester
In 2008, the latest year for which financial reports were available for Nassau, Suffolk and
Westchester (Westchester CAFR report is not available for 2009), Nassau County earned $174
million in NTNG revenues or 6.5% of total revenues ($2,678.40 million). By contrast, Suffolk
County earned $184.42 million (6.88% of the $2,681.70 million budget) and Westchester County
earned $234.74 million (11.14% of the $2,106.90 million budget). 7 Suffolk and Westchester
have smaller budgets than Nassau yet they earn higher percentages of NTNG revenues
outperforming Nassau County. This pattern of underperformance by Nassau County in
generating NTNG Revenue has persisted since 2006 and has gradually gotten worse.
In order to further understand the differences in NTNG revenue sources among the Counties and
identify opportunities, we looked at the following subcategories of Nassau County’s NTNG
revenues:
a. Departmental Revenue b. Fines & Forfeitures c. Licenses & Permits d. Rents & Recoveries e. InterDepartmental Revenue f. Other
6 Study starts at 2006 to reflect changes in accounting methods. 7 According to the 2008 CAFRs of each respectable County.
Page 7 of 21
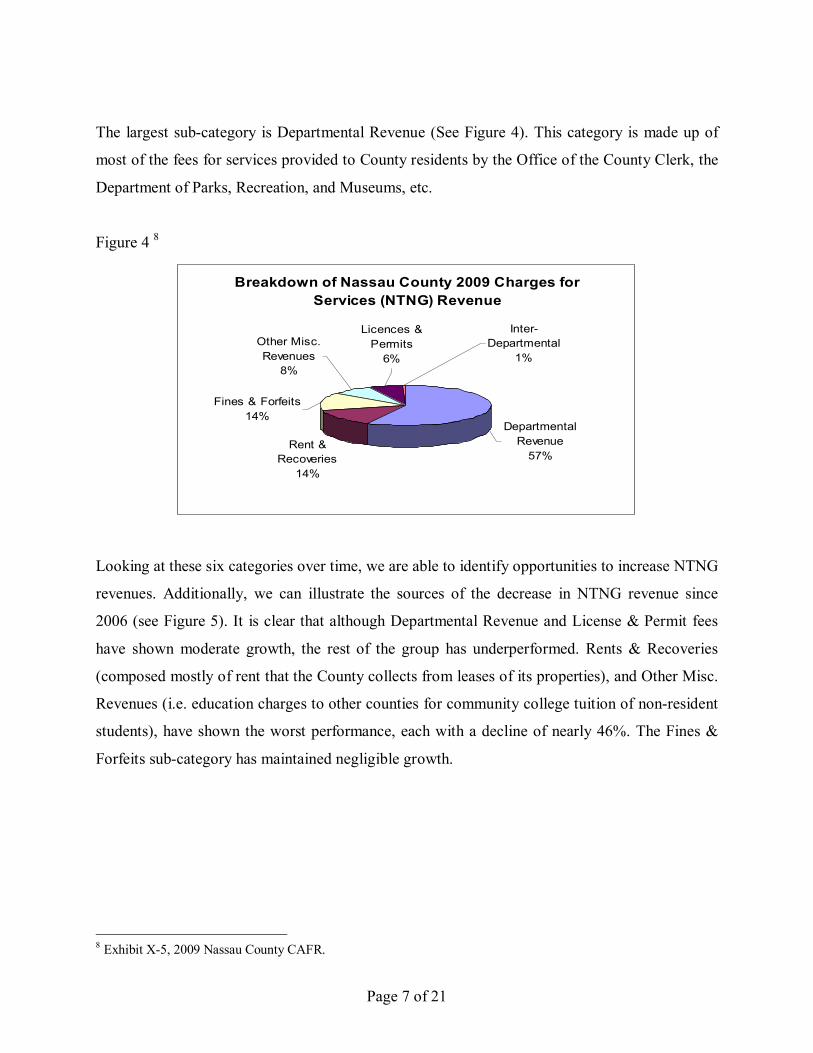
The largest subcategory is Departmental Revenue (See Figure 4). This category is made up of
most of the fees for services provided to County residents by the Office of the County Clerk, the
Department of Parks, Recreation, and Museums, etc.
Figure 4 8
Breakdown of Nassau County 2009 Charges for Services (NTNG) Revenue
Rent & Recoveries
14%
Departmental Revenue 57%
Licences & Permits 6%
Inter Departmental
1% Other Misc. Revenues
8%
Fines & Forfeits 14%
Looking at these six categories over time, we are able to identify opportunities to increase NTNG
revenues. Additionally, we can illustrate the sources of the decrease in NTNG revenue since
2006 (see Figure 5). It is clear that although Departmental Revenue and License & Permit fees
have shown moderate growth, the rest of the group has underperformed. Rents & Recoveries
(composed mostly of rent that the County collects from leases of its properties), and Other Misc.
Revenues (i.e. education charges to other counties for community college tuition of nonresident
students), have shown the worst performance, each with a decline of nearly 46%. The Fines &
Forfeits subcategory has maintained negligible growth.
8 Exhibit X5, 2009 Nassau County CAFR.
Page 8 of 21
Figure 5 9
NTNG Growth for 2009 by SubCategory (in millions)
SubCategory Growth over
period (’06 to ’09) 2006 2007 2008 2009 Departmental Revenue 12.76% $ 90.27 $ 97.49 $ 93.49 $ 101.78 Rent & Recoveries 44.15% $ 43.87 $ 25.68 $ 31.19 $ 24.50 Fines & Forfeits 0.91% $ 25.56 $ 23.60 $ 24.14 $ 25.79 Other Misc. Revenues 45.90% $ 25.18 $ 33.40 $ 12.43 $ 13.62 Licenses & Permits 9.54% $ 10.53 $ 10.58 $ 10.18 $ 11.53 InterDepartmental $ $ 3.67 $ 2.58 $ 1.01 Total: 8.79% $ 195.40 $ 194.41 $ 174.00 $ 178.23
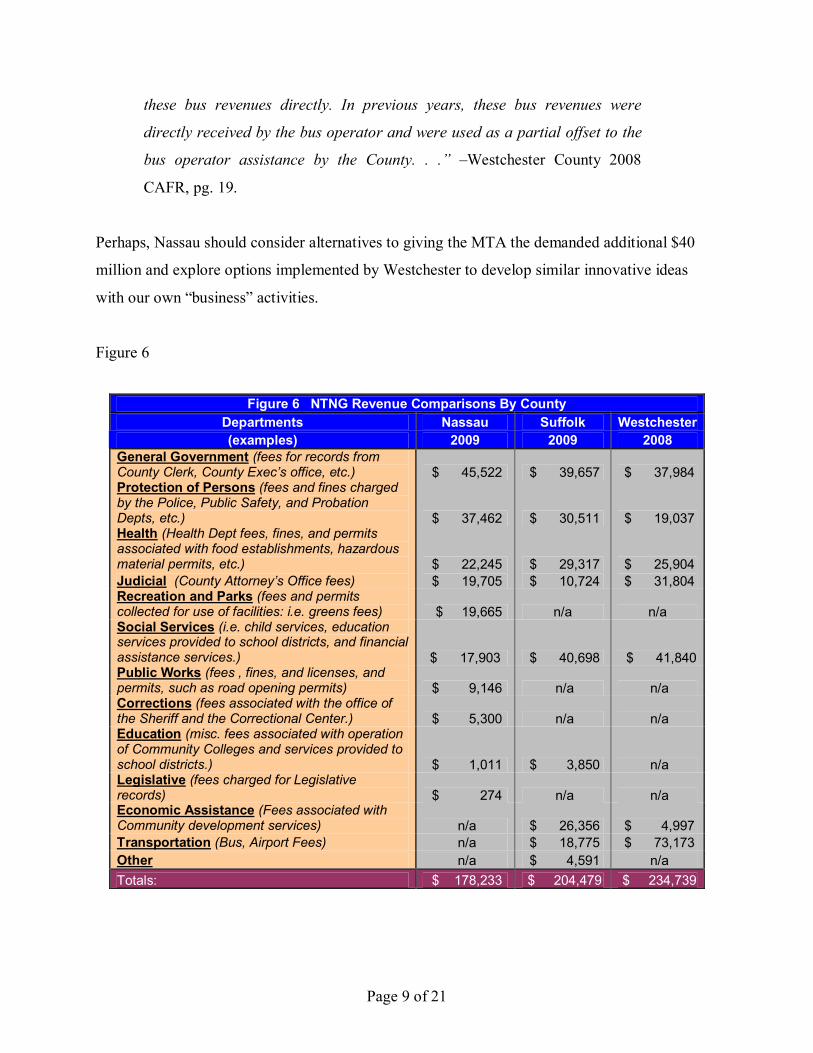
In an attempt to determine trends and opportunities we then compared the Nassau County data in
Figure 5 with the NTNG revenue components of Suffolk and Westchester by department, The
next table in Figure 6, which follows, vividly demonstrates that although Nassau County is a
much larger County, it matches Suffolk and Westchester in some revenue categories but lags in
many others. For example, Nassau significantly lags Suffolk and Westchester in Health and
Social Service revenue. Just like its counterparts Nassau must learn new ways to increase
County NGNT revenues.
Assuming that Nassau County could perform only at the 2008 average rate of revenue between
Suffolk (6.88%) and Westchester (11.14%) of 9.01%, Nassau would increase its NTNG revenues
by $67 million. Even a 1% increase to 7.5% of total County revenues would raise an additional
$26 million.
Westchester was able to increase revenues by focusing on various initiatives. For example, in
2008 Westchester implemented its MetroCard program, which made up a large part of a $24.9
million increase in Transportation revenues.
“. . . $24.9 million is primarily attributable to the implementation of the
MetroCard on County buses for the full year 2008 and the County receiving
9 Nassau County CAFR, 20062009.
Page 9 of 21
these bus revenues directly. In previous years, these bus revenues were
directly received by the bus operator and were used as a partial offset to the
bus operator assistance by the County. . .” –Westchester County 2008
CAFR, pg. 19.
Perhaps, Nassau should consider alternatives to giving the MTA the demanded additional $40
million and explore options implemented by Westchester to develop similar innovative ideas
with our own “business” activities.
Figure 6
Figure 6 NTNG Revenue Comparisons By County Departments Nassau Suffolk Westchester (examples) 2009 2009 2008
General Government (fees for records from County Clerk, County Exec’s office, etc.) $ 45,522 $ 39,657 $ 37,984 Protection of Persons (fees and fines charged by the Police, Public Safety, and Probation Depts, etc.) $ 37,462 $ 30,511 $ 19,037 Health (Health Dept fees, fines, and permits associated with food establishments, hazardous material permits, etc.) $ 22,245 $ 29,317 $ 25,904 Judicial (County Attorney’s Office fees) $ 19,705 $ 10,724 $ 31,804 Recreation and Parks (fees and permits collected for use of facilities: i.e. greens fees) $ 19,665 n/a n/a Social Services (i.e. child services, education services provided to school districts, and financial assistance services.) $ 17,903 $ 40,698 $ 41,840 Public Works (fees , fines, and licenses, and permits, such as road opening permits) $ 9,146 n/a n/a Corrections (fees associated with the office of the Sheriff and the Correctional Center.) $ 5,300 n/a n/a Education (misc. fees associated with operation of Community Colleges and services provided to school districts.) $ 1,011 $ 3,850 n/a Legislative (fees charged for Legislative records) $ 274 n/a n/a Economic Assistance (Fees associated with Community development services) n/a $ 26,356 $ 4,997 Transportation (Bus, Airport Fees) n/a $ 18,775 $ 73,173 Other n/a $ 4,591 n/a Totals: $ 178,233 $ 204,479 $ 234,739
Page 10 of 21
The County should focus on those areas which currently generate the most revenues and which
provide the best opportunity for significant revenue increases. By far, the largest areas that
generate revenue in Nassau County are “General Government,” “Protection of Persons,” and
“Health.” The County Clerk’s Office makes up over 30% of General Government revenues by
collecting over $15 million a year, comprised mostly from fees associated with mortgages,
deeds, real estate, and court fees. The Protection of Persons category reflects a majority of fines
and fees associated with the Police, Public Safety, and Probation departments. The largest items,
over 50% of collected revenues, were primarily from traffic tickets and red light camera fines.
The Health category was the third largest producer, composed mainly of Health Department fees,
fines and permits. Food establishment permits, renewal fees, and inspection fines, coupled with
hazardous material registration fees, made up almost $3.5 million of this category in 2009. 10
The Nassau Parks & Recreation category perhaps illustrates one of the most evident
opportunities in the chart. The Department of Parks, Recreation and Museums is generating
almost twice that of Suffolk but one third less than Westchester. Almost all revenue generated,
$18.875 million, came from fees associated with rental of facilities, concessions, and golf.
Nassau should be exceeding the Westchester revenues. 11
10 Nassau County Information System (NIFS), YE2009. 11 Nassau County Information System (NIFS), YE2009.
Page 11 of 21
3.0 Qualitative Survey of Nassau County NTNG Revenue
Management
The analytical findings are discussed in Section 2 above. In order to understand the Nassau
County NTNG revenue management processes and opportunities for improvement, this Section
summarizes the telephone and inperson interviews that were conducted with various budget
officers, accountants, and department commissioners.
The following will not only illustrate the problem Nassau County faces in generating NTNG
revenues, but also the opportunities to increase this revenue category. Four major areas of
shortcomings in the current organization are highlighted:
1. Revenue sources are not fully developed.
2. There is little or no interdepartmental knowledge sharing or coordination.
3. NTNG revenues are not a priority for each department.
4. There is no central management accountability or accounting for NTNG revenue. No
one is thinking about tracking existing revenues, collection methods or new ideas for
earning new revenues.
3.1 Departmental Revenue.
3.1.1 Department of Public Works: Restart AdoptaRoad Program & Increase
Subdivision Inspection Plan Resubmission Fee.
1. Findings: Earlier in the decade, the Department of Public Works (DPW) contracted
with a private company to operate an “AdoptaRoad” program on County roads. An
individual, a company, or a civic association would pay the County and maintain a
section of a County road in return for a “This mile adopted by…” sign. Though the
contract was worth $17,000 in 2007, it was allowed to lapse without a new operator being
found. 12
12 According to Department of Public Works officials.
Page 12 of 21
Opportunity: The AdoptaRoad program should be revived and aggressively marketed
to potential sponsors since it creates revenue while imposing nexttonothing costs on the
County. If marketed well, the program could attract significantly more sponsorship than
its prior incarnation did.
2. Findings: DPW charges a $2,028 fee to review proposed development of a land parcel
to ensure that sanitation, drainage, and traffic standards for the project are met. This
involves the submission of blueprints and maps. If the plans need to be resubmitted for
further review, another fee of $213 is assessed. Resubmissions cost the DPW time and
money to review, yet the resubmission fee is only 10% of the original submission fee. In
contrast, the fee to review site plans for building done adjacent to County property (a
239K review) is $427, with a resubmission fee of $213—nearly 50% of the original
submission fee. 13
Opportunity: The subdivision plan review resubmission fee should be increased to
further discourage contractors from haphazardly completing the original submission.
This increases revenue while reducing the DPW’s plan review workload.
3.1.2 Police Department: Install MuniMeters in County Complex.
Findings: Many of the parking meters around the County Complex are broken, as
evidenced by the large number of red bags adorning the meters. There meters have gone
unfixed for months while the Police Department and Department of Public Works dispute
who is responsible for their repair. Meanwhile, thousands of dollars in potential parking
tickets and parking fees are lost monthly.
Opportunity: The Police Department is currently in negotiations with companies that
would repair and maintain the meters. The Department is also considering eliminating
the parking meters and instituting a “munimeter” system. This system, which currently
13 Nassau County Information System (NIFS), YE2009.
Page 13 of 21
exists in the Hempstead Courthouse parking lot, requires drivers to type in their parking
space number and place change into a central munimeter. The Police Department should
install munimeters instead of parking meters in large parking fields like the County
Complex. A munimeter system (which requires only one machine per parking lot)
would be much less expensive to install, repair and maintain than hundreds of parking
meters. According to the Nassau County Office of Purchasing, a pilot program is
expected to run starting October, 2010 in selected parking areas in the County.
3.1.3 Department of Parks, Recreation and Museums: Increased Weekend and Holiday
Fees & Develop PublicPrivate Partnership Initiatives.
1. Findings: The Department of Parks, Recreation and Museums (Parks) facilities are
used most frequently on weekends and holidays. Although 18hole golf fees are more
expensive on weekends, the fees for the batting cages, ice skating rinks, swimming pools,
beach parking, 9hole and twilight golf, and minigolf are the same on weekdays and
weekends.
Opportunity: Weekend fees for these activities should be increased and paired with a
modest cut in weekday fees. Furthermore, Nassau County residents who hold leisure
passes are charged the same amount to rent golf carts as residents without leisure passes
and nonresidents. The latter two groups should be charged a higher price to rent golf
carts.
2. Findings: In 2008, Parks proposed a $4.4 million per year per contract deal with a
prominent marketing company. 14 The contract would allow this contractor to place
electronic signboards in parks and other County facilities, which would display both
advertisements and emergency messages. Though the contract was not finalized in 2009,
it is currently being renegotiated.
14 According to Parks Department officials.
Page 14 of 21
Similarly, there is significant scope for selling advertisements, sponsorships, naming
rights, pouring rights, and franchising in park facilities. Though similar measures have
been taken in Suffolk County there has been little impetus to pursue their implementation
in Nassau County.
Opportunity: Parks should explore the sale of the naming rights to its main facilities,
such as the Nassau Coliseum, Mitchell Athletic Complex, the Aquatic Center at
Eisenhower Park, the Lakeside Theater, and the Eisenhower Red/White/Blue 18hole golf
courses. Renaming the Nassau Coliseum faces significant obstacles in that Section
2206A of the County Charter mandates that the Coliseum’s name is “Nassau Veterans
Memorial Coliseum” and the original lease limits any sale of naming rights to the
Coliseum’s tenant (i.e. the New York Islanders.) Nevertheless, the opportunity exists to
sell the naming rights to many of these facilities.
Furthermore, advertising should be placed in strategic locations in Park facilities. One
obvious location is the Mitchell Athletic Complex’s baseball, soccer and lacrosse fields.
Currently, the baseball fields’ outfield walls are blank—an ideal placement for
advertisements. Significant opportunities for event sponsorship exist; local marathons,
ethnic festivals, and the Old Timers’ PGA tournament all lack corporate sponsors.
Expanded franchising in Park’s facilities would also represent a new and lucrative
revenue stream. Parks could sell pouring rights (i.e. selling a major food and beverage
manufacturer the right to sell its products exclusively in County facilities), since clauses
in the County’s food and drink concession contracts require concessions to abide by any
future pouring rights deal. 15 Parks could sell a bank the exclusive right to operate ATMs
in park facilities, as the Bronx Zoo does with Bank of America. Finally, the Old
Bethpage Historical Village has been redeveloped and improved in recent years. A
resultant increase in the number of visitors creates an opportunity for a restaurant, gift
shop, and other facilities within the Village. Parks should lease the space for these
operations to a private company and receive a share of the concession’s profits.
15 According to Parks officials.
Page 15 of 21
Compensation for the sale of naming rights, advertising, etc. in the form of capital
investment and donations as well as cash should be encouraged, since this would ensure
that revenue raised by the Parks would be reinvested into County parks. Companies
could also donate park facility improvements to foster community relations and goodwill.
This could form the basis of an AdoptaPark program similar to the one in MiamiDade
County, Florida.
3.1.4 Other: Industrial Development Agency Should Sell Advertising Space In The
Official Visitors Guide.
Findings: The Industrial Development Agency (IDA) is responsible for promoting
tourism in Nassau County. The agency prints an Official Visitors Guide every year,
promoting the various activities and events that occur in the County during the summer.
It also has a listing of the hotels, motels and shopping malls in Nassau County.
Opportunity: The agency should begin charging these businesses a nominal fee to be
mentioned in the Visitors Guide, since being listed in the publication helps increase their
business. Furthermore, the agency should sell advertising space to local merchants in the
Visitors Guide as well. Currently, the IDA is not included in the NTNG revenue area
because it does not generate income. These fees could be used primarily to defray the
cost of operating the Agency.
3.2 Fines & Forfeits.
3.2.1 Department of Public Works: Institute New Illegal Road Cutting Fine.
Findings: DPW requires anyone cutting a County road (almost always a utility company
making a repair) to buy a $160 permit each time work requiring road cutting is done. 16
The 2009 revenue from this fee was $380,884, suggesting that 2,380 permits were bought
16 Nassau County Revenue Manual, 2007.
Page 16 of 21
that year. 17 This figure is likely to be low, since there is weak enforcement due to staff
reductions and there is no fine for cutting a road without a permit.
Opportunity: An escalating fine (higher fines for multiple violations) should be
introduced to deter utility companies and builders from attempting unauthorized road
cuts. The fine will raise revenue while also increasing the number of permits bought,
since more wouldbe road cutters will want to avoid being fined.
3.2.2 Planning Department: Enforce the Unauthorized Building Fine.
Findings: The County, upon recommendation of the Planning Commission, has the
authority to levy a $10,000 fine per occurrence for unauthorized building construction. 18
The County Attorney is tasked with investigating suspected violations. The fine was
increased from $1,000 to $10,000 in 2004, indicating that the department viewed
unauthorized building as an unsolved problem in need of a stronger deterrent. 19 The
2005 Revenue Manual estimates that five unauthorized building violations occur every
year. However, no such fines have been assessed since at least 2003. 20
Opportunity: It is difficult to believe that no unauthorized construction has happened in
the past seven (7) years. If the Revenue Manual’s estimate is correct, enforcement of this
law would create an estimated $50,000 in revenue per year.
3.2.3 Traffic and Parking Violations Agency: Extended Parking Restrictions.
1. Findings: Nassau County has hundreds of parking meters and parking restrictions in
areas not directly subject to town or village ordinances. Some examples include
Memorial Place in Manhasset and the County Complex in Mineola. Parking limitations
17 Nassau County NIFS YE, 2009. 18 Nassau County Budget, 2010. 19 Nassau County Revenue Manual, 2007. 20 Nassau County Revenue Manual, 2005.
Page 17 of 21
such as ninetyminute parking and parking meters are generally limited to weekdays
between 9 am and 6 pm.
Opportunity: Since suburban downtowns often attract residents (customers at movie
theaters, restaurants, bars, etc.) during evenings, weekends, and holidays, parking
limitations should be extended to those times in order to generate more parking ticket
revenue. Extending these restrictions to towns and villages would require changes in
local ordinances; therefore, it is easiest to first enact parking restriction changes in areas
where the County has direct control over parking laws.
3.2.4 Other: Introduce Expedited Service Fees.
Findings: Recently, the Health Department introduced a new fee for expedited
processing of a permit or license application; this is similar to the expedited service fee
one can pay when applying for a passport. This fee is meant to reimburse the department
for the additional cost of faster permit processing (i.e. overtime costs). Unlike most fee
increases, the expedited service fee is politically palatable since it is optional and results
in faster service.
Opportunity: Other departments that grant permits and licenses, like Planning, the
DPW, and the County Clerk’s office, should also introduce expedited service fees in
order to increase revenue and improve service.
3.3 Rent & Recoveries: Real Estate Planning and Development.
Findings: The Mitchell Field Properties are a 1,265acre former airbase near the Nassau
Coliseum. The federal government turned it over to Nassau County in 1963. In the
1980s, the County signed 99year leases with commercial developers to build office and
industrial space on the land. About $5.8 million in revenue from rent is expected in
2010, which the Department of Real Estate Planning and Development (REPD)
Page 18 of 21
collects. 21 The terms of the contract are extremely disadvantageous to the County, as
they do not contain appropriate adjustments for inflation.
Opportunity: The rents for most of the properties are frozen for the next 75 years. The
County should sell the properties to their tenants and/or sell the rights to collect future
rents to a thirdparty property management company. This would help the County cut its
losses on a poor investment, giving it an upfront, lumpsum payment that it could invest
differently in order to generate a higher return. Currently, the REPD is considering a rent
securitization program. Other areas also deserve special analysis. The County could more
aggressively move to sell its inventory of real estate, better manage its heritage properties
and pursue sponsorship/advertising and cell antenna opportunities.
3.4 Licenses & Permits.
3.4.1 Police Department: Improved Alarm System Permit Collection.
Findings: Homeowners and business owners with alarm systems connected to the Police
Department are required to buy a permit every three years. The fees are $75 for a new
residential permit, $100 for a new commercial permit, $60 for a renewed residential
permit and $80 for a renewed commercial permit. 22 In 2009, the County generated $2.43
million in revenue from this fee. 23 In the same period, new permits were issued in a
breakdown of 3,801 residential and 321 commercial. Renewals in 2009 were made up of
33,760 residential and 836 commercial. 24
Opportunity: Given that Nassau County has approximately 1.35 million residents,
approximately 440,000 households, it is possible that a significant discrepancy between
21 According to the Real Estate Planning Department. 22 Nassau County Revenue Manual, 2007. 23 Nassau County Integrated Financial System YE2009. 24 Permit statistics obtained from the PDCN.
Page 19 of 21
alarm usages and permit fees collected may exist. 25 Although a more indepth study may
be required to calculate the exact amount of lost revenue, we recommend a more
effective method of collecting the fee be devised. The alarm fee should be assessed on
the several alarm companies that operate in Nassau County rather than on thousands of
homes and businesses. This would greatly simplify fee collection and would sharply
increase compliance, since the alarm companies can simply pass the cost of the alarm
permits on to their customers in their regular monthly billing.
3.5 Index as Many Fees, Fines, Permit Costs, Contract Payments, etc. to Inflation
Findings: Most of the fees, fines, and permit/license costs that Nassau County charges
are not annually adjusted for inflation. Many revenuecreating contracts were written
either without properly accounting for price increases or without the correct measure of
inflation (for example, the contract that reimburses the County for utility costs at Nassau
Coliseum is annually adjusted for regular CPI (Consumer Price Index) instead of energy
CPI.) Automatic annual adjustments for inflation would ensure that the County does not
lose revenue due to price increases.
Opportunity: Some fees and fines can only be increased by New York State law;
therefore, Nassau County should lobby for Legislative change to permanently index those
fees and fines to inflation.
3.6 Establish a Revenue Contract Department.
Findings: Revenuecreating contracts are generally negotiated by administrators in
County departments. The responsibility often falls to officials balancing other primary
responsibilities and lacking expertise in contract negotiation. There is little interaction
between officials in different departments tasked with writing and negotiating revenue
contracts. With this decentralized structure, “best practices” are not wellestablished
25 www.quickfacts.census.gov, Quickfacts for Nassau County, 2009.
Page 20 of 21
across different departments, resulting in contract terms that are disadvantageous to the
County.
Opportunity: A new Deputy County Executive for Contracts should be established to
negotiate all revenuecreating contracts. This Deputy would hire staff whose main job is
to negotiate contracts. These officials would work in close proximity, learn from one
another, and establish similar guidelines and practices for all contracts, improving their
quality.
3.7 Establish a New Department Responsible for all NonTax Revenues.
Findings: After meeting with the Health Department, several officials from other
departments were polled to find out if they had ever considered following the Health
Department’s lead and instituting expedited service fees. None of them were even aware
that the Health Department had introduced them. Not enough information sharing and
brainstorming happens between departments; this lack of coordination between
departments makes it harder for worthwhile ideas to become standard practice.
Opportunity: A new Department should be established with a primary mission to
manage and maximize nontax revenues comparable with the best run counties.
Page 21 of 21
4.0 Conclusion
Nassau County is trailing Suffolk and Westchester in NTNG. Nassau County has, and as
illustrated by this study, significant opportunities to increase NTNG Revenues by $26 to $67
million annually. These goals are readily attainable by just looking to Suffolk or Westchester
Counties and implementing the same innovative spirit. We can do better.
The main reason Nassau County has underperformed appears to be the lack of management
focus and lack of priority by the individual County departments. In all cases, the departments
look upon generating revenues as secondary to their primary missions. This needs to change. A
new department should be established with the primary mission to better manage current NTNG
revenues and discover new revenue opportunities.
Additional analysis is required to develop a comprehensive strategy to increase NTNG revenues
to the level of Suffolk and Westchester, and possibly other counties. Nassau County should
emulate and perhaps surpass the examples set by these counties for generating significant non
tax revenues through effective and accountable management.