Embed Size (px)
Citation preview

1
NARRATIVE REPORT 2017-18 (DRAFT)
INTRODUCTION
This Narrative Report sets out information intended to increase readers’ understanding of the financial position and performance of Oxfordshire County Council (OCC) during 2017-18.
ORGANISATIONAL OVERVIEW AND EXTERNAL ENVIRONMENT
Local government is a ‘two-tier’ system in Oxfordshire. This means that there is a county council providing services across the whole county, and five district councils which provide services to residents in their geographic areas. The five district councils in Oxfordshire are Oxford City, Cherwell, West Oxfordshire, South Oxfordshire, and Vale of White Horse. The county council is responsible for 80% of local government spending in Oxfordshire. This provides (for example) children’s services, some education services, fire and rescue, libraries and museums, coroners’ and registration services, roads and transport planning, adult social care, trading standards, and waste disposal. Services provided by the district and city councils include (for example) housing and benefits, local planning, street cleaning, waste collection and electoral registration. In Oxfordshire, parishes and town councils also play an important role in the local community, looking after local amenities, and providing a vital link to district and county councils on local issues. Oxfordshire has 15 town councils, 233 parish councils and 68 parish meetings. Parish and town councils increasingly deliver services, such as grass cutting in public spaces, in partnership with the county council, and provide a vital local link between the council and local communities. Oxfordshire County Council’s vision
Our vision is of a county where local residents and businesses can flourish – “thriving communities for everyone in Oxfordshire”. 'Thriving communities' was chosen during the first half of 2017-18 after feedback from residents who are passionate about where they live. The vision was published in a new Prospectus in October 2017, and set out our priorities:
• We listen to residents so that we can continue to improve our services and provide value for money.
Thriving communities
• We help people live safe, healthy lives and play an active part in their community.
• We provide services that enhance the quality of life in our communities and protect the local environment.
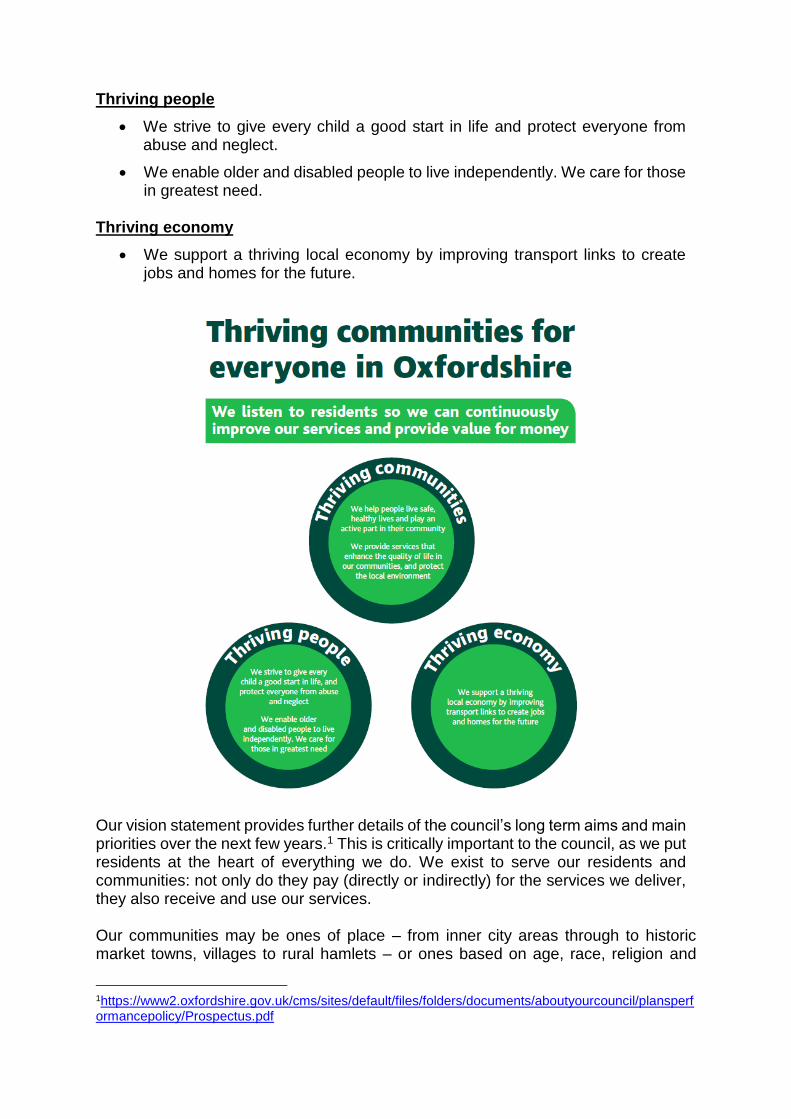
Thriving people
• We strive to give every child a good start in life and protect everyone from abuse and neglect.
• We enable older and disabled people to live independently. We care for those in greatest need.
Thriving economy
• We support a thriving local economy by improving transport links to create jobs and homes for the future.
Our vision statement provides further details of the council’s long term aims and main priorities over the next few years.1 This is critically important to the council, as we put residents at the heart of everything we do. We exist to serve our residents and communities: not only do they pay (directly or indirectly) for the services we deliver, they also receive and use our services. Our communities may be ones of place – from inner city areas through to historic market towns, villages to rural hamlets – or ones based on age, race, religion and
1https://www2.oxfordshire.gov.uk/cms/sites/default/files/folders/documents/aboutyourcouncil/plansperformancepolicy/Prospectus.pdf
many other factors. Our approach to supporting thriving communities must be as diverse as our communities themselves. We must listen to ensure that we are responsive to local issues and local need. It is also important that people see the council as providing value for money, constantly challenging itself to improve and embracing new opportunities and ways of working to help deliver effective and efficient services that make best use of public resources. The new vision is an ambitious step forwards from our current Corporate Plan.2 The latter has guided our work during 2017-18 and will remain relevant and in place for the immediate future. A new Corporate Plan for 2018/19 and beyond is in preparation and will in explain in more detail how we will work with partners and communities to achieve our vision. Our values
We have core values that guide the way we work to deliver our vision:
Our core value: We do the best we can for residents
This means we:
• work together in a supportive and honest way • strive to find the best solutions • are open to change and doing things differently.
We ensure all our activities support equality, diversity and fairness, both in our own workforce and the services we commission and deliver for local residents. How OCC is organised and managed
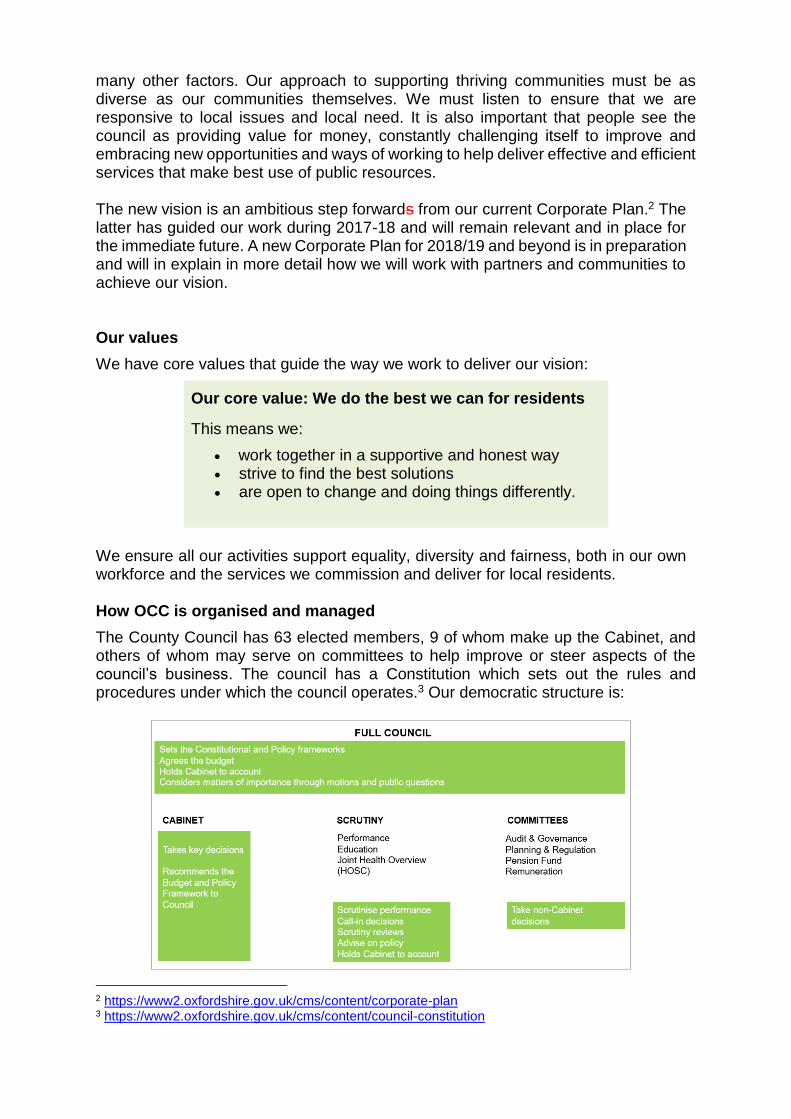
The County Council has 63 elected members, 9 of whom make up the Cabinet, and others of whom may serve on committees to help improve or steer aspects of the council’s business. The council has a Constitution which sets out the rules and procedures under which the council operates.3 Our democratic structure is:
2 https://www2.oxfordshire.gov.uk/cms/content/corporate-plan 3 https://www2.oxfordshire.gov.uk/cms/content/council-constitution

Full Council
Oxfordshire County Council’s 63 elected members, also known as Councillors, are each elected by local people in Oxfordshire to represent a particular local area, or ‘Division’. Details of the results of county council elections in May 2017 can be found on our website4. Collectively, councillors are responsible for setting the democratic structure of the council as well as the constitutional and policy framework for the organisation. They are also the ultimate policy-makers for the council, making major decisions on the services the council provides, setting the budget and overseeing how services are run. Decision-making in the council is made up of executive functions, with decisions by the Cabinet, individual cabinet members and officers under delegated authority, and non-executive or Council functions undertaken through scrutiny and other non-executive committees. Cabinet
A Conservative Independent Alliance (Conservative councillors plus three Independent councillors) forms the current administration. The Cabinet, responsible for key decisions, currently consists of the Leader of the council and eight other councillors. Details of their responsibilities can be found on our website.5 County Leadership Team
The County Leadership Team (CLT) is the most senior group of council officers (i.e. employees, not elected members). CLT is led by the Chief Executive and includes the senior officers listed on the organisation chart.6 CLT supports Cabinet and Council in their work and manages the council’s services and operations. CLT members include the council’s three Strategic Directors (for People, Communities and Resources) and Directors of our main service areas (such as, for example, Children’s Services and highways and infrastructure). These officers and responsibilities are set out in an organisational chart on our website.7 Scrutiny
The council’s scrutiny function involves non-Cabinet members in examining the county council's functions and performance, and in challenging and holding to account the Cabinet’s plans and decisions. There are currently three scrutiny committees: an overarching Performance Scrutiny Committee, an Education Scrutiny Committee and the Joint Health Overview Scrutiny Committee (jointly with Oxfordshire district councils and other co-opted members). Councillors’ local and national role
Locally, our councillors work on Oxfordshire’s behalf in many forums, including council committees and working groups and extending to parish activities, voluntary and
4 http://mycouncil.oxfordshire.gov.uk/mgElectionResults.aspx?ID=10&RPID=8387746 5 https://www2.oxfordshire.gov.uk/cms/content/cabinet 6https://www2.oxfordshire.gov.uk/cms/sites/default/files/folders/documents/aboutyourcouncil/manager
sanddepartments/tier1and2.pdf 7 https://www2.oxfordshire.gov.uk/cms/content/senior-managers-oxfordshire-county-council

community groups. More information on your councillors can be found on our website.8 Councillors also work on engaging national decision-makers and opinion-formers, such as our local MPs in Westminster and Ministers in central Government. The council monitors parliamentary questions and debates, Select Committees and information from government and other bodies, to make sure Oxfordshire’s issues are raised in national debates. Partners
We work with partners in the public, private and voluntary sector to achieve the best outcomes for our residents. The partnership landscape in which we work to deliver long-term visions can be complicated, but is becoming increasingly important with the trend towards more collaborative, cross-organisational approaches to meeting the needs of Oxfordshire residents. Our partnership working includes day-to-day partnering with voluntary and community groups, parish and town councils, businesses and other local organisations, and more formal partnerships, which include:
• Oxfordshire Health and Wellbeing Board (statutory)
• Oxfordshire Safeguarding Children Board (statutory)
• Oxfordshire Safeguarding Adults Board (statutory)
• Thames Valley Emergency Services Collaboration (statutory)
• Oxfordshire Growth Board
• Oxfordshire Local Enterprise Partnership
• Oxfordshire Environment Partnership
• England’s Economic Heartland
• The East West Rail Consortium
• Oxford to Cambridge Expressway Stakeholders
• Safer Oxfordshire Partnership
• Oxfordshire Stronger Communities Alliance
• Oxfordshire Strategic Schools Partnership Board
• Oxfordshire Early Years Board
Underpinning these formal partnerships is a network of informal and formal working relationships, working groups and contractual agreements that help to deliver services in line with our partnership strategies and priorities.
GOVERNANCE
Our Annual Governance Statement for 2017-18 is published alongside this Statement of Accounts. The Annual Governance Statement is required by Regulation 6(1)(b) of the Accounts and Audit (England) Regulations 2015. It provides an opinion on the Council’s governance arrangements from the Council’s senior managers and the Leader of the Council, and a review of the effectiveness of the Council’s governance arrangements.
8 https://www.oxfordshire.gov.uk/cms/public-site/about-your-council

Our “Fit For The Future” transformation programme
The council’s “Fit For The Future” (FFF) programme, begun in earnest during 2017-18, is a long-term programme of fundamental change to how we are structured and how we operate. The FFF programme is aimed at ensuring the council is sustainable, resilient and can achieve better outcomes for local residents. It will also address the financial pressures we face as an organisation, making substantial financial savings and helping us to invest in dealing with rising demand for services. The programme will play a key role in delivering the council’s new vision by empowering residents to resolve their own issues, enhancing service performance, empowering staff to help us deliver our ambitions and positioning us to exploit the local advantages Oxfordshire possesses Towards the end of the year the programme moved into a phase of “operating model” design, which is expected to be complete by July 2018. An operating model is a term that describes the way an organisation works. It is comprised of key components (e.g. people, process and technology), the interactions among those components and the ways we measure performance. It will allow us to deliberately design, in detail, how we want to use our resources to interact with customers and develop our business capabilities and corporate structure to deliver the best possible outcomes for our residents, and our Thriving Oxfordshire vision.
OPERATING MODEL
As noted above, “operating model” is a term that describes the way an organisation works. Our “Fit For The Future” programme is looking at how to achieve the right operating model for the council for the future.
Structural operating model
The council is structured around three strategic directorates, for People, Communities and Resources. A Strategic Director oversees each of these three areas of business, enabling clear oversight of the council’s priorities and business.9 Resources comprises:
• Finance, Human Resources and ICT
• Law and Governance
• Libraries, cultural and registration services People comprises:
• Children’s Services
• Adults’ Services
• Public Health Communities comprises:
9 The role of Strategic Director of Resources is held by the council’s Chief Executive.

• Infrastructure Delivery
• Planning and Place
• Property, Assets and Investment
• Community Safety (including Oxfordshire Fire & Rescue Service) With the exception of libraries, cultural and registration services each of these business areas is led by a Director who is a member of the County Leadership Team.10 Directorates are responsible for setting their strategies and business objectives for the year ahead and the longer term, in support of ambitions and commitments set out in the Corporate Plan. Common approaches to performance reporting, risk management and assurance are in place to ensure consistency and cohesive business management across the council. The performance dashboards later in this Narrative Statement are one of the visible outputs of this approach. Accountability for performance sits both with Directors – who may operate a Directorate Leadership Team comprising senior service managers and business partners for Finance and Human Resources – and potentially with external partners, delivery bodies and contractors. County Leadership Team holds collective accountability for the council’s business and performance as a whole.
Financial operating model
The Council sets a revenue budget, medium-term financial plan (MTFP) and capital programme in the February preceding the start of the financial year. These are underpinned by a Financial Strategy, Treasury Management Strategy and a risk assessment of the level of balances required. Construction of the budget and budget proposals are subject to challenge by the Council’s Leadership Team and the Director of Finance. Councillors have the opportunity to question and challenge the proposals through engagement sessions and member presentations. The Performance Scrutiny Committee scrutinises the budget proposals at its meeting in December before Cabinet propose the budget, MTFP and capital programme in January.
Throughout the year, regular financial monitoring reports are presented to Cabinet.
Revenue spending plans for 2017/18
Our budget for the provision of services in 2017/18 was set against a sound financial footing, with a four-year funding settlement agreed with government, a robust MTFP and the difficult decisions of previous years holding the organisation in a good stead for the future. There is still considerable financial challenge due to the Government’s on-going austerity programme of national reductions in public sector spending and an increasing demand for our services, however, the budget and MTFP set a clear direction for the future and place the Council in a sensible position to meet the challenges ahead.
Our Government funding will have reduced by a total of 49% (£169m per annum) between 2010/11 and 2019/20. As demand for statutory social care services has
10https://www2.oxfordshire.gov.uk/cms/sites/default/files/folders/documents/aboutyourcouncil/manage
rsanddepartments/tier1and2.pdf
continued to rise, this has resulted in the need to deliver significant savings. By the start of the year 2017/18, savings had been made of £300m per year compared with our spending in 2010 (of which 40% was due to the reduced government grant and 60% due to the rise in demand for statutory services). The 2017/18 budget agreed by Council in February 2017 included further savings of £61m.
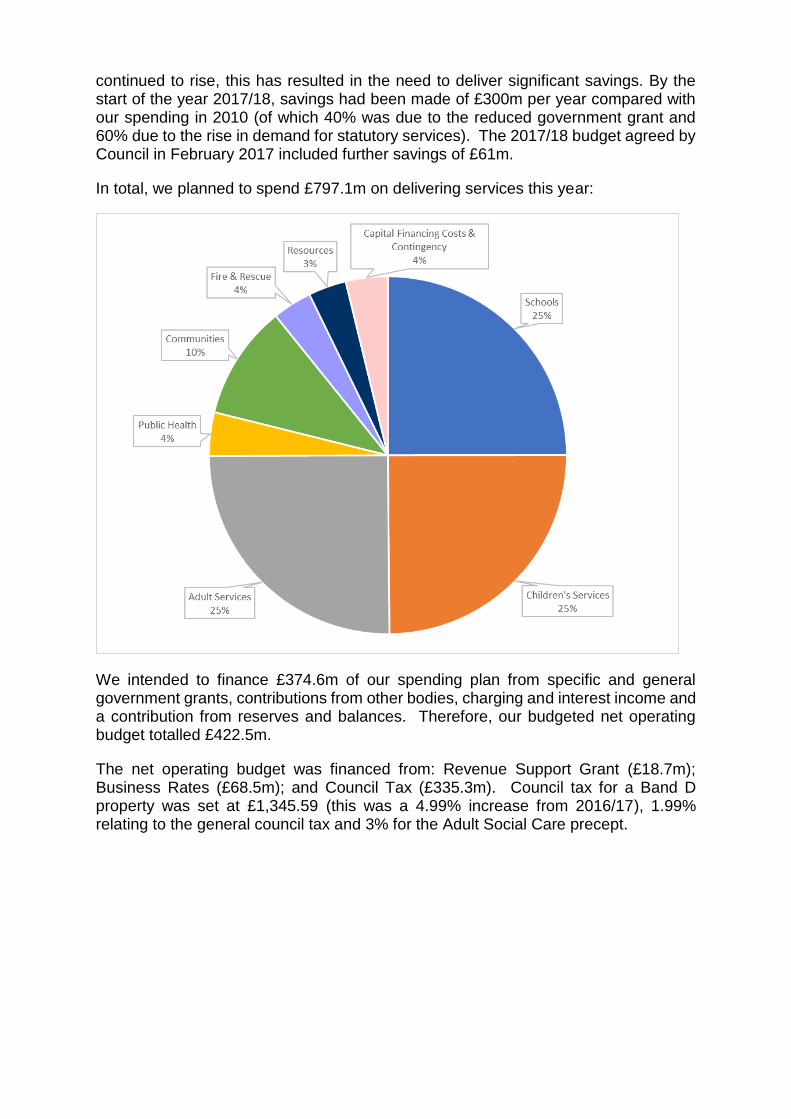
In total, we planned to spend £797.1m on delivering services this year:
We intended to finance £374.6m of our spending plan from specific and general government grants, contributions from other bodies, charging and interest income and a contribution from reserves and balances. Therefore, our budgeted net operating budget totalled £422.5m.
The net operating budget was financed from: Revenue Support Grant (£18.7m); Business Rates (£68.5m); and Council Tax (£335.3m). Council tax for a Band D property was set at £1,345.59 (this was a 4.99% increase from 2016/17), 1.99% relating to the general council tax and 3% for the Adult Social Care precept.

Capital Spending Plans for 2017/18
We planned to spend £118.2m on our assets in 2017/18. This included £37.6m on providing additional school places and new schools in housing developments and £54.1m on large road improvement schemes and road maintenance.
We planned to fund this from grants and contributions (£93m), prudential borrowing (£22.8m) and capital receipts (£2.4m).
OPPORTUNITIES AND CHALLENGES IN OXFORDSHIRE
We celebrate Oxfordshire’s many positive attributes, but we also recognise the many issues and challenges we face. Over recent years, we have risen to national economic challenges by creating and making the most of opportunities. As a result, between 2009 and 2015 our economy grew by over 30% in cash terms. Our ambitions for growth will bring benefits and opportunities, but also challenges: transport congestion, rising property prices, shortages of appropriate sites for growing businesses, rising demand for public services such as education and health, and a strong desire to protect our natural environment. Among the challenges we now need to respond to are:

Rapidly growing and ageing population. As of mid-2015, the Office for National Statistics (ONS) estimated the total population of Oxfordshire was 677,900 residents (including students and armed forces). Population forecasts, based on expected housing growth, predict an increase in the number of Oxfordshire residents of +183,900 people (+27%) between 2015 and 2030, taking the total population of the county to 864,200. This is more than double the growth of the previous 15 year period (2000 to 2015). Our population is not only growing but ageing too: each district in Oxfordshire has seen an historic growth in the number of residents who are 85 years and over, increasing 47% over the 15 years to 2015. This age group is predicted to rise over the next 15 years by 92%, which is very likely to place increased demand on our services, as well as potential new opportunities for older people’s roles in society.
Growing demand and cost of housing. The Oxfordshire Strategic Housing Market Assessment sets out a need for 100,000 new homes between 2011 and 2031 (of which 11,000 have been built to date). Our forecasting suggests this will result in a 27% increase in the population by 2031. The growing population and resulting demand for housing in the county is driving up the cost of houses at a higher rate than earnings and the Centre for Cities ranks Oxford as the least affordable UK city for housing. In Oxford city, social rents in 2015 were 18% above the national average. Buying a family home now requires the equivalent of 2-3 average earners per household in each district in Oxfordshire.
Reducing public funds alongside a growing demand for services. As a result of reduced Government grant funding, OCC has had to make savings of more than £350m over the last seven years. The need for our most expensive services continues to rise steeply. As people live longer, with more long-term health conditions, we are anticipating that more people and their families and carers will need local authority help. We are also seeing increasing numbers of adults with a learning disability presenting to the county council. Demand for children's services is rising too. Between March 2010 and March 2017 the number of children in Oxfordshire who were the subject of a child protection plan rose from 266 to 609 (a 139% rise), while nationally the figures rose by 30%. Last year locally the figures rose again to 725. Numbers of children who were looked after rose between March 2010 and March 2017 from 450 to 667 (a 42% rise), while nationally the figures rose by 13%. Last year locally the figures rose again to 691.
Pressure on our transport and infrastructure. The growth in housing and population presents a challenge to provide sufficient transport infrastructure to support connectivity between housing and jobs and community hubs like GP surgeries and schools. Additionally, the overall condition of the A and B highways network has declined beyond the target set at the start of the year, and is in need of significant ongoing maintenance and renewal. We estimate that around £8bn of investment will be required to ensure Oxfordshire's physical, social, and environmental infrastructures are fit to deal with the scale of planned development. Workforce challenges. The thriving local private sector economy has led to challenges recruiting staff at all levels in the public sector, due to the high cost of housing relative to earnings and very low levels of unemployment in the county. This has affected public services, from frontline care workers to GPs, head teachers and our on-call firefighters who need to live in the local community.
Deprivation and inequality. While we are generally a prosperous county, there are some significant pockets of deprivation. Fifteen local areas within Oxfordshire fall within the 20% most deprived neighbourhoods in England (for context, 193 fall within the 20% least deprived). Of these, the majority are within Oxford City, with others in Banbury and Abingdon. We will also need to continue to ensure we provide information and services in languages and formats which meet the changing needs of our local population.
Local response to Brexit. The opportunities and challenges arising from Brexit are currently unclear for Oxfordshire and its public services. Withdrawal from the EU is likely to have implications for public services, such as those provided by the council, and for the county more widely. The county seems well placed economically to adapt to any changes, whether positive opportunities or less desirable outcomes. Pressures on public services are likely to be felt in procurement, workforce, environmental, waste, and employment regulations. Additionally, Brexit could have implications for the patterns of enterprise and trade in the private sector, and for Oxford's universities.
Collaboration and integration between health and social care. The local health and social care systems continue to work together to ensure that people are discharged from hospital as soon as it is safe to do so, and that the care and support they need is available. Improvements have been made, but there is still much more to do in this area and all partners remain focused on this.
Educating the next generation. Educational attainment continues to improve, but remains below the levels we would expect and aspire to achieve. The proportion of pupils taught in schools rated as good or excellent by Ofsted continues to rise and we are working with our partners to improve attendance as this is known to have a positive impact on attainment.
Prevention and early intervention. Significant changes have been made to the way that early help is provided for people, with a far greater emphasis on taking a partnership approach rather than being the sole responsibility of the county council. We are working with partner organisations, community groups, and people, families and carers themselves to identify how best to access the support people need, as early as possible, to prevent needs escalating.
Rurality. The rural nature of the county can be a barrier for people accessing services.
Embracing digital solutions to customer contact and service delivery can help tackle this, but it requires a shift in culture and expectations for the county council and residents alike. We cannot completely replace traditional approaches including phone and face-to-face contact without affecting access to services in different ways.
Innovation and enterprise. Oxfordshire will develop a Local Industrial Strategy as part of its Growth Deal commitments with Government. This will be an excellent opportunity to promote key growth and innovation sectors of our local economy and an opportunity for the county council to support and invest these growth sectors, as well as supporting local innovation that can help meet Oxfordshire’s future needs.

PERFORMANCE MANAGEMENT
The Corporate Plan reflects our vision for delivering excellent public services to the people of Oxfordshire this year. To measure progress towards the priorities and outcomes set out in the Corporate Plan, OCC uses a performance management framework, centred on quarterly reporting (i.e. four times per year) to senior management, elected members and the public. Performance indicators which most clearly demonstrate progress towards the outcomes are developed with directorates as part of our service and resource planning process early in the year. Performance against each indicator and outcome is then compiled on a quarterly basis in dashboards. Supporting narrative is added to provide context and explanation where needed. Senior officers responsible for the delivery of work included in the dashboards provide quarterly ratings for each outcome. Ratings – based on the commonly-used Red, Amber, Green (or ‘RAG’) model – provide a short-hand view of performance:
• ‘green’ would indicate sound progress towards the relevant outcome, or that the outcome has been achieved;
• ‘amber’ would indicate difficulties, or dips in performance below intended levels, which will be resolved soon and usually without additional resources;
• ‘red’ would indicate significant doubt that an intended performance level or outcome will be achieved, or that targets set for particular activities are not being met at the time.
Using RAG ratings enables exception-based escalation of issues as needed. In reporting an outcome as ‘Red’ in a quarterly report, the relevant director also sets out the reasons for their assessment, what steps have been taken to seek improvement, and what the next steps might be. This enables collective decision-making to be undertaken by County Leadership Team or Cabinet, or for the council to be held to account for its performance by (for example) one of its three scrutiny committees, the public, or the press. Quarterly reports on performance are considered in public by Performance Scrutiny Committee. Performance Scrutiny Committee met 7 times in 2017-18 to consider performance across the council, focusing on matters of high priority or variable performance. The Committee can also call for additional reports from directors as required – known as ‘deep dives’ – to help them examine issues in detail to ensure that improvements are being made. The Committee also challenges proposed indicators and targets to ensure they are realistic and in line with strategic priorities. Performance summary 2017-18
The following summarises our performance this year as measured against our three Corporate Plan priorities: a thriving economy, protecting vulnerable people, efficient public services. The summary also reflects the performance information set out in the dashboards towards the end of this section.

Priority: A Thriving Economy
Oxfordshire’s economy is doing well, with the county’s economy generating output to the value of £21.9bn per year from 400,000 jobs and more than 30,000 businesses. A thriving economy gives everyone in Oxfordshire more opportunities, and creates the jobs, the housing and the infrastructure that help people and communities thrive. The work we have undertaken this year has aimed to secure investment in housing and infrastructure, support the development of skills, business and employment and deliver strategic infrastructure such as highways or transport schemes.
• We received good news in the Budget Statement in November that Oxfordshire has secured an additional investment of £215 million over the next five years as part of a Housing and Growth Deal. This money will support the acceleration of housing growth and associated infrastructure and will boost economic productivity across the county. The Deal includes £150m for infrastructure; £60m for affordable housing, and £5m capacity funding to support the delivery of the Deal including the development of a joint statutory spatial plan for the whole county.
• Following extensive engagement with stakeholders and the public, who also helped shape the document, the Oxfordshire Infrastructure Strategy was approved by the Oxfordshire Growth Board in September 2017. This is now a live document which will provide a framework that enables the county's planned growth, and is already proving important in underpinning the evidence base for the Oxfordshire Housing and Growth Deal referred to above. It will be updated at regular intervals alongside the Joint Statutory Spatial Plan.
• OCC has a strong track record of securing funding for innovative projects, many of which have been made as part of the Smart Oxford programme and our own Innovation & Research project. In total, 16 innovation bids were submitted this year.
• We have been successful in 7 innovation bids, predominantly from Innovate UK, but also Department for Transport innovation calls and recently the Small Business Research Initiative (SBRI). 4 recent bids will start in summer 2019 and will bring in £1million to OCC over project period which range from 12 months to 32 months. 3 of the new projects are in the Connected Autonomous Vehicle (CAV) sector: these projects, with 2 existing projects, have helped reinforce Oxfordshire as a true world leader in this sector, while exploring wider benefits from CAV such as automated highway asset condition monitoring, and real time data from vehicles to inform network management. The work also helps to put Oxfordshire in a good place to benefit from Industrial Strategy sector deals, particularly Mobility and Artificial Intelligence (AI), by already delivering and supporting a network for place-based Innovation.
• We have attracted a total of 198 new investment successes to the county this year, supporting in excess of 2000 jobs. Oxfordshire has benefited from a record 53 foreign direct investments representing £391m of overseas investment and the creation of 1200 jobs.
• In the face of a continuing increase in the volume of major planning applications on which we are consulted by our District colleagues (which are now running at three times the level of a few years ago), coupled with an upsurge in planning appeals and some internal staff resourcing issues, we have struggled to consistently meet

our target of responding to a minimum of 80% of applications within the required timescales. However, we are continuing to look for ways of sustaining our previous, consistently high performance levels on an ongoing basis.
• As regards those planning applications for which the County Council is itself the relevant planning authority – mostly minerals and waste management proposals – our performance has been excellent. Over the year, 92% of applications received (35 of 38) were dealt with on time.
• Oxfordshire Fire and Rescue Service (OFRS) provides support to business in the form of fire risk inspections for high-risk properties, primarily non-residential new-builds, significant alterations and refurbishments non-residential premises. Throughout the year a continuously high level of demand on our Fire Protection Team to advice on unwanted fire signals, post fire audits and complaints. Meant that we were unable to fully commit resources to the programme of proactive inspections of high-risk premises.
• The number of fire safety building regulation consultations received by OFRS was lower than expected. However, we processed 203 more consultations than last year and we continued to deal with them within the 15 day statutory timescale
• During the year we saw a steady improvement in the number and impact of interventions by our Trading Standards Team under the council's Notified Body status. This has been achieved through proactively establishing new working relationships with local supply/import businesses to verify accuracy of their measuring equipment. During the year we verified 810 weighing machines in 92 visits to businesses, compared with 541 machines in 2016-17.
• Educational attainment in Oxfordshire improved during the year. The 2016/17 validated education results show that Oxfordshire’s pupils continue to improve and attainment remains above the national average for children aged 5 (Early Years Foundation Stage) and Key Stage 4. Oxfordshire ranks within the top 25% of local authorities achieving grades 5-9 in both English and maths. In addition, the county ranks 30th out of 152 local authorities for pupils achieving grades 5-9 in maths. Attainment for Key Stage 2 children has increased in 2017 but remains slightly below national average.
• The percentage of good and outstanding secondary schools at the end of March 2018 (85.7%) in the county remains above the national average (80.5%), but the percentage in good and outstanding primary schools is below at 88.3% compared with 89.9% nationally.
• Ensuring all pupils are included in education is a priority, particularly regarding attendance, exclusions and pupils missing out. A series of breakfast meetings between head teachers and local authority officers were held in order to raise awareness of these issues and to develop a countywide commitment and strategy to improve inclusion.
• Despite national headlines about the drop in apprenticeship numbers, OCC now has more apprentices in our workforce than ever before. By year end we were employing 48 apprentices, either in the council itself or in county schools. This is
three times the number we employed in 2015-16. Current apprentice roles include Paralegals assigned to our Children’s Legal Services and new Customer Service Delivery Assistants working between our libraries and the Customer Service Centre. We also have apprentices working in diverse roles such as ICT, Business Administration, Civil Engineering and Digital Marketing. Additionally, our maintained schools have stepped up recruitment of apprentice Teaching Assistants and Early Years Educators. Our services’ recruitment and continuous professional development plans indicate that numbers of apprentices are likely to grow again by at least 20% in 2018-19.
• We undertook a public consultation on recycling and household waste. Titled “Talk rubbish with us”, the consultation will help to inform our 2018 Waste Strategy and help give people ideas of how to reduce the amount we all throw away, and to recycle more.
• The council’s flagship Central Library re-opened in Oxford’s regenerated Westgate Centre in December. The library offers a range of familiar and new features including a ‘Makerspace’ for community activities and special events, and a much larger children’s library. It will also serve as a ‘front door’ for visitors to access council services online and get the support they may need to do this.
Priority: Protecting Vulnerable People
We do all we can to keep people well, particularly those who may be vulnerable. We work to ensure that children and young people can experience a safe and supportive life, whether as newborns, or later at home or in school. We want to help older or disabled people to live safely at home and to avoid, reduce and delay the need for more complex care further down the line. Our Public Health team works in partnership with others across the county to help people to help themselves, and our Community Safety Services, which includes Oxfordshire Fire and Rescue Service, works proactively to ensure people are as safe as possible in their homes and in their everyday lives.
• We continue to promote healthy lifestyles and all our public health measures were met during the year. This includes over 97% of the eligible population (adults aged 40-74) being invited for an NHS Health Check since OCC took on responsibility for this, which represents a major transformation and improvement. Over 47% took up the offer, which is designed to spot early signs of (for example) stroke, kidney disease, heart disease, type 2 diabetes or dementia, and to help find ways to lower this risk.
• The proportion of serious users of drugs and alcohol who leave treatment successfully (free of dependence) and who don’t represent to services within 6 months is within the best quartile in England.
• Our commissioned Health Visiting services continue to outperform both the National and South-East average for all of the mandated reviews.
• Social care services in Oxfordshire are of a high standard. 88% of social care providers are rated as ‘good’ or ‘outstanding’ by the care quality commission compared to 81% nationally.

• The level of satisfaction with our adult social care services is higher than the national average. The last published figures (2016/17) showed 90% of people who use services in Oxfordshire are satisfied and 68% saying they are very satisfied. This remains above the national average. Results from the 17/18 survey suggest satisfaction has risen again, with 93% of people satisfied with services and over 70% of people extremely satisfied.
• Direct payments enable adults requiring social care to choose and buy the services they need directly instead of getting them from the council. On average we continue to support more people via a direct payment than other authorities: at the end of March 2018 34.6% of people locally received a direct payment compared with the latest national figure (March 2017) of 28.3%. This gives people who use social care more choice and control over their care provision.
• Our Children's Services directorate embarked on a major change programme during the year to develop early help services and reduce the demand on social care services. This is now delivering results. The number of enquiries coming into the Multi Agency Safeguarding Hub (MASH) dropped from 19,417 in 2016/17 to 15,970 in 2017/18; and there were fewer referrals to social care, dropping from 7066 to 6285 in the same period. Outcomes are being sustained, as fewer children are being re-referred to social care: 14.5% in 2017/18, compared to 19.9% in the previous year.
• The previous increase in demand for our children’s services had a knock-on impact on the timeliness of assessments. This was addressed in-year, and at the end of the year 90% of current assessments were within timescales. The timeliness of completing child protection cases, which has traditionally been much better than elsewhere, has also improved in the year.
• The number of looked after children rose in the year by 3.6%, compared to an average of 13% per year over the previous 4 years. The effect of this on directorate overspend at year end is noted below. Our work on improving early help, combined with the work we are undertaking to ensure that where possible, children are returned to their families, was having a positive impact by year end.
• Although adoption numbers fell in the year (from 14.6% of children leaving the looked after system in 2016/17 to 11.6% in 2017/18) this has more than been offset by an increase in special guardianship orders from 7.2% to 13.2%. The average time between a child in Oxfordshire entering care and moving in with its adoptive family is 439 days locally, compared with 520 days nationally i.e. 15% less time here than nationally.
• There has been an increase in Oxfordshire in the number of care leavers in employment, education and training (64%, compared with 50% nationally) and more are in suitable accommodation (88% compared to 84% nationally).
• Emergency call attendance rates remained high during the year as they included the provision of emergency medical response on behalf of South Central Ambulance Service, which helped to exceed the target of 250 more people being

alive as a result of OFRS’s interventions. There was one fatality as a result of fire in Oxfordshire, which is significantly fewer than the past few years.
• The council continues to remain proactive in managing flooding across the county. During 2017-18 we undertook many localised schemes and increased gulley cleansing to reduce incidents of localised flooding. This will be continued through the current year. The council, in its role as Lead Local Flood Authority, has been working in partnership with the Environment Agency and other partners to develop the Oxford Flood Alleviation Scheme, which is a major infrastructure project in the county. Funding has now been secured for the project, including a £6.5m contribution from the council in order to take it forwards to the construction phase. The council also continues to respond to all major planning applications with regard to ensuring that developments have sustainable drainage systems in place that do not increase the potential of flood risk in the local community.
• OFRS extended the reach of its activities to promote safety in Oxfordshire. This is largely down to the service’s new ‘campaign approach’ developed over 2016-17, and a more effective social media presence which, together, are more effectively engaging communities and individuals on public safety matters. Proactive campaigns around Christmas safety and water safety were particularly effective.
• Safe and Well visits by our firefighters helped more people this year than we targeted at the outset. Safe and Well visits involve firefighters visiting homes to help reduce risks relating to fire (including the testing or fitting of smoke alarms), and also risk of falls, flood, power cuts or crime as well as promoting healthy living, signposting individuals for smoking cessation and concerns in relation to excess alcohol consumption. These visits provide a vital face to face contact, in particular for vulnerable older or disabled people.
• As previously stated, OFRS undertook a trial working alongside the South Central Ambulance Service to provide a Co-Responder scheme for Oxfordshire utilising fire appliances at strategic locations. The aims of the trial were to ensure that an appropriately trained person – which can include our firefighters – was on scene as quickly as possible providing necessary ‘first response’ to specific medical emergencies where there was an immediate threat to life prior to an emergency ambulance arriving on scene. This trial increased the number of individuals alive due to an emergency response. However, the impact of the national dispute on pay has resulted in the trial being suspended at a number of locations.
Priority: Efficient Public Services
OCC has a strong track record of managing the impacts of reduction in government funding and meeting demand pressures. However, in recent years, the funding decisions taken by national government, along with the need to address rising demand for social care services, has meant that we have faced a much greater financial squeeze. Savings – totalling £330 million over the last seven years – have been achieved by transforming the way the council operates, through new models of service delivery including increased community involvement and new approaches to partnership working. During the year we have worked hard to make sure the services we provide to the residents and communities of Oxfordshire are delivered as

efficiently as possible, making best use of available resources and targeting residents’ needs as closely as possible.
• In February the Council agreed our budget for 2018/19. We are in a sounder financial position than in previous years, allowing us to continue to provide critical services and giving us the opportunity to improve how we work better for the residents and communities of Oxfordshire.
• During Quarter 3 of the year (October-December 2017) the council was in the process of exiting from our contract with Carillion for a range of services. Robust business continuity arrangements meant that we were able to manage the impacts of Carillion’s subsequent liquidation in January. We have now fully exited the contract and have made cost-effective arrangements for services formerly provided by Carillion to our council buildings and schools.
• Our performance relating to highways has two elements. Very positively, 99.87% of highway defects posing an immediate risk of injury were repaired within 24 hours, and 98.6% of highway defects that create a potential risk of injury were repaired within 28 calendar days. Our performance this year was in line with national indicators for these aspects of highway repair.
• Less positively, the overall condition of the A and B highways network has declined beyond the target set at the start of the year. This decline has primarily arisen as a result of a harsher and more extended winter period than is typical, which resulted in a significant increase in the number of potholes arising last year. An unanticipated increase of failures around older utility reinstatement works has also contributed to the decline. Carriageway decline is a national issue, as was reflected by the government’s decision to make £221m available to repair potholes, for which the council received just over £2.7m. The service is working closely with utility companies, both locally and at a regional level, to improve the quality of their first time repairs.
• Changes to waste collection methods by the district councils contributed to a slight reduction in performance levels during the year compared with targets. However, we remain among the very best authorities in the country at recycling household waste, with over 58% recycled.
• A 20% reduction in green waste collected for composting followed the introduction of charges for green waste by West Oxfordshire District Council. Some of this green waste is now collected at the recycling centres and there has not been a noticeable increase in residual rubbish.
• Challenges at our Household Waste Recycling Centres saw a reduction in performance over the first 6 months of the year. A new contract which started on 1 October has begun to drive up performance, and to ensure that appropriate charges are made for non-household wastes.
• Oxfordshire Fire & Rescue Service (OFRS) continued to meet its emergency service response standards throughout the year, making a highly effective use of our resources.

• The number of reported fatalities on the road was 27, slightly lower than last year and in line with the 5-year average of 26. During the year we trialled advanced water rescue techniques to enhance our ability to rescue casualties from water in emergencies.
• Earlier in the year OFRS undertook a range of actions in the immediate aftermath of the tragic Grenfell Tower fire in London. Our firefighters attended residents’ meetings for each of our tower blocks and provided support to partner organisations, stakeholders and communities. This included creating evacuation guides for residents and conducting a “safe and well visit” in 80% of residences.
• Each of the tower blocks was also subjected to a full fire safety audit which demonstrated that the General Fire Precautions within the building, and the actions of the landlord (Oxford City Council) were appropriate. We remain in close partnership with Oxford City Council over the required remedial works.
• OFRS have continued to work alongside the Oxford University Hospitals NHS Trust and PFI companies responsible for buildings on both the John Radcliffe and Churchill Hospital sites. We worked to assess fire risks in their buildings, to support their decision to evacuate patients from the building of most concern and to ensure that any ongoing remedial works are appropriate and maintain the safety of the patients undergoing medical care within those structures.
• Although satisfaction with services in adult social care remains high, and care providers in the county are rated highly by the Care Quality Commission, Oxfordshire has a significant workforce issue and faces challenges sourcing care. Demand for adult social care continues to grow both with the changing demographic profile and increased expectations of local authority funded care. These factors have led to people having to wait for care, both in hospitals and their own home. A successful health and social care recruitment programme has helped alleviate this pressure. At the start of the year we set a target to reduce delays due to social care from 28 to 14 in the year. In agreement with NHS England and to help alleviate pressures on hospital we subsequently agreed to stretch this target further to a reduction of 14 by December 2017 and 10 by March 2018. Although the stretched target has not been fully met, the number of people delayed in hospital awaiting social care has almost halved from 28 in March 2017 to 16 in March 2018.
• When someone needs help after they leave hospital, we want them to receive reablement – a short term service to help people return to their previous level of functioning. In Oxfordshire, this service is commissioned by both the council and clinical commissioning group and provided by the Oxford University Hospital trust. As the same time as stretching the target for social care delays; we agreed a stretched target of reducing delays for this service from 68 to 35, with an interim target of 41 by the end of December 2017. At the end of March 50 people were delayed. This improved performance has been supported by 35% increase in the hours of care provided by our reablement service in the last 12 months.
• Throughout the year we have involved over 60 service users to work with us on a programme of co-produced service changes in adult social care. Co-production ensures that our services are tailored as closely as possible to the individual’s needs, bringing better care outcomes and reducing the inefficiency or providing less

effective services. We have a co-production board; a champions network; 5 live projects and a further 7 projects in the pipeline; and we are also developing internal toolkits and organising a number of local and national events promoting co-production. We are working closely with the Social Care Institute for Excellence on developing this programme, which includes co-producing the first national evaluation of co-production and its impact.
• Our Children's Services directorate’s major change programme is being co-ordinated through the Children's Trust.11 This is already bearing fruit with the number of early help assessments more than doubling, allowing the number of enquiries coming into the Multi Agency Safeguarding Hub to fall by 18% and the subsequent number of social care assessments required to fall by 7.5%. These changes are bucking the trend nationally – in 2016/17, the last year for which there is comparative data, the number of assessments rose by 6.2%.
• More children’s cases are being held by permanent staff than previously, and there is less use of agency staff. Caseloads are also being reduced. This focus on a stable and supported workforce means that our staff can form meaningful relationships with children and their families and support real change.
• We continued to reduce our carbon footprint over the year through investments in lighting and our streetlighting estate delivered in late 16/17 and 17/18, together with asset disposals and a reduction in emissions from our electricity use (due to the changing fuel mix used to generate electricity nationally). Reporting will follow in late 2017-18 and we anticipate our emissions reduction will be in line with our annual target.
Financial outturn position
Through careful financial planning and control, at the end of 2017/18 the Council’s finances remain robust, investing across the county to help achieve thriving communities for everyone in Oxfordshire, including a thriving economy, protection for vulnerable people, and efficient public services. Revenue
As set out in the table below there was a revenue underspend of £1.0m in 2017/18. This was made up of an overspend of £7.0m on service expenditure offset by additional grant funding, additional interest, unused contingency and business rates of £8.0m. This underspend represents 0.2% of net expenditure.
11 https://www2.oxfordshire.gov.uk/cms/content/childrens-trust

As highlighted throughout the year in the Financial Monitoring reports to Cabinet there have been significant expenditure pressures within Children’s Services, predominantly arising from the increased numbers of looked after children. The final overspend position for Children’s Services was £6.9m, with £5.6m of this relating to external placements. The Adult Services budget underspent by £1.3m. An overspend of £1.6m in the Learning Disabilities service was offset by underspends in services across the directorate. The Communities directorate overspent by £1.2m. This position included £0.9m relating to the known costs of the Carillion contract before the services transferred back to the Council, as well as the initial costs to bring the services back in house and operating the first phase of the new operating model. All over and under spends were transferred into general balances. This additional contribution, along with the planned contribution of £4.7m, means that General balances are £25.7m. This is £7.9m above the 2017/18 risk assessed level of balances agreed as part of the 2017/18 Service & Resource Planning Process. This reinforces the sound financial position the Council is in.
Original Final Actual Net Variation
Budget Budget Expenditure against Final
Budget
£'000 £'000 £'000 £'000
Directorates
People 300,746 302,432 308,096 5,664
Communities 91,801 93,022 94,207 1,185
Resources 19,815 18,096 18,203 107
412,362 413,550 420,506 6,956
Strategic Measures
Capital Financing 25,561 25,561 25,087 -474
Interest on Balances -4,773 -4,773 -7,602 -2,829
Unringfenced Government Grants -19,226 -20,624 -22,035 -1,411
Contingency 4,377 4,567 400 -4,167
Past Pension Deficit 830 830 830 0
Public Health Saving Recharge -500 -500 0 500
6,269 5,061 -3,320 -8,381
Contributions to/from Corporate Reserves
Contributions to (+) / from (-) reserves -800 -779 29 808
-800 -779 29 808
Funding
Revenue Support Grant -18,665 -18,665 -18,665 0
Business Rates Top-up Grant -37,821 -37,821 -37,821 0
Business Rates -30,704 -30,704 -31,136 -432
Council Tax Requirement -328,064 -328,064 -328,064 0
Council Tax Surpluses -7,277 -7,277 -7,277 0
-422,531 -422,531 -422,963 -432
Surplus (-) / Deficit (+) -4,700 -4,700 -5,749 -1,049
Planned Contribution to balances 4,700 4,700 -4,700
Overall Increase (-) / Decrease (+) in General Balances 0 0 -5,749 -5,749

Reserves have reduced from £104.3m to £95.7m at 31 March 2018. In accordance with the Balances and Reserves Policy which was agreed by Cabinet on 23 January 2018, the majority of the directorate reserves have been transferred into the Budget Priorities Reserve. Capital
The total capital programme expenditure for the year 2017/18 was £94.7m. This was funded from £70.2m of capital grants and other external contributions, £18.5m of developer contributions, prudential borrowing of £3.1m, revenue contributions of £2.4m and capital receipts of £0.5m. Expenditure on 11 school expansion projects will create an additional 1,124 pupil places when completed. The new Aureus Secondary School in Didcot was completed during the year and a second primary school on the Great Western Park development in Didcot is also on track to open in September 2018 as planned. Within the Transport programme, £25.7m was spent on road maintenance. £7m was spent on the new Harwell Link Road which opened in March 2018 and £3m on projects in and around Headington to improve access. Included within the capital expenditure is £9.4m paid to Carillion to settle the final accounts of over 50 major property projects and numerous minor works projects.

OUTLOOK KEY: ↑ the outlook is positive/improving ↓ the outlook is negative/deteriorating ↔ the outlook is stable
PERFORMANCE DASHBOARDS – HIGH-LEVEL CORPORATE PLAN PRIORITIES AND OUTCOMES MEASURED IN 2017-18
PRIORITY: A STRONG AND THRIVING ECONOMY
PRIORITY: PROTECTING VULNERABLE PEOPLE
Ou
tco
me
s
14,168 children
and young adults (to include looked after children) to
be better educated to lead
safer and healthier lives
Number of preventative
“safe and well” visits carried out by OCC FRS and Community Safety
teams (target -1,562 per quarter) to help
vulnerable children and adults lead a more
independent and secure life.
To deliver 266,664
specific safety messages to
contribute towards promoting a safer
community, across all social media
platforms
Ensuring
all children have a healthy
start in life
Preventing early death
and promoting
healthy lifestyles
Safely reducing the number of looked after
children - providing support to enable families to care
To deliver sustained
and improved
experience for people
who access our services
To deliver
Sustainable, good quality adult social
care services
PRIORITY: EFFICIENT PUBLIC SERVICES
Ou
tco
me
1,000 more
people alive as a result of our prevention,
protection and emergency
response activities
When a fire
occurs we aim to send the nearest fire engine in the
quickest time possible
Helping early
– most effective, least
intrusive, solutions to
children’s and families’ problems
Improving the
confidence and capability of the whole
children’s services
workforce
Working with the NHS, private and voluntary sector
providers to deliver effective adult social care
services
Use the expertise of our customers
and other key stakeholders to design, procure
and evaluate adult social care
services
Household
waste is disposed of
efficiently and effectively
Year on year reduction in
OCC’s carbon equivalent emissions
Ou
tco
me
s
3,332 businesses given advice and support to grow
Increase school
attendance - leading to improved
attainment
An Infrastructure
Strategy for Oxfordshire is
delivered
High-quality jobs,
and a skilled workforce, are created and sustained
Funding for public
services is maximised
OCC’s
responsibilities for spatial planning
are executed
Highways are
adequately maintained

OUTLOOK KEY: ↑ the outlook is positive/improving ↓ the outlook is negative/deteriorating ↔ the outlook is stable
SOCIAL AND COMMUNITY SERVICES – PERFORMANCE DASHBOARD 2017-18 – END OF YEAR
Outcome Success Indicator Target Cumulative Target Y/N
Q1
RAG
Q2
RAG
Q3
RAG
Q4
RAG Outlook
PR
OTE
CTI
NG
VU
LNER
AB
LE P
EOP
LE
Deliver sustained and
improved experience for people
who access our services
1 Maintain the high level of user satisfaction
67% N G G G G ↔
2 Maintain the high level of people using social care who receive a direct payment
>28% N G G G G ↑
Deliver
sustainable, good quality
services
3
The proportion of social care providers rated as 'outstanding' or 'good' by the care quality commission in Oxfordshire remains above the national average
80% N G G G G ↑
4 Increase the number of quality and monitoring checks that have been undertaken in the quarter
159 Y G A G G ↔
EFFI
CIE
NT
PU
BLI
C S
ERV
ICES
Work with the NHS, private and voluntary
sector providers to
deliver effective services
5 Reduce the number of people delayed in hospital awaiting social care from an average of 28 in March 2017 to 14 at the end of March 2018
14 N A A G A ↑
6 Reduce the delayed transfers of care that are attributable to adult social care from an average of 67 in March 2017 to 66 at the end of March 2018
66 N G G A A ↑
7 Increase the number of hours from the hospital discharge and reablement service to 8920 hours per month
8920 N R R A A ↑
Use the expertise of customers
and other key stakeholders
to design, procure and
evaluate services
8 Involve more people in co-producing service redesign with the council and ensure at least 5 co-production products are delivered in 2017/18
5 Y G G G G ↔

OUTLOOK KEY: ↑ the outlook is positive/improving ↓ the outlook is negative/deteriorating ↔ the outlook is stable
CHILDREN, EDUCATION AND FAMILIES – PERFORMANCE DASHBOARD 2017-18 – END OF YEAR
Outcome Success Indicator Target Cumulative Target Y/N
Q1 RAG
Q2
RAG
Q3
RAG
Q4 RAG
Outlook
THR
IVIN
G
ECO
NO
MY
Increase school
attendance - leading to improved attainment
9 Persistent absence rates to be in the top quartile nationally by 2018 for secondary schools
Top quartile
N n/a n/a A A ↔
10 Permanent exclusions to remain in the top quartile nationally Top
quartile N n/a n/a R R ↔
PR
OTE
CTI
NG
VU
LNER
AB
LE
PEO
PLE
Safely reducing the number of looked after children -
providing support to enable families
to care
11
Reduce the number of looked after children from 667 at March 2017 to the average of our statistical neighbours (582) by March 2019, with an interim target of 629
629 N A R R G ↑
12
Reduce the number of children becoming looked after in 2017/18 by 15%. This is a reduction from 371 to new looked after cases to 316. (This is the equivalent of reducing avoidable demand from 36% to 25%)
316 Y A R A A ↑
13 Increase the number of children leaving the looked after service in 2017/18 by 36%. This is an increase from 266 children to 362
362 Y A A A A ↑
EFFI
CIE
NT
PU
BLI
C S
ER Helping early –
most effective, least intrusive,
solutions to problems
14 Increase the number of early help assessments from 458 in 16/17 to 3000 in 18/19, with an interim target of 1750 in 2017/18
1750 Y A A A A ↑
15 Reduce the level of enquiries to the MASH from 19,417 in 2016/17 to 9,500 in 2018/19, with an interim target of 12,000 for 2017/18
12,000 Y A A A A ↑
16 Reduce the level of social care assessments from 6650 in to 3600 in 2018/19, with an interim target of 4,500 in 2017/18
4,500 Y A A A G ↔
Improving the confidence and capability of the whole workforce
17 Reduce caseloads so that by March 2018 over 75% of staff have caseloads at or below the agreed target level
75% N G G G G ↑
18 Invest in the workforce so that by March 2018 80% of cases are held by permanent staff
80% N G G G G ↔

OUTLOOK KEY: ↑ the outlook is positive/improving ↓ the outlook is negative/deteriorating ↔ the outlook is stable
PUBLIC HEALTH – PERFORMANCE DASHBOARD 2017-18 – END OF YEAR
Outcome Success Indicator Target Cumulative Target Y/N
Q1 RAG
Q2 RAG
Q3 RAG
Q4 RAG
Outlook
PR
OTE
CTI
NG
VU
LNER
AB
LE P
EOP
LE
Ensuring all children have a healthy start in
life
19 Number of mothers who receive a universal face to face contact at 28 weeks or above
70% N G G G G ↔
20 Percentage of births that have received a face to face New Birth Visit 95% N G G G G ↔
21 Percentage of children who received a 12 month review 93-95%
N G G G G ↔
22 Percentage of children who received a 2-2.5 year review 93-95%
N G G G G ↔
23 Babies breastfed at 6-8 weeks of age (County) 60-63%
N G G G G ↔
24 % of Mothers who received a Maternal Mood Review in line with the local pathway by the time the infant is aged 8 weeks.
95% N G G G G ↔
Prevent early death and
promote healthy lifestyles
25 % of eligible population 40-74 who have been invited for a NHS Health Check since 1/4/2013
84% Y G G G G ↑
26 % of eligible population 40-74 who have received a NHS Health Check since 1/4/2013
42% Y G G G G ↑
27 Rate of successful quitters per 100,000 smokers 18+ (reported a quarter in arrears)
>2315 N G A A G ↑
28
Number of users of OPIATES that left drug treatment successfully (free of drug(s) of dependence) who do not then re-present to treatment again within 6 months as a percentage of the total number of opiate users in treatment.
>6.8% N G G G G ↔
29
Number of users on NON-OPIATES that left drug treatment successfully (free of drug(s) of dependence) who do not then re-present to treatment again within 6 months as a percentage of the total number of non-opiate users in treatment.
>37.3% N G G G G ↔
30
Number of users on ALCOHOL ONLY that left treatment successfully (free of alcohol dependence) who do not then re-present to treatment again within 6 months as a percentage of the total number of ALCOHOL ONLY users in treatment.
>50% N G G G G ↔

OUTLOOK KEY: ↑ the outlook is positive/improving ↓ the outlook is negative/deteriorating ↔ the outlook is stable
COMMUNITIES – PERFORMANCE DASHBOARD 2017-18 – END OF YEAR
Outcome Success Indicator Target Cumulative Target Y/N
Q1 RAG
Q2 RAG
Q3 RAG
Q4 RAG
Outlook TH
RIV
ING
EC
ON
OM
Y
An Infrastructure
Strategy is delivered
31
A prioritised infrastructure strategy for Oxfordshire, providing a framework that enables the county's planned growth, will be produced and developed by Sept 2017
Completion N A G G G COMPLETE
High-quality jobs, and a
skilled workforce, are created and sustained
32 Oxfordshire is chosen for 60 new investors / re-investors, 20 of which are ‘high value’ (as defined by Department for International Trade)
60/20 Y G G G G ↔
33 We participate in 15 funding bids for innovation submitted to support the Smart Oxford programme
15 Y G G G G ↑
Funding for public services is maximised
34 Value of monies secured in s106 / s278 agreements as a % of requirements identified through the Single Response process
80% Y G G G G ↔
35 No more than 20% of s106 monies are held within 2 years of potential payback
<20% Y G G G G ↔
OCC’s responsibilities
for spatial planning are
executed
36 80% of District Council planning applications are responded to within the agreed deadline
80% Y G A G A ↔
37 50% of Mineral and Waste applications are determined within 13 weeks
50% Y G G G G ↑
Highways are adequately maintained
38 100% of highway defects posing an immediate risk of injury are repaired within 24 hours
100% Y A G G G ↔ 39
90% of highway defects that create a potential risk of injury repaired within 28 calendar days
90% Y G G G G ↔ 40
28% of the A and B Classified road network where carriageway maintenance should be considered.
28% Y G R R R ↓
EFFI
CIE
NT
PU
BLI
C S
ERV
ICES
Household waste is
disposed of efficiently and
effectively
41 59% of household waste is reused, recycled or composted 59% Y G A A A ↔
42 60% of waste from HWRC which is recycled 60% Y A A A A ↔
Year on year reduction in
OCC’s carbon equivalent emissions
43
Average 3% year on year reduction in carbon equivalent emissions from OCC estates and activities
3% Y G G G G ↔

OUTLOOK KEY: ↑ the outlook is positive/improving ↓ the outlook is negative/deteriorating ↔ the outlook is stable
COMMUNITY SAFETY SERVICES – PERFORMANCE DASHBOARD 2017-18 – END OF YEAR
Outcome Success Indicator Target Cumulative Target Y/N
Q1 RAG
Q2 RAG
Q3 RAG
Q4 RAG
Outlook
THR
IVIN
G
ECO
NO
MY
3,332 businesses given
advice and support to grow
44 833 businesses given advice and support, per quarter. 833 Y G G G G ↔
PR
OTE
CTI
NG
VU
LNER
AB
LE P
EOP
LE
14,168 children and young adults (to include looked after
children) to be better educated to lead safer and
healthier lives
45 3,542 children and young adults to be better educated to lead safer and healthier lives, per quarter
3,542 Y G G G G ↔
6,248 vulnerable children and adults helped to lead more secure and independent
lives, supported by Safe and Well visits
46
1,562 vulnerable children and adults helped to lead more secure and independent lives, supported by safe and wellbeing visits per quarter
1,562 Y R G G G ↔
To deliver 266,664 specific safety messages to
contribute towards promoting a safer community, across all
social media platforms
47 To deliver 66,666 specific safety messages across all social media platforms, per quarter.
66,666 Y G G G G ↔
EFFI
CIE
NT
PU
BLI
C S
EER
VIC
ES
1,000 more people alive as a result of our prevention,
protection and emergency response activities
48 250 more people alive as a result of our prevention, protection and emergency response activities per quarter
250 Y G G G G ↔
When a fire occurs we aim to send the nearest fire engine in the quickest time possible
49
80% of emergency call attendances to be made within 11 minutes, per quarter
80%
Y
G G G G ↔
50 95% of emergency call attendances to be made within 14 minutes, per quarter
95% Y G G G G ↔

OUTLOOK
The 2018/19 budget and Medium Term Financial Plan to 2021/22 agreed by Council on 13 February 2018 addresses the demand pressures that are expected to continue into the medium term. The Children’s Social Care budget has been increased by £7.5m to address the pressure from 2017/18. A Children’s Services transformation programme has been established with a focus on addressing demand management and strengthening early help and prevention including closer partnership working, strengthening staff resources and building community resilience. Whilst the programme will take time to deliver, it is anticipated that there will be a financial impact in 2018/19. Numbers of mainstream looked after children (LAC) are showing a reduction from 621 at the beginning of December 2017 to 593 at the end of March 2018. Whilst it is still early days, it appears that the work of the programme is beginning to have an effect. The budget also includes reductions in funding to 2019/20 and sets out a plan to ensure that the Council can deliver the 2018/19 budget within estimated available resources. Savings of £15m from the Fit for the Future Programme need to be delivered over the period 2019/20 to 2021/22, as well as £2.4m in the MTFP relating to ICT. Whilst there is some funding set aside to deliver the next phase of the programme, any investment funding required as part of the implementation phase will need to be met from reserves. If any expenditure beyond the existing provision is required during 2018/19, and future requirements set out as part of the Service & Resource Planning process in 2019/20. This will either need to be met from reserves or be the first call against the savings made. The risks in the budget largely in relate to the demand led budgets in particular children’s social care. There is also a range of pressures and uncertainties in adult social care, particularly in relation to growing demand and the potential consequences of pressures on the health system. To help mitigate these risks, a contingency budget of £6.0m (0.6% of the gross budget excluding schools), has been built into 2018/19, which will provide some degree of a safety net. The level of the Council’s total reserves is sufficient to provide both general balances to manage the impact of unexpected events in line with the risk assessment; and the setting aside of earmarked reserves to meet known or anticipated liabilities.
BASIS OF PREPARATION AND PRESENTATION
The council produces a Statement of Accounts to provide transparency about the council’s finances, to give assurance to stakeholders that public money has been properly accounted for and that the financial standing of the council is on a secure basis. The accounts for 2017/18 are set out on pages xx to xx. The accounts bring together all the council’s financial for the year 2017-18 and show its financial position as at 31 March 2018. The statements reflect both revenue and

capital elements for the General Fund, including transactions relating to joint operations with other local authorities and health bodies. The County Council is the administering authority for the Oxfordshire Local Government Pension Fund. As such, the Fund accounts are included as a disclosure within the Council’s accounts. Expenditure and Funding Analysis
The objective of the Expenditure and Funding Analysis is to demonstrate to council tax payers how the funding available to the authority (ie government grants, council tax and business rates) for the year has been used in providing services in comparison with those resources consumed or earned by authorities in accordance with generally accepted accounting practices. The Expenditure and Funding Analysis also shows how this expenditure is allocated for decision making purposes between council’s directorates. Income and expenditure accounted for under generally accepted accounting practices is presented more fully in the Comprehensive Income and Expenditure Statement. Financial Statements
Comprehensive Income and Expenditure Statement (pg. x)
Shows the accounting cost in the year of providing services in accordance with generally accepted accounting practices rather than the amount to be funded from taxation. Authorities raise taxation to cover expenditure in accordance with statutory requirements; this may be different from the accounting cost. The taxation position is shown in both the Expenditure and Funding Analysis and the Movement in Reserves Statement
Movement in Reserves Statement (pg. x)
Shows the movement from the start of the year to the end on the different reserves held by the authority, analysed into ‘useable reserves’ (ie those that can be applied to fund expenditure or reduce local taxation) and other ‘unusable reserves’ (for example the Revaluation Reserve which holds unrealised gains and loses or the Capital Adjustment Account which holds adjustments between the accounting basis and funding basis under regulations). This statement shows how the movements in year of the authority’s reserves are broken down between gains and losses incurred in accordance with generally accepted accounting practices and the statutory adjustments required to return to the amounts chargeable to council tax for the year. The Net Increase/Decrease line shows the statutory General Fund Balance in the year following those adjustments.
Balance Sheet (pg. x) The balance sheet shows the values as at 31 March 2018 of the assets and liabilities recognised by the authority. The net assets of the authority (assets less liabilities) are matched by the reserves held by the authority, analysed between ‘useable’ and ‘unusable’ reserves.

Cash Flow Statement (pg. x)
This summarises the changes in cash and cash equivalents during 2017/18. The statement shows how the authority generates and uses cash and cash equivalents by classifying cash flows as operating, investing and financing activities. The amount of net cash flows arising from operating activities is a key indicator of the extent to which the operations of the authority are funded by way of taxation and grant income or from the recipients of services provided by the authority. Investing activities represent the extent to which cash flows have been made for resources which are intended to contribute to the authority’s future service delivery. Cash flows arising from financing activities are useful in predicting claims on future cash flows by providers of capital (ie borrowing) to the authority.
Notes to the accounts
The Notes to the Accounts explain and provide further detail behind the key items and entries within the Financial Statements. They consist of:
• Expenditure and Funding Analysis – Compares the net expenditure as funded by taxation with the accounting cost of providing services as presented in the Comprehensive Income and Expenditure Statement.
• Notes to the Accounts – Which explain some of the key items and disclosures in the accounts.
• Pension Fund Accounts – These are the accounts of the Pension Fund, which is operated for employees of the County Council, district councils and other bodies.
• Statement of Responsibilities for the Statement of Accounts – Outlines the key responsibilities in respect of the accounts, together with statements from the Chief Finance Officer and Chairman of the Audit & Governance Committee.