Embed Size (px)
Citation preview
5 7 - 4 5 N88-10838
SHEAR STRESS TY CLEANING FOR SURFACE DEPARTICULATION
R. P. Musselman and T. W. Yarbrough
Quadrex HPS Inc.
Gainesville, Florida
ABSTRACT
A cleaning technique widely used by the nuclear utility industry for removal of radioactive surface contamination has proven effective at removing non-hazardous contaminant particles as small as 0 . 1 micrometer (pm). The process employs a controlled high-velocity liquid spray inside a vapor containment enclosure to remove particles from a surface. The viscous drag force generated by the cleaning fluid applies a shear stress greater than the adhesion force that holds small particles to a substrate. Fluid mechanics and field tests indicate general cleaning parameters.
INTRODUCTION
Microminiaturization of electronic devices and increasing performance requirements of precision mechanical systems, optical elements, and clean room equipment have lowered the tolerance limits for particulate surface contamination to unprecedented levels. The primary goal of the extensive contamination control effort is to attain and maintain desired levels of cleanliness on surfaces of items during production and/or use. Particle induced failures and low product yields attest to the fact that contamination avoidance is not always possible. A number of techniques have been developed to remove particles from contaminated surfaces. Traditional gross cleaning methods such as solvent immersion, low-pressure spray in the range of 3 .4 x to 2.8 x 10⁻¹ MPa (5 to 40 psig), vapor degreasing and ultrasonics remove visible solids but do not adequately address particles
73
https://ntrs.nasa.gov/search.jsp?R=19880001456 2019-02-07T09:01:30+00:00Z

smaller than about 25 pm (le2). For smaller particles, the relative forces of adhesion are so large that the only effective method of removing them is to apply a direct mechanical force. Wiping, while effective, is labor intensive, especially for complex surfaces (3-5)
Alternatively, a shear stress sufficient to overcome small particle adhesive forces may be applied by the viscous drag force generated by a high velocity fluid.
In the late 19701s, a general technology called shear stress cleaning evolved which incorporates the use of pressurized (6.9 x 10 to 1.5 x 1 0 MPa [lo0 to 2200 psig]), high-velocity, (140mls [450 fps]), fluid sprays for removal of surface contamination. Simultaneous independent development led to systems specialized for different applications. ERDA-sponsored research ('1 at Lawrence Livermore Laboratory produced a cleaning system for optics used in high energy lasers for fusion research. Commercial applications (6) allowed
generators of radioactive or toxic wastes to decontaminate items to levels allowing unrestricted release of materials for reuse, thereby reducing the volume of waste requiring shallow land disposal and minimizing the risk of personnel exposure and environmental contamination.
5 7
The dynamics of shear stress cleaning are the same for all applications requiring highly efficient removal of particles, oils, and process chemicals, whether the contaminants pose a health hazard or lower product yield and reliability. This article describes the mechanics of surface cleaning by shear stress and discusses results obtained from tests and field applications of the technology.
EFFORT REQUIRED TO REMOVE PARTICLES
Numerous studies have been conducted (7-10) to determine the relative magnitude of adhesion forces of small particles to surfaces. Such a broad array of forces and conditional parameters affect the force of adhesion that accurate a prior prediction of the force necessary to remove particles in real world situations is impossible. (Forces of adhesion include gravitational, electrostatic, intermolecular, capillary and sedimentary; conditional parameters
74
include particle size, shape, ability to deform, tendency to agglomerate and surface topography). However, some useful generalizations can be made that indicate techniques to improve cleaning effectiveness.
Where intermolecular attraction forces dominate, the net attractive force on a particle increases proportionally as particle size (diameter) increases. However, cleaning techniques are less effective on smaller particles because the ability of the method to impart a force to a particle decreases with diameter more rapidly than does the force holding the contaminant to the surface. Techniques that clean by centrifugal or impulse forces depend on particle mass, which decreases with effective diameter cubed. A s will be shown, the drag force produced by shear stress cleaning depends on the particles projected frontal area and decreases more slowly, with the square of particle diameter.
A common practice is to compare adhesion forces holding a particle on a surface to the force exerted by gravity on the particle. While the intermolecular forces on a 1000pm (0 .04 in) particle are comparable to one time the force of gravity (1 g ) , the force on a 5um particle is more than 2 million g's and relative adhesion forces of hundreds of millions of g's have been postulated (lo '11) for submicron particles. Although cleaning solvents may reduce these forces by orders of magnitude, sufficient attraction will remain to require vigorous mechanical action to effect the removal of small particles.
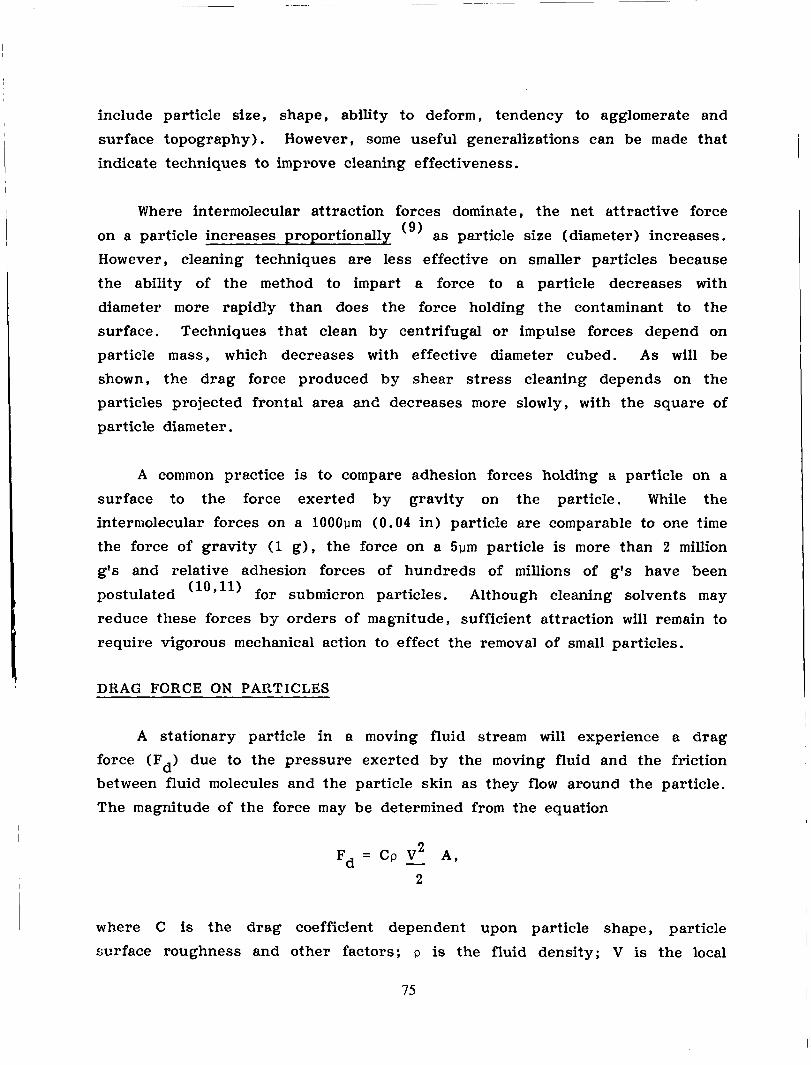
DRAG FORCE ON PARTICLES
A stationary particle in a moving fluid stream will experience a drag force (F ) due to the pressure exerted by the moving fluid and the friction between fluid molecules and the particle skin as they flow around the particle. The magnitude of the force may be determined from the equation
d
Fd = Cp - V2 A ,
2
where C is the drag coefficient dependent upon particle shape, particle surface roughness and other factors; p is the fluid density; V is the local
75
fluid velocity around the particle; and A is the projected frontal area of the particle.
The objective of Shear Stress cleaning is to increase the value of drag force to the point that it exceeds the force of adhesion, thereby detaching the particle from the surface. There are only two apparent controllable parameters available to optimize cleaning effectiveness. In general, the higher the fluid density and local velocity, the Density may be selected by an example, liquids are much more cleaning fluids, fluorocarbon ( CC12F-CC1F2, Fluorocarbon-113) applications due to their selective will be explained, low viscosity.
more effective particle removal becomes. appropriate choice of cleaning fluid. For effective than gases, and of the common
solvents such as trichlorotrifluoroethane lend themselves well to spray cleaning
solvency, high density, low toxicity and, as Increasing the fluid velocity -- at the particle
is more complicated and requires further discussion.
THE LAW OF THE WALL AND PARTICLE HIDEOUT
When a fluid passes over a surface, the velocity approaches zero immediately at the surface but increases to a maximum, known as the free stream velocity (us), at some distance above the surface. The universal dimensionless profile relating velocity to distance from a surface is known as the "law of the wall".
Considering flow of fluid along a flat plate as a model, fluid molecules at the plate surface are brought to rest , and those for a short distance above the plate are slowed because of viscous shear in the fluid. This region of retarded flow is called the llboundary layer" and for practical purposes extends to the point at which fluid velocity equals 99% of the free stream velocity. For most high velocity spray applications, the flow within this boundary layer can be considered turbulent over the entire surface. A thin laminar sublayer will exist between the plate surface and the turbulent portion of the boundary layer. Within this sublayer, velocities decrease rapidly to zero.
76

The manner in which fluid velocity varies with distance above the surface depends on whether the point of reference lies within the free stream, the turbulent boundary layer or the laminar sublayer. Once this has been established, the velocity as a function of distance may be determined from known empirical relationships. (12,13)
The thickness of this low-velocity sublayer determines to a large extent the effectiveness of spray cleaning at removing very small particles. If the sublayer is thick compared to particle dimensions, the particles can "hide out" in the sublayer. Since they will be affected only by the lower velocities, the drag forces exerted may be too s m a l l to detach them from the surface.
This effect of "particle hideout" is illustrated in Figure 1 for typical low velocity sprays (such as encountered in vapor degreaser spray wands) and a relatively large particle. The effect of particle hideout is more obvious if micron size particles are of concern.
Examining the parameters that affect the sublayer thickness, and therefore fluid velocity incident on the particle, discloses effective methods for exposing particles to higher velocities, preventing particle hideout. I t
will be shown that the predominant adjustable factors in making the local fluid velocities at the particle higher are increasing the free stream velocity (us) and reducing fluid viscosity (p).
VELOCITY PROFILES
from classicaI fluid mechanics to determine the relative velocities at any point downstream from the point of spray impact on a smooth surface (x coordinate) and above the surface (y coordinate) [Figure 21 . A computer model was developed to generate isovelocity profiles for any fluid, given density ( p ) , dynamic viscosity (v =
p / p ) , and free stream velocity (u 1. This report extends the study to predict approximate values of drag force over a range of particle sizes and spray pressures.
(13) A mathematical model has been derived
S
77
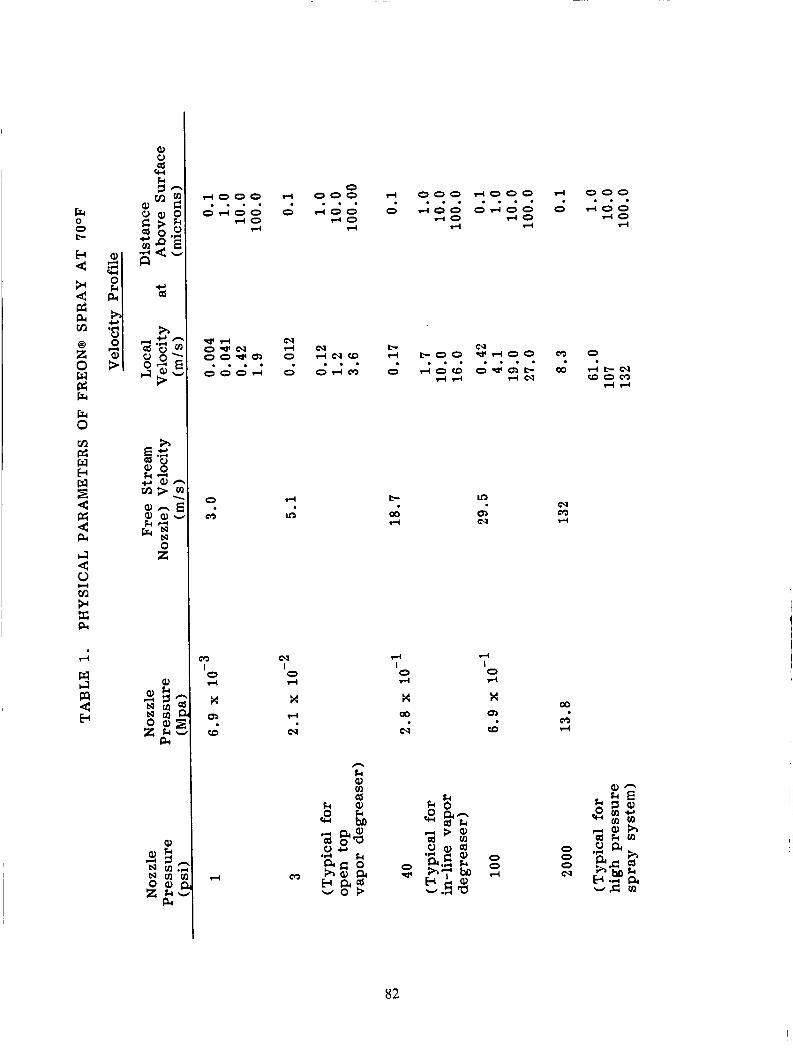
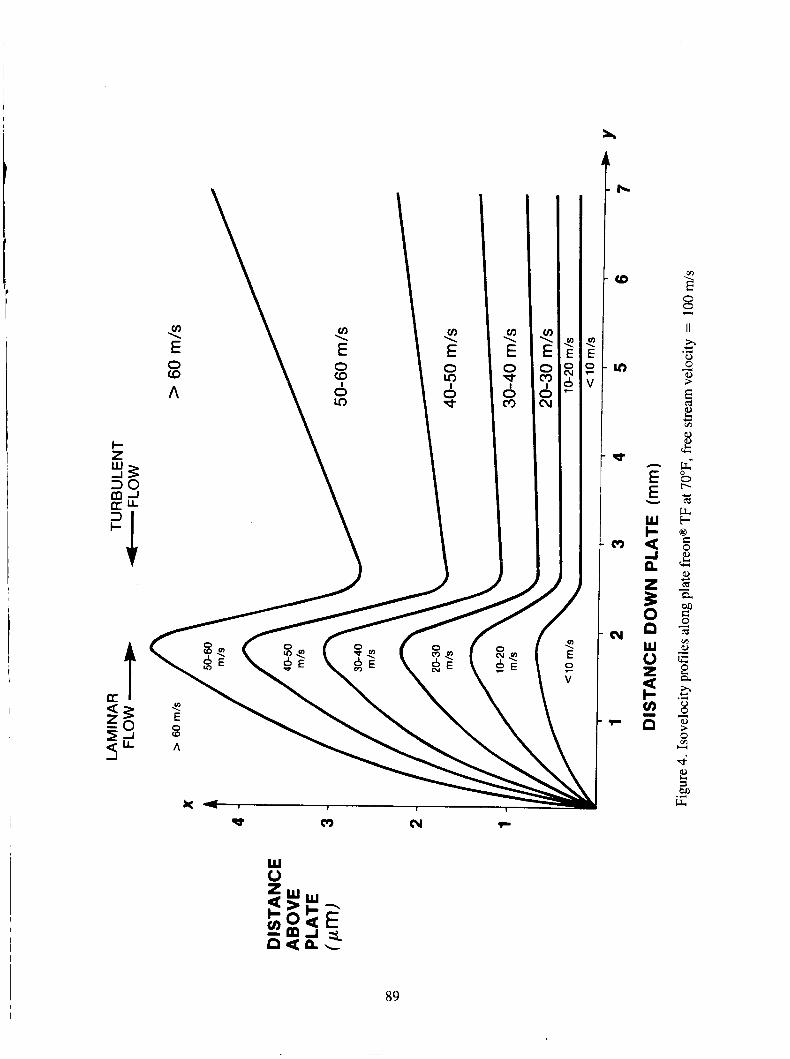
Figures 3 and 4 illustrate velocity profiles of two cleaning fluids (water and Fluorocarbon-113 respectively), each having a free stream velocity of 100
m / s (328 fps). Note that by raising the free stream velocity, the local velocity near the surface is much higher than in the example illustrated by Figure 1. Further, the velocities produced by the fluorocarbon solvent near the surface are higher than those for water, due primarily to the fluorocarbon's lower viscosity, This takes on added significance considering the fact that drag force (Fd) depends on the square of the local velocity. A
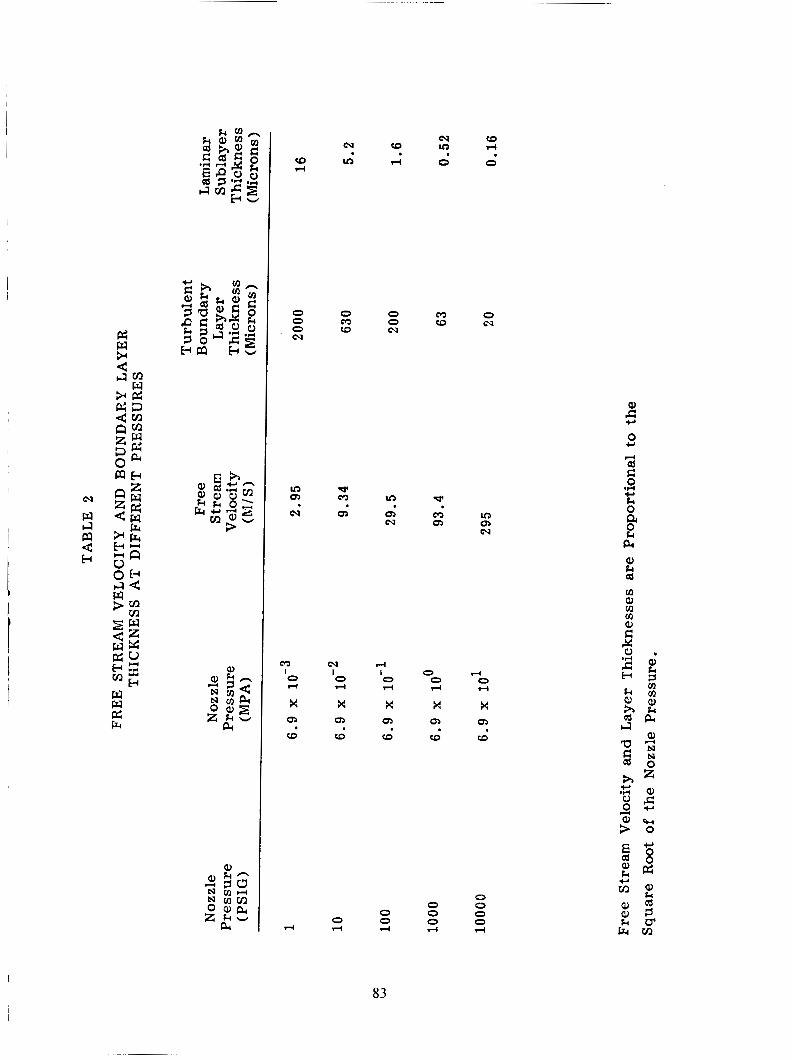
numerical listing of some of the values obtained in generating these profiles is given in Tables 1 and 2.
DRAG FORCE
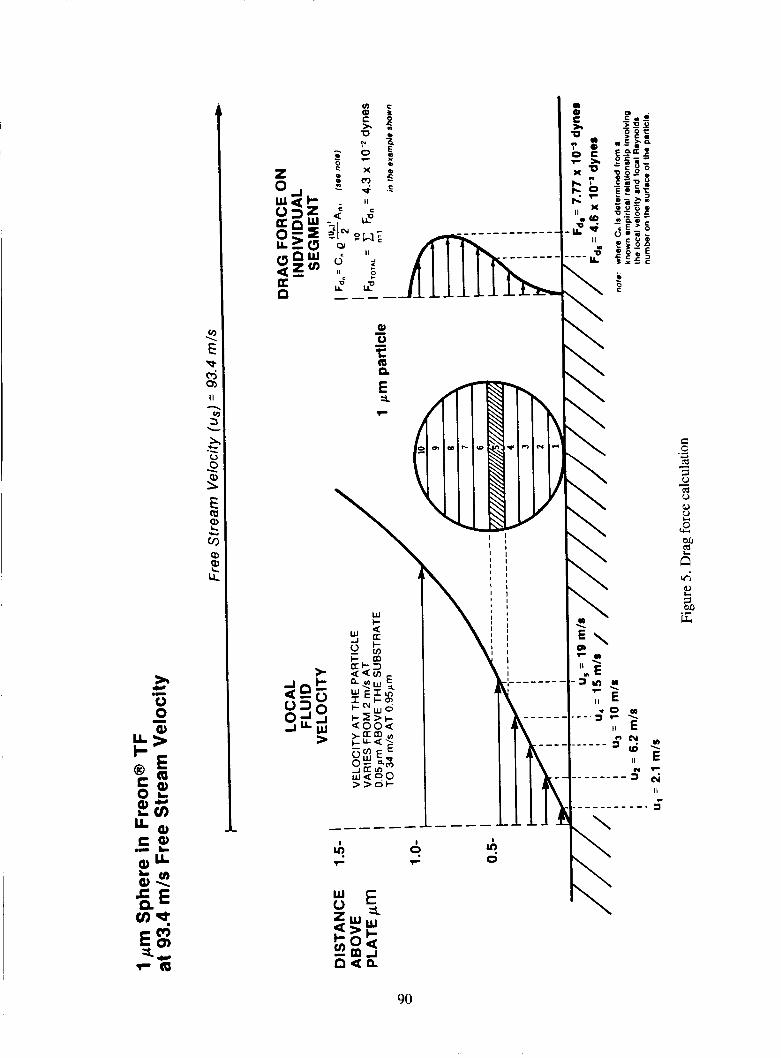
Since the local velocity may vary significantly from the substrate surface up to a distance equal to a small particle's diameter, a mode l w a s
developed to account for this in calculating drag force (Fd). The model is
illustrated by Figure 5 .
Here a one micron particle is approximated as a sphere and divided into ten segments. The drag force on a segment is calculated using the 1
local velocity at a distance from the substrate surface corresponding to the I
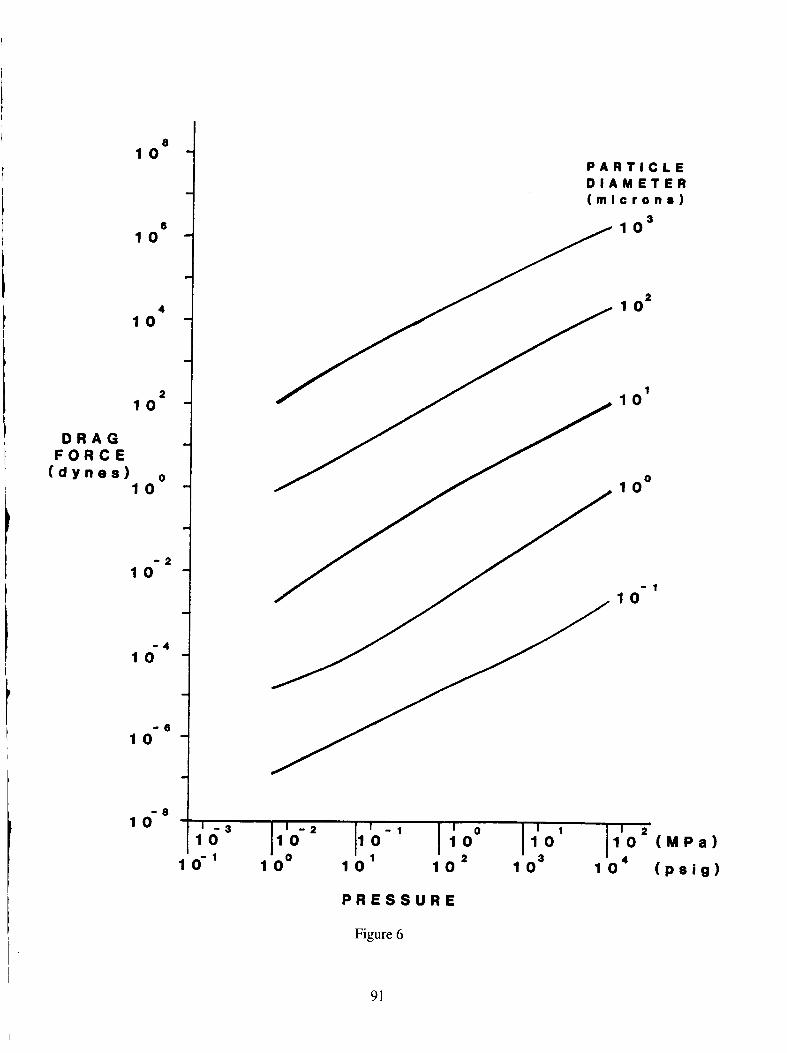
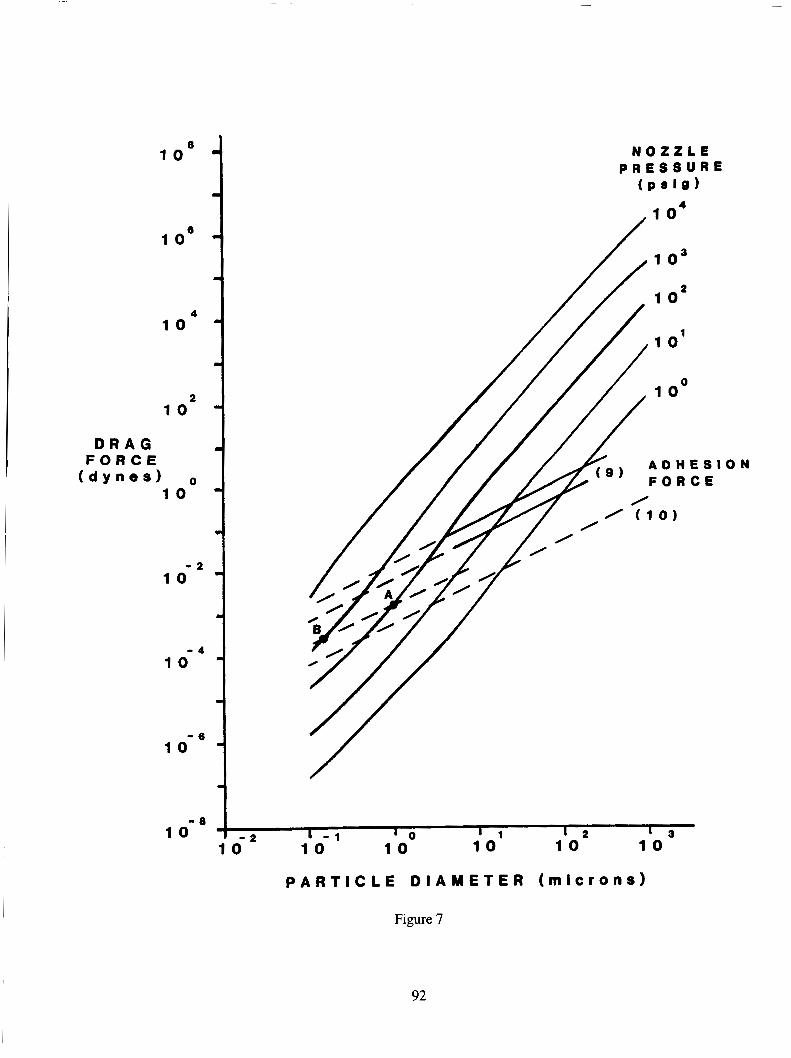
mid-point of that segment. Each segment's projected frontal area is also considered. A s illustrated, the maximum drag force occurs well above the particle midpoint, due to the higher fluid velocities experienced by these segments. Similar calculations were used to generate Table 3. Data from this table is graphed in Figures 6 and 7.
I 1 I
The data show a near linear relationship between drag force (Fd) and spray nozzle pressure. At a given spray pressure (and therefore free stream velocity) , the drag force depends predominantly on the particle's projected frontal area (A) and thus on particle diameter squared. I
~ Superimposed on Figure 7 are results of experiment and calculations (lo) conducted to determine the value of the average adhesion force on particles of various sizes. It is seen that extrapolation to the submicron
78
region indicates quite high pressures may be required to detach these particles. The adhesion force lines are for particles attached to a substrate in air. The need for excessively high spray pressures may be mitigated somewhat by the fact that the adhesion force will be reduced when the substrate and particles are immersed in a liquid (7’ lo). Counteracting this to a degree, however, is the fact that all particles of the same size do not have the same value of adhesion force. A monodisperse collection of particles will
have a distribution of adhesion force values that may span several orders of magnitude. Cleaning applications that require extremely low particle counts must target the removal of the most tenacious particles, rather than the average.
Though the absolute values predicted by the model may not be precise, the relative trends should allow some general predictions. For example, once the drag force required to remove a given particle (with diameter D) from a
substrate is determined experimentally (e.g.) point A on Figure 71, a line for intermolecular attraction (Fd =D) may be parallel to that calculated
drawn to estimate the minimum particle size removed at a different pressure (point B). A rule of thumb that allows order of magnitude predictions is that the pressure required to detach a particle (Pdet) is roughly inversely proportional to the particle size (D) .
(10)
Similar curves can be calculated at intermediate pressures.
1 a - ’det
The object of this exercise has not been to produce a means of determining w i t h absolute accuracy the exact spray pressure required to remove a particle of a given size. Rather, it has been to show that drag forces generated by liquid fluorocarbon sprays are of a magnitude that makes removal of submicron particles feasible. The practicality of this
technique must be determined experimentally on a case-by-case basis. The next section describes such a case study.
79
PERFORMANCE EVALUATION
A chromium-plated glass A / C Test Dust by spraying a
test coupon was artificially contaminated with suspension of the dust in methyl ethyl ketone
(MEK) onto a rapidly spinning plate. The prepared surface had approximately 6000 particles/cm2 in the 0.1-5~1m size range. The coupon was sprayed for 10 seconds w i t h trichlorotrifluoroethane (fluorocarbon-113) at a nozzle pressure of 14.8 MPa (2150 psig) . The free stream velocity (us) of the fluid was 134 m / s (440 fps) and the velocity profile similar to that depicted for u Coupons were analyzed by light scattering surface scanner and scanning electron microscope. Typical before and after results are shown in Figure 8. Average final particle count was less than 0.3 particles per square centimeter, giving a particle removal efficiency of 99.995%.
= 100 m / s in Figure 3. S
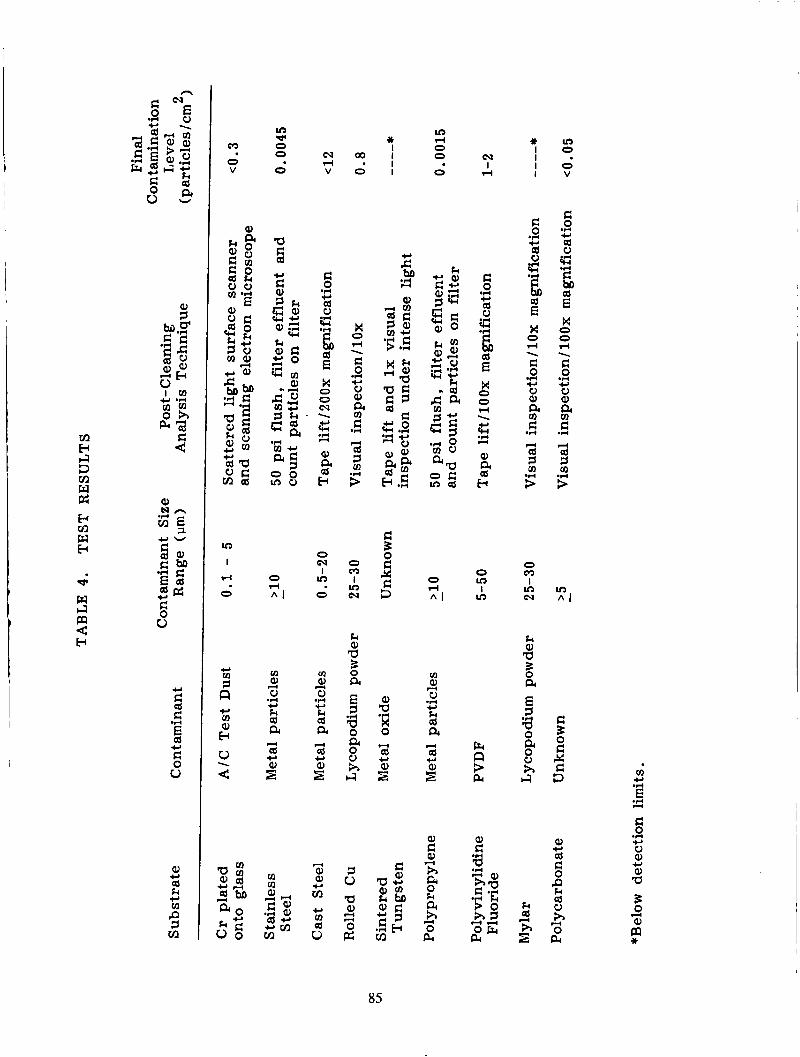
A number of field tests have been done, though not under highly controlled conditions, using a variety of substrates and contaminants. The results of these tests are summarized in Table 4. Final contamination levels vary greatly and depend heavily on the analysis technique employed.
SUMMARY
A fluid dynamics model has been used to predict the magnitude of drag force applied to s m a l l particles by a high velocity spray of liquid fluorocarbon solvent. Comparison with theoretical and experimental particle adhesion force data indicates sufficient force will be generated to remove particles extending down into the submicron range. Tests have verified removal of particles as small as O.1pm.
With the stringent demands for surface cleanliness placed on manufacturers of electronic devices, optics, precision mechanical equipment, and clean r o o m process lines, the advent of shear stress cleaning technology is expected to play an increasingly important role in achieving compliance wi th surface departiculation requirements.
80 C -2

REFERENCES
1. Stowers IF, ?'Advances in Cleaning Metal and Glass Surfaces to Micron-level Cleanliness", Journal of Vacuum Science & Technology, 15(2): 751, 1978.
2 . Beeson RD, ?'Hardware Cleaning and Sampling for Cleanliness Verificationll, presented to the 29th Annual Technical Meeting of the Institute of Environmental Sciences, Los Angeles, 1983.
3. Kwan SC, Mason KD, and Wieckowski, J M , "Precision Cleaning of Large Complex Structures", presented to the 29th Annual Technical Meeting of the Institute of Environmental Sciences, Los Angeles, 1983.
4. Kwan SC, Tomer RS, and Mason KD, "Precision Cleaning of Large Complex Structures - 11" , The Journal of Environmental Sciences, 28(4): 27, 1984.
5. Chidester MH, Kwan SC, Bush JM, and Mason KD, "Precision Cleaning of Large Complex Structures - III", presented to the 9th Contamination Control Working Group Meeting of the Inertial Guidance and Navigation Community, Los Angeles , 1985.
6. McVey, JT, Campuzano C , and Fowler DE, "Tools and Equipment: From Nuclear Waste to Reusable Items", Nuclear and Chemical Waste Management, 2 : 197, 1981.
7. Zimon, AD, Adhesion of Dust and Powder, Consultants Bureau, New York, Second Edition, 1982.
8. Corn, M , ?'The Adhesion of Solid Particles to Solid Surfaces I", Journal of the A i r Pollution Control AsSociation, 11: 523, 1961.
9. Corn, M , "The Adhesion of Solid Particles to Solid Surfaces II", Journal of the Air Pollution Control Association 11: 566, 1961.
10. Brandreth DA, and Johnson RE, "Removal of Particulates from Optical Lenses", The Optical Index's Journal of Opthalmic Dispensing, January, 1979.
11. Tolliver DL, and Schroeder HG , ?lParticle Control in Semiconductor Process Streams", Microcontamination, June/July : 34, 1983.
12 . Olson RM , Essentials of Engineering Fluid Mechanics, Intext Educational Publishers, New York, Third Edition.
13. Musselman RP, and Yarbrough, TW, "Shear Stress Removal of Submicron Particles from Surfaces", presented to the 9th Contamination Control Working Group Meeting of the Inertial Guidance and Navigation Community, Los Angeles , 1985.
81
0 000
400 4 0
rl
. . .
ea r l e a w o r l m . . .
4 000 d o 0 0 0 400 o r l o o
40 4 0 4 rl
. . . . . . . 4 000
0 r l oo 40
4
. . . 4000
or loo 4 0
rl
. . . . 4
0
ea rl 0
0
- 4 0 - e a oo*Q, 0004 . . . . P- ea
rl b o o *do0 . . . . . . . m o m r l b e a
w o r n rl4
0 r l o w O W Q , b 4 4 FIN
4
m m Q, ea
N m rl
0
c3
ea I 0 rl
x
4 I 0
4 I 0 rl
X
m I 0 4
X Q,
W
4
X m N
00
c3 rl
Q,
(D
rl
ea
n k
82
W rl
0 0 a N
v) Q,
tx
m I 0 r(
x Q,
W
d
N W
In rl
0 m CD
w m Q,
N I 0 r(
x Q,
CD
0 d
0 0 N
v)
Q, N
d I 0 d
x Q,
W
0 0 4
N W In d
0 0
m 0 CD ea
Q) d ;ej
0 c,
w m ln Q, Q,
N
0 0 r(
x Q,
W
0 0 a r(
r( 0 I+
x Q,
CD
0 a 0 0 r(
Q) k a (I)
P
c,
" 2
83

(D 0 rl
x p1 rl
ea
e 0 rl
x rl rl
ea
0.1 0 4
x rl e rl
rl I 0 rl
x m ea
.a 0 d
w 4 e rl
4 1 0 rl
x m C.l
Q)
*) I 0 d
x W Q,
rl
0 I 0 4
X W m rl
c- I 0 4
x W m rl
rl
m 0 rl
x 0 Q,
rl
rl 0 rl
x m 0
rl
ea I 0 4
x e m e
e I 0 rl
X m e rl
(0 I 0 rl
x W m rl
e 0 rl
x v-4 -4
0.1
ea 0 rl
x rl * 4
rl 1 0 rl
x m N
Qo
m I 0 rl
x (D ua rl
In I 0 F I
x (D m rl
m 0 rl
X eo rl
ea
m 0 rl
x 0 Q,
rl
rl 0 d
x m 0
rl
ea I 0 4
X e m e
e 1 0 rl
x m e rl
: El 0 .*.I E 0 0 0 rl
2 k 0 c= 0 0 rl
.r-l m
k 0 .r( z 0 rl
c u 8 .I+
B rl
c El 0 .r( E rl
0
F P t : c
P P 0
P
c
k E F F
F c E I
I t h I
c
I
L t I f
I I
. .. n h k cd P c
P
c) 4 N ..
n k a, h cd P 4
:
.. N
8
0.1 a, N r(
c PI ti
n ea
5 c) k c, v1
n
5 k cd 00
m I 0 rl
x W 0)
rl
d .r(
5 4
Y c,
a, a, k ccc
c
3
-r(
5 .r(
W
c,
W 3 W
ti a a k ccc
E GI .r(
a, 0
k cd PI
4
.r( c,
P td
GI
3 W
ti
a, A 3
ti
cr 5
‘6 .r( * k cd pc P cr
0 0 0 0 0 0 0 rl rl
0 0 0 rl rl
84
M E GI 3 rn w pr; E rA w b
w GI m 4 E
c3
0 V
00
0
X 0 rl \
.r( g c, u a, a s 2
.I4
a 3 .r(
0 m I m ea
k Q, a 3 0 a E 1 a 0
.I4
K Gl
I u 5 Q, d H
2
* I I I I
E B X c 3
0 d A
rn al u k a a cd
H
.r( c,
d
Y
Q,
5
El d
h a a h d
a0
m 0
0 V
.r( !3
B
.r( g
+ a u
1 x 0 0 d \
c, u Q, a s 2 .r(
I-l cd
.r(
3
m A 1
B X c 3
Q,
cd c,
g e a0
cd d K
85

n W I-
I 0 v)
I 0 0 r
I 0 v)
\
\
\
U J \
E
\
\
86

I I-
\ \ 3
\ \
\ \ >
Lu 0 L L K 3 cJ2
a
N
f -0 -A-
\
\
87

- - -
A
v) \
E
3 0
0 cu
cn \
E
1
cn \
E
v 0 F
0 l-
v
x U .d
8
2 CI 9) > Y
88
v) \
E 0 CD
A
c
w 0
89
c *=0 O&l J W >
OD \
E
90
i
' 1 ';a3 1'0- 1 0
6 1 0
4 1 0
2 1 0
D R A G F O R C E
( d y n e s ) 1 0
- 2 1 0
- 4 1 0
t - 6 1 0
1 o-8
P A R T I C L E D t A M E T E R ( m i c r o n 8 1
I 0'
1 o2
1 o1
1 oo
1 0-
P R E S S U R E
Figure 6
~ 91
N O Z Z L E P R E S S U R E
( P S l f a )
E S I C E
1 2 1 3 .I’ O1 1 0 1 0 1 - 1 l o 1 0
l o - 8 ! 1 i 2 10
P A R T I C L E D I A M E T E R ( m i c r o n s )
O N
Figure 7
92
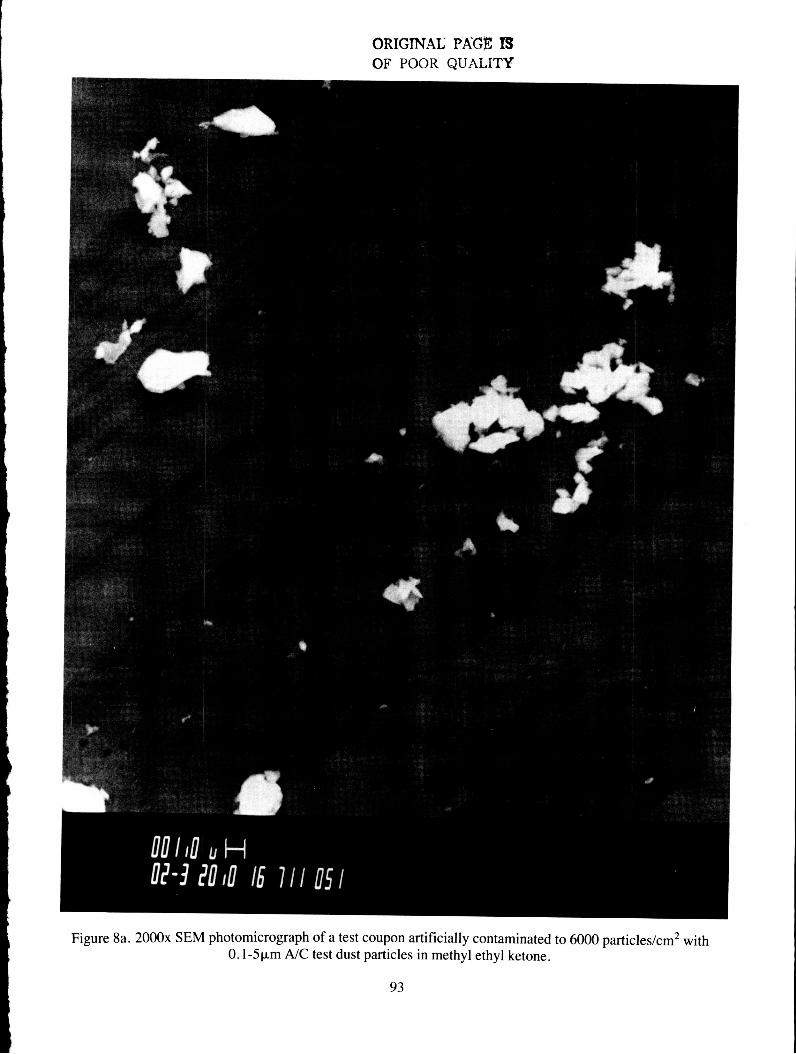
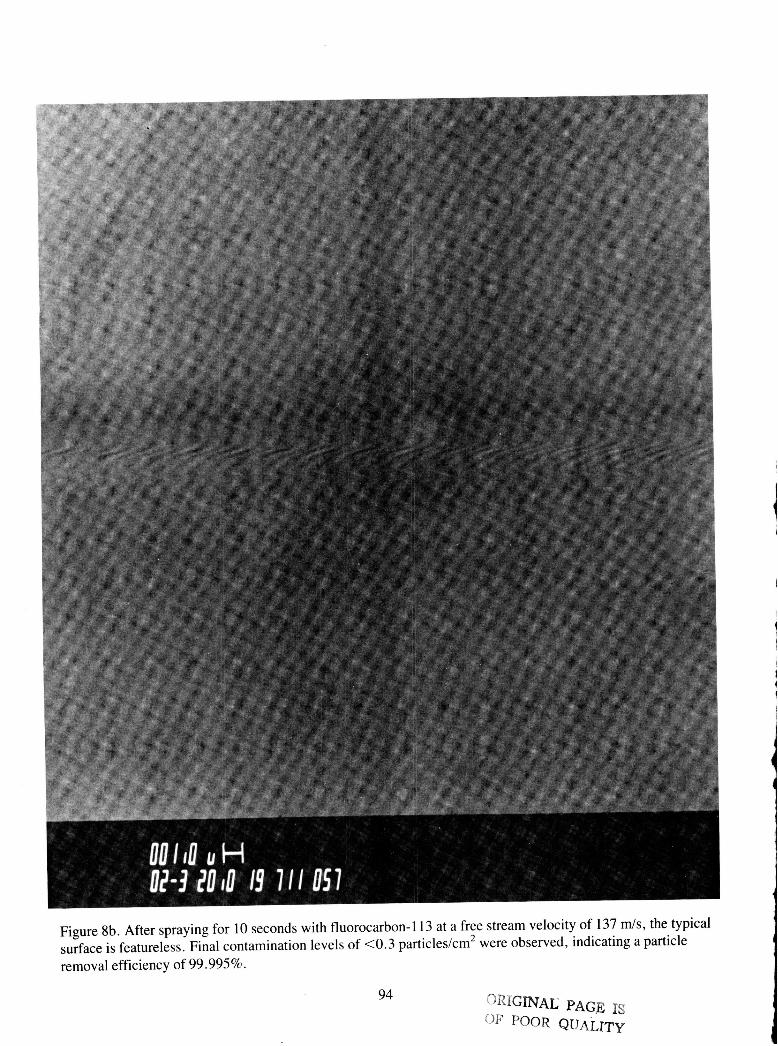
Figure 8b. After spraying for 10 seconds with fluorocarbon-I 13 at a free stream velocity of 137 d s , the typical surface is featureless. Final contamination levels of <0.3 particles/cm* were observed, indicating a particle removal efficiency of 99.995%.
94 oRIGI"i PAGE 1s OF POOR QUALITY


![NERCTranslate this page 201509 Establish and...%PDF-1.5 %âãÏÓ 10838 0 obj > endobj 10853 0 obj >/Filter/FlateDecode/ID[722EEDE4392B7245BBD9A4E9E53C6D6F>]/Index[10838 26]/Info 10837](https://img.dokumen.tips/doc/110x75/5aa0030f7f8b9a71178d78ae/nerctranslate-this-201509-establish-andpdf-15-10838-0-obj-endobj-10853-0.jpg)