Embed Size (px)
Citation preview
N5 Westport to Turlough Road Project
Phase 3 - Design COBA Report
Final Report – July 2011
Designer Roughan & O’Donovan – AECOM Alliance Arena House Arena Road Sandyford Dublin 18
Client Mayo County Council NRDO Glenparke House The Mall Castlebar Co. Mayo
Roughan & O’Donovan - AECOM Alliance N5 Westport to Turlough Road Project Consulting Engineers Phase 3 - Design COBA
N5 Westport to Turlough Road Project
Design COBA
Document No: ...... 60043384 Made: .................... Johanne Browne Checked: ............... Éamonn Ó Lionnáin Approved: ............. Alan O’Brien
Document No. Revision Status Made Checked Approved Date
60043384 0 Draft Rpt JB ÉÓL AOB 21.03.11
60043384 1 Draft Rpt JB ÉÓL AOB 16.06.11
60043384 2 Rpt JB ÉÓL AOB 01.07.11

Roughan & O’Donovan - AECOM Alliance N5 Westport To Turlough Road Project Consulting Engineers Phase 3 - Design COBA
N5 Westport to Turlough Road Project
Phase 3 - Design COBA
Table of Contents
1.0 Introduction .............................................................................................................................. 1
1.1 Overview .................................................................................................................. 1
1.2 COBA ....................................................................................................................... 1
1.3 Scheme Description ................................................................................................ 1
1.4 Report Structure ...................................................................................................... 2
2.0 Software Specifications ........................................................................................................... 3
2.1 COBA Specifications ............................................................................................... 3
3.0 Network ..................................................................................................................................... 4
3.1 Network Definition ................................................................................................... 4
4.0 Data Collection ......................................................................................................................... 5
4.1 Introduction .............................................................................................................. 5
4.2 Journey Time Surveys ............................................................................................. 5
4.3 Accident Records .................................................................................................... 5
4.4 Geometric Characteristics ....................................................................................... 6
5.0 COBA Input Assumptions ....................................................................................................... 7
5.1 Input Parameters ..................................................................................................... 7
5.2 Junction Delay ......................................................................................................... 8
5.3 Scheme Costs ......................................................................................................... 8
5.3.2 Target Cost .............................................................................................................. 9
5.3.3 Scheme Budget ....................................................................................................... 9
6.0 COBA Validation ..................................................................................................................... 10
6.1 Journey Time Validation ........................................................................................ 10
7.0 COBA Results ......................................................................................................................... 11
7.1 COBA Results Summary ....................................................................................... 11
7.2 Discussion of Results ............................................................................................ 12
8.0 Conclusions ............................................................................................................................ 14
8.1 General .................................................................................................................. 14
8.2 Comparison with Route Selection COBA .............................................................. 14
Appendix A ....................................................................................................................... 15
Scheme Plans .................................................................................................................... 15
Appendix B ....................................................................................................................... 16
CoBA Link-Node Diagram ................................................................................................. 16
Appendix C ....................................................................................................................... 17
COBA Input Files ............................................................................................................... 17
Appendix D ....................................................................................................................... 18
Cost Output Summaries .................................................................................................... 18
Roughan & O’Donovan – AECOM Alliance N5 Westport To Turlough Road Project Consulting Engineers Phase 3 – Design COBA
Page 1
1.0 Introduction
1.1 Overview
This report sets out the economic assessment undertaken for the preferred alignment of the N5 Westport to Turlough Road Project - Scheme Number MO/09/3342.
This report follows on from the original Route Selection Cost Benefit Analysis report (July 2009) which assessed five alternative scheme route options, and the Route Selection Cost Benefit Analysis Preferred Route report (August 2009) which used updated costing information.
This analysis has been carried out using the COBA 11 Program (Release 13 Generation Date 02.06.2011) in accordance with the National Roads Authority (NRA) Project Appraisal Guidelines.
1.2 COBA
Cost Benefit Analysis (COBA) forms one element of the appraisal process for road infrastructure projects. At Design Stage, the benefits and costs of a defined route are assessed using agreed traffic growth scenarios. The COBA program compares the “Do-Minimum” scenario (i.e. not to progress with the scheme) with the “Do-Something” scenario (i.e. to progress with the scheme) and determines whether benefits resulting from the provision of the scheme will outweigh the costs of construction and future maintenance.
1.3 Scheme Description
The scheme commences at the existing N59, at Deerpark East, north of Westport and ends at Turlough, on the existing N5. The route is approximately 26.4km in length (main line) and is comprised of the following: • 2.1km of Reduced Single Carriageway; • 23.7km of Type 2 Dual Carriageway (comprising 19.7km of new offline and 4.0km
of online widening); • 0.6km of taper from Type 2 to Standard Single Carriageway on the line of the
existing carriageway; • 11.3km of side road; and • 12 Junctions (including existing junction at IDA/Allergen and new at grade
junction at Turlough).
The need for the N5 Westport to Turlough Road Project has been identified in the following documents:
• The National Road Needs Study 1998
• The National Development Plan 2007 – 2013
• Mayo County Development Plan 2008 – 2014
• Regional Planning Guidelines 2010 – 2022
Roughan & O’Donovan – AECOM Alliance N5 Westport To Turlough Road Project Consulting Engineers Phase 3 – Design COBA
Page 2
1.4 Report Structure This report has been structured in accordance with the requirements of the Project Appraisal Guidelines. The guidance sets out the following report structure: • Chapter 1 sets the scene for the report, identifying at what stage the assessment
is being undertaken and broadly describing the nature of the scheme; • Chapter 2 confirms which software version has been used; • Chapter 3 explains the rationale behind the extent of the area modelled in COBA; • Chapter 4 provides details on the level of data collection undertaken; • Chapter 5 describes the derivation of the relevant input parameters and provides
information on scheme costs; • Chapter 6 presents the model validation process which uses journey time data on
the existing road network; • Chapter 7 contains the summary of results of the assessment and provides a
brief overview of the economic case for the road scheme; and • Chapter 8 outlines the conclusions reached.
Roughan & O’Donovan – AECOM Alliance N5 Westport To Turlough Road Project Consulting Engineers Phase 3 – Design COBA
Page 3
2.0 Software Specifications 2.1 COBA Specifications This Design stage assessment was undertaken using the COBA 11 Program (Release 13 Generation Date 02.06.2011). This programme uses a Discount Rate of 4%, with all figures discounted back to the Base Year of 2009. The analysis has been carried out in accordance with the National Roads Authority Project Appraisal Guidelines 2011. CoBA 11 (Release 13 Generation Date 02.06.2011) provides functionality to specify appraisal of Irish Road Schemes, and incorporates the various parameter values as set out in the NRA Project Appraisal Guidelines.
Roughan & O’Donovan – AECOM Alliance N5 Westport To Turlough Road Project Consulting Engineers Phase 3 – Design COBA
Page 4
3.0 Network 3.1 Network Definition The COBA network is defined as the area within which significant journey time saving and reassignment effects would be expected as a result of the scheme. The extent of the COBA network for the scheme is based on the VISUM traffic model which was developed as part of the N5 Westport to Turlough Road Project. The restriction of the network to those links where significant reassignment takes place has allowed the COBA network to be reduced to a manageable size, hence reducing the need for a detailed assessment of all links and junctions within Castlebar and Westport where benefits may be relatively minor. The COBA network extends east-west from Turlough to Westport and includes the N59, N84, N60, R330 and R310. The COBA link-node diagram is shown in Appendix B.
Roughan & O’Donovan – AECOM Alliance N5 Westport To Turlough Road Project Consulting Engineers Phase 3 –Design COBA
Page 5
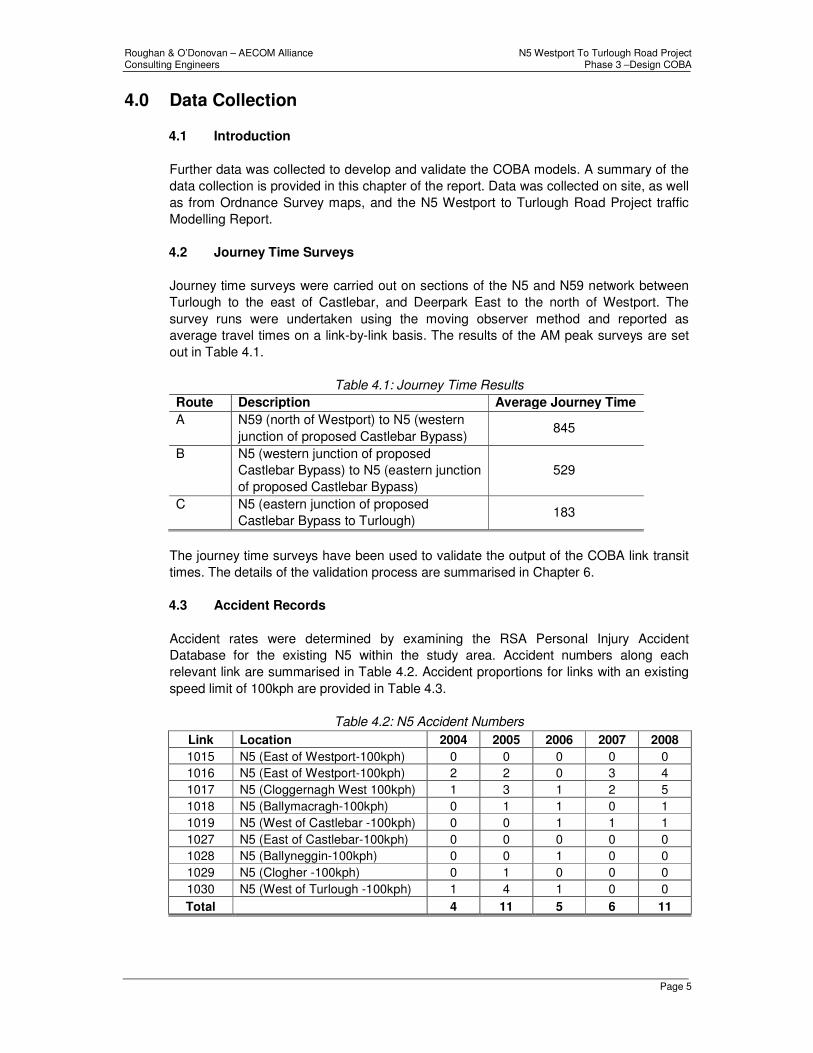
4.0 Data Collection 4.1 Introduction Further data was collected to develop and validate the COBA models. A summary of the data collection is provided in this chapter of the report. Data was collected on site, as well as from Ordnance Survey maps, and the N5 Westport to Turlough Road Project traffic Modelling Report.
4.2 Journey Time Surveys Journey time surveys were carried out on sections of the N5 and N59 network between Turlough to the east of Castlebar, and Deerpark East to the north of Westport. The survey runs were undertaken using the moving observer method and reported as average travel times on a link-by-link basis. The results of the AM peak surveys are set out in Table 4.1.
Table 4.1: Journey Time Results
Route Description Average Journey Time A N59 (north of Westport) to N5 (western
junction of proposed Castlebar Bypass) 845
B N5 (western junction of proposed Castlebar Bypass) to N5 (eastern junction of proposed Castlebar Bypass)
529
C N5 (eastern junction of proposed Castlebar Bypass to Turlough)
183
The journey time surveys have been used to validate the output of the COBA link transit times. The details of the validation process are summarised in Chapter 6.
4.3 Accident Records Accident rates were determined by examining the RSA Personal Injury Accident Database for the existing N5 within the study area. Accident numbers along each relevant link are summarised in Table 4.2. Accident proportions for links with an existing speed limit of 100kph are provided in Table 4.3.
Table 4.2: N5 Accident Numbers
Link Location 2004 2005 2006 2007 2008 1015 N5 (East of Westport-100kph) 0 0 0 0 0 1016 N5 (East of Westport-100kph) 2 2 0 3 4 1017 N5 (Cloggernagh West 100kph) 1 3 1 2 5 1018 N5 (Ballymacragh-100kph) 0 1 1 0 1 1019 N5 (West of Castlebar -100kph) 0 0 1 1 1 1027 N5 (East of Castlebar-100kph) 0 0 0 0 0 1028 N5 (Ballyneggin-100kph) 0 0 1 0 0 1029 N5 (Clogher -100kph) 0 1 0 0 0 1030 N5 (West of Turlough -100kph) 1 4 1 0 0 Total 4 11 5 6 11
Roughan & O’Donovan – AECOM Alliance N5 Westport To Turlough Road Project Consulting Engineers Phase 3 –Design COBA
Page 6
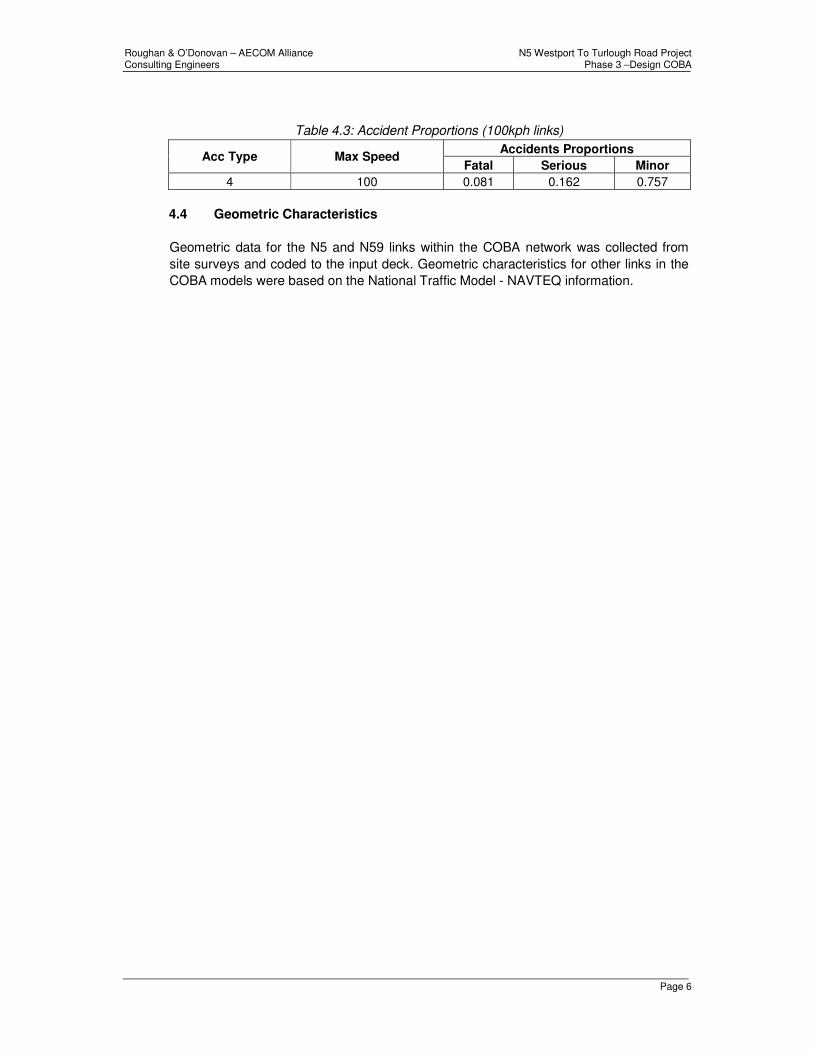
Table 4.3: Accident Proportions (100kph links)
Acc Type Max Speed Accidents Proportions
Fatal Serious Minor 4 100 0.081 0.162 0.757
4.4 Geometric Characteristics Geometric data for the N5 and N59 links within the COBA network was collected from site surveys and coded to the input deck. Geometric characteristics for other links in the COBA models were based on the National Traffic Model - NAVTEQ information.

Roughan & O’Donovan – AECOM Alliance N5 Westport To Turlough Road Project Consulting Engineers Phase 3 –Design COBA
Page 7
5.0 COBA Input Assumptions 5.1 Input Parameters The Project Appraisal Guidelines require that locally derived values be used at the Design Stage for the following parameters:
• Seasonality; • Vehicle category proportions; • Traffic growth rates; and • Accident rates.
All other parameters such as maintenance costs and value of time growth rates are based on the NRA National Parameters Value Sheet. 5.1.1 Seasonality
The seasonality factor was determined by using the data from the permanent Traffic Counter located on the N60 (Balla) in accordance with the guidance in the Project Appraisal Guidelines. The ratio of weekday 2-way traffic flow in August versus the ‘Neutral’ months of April, May, June, September and October was used. The relevant information is summarised in Table 5.1.
Table 5.1 Seasonality
Average 2-Way Weekday Flow August 2007 6,729
Neutral Months* 6,524
Seasonality Factor 1.03 *comprise April, May, June, September, October 2007
5.1.2 Vehicle Category Proportions
Vehicle category proportions were calculated from May 2007 ATC site data from the N5 west of Turlough. The information used is summarised in Table 5.2.
Table 5.2 Vehicle Category Proportions
Categories 1 2 3 4 5 N5 0.90 0.06 0.03 0.01 0.01
5.1.3 Traffic Flow Year
The traffic models include an opening year of 2015 based on the traffic growth methodology outlined in the Project Appraisal Guidelines. These 2015 flows will be used as the starting point for the COBA. As such, the traffic flow year is defined as 2015. 5.1.4 Traffic Growth Rates
Traffic growth rates from 2015 were extracted from the Local Area Models (LAM) as aggregate growth rates for both Light and Heavy vehicles as per the PAG. The calculation of the traffic growth rates is based on the growth in total vehicle kilometres between the following scenarios;
• 2015 Opening Year; • 2030 Design Year; and
Roughan & O’Donovan – AECOM Alliance N5 Westport To Turlough Road Project Consulting Engineers Phase 3 –Design COBA
Page 8
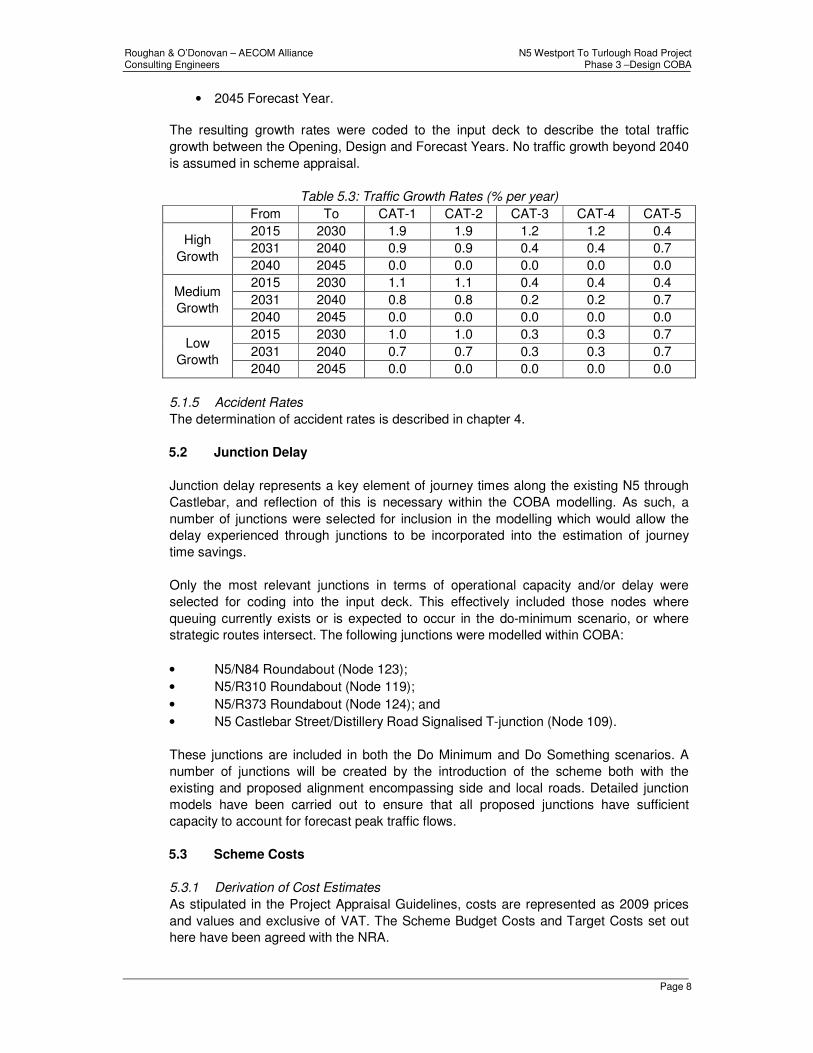
• 2045 Forecast Year.
The resulting growth rates were coded to the input deck to describe the total traffic growth between the Opening, Design and Forecast Years. No traffic growth beyond 2040 is assumed in scheme appraisal.
Table 5.3: Traffic Growth Rates (% per year)
From To CAT-1 CAT-2 CAT-3 CAT-4 CAT-5
High Growth
2015 2030 1.9 1.9 1.2 1.2 0.4 2031 2040 0.9 0.9 0.4 0.4 0.7 2040 2045 0.0 0.0 0.0 0.0 0.0
Medium Growth
2015 2030 1.1 1.1 0.4 0.4 0.4 2031 2040 0.8 0.8 0.2 0.2 0.7 2040 2045 0.0 0.0 0.0 0.0 0.0
Low Growth
2015 2030 1.0 1.0 0.3 0.3 0.7 2031 2040 0.7 0.7 0.3 0.3 0.7 2040 2045 0.0 0.0 0.0 0.0 0.0
5.1.5 Accident Rates
The determination of accident rates is described in chapter 4.
5.2 Junction Delay Junction delay represents a key element of journey times along the existing N5 through Castlebar, and reflection of this is necessary within the COBA modelling. As such, a number of junctions were selected for inclusion in the modelling which would allow the delay experienced through junctions to be incorporated into the estimation of journey time savings. Only the most relevant junctions in terms of operational capacity and/or delay were selected for coding into the input deck. This effectively included those nodes where queuing currently exists or is expected to occur in the do-minimum scenario, or where strategic routes intersect. The following junctions were modelled within COBA: • N5/N84 Roundabout (Node 123); • N5/R310 Roundabout (Node 119); • N5/R373 Roundabout (Node 124); and • N5 Castlebar Street/Distillery Road Signalised T-junction (Node 109).
These junctions are included in both the Do Minimum and Do Something scenarios. A
number of junctions will be created by the introduction of the scheme both with the existing and proposed alignment encompassing side and local roads. Detailed junction models have been carried out to ensure that all proposed junctions have sufficient capacity to account for forecast peak traffic flows.
5.3 Scheme Costs 5.3.1 Derivation of Cost Estimates
As stipulated in the Project Appraisal Guidelines, costs are represented as 2009 prices and values and exclusive of VAT. The Scheme Budget Costs and Target Costs set out here have been agreed with the NRA.
Roughan & O’Donovan – AECOM Alliance N5 Westport To Turlough Road Project Consulting Engineers Phase 3 –Design COBA
Page 9
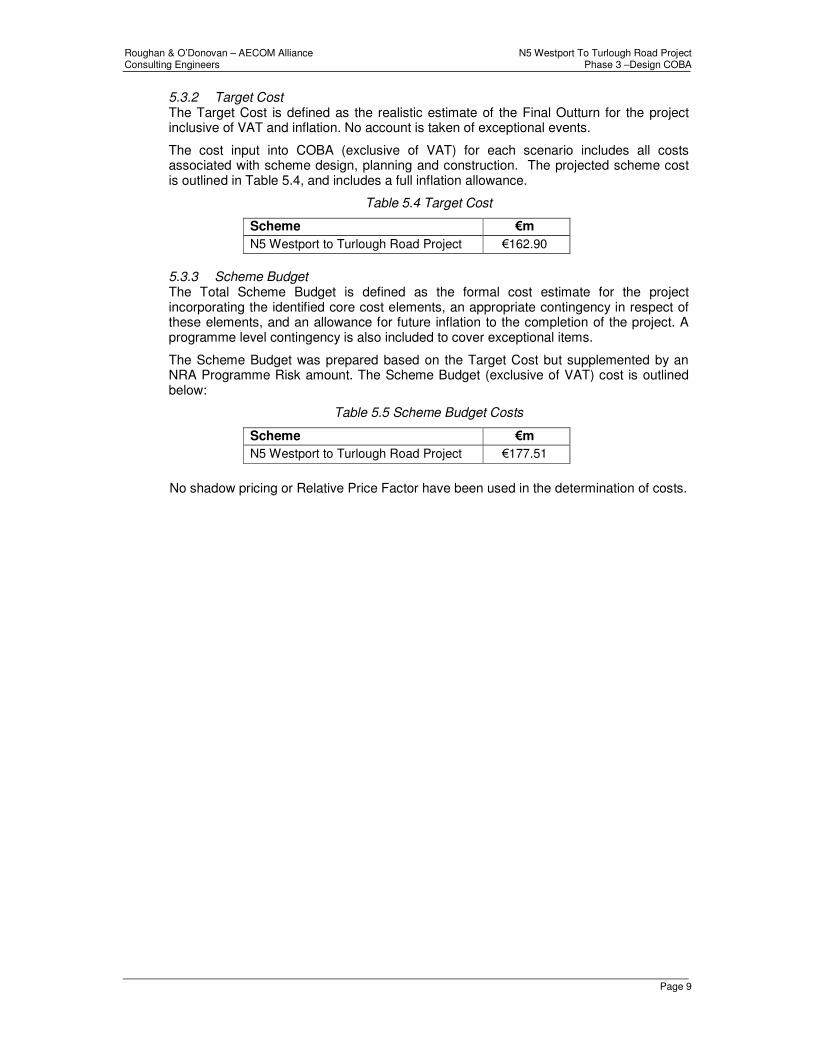
5.3.2 Target Cost The Target Cost is defined as the realistic estimate of the Final Outturn for the project inclusive of VAT and inflation. No account is taken of exceptional events.
The cost input into COBA (exclusive of VAT) for each scenario includes all costs associated with scheme design, planning and construction. The projected scheme cost is outlined in Table 5.4, and includes a full inflation allowance.
Table 5.4 Target Cost
Scheme €m N5 Westport to Turlough Road Project €162.90
5.3.3 Scheme Budget The Total Scheme Budget is defined as the formal cost estimate for the project incorporating the identified core cost elements, an appropriate contingency in respect of these elements, and an allowance for future inflation to the completion of the project. A programme level contingency is also included to cover exceptional items.
The Scheme Budget was prepared based on the Target Cost but supplemented by an NRA Programme Risk amount. The Scheme Budget (exclusive of VAT) cost is outlined below:
Table 5.5 Scheme Budget Costs
Scheme €m N5 Westport to Turlough Road Project €177.51
No shadow pricing or Relative Price Factor have been used in the determination of costs.
Roughan & O’Donovan – AECOM Alliance N5 Westport To Turlough Road Project Consulting Engineers Phase 3 –Design COBA
Page 10
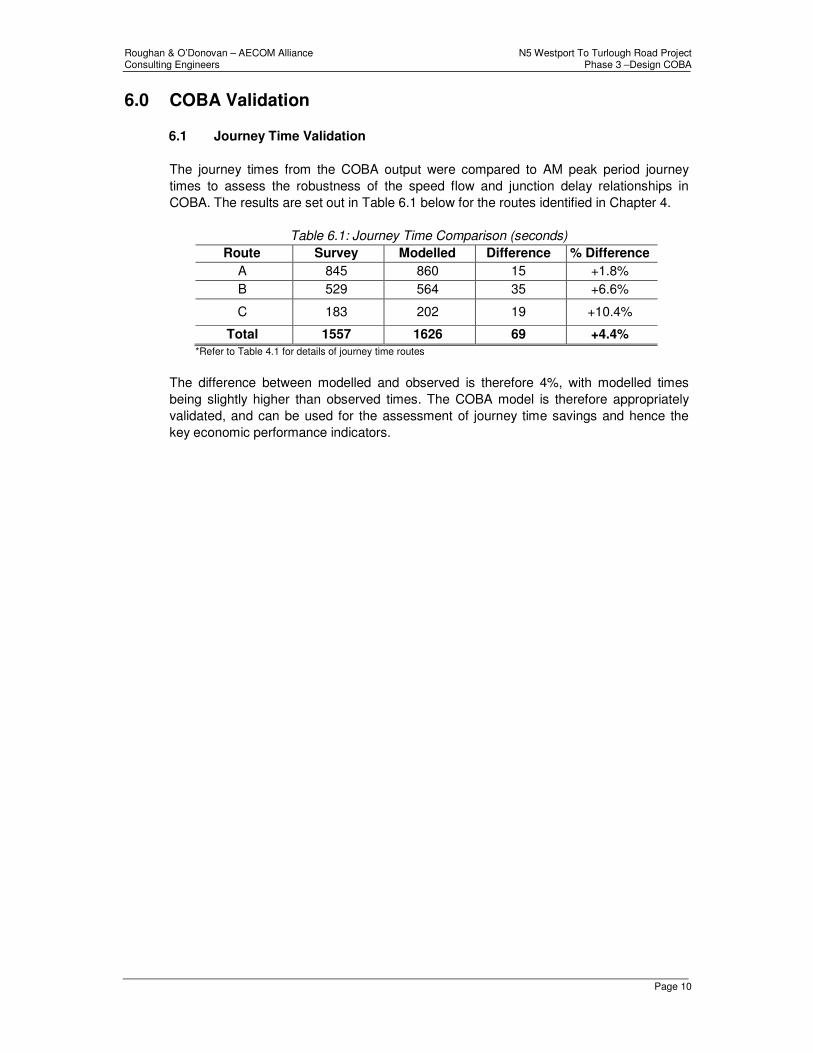
6.0 COBA Validation 6.1 Journey Time Validation The journey times from the COBA output were compared to AM peak period journey times to assess the robustness of the speed flow and junction delay relationships in COBA. The results are set out in Table 6.1 below for the routes identified in Chapter 4.
Table 6.1: Journey Time Comparison (seconds)
Route Survey Modelled Difference % Difference A 845 860 15 +1.8% B 529 564 35 +6.6%
C 183 202 19 +10.4%
Total 1557 1626 69 +4.4% *Refer to Table 4.1 for details of journey time routes
The difference between modelled and observed is therefore 4%, with modelled times being slightly higher than observed times. The COBA model is therefore appropriately validated, and can be used for the assessment of journey time savings and hence the key economic performance indicators.
Roughan & O’Donovan – AECOM Alliance N5 Westport To Turlough Road Project Consulting Engineers Phase 3 –Design COBA
Page 11
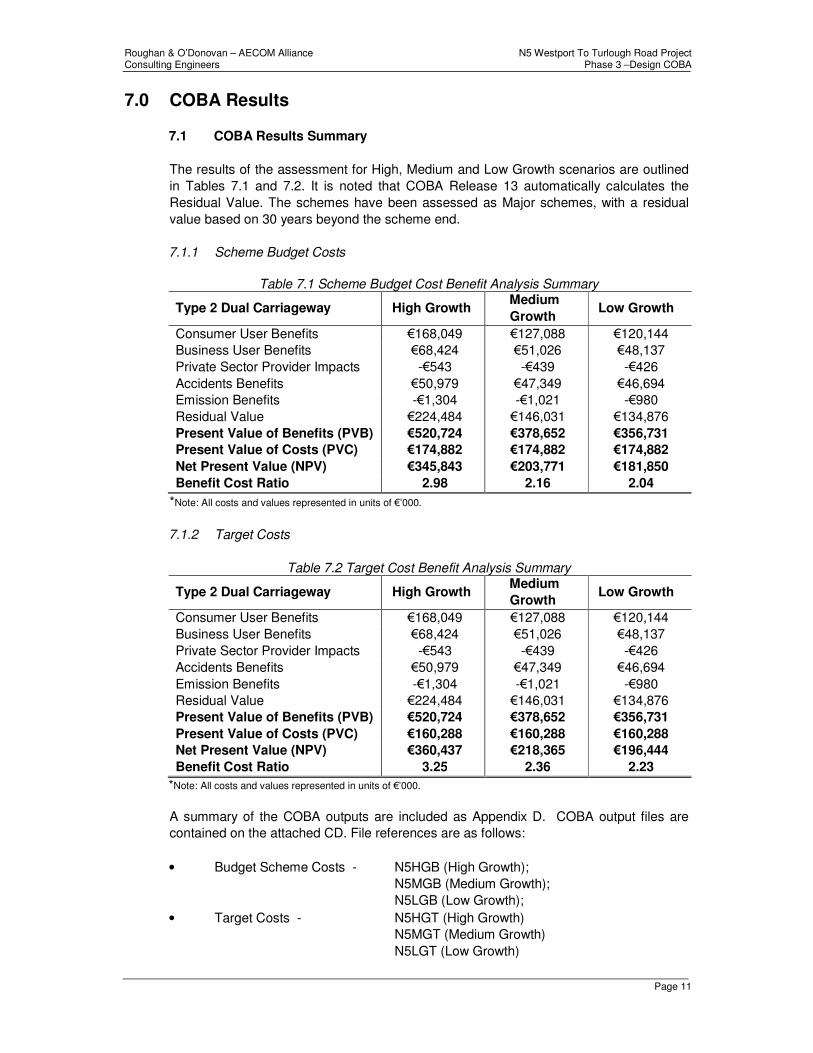
7.0 COBA Results 7.1 COBA Results Summary The results of the assessment for High, Medium and Low Growth scenarios are outlined in Tables 7.1 and 7.2. It is noted that COBA Release 13 automatically calculates the Residual Value. The schemes have been assessed as Major schemes, with a residual value based on 30 years beyond the scheme end. 7.1.1 Scheme Budget Costs
Table 7.1 Scheme Budget Cost Benefit Analysis Summary
Type 2 Dual Carriageway High Growth Medium Growth
Low Growth
Consumer User Benefits €168,049 €127,088 €120,144 Business User Benefits €68,424 €51,026 €48,137 Private Sector Provider Impacts -€543 -€439 -€426 Accidents Benefits €50,979 €47,349 €46,694 Emission Benefits -€1,304 -€1,021 -€980 Residual Value €224,484 €146,031 €134,876 Present Value of Benefits (PVB) €520,724 €378,652 €356,731 Present Value of Costs (PVC) €174,882 €174,882 €174,882 Net Present Value (NPV) €345,843 €203,771 €181,850 Benefit Cost Ratio 2.98 2.16 2.04
*Note: All costs and values represented in units of €’000.
7.1.2 Target Costs
Table 7.2 Target Cost Benefit Analysis Summary
Type 2 Dual Carriageway High Growth Medium Growth
Low Growth
Consumer User Benefits €168,049 €127,088 €120,144 Business User Benefits €68,424 €51,026 €48,137 Private Sector Provider Impacts -€543 -€439 -€426 Accidents Benefits €50,979 €47,349 €46,694 Emission Benefits -€1,304 -€1,021 -€980 Residual Value €224,484 €146,031 €134,876 Present Value of Benefits (PVB) €520,724 €378,652 €356,731 Present Value of Costs (PVC) €160,288 €160,288 €160,288 Net Present Value (NPV) €360,437 €218,365 €196,444 Benefit Cost Ratio 3.25 2.36 2.23
*Note: All costs and values represented in units of €’000. A summary of the COBA outputs are included as Appendix D. COBA output files are contained on the attached CD. File references are as follows: • Budget Scheme Costs - N5HGB (High Growth);
N5MGB (Medium Growth); N5LGB (Low Growth);
• Target Costs - N5HGT (High Growth) N5MGT (Medium Growth) N5LGT (Low Growth)
Roughan & O’Donovan – AECOM Alliance N5 Westport To Turlough Road Project Consulting Engineers Phase 3 –Design COBA
Page 12
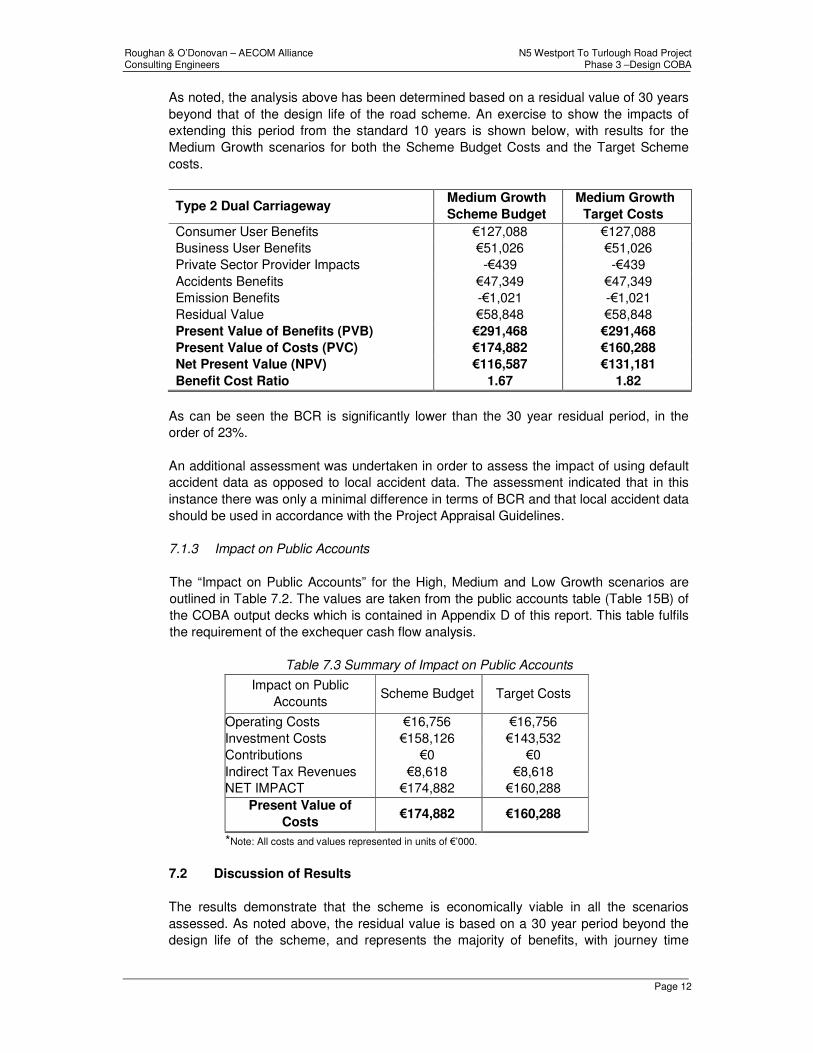
As noted, the analysis above has been determined based on a residual value of 30 years beyond that of the design life of the road scheme. An exercise to show the impacts of extending this period from the standard 10 years is shown below, with results for the Medium Growth scenarios for both the Scheme Budget Costs and the Target Scheme costs.
Type 2 Dual Carriageway Medium Growth Scheme Budget
Medium Growth Target Costs
Consumer User Benefits €127,088 €127,088 Business User Benefits €51,026 €51,026 Private Sector Provider Impacts -€439 -€439 Accidents Benefits €47,349 €47,349 Emission Benefits -€1,021 -€1,021 Residual Value €58,848 €58,848 Present Value of Benefits (PVB) €291,468 €291,468 Present Value of Costs (PVC) €174,882 €160,288 Net Present Value (NPV) €116,587 €131,181 Benefit Cost Ratio 1.67 1.82
As can be seen the BCR is significantly lower than the 30 year residual period, in the order of 23%. An additional assessment was undertaken in order to assess the impact of using default accident data as opposed to local accident data. The assessment indicated that in this instance there was only a minimal difference in terms of BCR and that local accident data should be used in accordance with the Project Appraisal Guidelines. 7.1.3 Impact on Public Accounts
The “Impact on Public Accounts” for the High, Medium and Low Growth scenarios are outlined in Table 7.2. The values are taken from the public accounts table (Table 15B) of the COBA output decks which is contained in Appendix D of this report. This table fulfils the requirement of the exchequer cash flow analysis.
Table 7.3 Summary of Impact on Public Accounts
Impact on Public Accounts
Scheme Budget Target Costs
Operating Costs €16,756 €16,756 Investment Costs €158,126 €143,532 Contributions €0 €0 Indirect Tax Revenues €8,618 €8,618 NET IMPACT €174,882 €160,288
Present Value of Costs
€174,882 €160,288
*Note: All costs and values represented in units of €’000.
7.2 Discussion of Results The results demonstrate that the scheme is economically viable in all the scenarios assessed. As noted above, the residual value is based on a 30 year period beyond the design life of the scheme, and represents the majority of benefits, with journey time
Roughan & O’Donovan – AECOM Alliance N5 Westport To Turlough Road Project Consulting Engineers Phase 3 –Design COBA
Page 13
savings representing over 30% of the benefits and accident benefits ranging from 10 -13% of the total benefits.
Roughan & O’Donovan – AECOM Alliance N5 Westport To Turlough Road Project Consulting Engineers Phase 3 –Design COBA
Page 14
8.0 Conclusions 8.1 General The Economic Assessment has been undertaken using the COBA11 Program (Release 13) in accordance with NRA Project Appraisal Guidelines 2011. Data collection and inputs to the COBA assessment have been defined throughout this report. The assessment has demonstrated a Benefit to Cost Ratio (BCR) for the Target Cost of 3.25, 2.36 and 2.23 for high, medium and low growth respectively, over a 30-year design horizon, with residual value based on a 30 year period beyond this. BCR results for the Scheme Budget scenarios are 2.98, 2.16 and 2.04 for high, medium and low growth respectively. The results show that the N5 Westport to Turlough Road Project is economically viable.
8.2 Comparison with Route Selection COBA
A Route Selection COBA was undertaken on the proposed scheme in July 2009 based on 5 scheme alternatives. Scheme E was eventually chosen as the preferred route and the scheme proceeded to Design stage on that basis. A comparison between the results at Route Selection and the current assessment is complicated by alterations to the scheme (at Route Selection the scheme extended to Bohola in the east), and significant changes to the Project Appraisal Guidelines including a new Present Value Year (2009), lower traffic growth rates and a new method of calculating residual value. Nevertheless, a comparison between the projected BCR for the Route Selection scenarios and the Design Scheme Budget scenarios is considered instructive. The Route Selection assessment demonstrated a BCR of 1.95 and 1.82 for the high and low growth scenarios respectively. However the previous assessment was based on the 10 year residual period.
Roughan & O’Donovan – AECOM Alliance N5 Westport To Turlough Road Project Consulting Engineers Phase 3 –Design COBA
Page 15
Appendix A Scheme Plans
Roughan & O’Donovan – AECOM Alliance N5 Westport To Turlough Road Project Consulting Engineers Phase 3 –Design COBA
Page 16
Appendix B
CoBA Link-Node Diagram
Roughan & O’Donovan – AECOM Alliance N5 Westport To Turlough Road Project Consulting Engineers Phase 3 –Design COBA
Page 17
Appendix C
COBA Input Files
Roughan & O’Donovan – AECOM Alliance N5 Westport To Turlough Road Project Consulting Engineers Phase 3 –Design COBA
Page 18
Appendix D
Cost Output Summaries