Embed Size (px)
Citation preview

n MAPPING THE FUTURE
ANNUAL REPORT 2006


contents
2 FINANcIAL HIGHLIGHTs
3 LETTER TO sHAREHOLdERs: THE YEAR IN REvIEw
6 INTELLEcTUAL PROPERTIEs
7 NEw PROdUcT OFFERINGs
8 FOcUs ON QUALITY
9 MARkET FOR cONMEd’s cOMMON sTOck ANd RELATEd sTOckHOLdER MATTERs
9 FIvE YEAR sUMMARY OF sELEcTEd FINANcIAL dATA
10 MANAGEMENT’s dIscUssION ANd ANALYsIs OF FINANcIAL cONdITION ANd
REsULTs OF OPERATIONs
19 MANAGEMENT’s REPORT ON INTERNAL cONTROL OvER FINANcIAL REPORTING
20 REPORT OF INdEPENdENT REGIsTEREd PUbLIc AccOUNTING FIRM
21 cONsOLIdATEd bALANcE sHEETs
22 cONsOLIdATEd sTATEMENTs OF OPERATIONs
23 cONsOLIdATEd sTATEMENTs OF sHAREHOLdERs’ EQUITY
24 cONsOLIdATEd sTATEMENTs OF cAsH FLOws
25 NOTEs TO cONsOLIdATEd FINANcIAL sTATEMENTs
36 bOARd OF dIREcTORs bIOGRAPHIEs
Ibc OFFIcERs, sHAREHOLdER INFORMATION, sUbsIdIARIEs
96 97 98 99 00 01 02 03 04 05 06
RETAINEd EARNINGs (IN $ MILLIONs)
NET INcOME (IN $ MILLIONs)
96 98 99 00 01 02 03 04 05
financial highlights
16.3 17.8
27.2
19.3
24.4
32.1
33.5
34.2
32.0
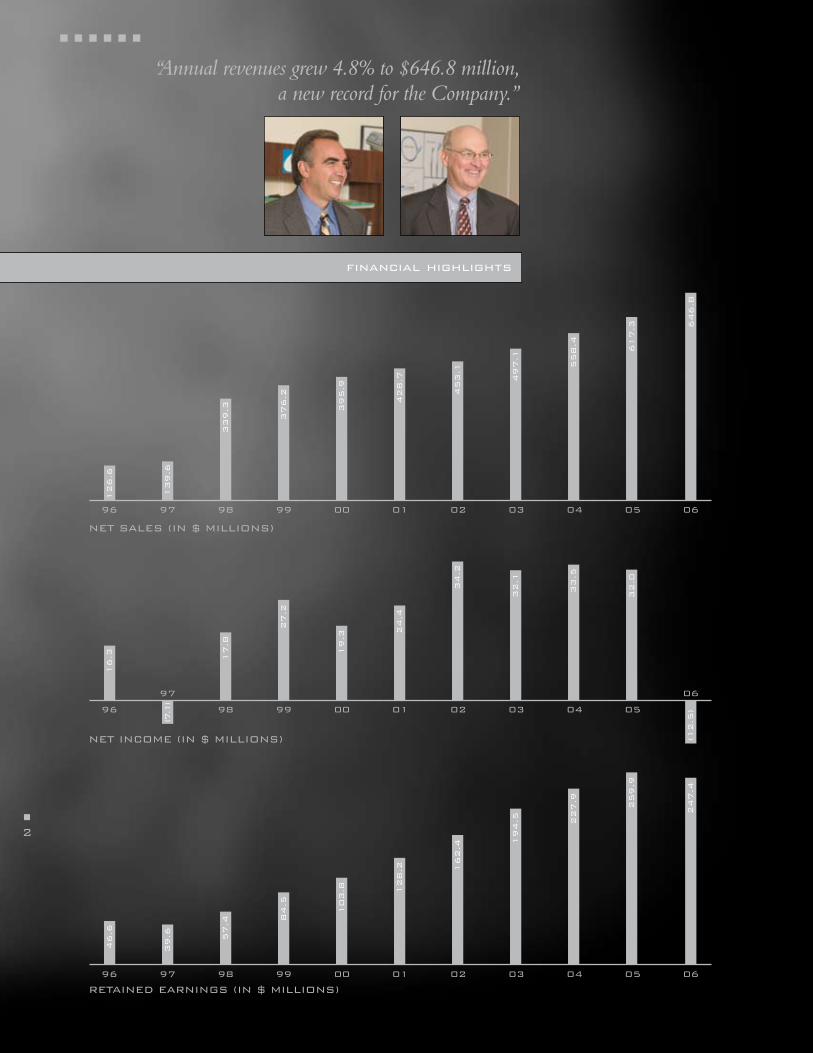
“Annual revenues grew 4.8% to $646.8 million, a new record for the Company.”
(12.5
)
46.6
39.6 57.4
84.5
103.8 128.2 1
62.4
194.5 227.9
259.9
247.4
NET sALEs (IN $ MILLIONs)
96 97 98 99 00 01 02 03 04 05 06
61
7.3
126.6
139.6
339.3
376.2
395.9
497
.1
428.7
453.1
55
8.4
64
6.8
n
2
n n n n n n
97 06
(7.1
)
3n
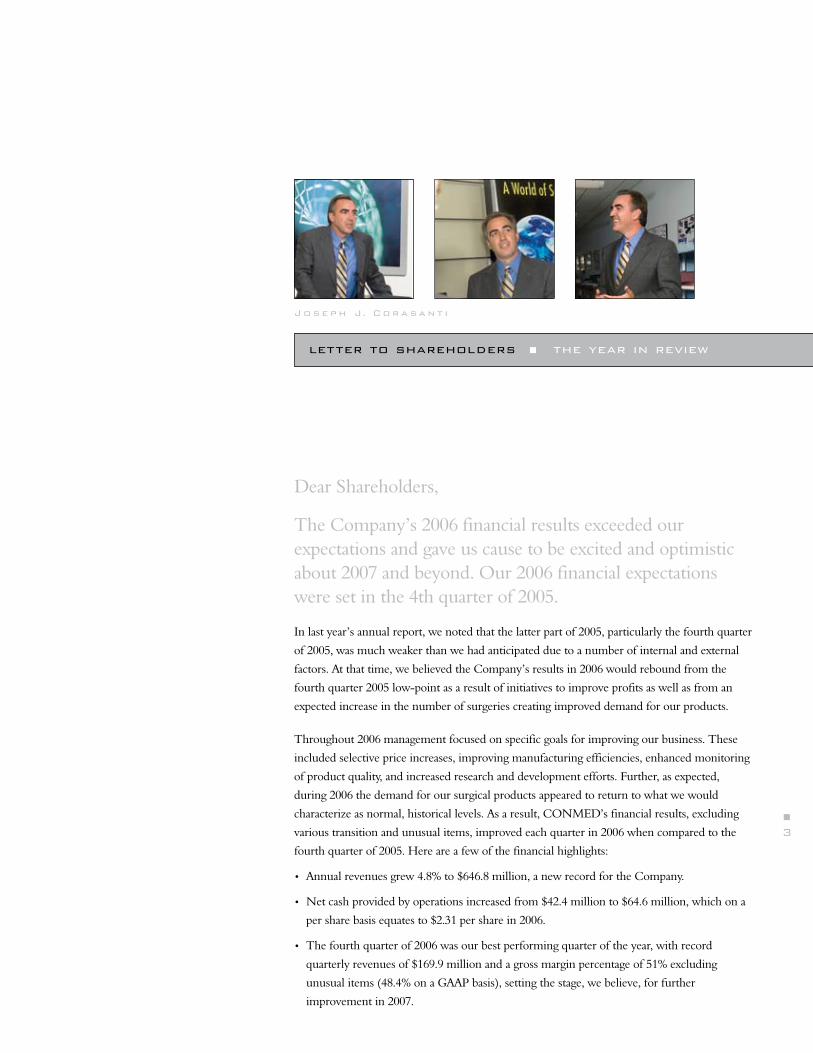
J o s e p h J. c o r a s a n t i
Dear Shareholders,
The Company’s 2006 financial results exceeded our expectations and gave us cause to be excited and optimistic about 2007 and beyond. Our 2006 financial expectations were set in the 4th quarter of 2005.
In last year’s annual report, we noted that the latter part of 2005, particularly the fourth quarter
of 2005, was much weaker than we had anticipated due to a number of internal and external
factors. At that time, we believed the Company’s results in 2006 would rebound from the
fourth quarter 2005 low-point as a result of initiatives to improve profits as well as from an
expected increase in the number of surgeries creating improved demand for our products.
Throughout 2006 management focused on specific goals for improving our business. These
included selective price increases, improving manufacturing efficiencies, enhanced monitoring
of product quality, and increased research and development efforts. Further, as expected,
during 2006 the demand for our surgical products appeared to return to what we would
characterize as normal, historical levels. As a result, CONMED’s financial results, excluding
various transition and unusual items, improved each quarter in 2006 when compared to the
fourth quarter of 2005. Here are a few of the financial highlights:
• Annual revenues grew 4.8% to $646.8 million, a new record for the Company.
• Net cash provided by operations increased from $42.4 million to $64.6 million, which on a
per share basis equates to $2.31 per share in 2006.
• The fourth quarter of 2006 was our best performing quarter of the year, with record
quarterly revenues of $169.9 million and a gross margin percentage of 51% excluding
unusual items (48.4% on a GAAP basis), setting the stage, we believe, for further
improvement in 2007.
letter to shareholders n the year in review
n
n n n n n n
4
These solid financial results are based on the strong performance
seen across our product lines:
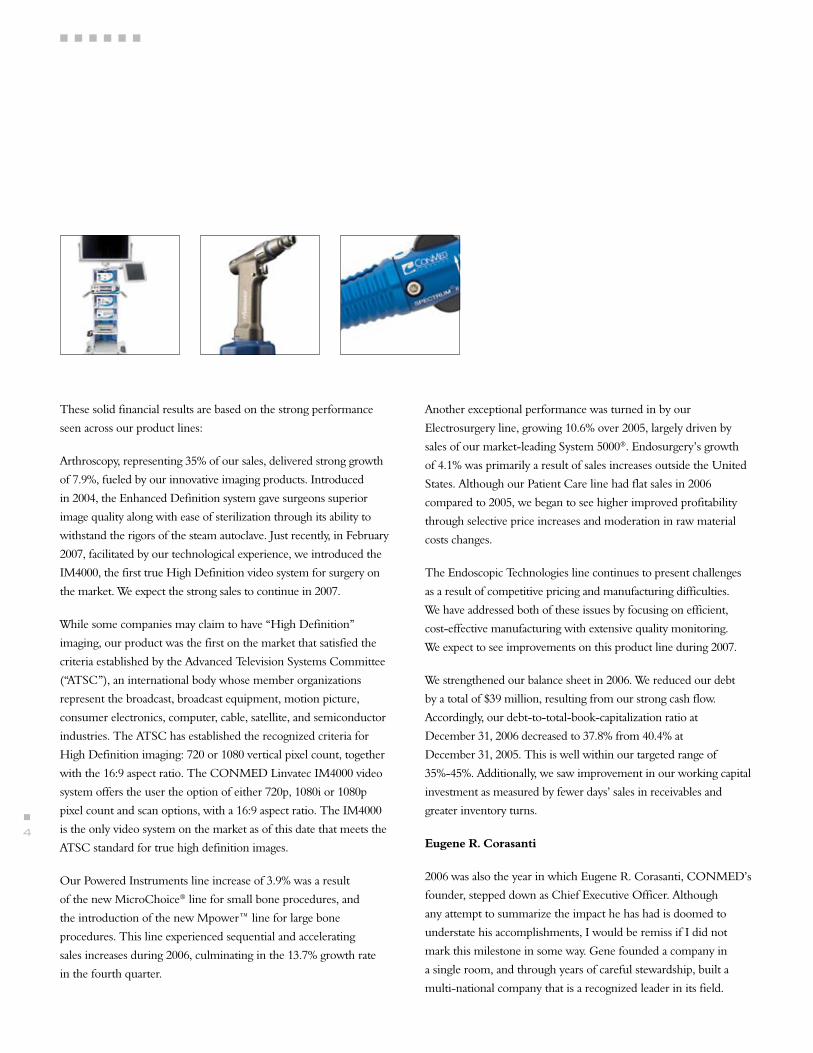
Arthroscopy, representing 35% of our sales, delivered strong growth
of 7.9%, fueled by our innovative imaging products. Introduced
in 2004, the Enhanced Definition system gave surgeons superior
image quality along with ease of sterilization through its ability to
withstand the rigors of the steam autoclave. Just recently, in February
2007, facilitated by our technological experience, we introduced the
IM4000, the first true High Definition video system for surgery on
the market. We expect the strong sales to continue in 2007.
While some companies may claim to have “High Definition”
imaging, our product was the first on the market that satisfied the
criteria established by the Advanced Television Systems Committee
(“ATSC”), an international body whose member organizations
represent the broadcast, broadcast equipment, motion picture,
consumer electronics, computer, cable, satellite, and semiconductor
industries. The ATSC has established the recognized criteria for
High Definition imaging: 720 or 1080 vertical pixel count, together
with the 16:9 aspect ratio. The CONMED Linvatec IM4000 video
system offers the user the option of either 720p, 1080i or 1080p
pixel count and scan options, with a 16:9 aspect ratio. The IM4000
is the only video system on the market as of this date that meets the
ATSC standard for true high definition images.
Our Powered Instruments line increase of 3.9% was a result
of the new MicroChoice® line for small bone procedures, and
the introduction of the new Mpower™ line for large bone
procedures. This line experienced sequential and accelerating
sales increases during 2006, culminating in the 13.7% growth rate
in the fourth quarter.
Another exceptional performance was turned in by our
Electrosurgery line, growing 10.6% over 2005, largely driven by
sales of our market-leading System 5000®. Endosurgery’s growth
of 4.1% was primarily a result of sales increases outside the United
States. Although our Patient Care line had flat sales in 2006
compared to 2005, we began to see higher improved profitability
through selective price increases and moderation in raw material
costs changes.
The Endoscopic Technologies line continues to present challenges
as a result of competitive pricing and manufacturing difficulties.
We have addressed both of these issues by focusing on efficient,
cost-effective manufacturing with extensive quality monitoring.
We expect to see improvements on this product line during 2007.
We strengthened our balance sheet in 2006. We reduced our debt
by a total of $39 million, resulting from our strong cash flow.
Accordingly, our debt-to-total-book-capitalization ratio at
December 31, 2006 decreased to 37.8% from 40.4% at
December 31, 2005. This is well within our targeted range of
35%-45%. Additionally, we saw improvement in our working capital
investment as measured by fewer days’ sales in receivables and
greater inventory turns.
Eugene R. Corasanti
2006 was also the year in which Eugene R. Corasanti, CONMED’s
founder, stepped down as Chief Executive Officer. Although
any attempt to summarize the impact he has had is doomed to
understate his accomplishments, I would be remiss if I did not
mark this milestone in some way. Gene founded a company in
a single room, and through years of careful stewardship, built a
multi-national company that is a recognized leader in its field.

5n
In doing so, Gene was a responsible member of his community,
increasing employment in our Upstate New York home to its current
level of over 1,100 employees with an additional 2,100 employees
worldwide. There are few companies with as many employees who
have been loyal and stable members of the Company as CONMED
has. This is a testament to the balance Gene brought to the working
environment and culture at CONMED.
While the Company has grown dramatically as a result of
acquisitions, we have never placed the Company at risk while
seeking growth. This is a direct result of one of Gene’s most
important principles: focus not only on what CONMED stands
to gain in any transaction, but also on what CONMED stands to
lose. We are still focused on growth, but we are equally focused on
growing responsibly, since we will not put at risk what Gene has
built up over the past 30 years.
While Gene’s stepping down from the Chief Executive Officer
position is an important moment in CONMED’s history, Gene
will continue to serve as Chairman of the Board of Directors. We
will never depart from the founding principles Gene provided
for CONMED—and fortunately, with Gene continuing to serve
as Chairman, he will be in a position to help us remember the
principles and strategies that made this company strong.
The Outlook
We look forward to the future and continue to make strategic
investments in our business for future growth. Our research
and development spending has increased to 4.7% of sales and is
producing results. We have launched our PRO2® pulse oximetry
line and have made additional software improvements to it, making
it the best blood oximetry level monitor available on the market.
Our HD video camera system has launched, as well as our new
powered instrument line on MicroChoice® and Mpower™. We are
continuing to invest in cardiac output monitoring and expect our
new “ECOM” cardiac output monitor to be released by year-end.
Continued research and development investment is being made in
all of our business units with the focus being placed in the area of
procedure specific arthroscopy, HD video for general surgery, biliary
products for GI Endoscopy and specialty products for Electrosurgery.
We are also investing in our sales force. We expect to add 30 sales
representatives to our Orthopedic sales force in 2007 and have already
added seven sales representatives to our Electrosurgery group.
Our business model has proven to be solid: growth through servicing
customers with top-notch products and technologies which are
market-leading. Our management team has never been as strong as
it is today. We continue to adhere to the strategy that has brought us
to where we are today, which has been to focus on achieving growth
from both internal, organic increases and acquisitions.
As always, we thank you for your continued trust and support.
Joseph J. Corasanti
President, Chief Executive Officer
E u g e n e R. c o r a s a n t i
n
n n n n n n
6
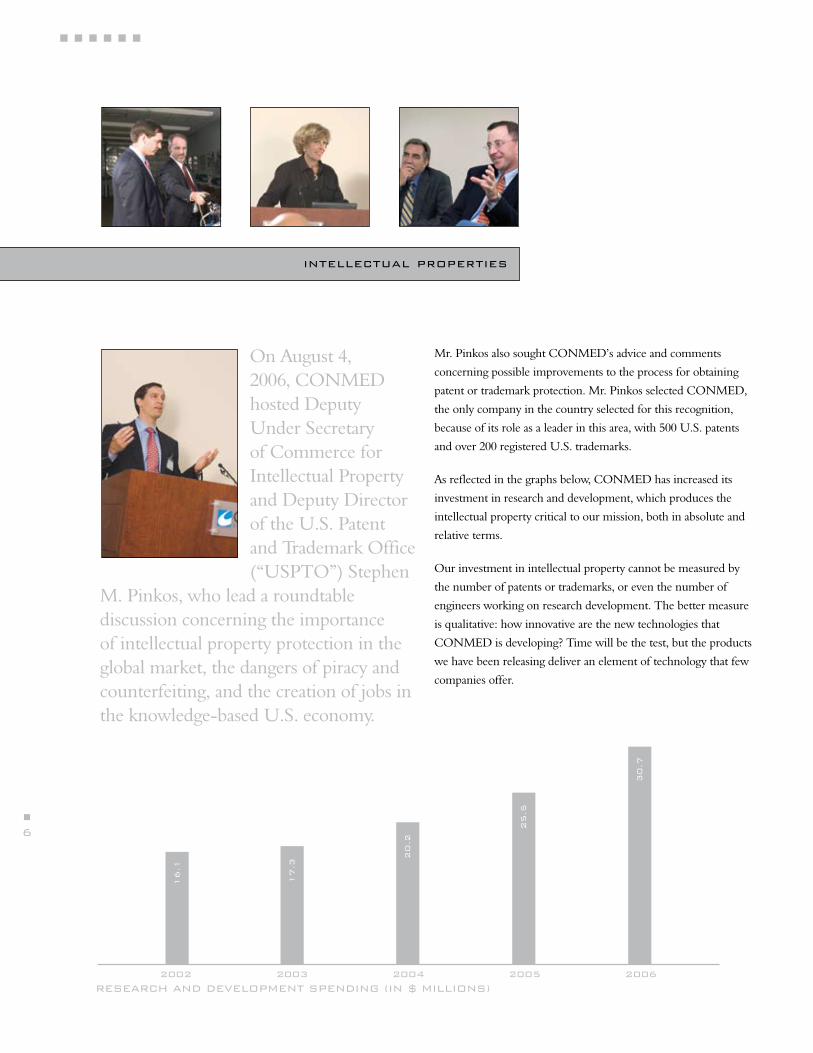
On August 4, 2006, CONMED hosted Deputy Under Secretary of Commerce for Intellectual Property and Deputy Director of the U.S. Patent and Trademark Office (“USPTO”) Stephen
M. Pinkos, who lead a roundtable discussion concerning the importance of intellectual property protection in the global market, the dangers of piracy and counterfeiting, and the creation of jobs in the knowledge-based U.S. economy.
Mr. Pinkos also sought CONMED’s advice and comments
concerning possible improvements to the process for obtaining
patent or trademark protection. Mr. Pinkos selected CONMED,
the only company in the country selected for this recognition,
because of its role as a leader in this area, with 500 U.S. patents
and over 200 registered U.S. trademarks.
As reflected in the graphs below, CONMED has increased its
investment in research and development, which produces the
intellectual property critical to our mission, both in absolute and
relative terms.
Our investment in intellectual property cannot be measured by
the number of patents or trademarks, or even the number of
engineers working on research development. The better measure
is qualitative: how innovative are the new technologies that
CONMED is developing? Time will be the test, but the products
we have been releasing deliver an element of technology that few
companies offer.
2002 2003 2004 2005 2006
REsEARcH ANd dEvELOPMENT sPENdING (IN $ MILLIONs)
16.1
17.3
20.2
25.5
30.7
intellectual properties
7n
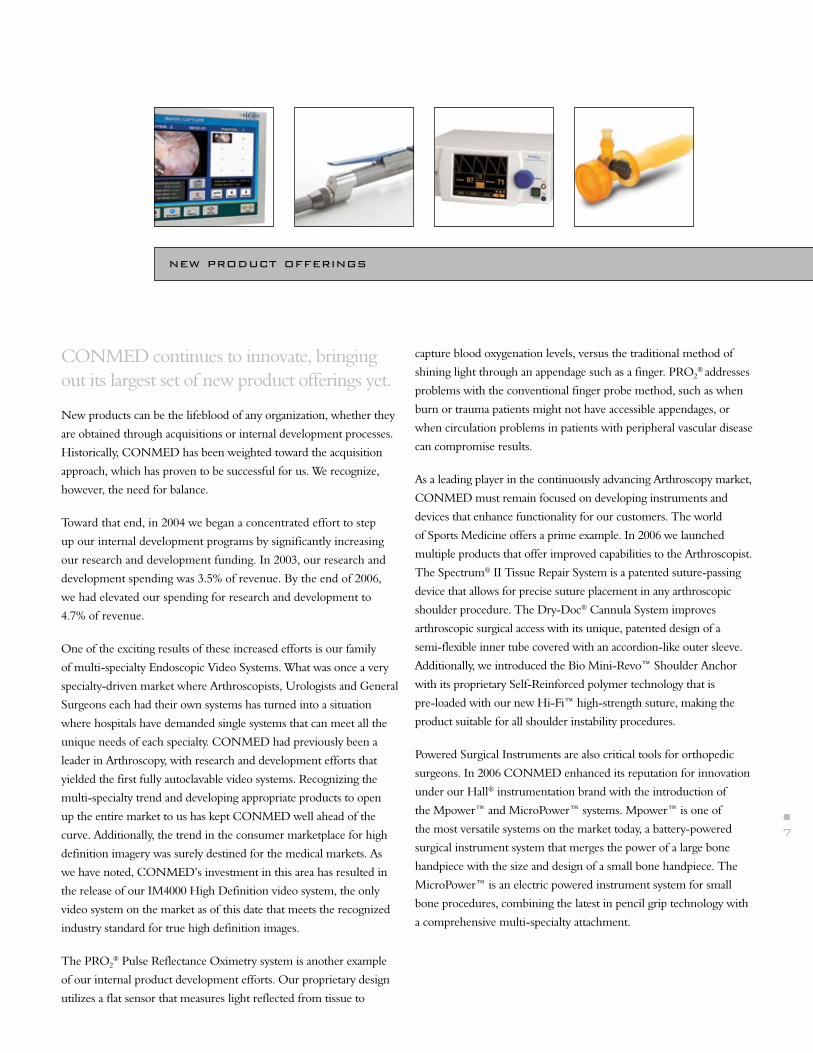
CONMED continues to innovate, bringing out its largest set of new product offerings yet.
New products can be the lifeblood of any organization, whether they
are obtained through acquisitions or internal development processes.
Historically, CONMED has been weighted toward the acquisition
approach, which has proven to be successful for us. We recognize,
however, the need for balance.
Toward that end, in 2004 we began a concentrated effort to step
up our internal development programs by significantly increasing
our research and development funding. In 2003, our research and
development spending was 3.5% of revenue. By the end of 2006,
we had elevated our spending for research and development to
4.7% of revenue.
One of the exciting results of these increased efforts is our family
of multi-specialty Endoscopic Video Systems. What was once a very
specialty-driven market where Arthroscopists, Urologists and General
Surgeons each had their own systems has turned into a situation
where hospitals have demanded single systems that can meet all the
unique needs of each specialty. CONMED had previously been a
leader in Arthroscopy, with research and development efforts that
yielded the first fully autoclavable video systems. Recognizing the
multi-specialty trend and developing appropriate products to open
up the entire market to us has kept CONMED well ahead of the
curve. Additionally, the trend in the consumer marketplace for high
definition imagery was surely destined for the medical markets. As
we have noted, CONMED’s investment in this area has resulted in
the release of our IM4000 High Definition video system, the only
video system on the market as of this date that meets the recognized
industry standard for true high definition images.
The PRO2® Pulse Reflectance Oximetry system is another example
of our internal product development efforts. Our proprietary design
utilizes a flat sensor that measures light reflected from tissue to
capture blood oxygenation levels, versus the traditional method of
shining light through an appendage such as a finger. PRO2® addresses
problems with the conventional finger probe method, such as when
burn or trauma patients might not have accessible appendages, or
when circulation problems in patients with peripheral vascular disease
can compromise results.
As a leading player in the continuously advancing Arthroscopy market,
CONMED must remain focused on developing instruments and
devices that enhance functionality for our customers. The world
of Sports Medicine offers a prime example. In 2006 we launched
multiple products that offer improved capabilities to the Arthroscopist.
The Spectrum® II Tissue Repair System is a patented suture-passing
device that allows for precise suture placement in any arthroscopic
shoulder procedure. The Dry-Doc® Cannula System improves
arthroscopic surgical access with its unique, patented design of a
semi-flexible inner tube covered with an accordion-like outer sleeve.
Additionally, we introduced the Bio Mini-Revo™ Shoulder Anchor
with its proprietary Self-Reinforced polymer technology that is
pre-loaded with our new Hi-Fi™ high-strength suture, making the
product suitable for all shoulder instability procedures.
Powered Surgical Instruments are also critical tools for orthopedic
surgeons. In 2006 CONMED enhanced its reputation for innovation
under our Hall® instrumentation brand with the introduction of
the Mpower™ and MicroPower™ systems. Mpower™ is one of
the most versatile systems on the market today, a battery-powered
surgical instrument system that merges the power of a large bone
handpiece with the size and design of a small bone handpiece. The
MicroPower™ is an electric powered instrument system for small
bone procedures, combining the latest in pencil grip technology with
a comprehensive multi-specialty attachment.
new product offerings
n
n n n n n n
8
While CONMED’s commitment to quality is long-standing, our thinking has shifted to a more forward-leaning vision of preparing for future growth.
Over the past two years, we have created a Corporate Regulatory
Affairs Group, whose responsibilities for quality and regulatory
compliance span all of the Company’s divisions and all of the
countries in which we operate. Our approach to Compliance is
three-pronged.
First, each division has a quality assurance group working with the
operations groups to meet regulatory compliance obligations. This
is the day-to-day work that makes the difference in the operating
room when our products must work—and do. While United States
regulatory affairs compliance is handled at the division level, we have
also created a centralized global regulatory affairs group to support
our expanding global market reach and to oversee our product
regulatory strategies in international markets. Rather than have all
our divisions tracking the same developments in registration and
other requirements throughout the world and duplicating the same
work many times over, we are shifting this responsibility to a single
organization. The increased focus will improve the depth of our
knowledge of foreign requirements, and will eliminate inefficiencies
while freeing up resources to improve our focus on domestic
regulatory affairs and quality assurance at the division level.
Second, we have created the CONMED Quality College, which
is the engine for our training efforts. The Quality College will
focus on three areas: (i) educating our employees concerning the
specific regulations that apply to CONMED as a medical device
manufacturer, and reinforcing that training; (ii) developing skills
in problem-solving and failure analysis theory, so we can solve
problems the right way the first time; and (iii) reinforcing the
regulations and process through evaluation of case studies. The
CONMED Quality College was launched in 2006 throughout
the Company, and is already making a difference.
Finally, we have launched an internal Quality Audit Group, which
seeks to visit each facility at least once a year to make sure our
regulatory performance is strong.
focus on quality
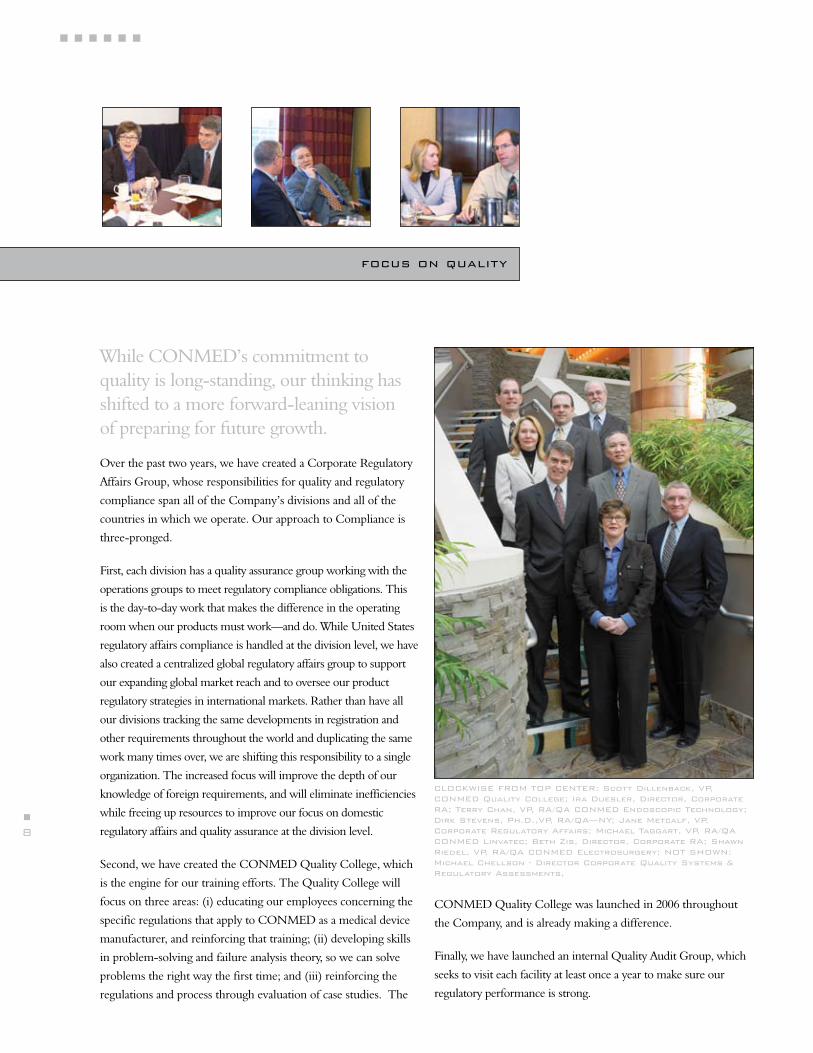
cLOckwIsE FROM TOP cENTER: scott dillenback, vP, cONMEd Quality college; Ira duesler, director, corporate RA; Terry chan, vP, RA/QA cONMEd Endoscopic Technology; dirk stevens, Ph.d.,vP, RA/QA—NY; Jane Metcalf, vP, corporate Regulatory Affairs; Michael Taggart, vP, RA/QA cONMEd Linvatec; beth Zis, director, corporate RA; shawn Riedel, vP, RA/QA cONMEd Electrosurgery; NOT sHOwN: Michael chellson - director corporate Quality systems & Regulatory Assessments,

n
9
(In thousands, except per share data)
Years Ended December 31, 2002 2003 2004 2005 2006
Statements of Operations Data(1): Net sales $ 453,062 $ 497,130 $ 558,388 $ 617,305 $ 646,812 Income (loss) from operations 79,349 79,955 63,161 63,748 (4,603 ) Net income (loss) 34,151 32,082 33,465 31,994 (12,507 )Earnings (loss) per share: Basic $ 1.25 $ 1.11 $ 1.13 $ 1.09 $ (.45 ) Diluted 1.23 1.10 1.11 1.08 (.45 )Weighted average number of common shares in calculating: Basic earnings (loss) per share 27,337 28,930 29,523 29,300 27,966 Diluted earnings (loss) per share 27,827 29,256 30,105 29,736 27,966Other Financial Data: Depreciation and amortization $ 22,370 $ 24,854 $ 26,868 $ 30,786 $ 29,851 Capital expenditures 13,384 9,309 12,419 16,242 21,895
Balance Sheet Data (at period end): Cash and cash equivalents $ 5,626 $ 5,986 $ 4,189 $ 3,454 $ 3,831 Total assets 742,140 805,058 872,825 903,783 861,571 Long-term debt (including current portion) 257,387 264,591 294,522 306,851 267,824 Total shareholders’ equity 386,939 433,490 447,983 453,006 440,354
(1) Results of operations of acquired businesses have been recorded in the financial statements since the date of acquisition. See additional discussion in Note 2 to the Consolidated Financial Statements.
Our common stock, par value $.01 per share, is traded on the NASDAQ Stock Market under the symbol “CNMD.” At January 31, 2007, there were 1,076 registered holders of our common stock and approximately 8,683 accounts held in “street name.”
The following table sets forth quarterly high and low sales prices for the years ended December 31, 2005 and 2006, as reported by the NASDAQ Stock Market.
2005 2006 Period High Low High Low ________________________________________________________________________________________________________ First Quarter $ 30.16 $ 26.69 $ 24.00 $ 18.09 Second Quarter 32.58 29.27 22.05 18.75 Third Quarter 31.81 27.44 21.29 19.19 Fourth Quarter 27.85 22.55 23.32 21.10
We did not pay cash dividends on our common stock during 2005 or 2006 and do not currently intend to pay dividends for the foreseeable future. Future decisions as to the payment of dividends will be at the discretion of the Board of Directors, subject to conditions then existing, including our financial requirements and condition and the limitation and payment of cash dividends contained in debt agreements.
Our Board of Directors has authorized a share repurchase program; see Note 8 to the Consolidated Financial Statements.
Information relating to compensation plans under which equity securities of CONMED Corporation are authorized for issuance is set forth in the section captioned “Equity Compensation Plans” in CONMED Corporation’s definitive Proxy Statement or other informational filing for our 2007 Annual Meeting of Stockholders and all such information is incorporated herein by reference.
Five Year SummarY oF Selected Financial data
market For conmed’S common Stock and related Stockholder matterS
n
n n n n n n
10
The following discussion should be read in conjunction with the Five Year Summary of Selected Financial Data, and our Consolidated Financial Statements and related notes contained elsewhere in this Annual Report.
Overview of CONMED Corporation
CONMED Corporation (“CONMED,” the “Company,” “we” or “us”) is a medical technology company with an emphasis on surgical devices and equipment for minimally invasive procedures and monitoring. The Company’s products serve the clinical areas of arthroscopy, powered surgical instruments, electrosurgery, cardiac monitoring disposables, endosurgery and endoscopic technologies. They are used by surgeons and physicians in a variety of specialties including orthopedics, general surgery, gynecology, neurosurgery, and gastroenterology. These product lines and the percentage of consolidated revenues associated with each, are as follows: 2004 2005 2006Arthroscopy 37% 34% 35%Powered Surgical Instruments 23 22 21Electrosurgery 15 14 15Patient Care 14 12 12Endosurgery 8 8 8Endoscopic Technologies 3 10 9 ______ ______ ______ Consolidated Net Sales 100% 100% 100% ______ ______ ______ ______ ______ ______
A significant amount of our products are used in surgical procedures with approximately 75% of our revenues derived from the sale of disposable products. Our capital equipment offerings also facilitate the ongoing sale of related disposable products and accessories, thus providing us with a recurring revenue stream. We manufacture substantially all of our products in facilities located in the United States, Mexico and Finland. We market our products both domestically and internationally directly to customers and through distributors. International sales approximated 35%, 37% and 39% in 2004, 2005 and 2006, respectively.
Business Environment and Opportunities
The aging of the worldwide population along with lifestyle changes, continued cost containment pressures on healthcare systems and the desire of clinicians and administrators to use less invasive (or non-invasive) procedures are important trends which are driving the growth in our industry. We believe that with our broad product offering of high quality surgical and patient care products, we can capitalize on this growth for the benefit of the Company and our shareholders.
In order to further our growth prospects, we have historically used strategic business acquisitions and exclusive distribution relationships to continue to diversify our product offerings, increase our market share and realize economies of scale.
We have a variety of research and development initiatives focused in each of our principal product lines. Among the most significant of these efforts is the Endotracheal Cardiac Output Monitor (“ECOM”). Our ECOM product offering is expected to provide an innovative alternative to catheter monitoring of cardiac output with a specially designed endotracheal tube which utilizes proprietary bio-impedance technology. Also of significance are our research and development efforts in the area of tissue-sealing for electrosurgery.
Continued innovation and commercialization of new proprietary products and processes are essential elements of our long-term growth strategy. In February 2007, we unveiled several new products at the American Academy of Orthopedic Surgeons Annual Meeting which we believe will further enhance our Arthroscopy product
offerings. Our reputation as an innovator is exemplified by these recent product introductions, which include the following: the IM4000 High Definition Camera System, our first high definition camera system utilized in arthroscopic and multi-specialty endoscopy; the 24K Irrigation System, a high end irrigation system that provides fluid to the joint space for irrigation, distention, and hemostasis during an arthroscopic procedure; the Hip Arthroscopy Kit used for diagnosis and treatment of hip pain; and the Hi-Fi Suture Cutter, specifically designed to cut high strength sutures utilized with or without attached anchors for soft tissue repair.
Business Challenges
In September 2004, we acquired the business operations of the Endoscopic Technologies Division of C.R. Bard, Inc. (the “Endoscopic Technologies acquisition”) for aggregate consideration of $81.3 million in cash. The acquired business has enhanced our product offerings by adding a comprehensive line of single-use medical devices employed by gastrointestinal and pulmonary physicians to diagnose and treat diseases of the digestive tract and lungs using minimally invasive endoscopic techniques. The transfer of the Endoscopic Technologies production lines from C.R. Bard facilities to CONMED facilities has proven to be more time-consuming, costly and complex than was originally anticipated. Operational issues associated with the transfer of production lines have resulted in backorders, which combined with increased competition and pricing pressures in the marketplace have resulted in decreased sales, lower than anticipated gross margins and operating losses. As a result of these factors, during our fourth quarter 2006 goodwill impairment testing, we determined that the goodwill of our Endoscopic Technologies business was impaired and consequently we recorded an impairment charge of $46.7 million to reduce the carrying amount of this business to its fair value. We have taken corrective action to resolve the operational issues associated with product shortages and are continuing our efforts to ensure a return to sales growth and profitability.
Our facilities are subject to periodic inspection by the United States Food and Drug Administration (“FDA”) for, among other things, conformance to Quality System Regulation and Current Good Manufacturing Practice (“CGMP”) requirements. Following an inspection, the FDA typically provides its observations, if any, in the form of a Form 483 (Notice of Inspectional Observations) with specific observations concerning potential violation of regulations. In December 2004, the FDA initiated an inspection of our Largo, Florida manufacturing facility. Following the inspection, the FDA issued to us a Form 483 which included observations related to our corrective and preventive action procedures for nonconforming products and other quality problems. Although we responded to the Form 483 to address and correct the deficiencies, the FDA further issued a warning letter in June 2005 relating to these observations. We subsequently responded to the FDA with a plan of the corrective actions that we had taken or proposed to take. In that response, we committed to further developing and implementing, in a timely manner, the principles and strategies of systems-based quality management for improved CGMP compliance, operational performance and efficiencies. We consider the receipt of a warning letter to be an important regulatory event. Accordingly, we have undertaken corrective actions that have involved significant additional costs to the Company. In May 2006, the FDA initiated a re-inspection of our Largo, Florida manufacturing facility to verify issues related to the June 2005 warning letter and December 2004 Form 483 observations had been corrected. No further Form 483 observations were issued by FDA during the May 2006 inspection. We will continue implementing and monitoring continuous improvement activities through our Company-wide quality systems initiative. However, there can be no assurance that the actions undertaken by
management’S diScuSSion and analYSiS oF Financial condition and reSultS oF operationS
n
11
the Company will ensure that we will not receive an additional Form 483 or warning letter, or other regulatory actions which may include consent decrees or fines.
We remain in litigation against Johnson & Johnson and several of its subsidiaries, including Ethicon, Inc. for violation of federal and state antitrust laws. The lawsuit claims that Johnson & Johnson engaged in illegal and anticompetitive conduct with respect to sales of product used in endoscopic surgery, resulting in higher prices to consumers and the exclusion of competition. We have sought relief which includes an injunction restraining Johnson & Johnson from continuing its anticompetitive practice as well as receiving the maximum amount of damages allowed by law. While we believe that our claims are well-grounded in fact and law, there can be no assurance that we will be successful in our claim. In addition, the costs associated with pursuing this claim have been substantial. See Note 11 to the Consolidated Financial Statements.
Critical Accounting Policies
Preparation of our financial statements requires us to make estimates and assumptions which affect the reported amounts of assets, liabilities, revenues and expenses. Note 1 to the Consolidated Financial Statements describes the significant accounting policies used in preparation of the Consolidated Financial Statements. The most significant areas involving management judgments and estimates are described below and are considered by management to be critical to understanding the financial condition and results of operations of CONMED Corporation.
Revenue Recognition
Revenue is recognized when title has been transferred to the customer which is at the time of shipment. The following policies apply to our major categories of revenue transactions:• Sales to customers are evidenced by firm purchase orders. Title and
the risks and rewards of ownership are transferred to the customer when product is shipped under our stated shipping terms. Payment by the customer is due under fixed payment terms.
• We place certain of our capital equipment with customers in return for commitments to purchase disposable products over time periods generally ranging from one to three years. In these circumstances, no revenue is recognized upon capital equipment shipment and we recognize revenue upon the disposable product shipment. The cost of the equipment is amortized over the term of individual commitment agreements.
• Product returns are only accepted at the discretion of the Company and in accordance with our “Returned Goods Policy.” Historically the level of product returns has not been significant. We accrue for sales returns, rebates and allowances based upon an analysis of historical customer returns and credits, rebates, discounts and current market conditions.
• Our terms of sale to customers generally do not include any obligations to perform future services. Limited warranties are provided for capital equipment sales and provisions for warranty are provided at the time of product sale based upon an analysis of historical data.
• Amounts billed to customers related to shipping and handling have been included in net sales. Shipping and handling costs included in selling and administrative expense were $9.3 million, $11.2 million and $14.3 million for 2004, 2005 and 2006, respectively.
• We sell to a diversified base of customers around the world and, therefore, believe there is no material concentration of credit risk.
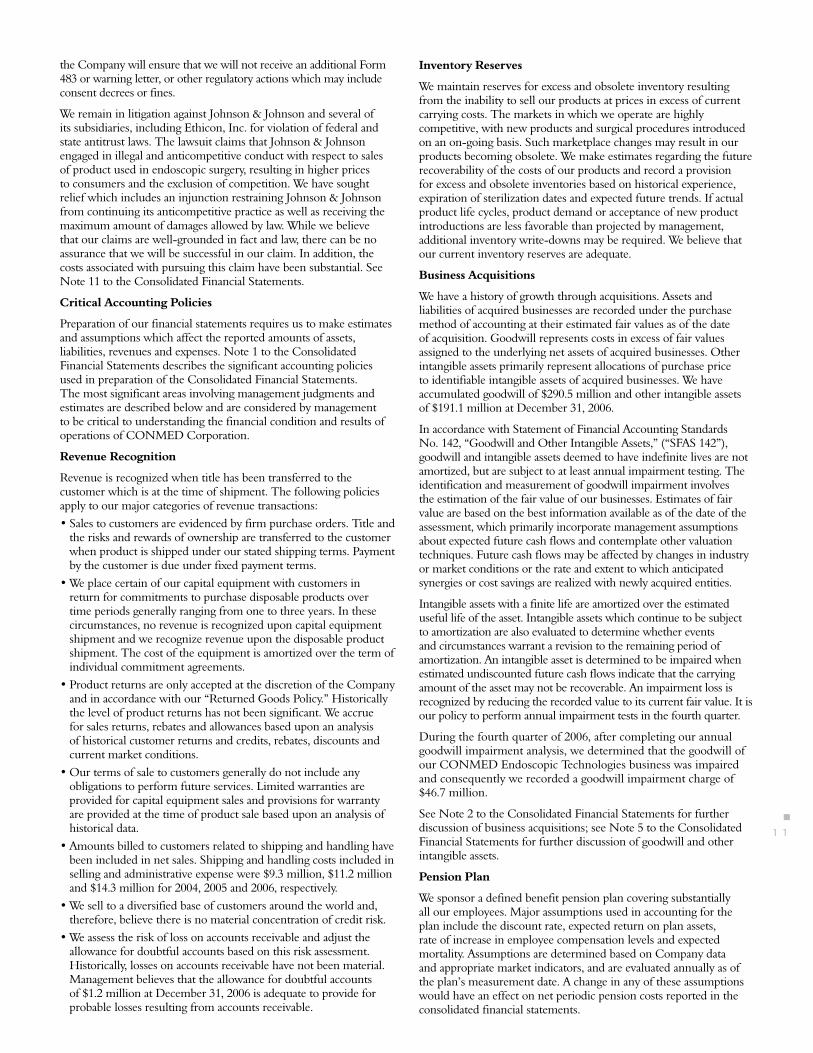
• We assess the risk of loss on accounts receivable and adjust the allowance for doubtful accounts based on this risk assessment. Historically, losses on accounts receivable have not been material. Management believes that the allowance for doubtful accounts of $1.2 million at December 31, 2006 is adequate to provide for probable losses resulting from accounts receivable.
Inventory Reserves
We maintain reserves for excess and obsolete inventory resulting from the inability to sell our products at prices in excess of current carrying costs. The markets in which we operate are highly competitive, with new products and surgical procedures introduced on an on-going basis. Such marketplace changes may result in our products becoming obsolete. We make estimates regarding the future recoverability of the costs of our products and record a provision for excess and obsolete inventories based on historical experience, expiration of sterilization dates and expected future trends. If actual product life cycles, product demand or acceptance of new product introductions are less favorable than projected by management, additional inventory write-downs may be required. We believe that our current inventory reserves are adequate.
Business Acquisitions
We have a history of growth through acquisitions. Assets and liabilities of acquired businesses are recorded under the purchase method of accounting at their estimated fair values as of the date of acquisition. Goodwill represents costs in excess of fair values assigned to the underlying net assets of acquired businesses. Other intangible assets primarily represent allocations of purchase price to identifiable intangible assets of acquired businesses. We have accumulated goodwill of $290.5 million and other intangible assets of $191.1 million at December 31, 2006.
In accordance with Statement of Financial Accounting Standards No. 142, “Goodwill and Other Intangible Assets,” (“SFAS 142”), goodwill and intangible assets deemed to have indefinite lives are not amortized, but are subject to at least annual impairment testing. The identification and measurement of goodwill impairment involves the estimation of the fair value of our businesses. Estimates of fair value are based on the best information available as of the date of the assessment, which primarily incorporate management assumptions about expected future cash flows and contemplate other valuation techniques. Future cash flows may be affected by changes in industry or market conditions or the rate and extent to which anticipated synergies or cost savings are realized with newly acquired entities.
Intangible assets with a finite life are amortized over the estimated useful life of the asset. Intangible assets which continue to be subject to amortization are also evaluated to determine whether events and circumstances warrant a revision to the remaining period of amortization. An intangible asset is determined to be impaired when estimated undiscounted future cash flows indicate that the carrying amount of the asset may not be recoverable. An impairment loss is recognized by reducing the recorded value to its current fair value. It is our policy to perform annual impairment tests in the fourth quarter.
During the fourth quarter of 2006, after completing our annual goodwill impairment analysis, we determined that the goodwill of our CONMED Endoscopic Technologies business was impaired and consequently we recorded a goodwill impairment charge of $46.7 million.
See Note 2 to the Consolidated Financial Statements for further discussion of business acquisitions; see Note 5 to the Consolidated Financial Statements for further discussion of goodwill and other intangible assets.
Pension Plan
We sponsor a defined benefit pension plan covering substantially all our employees. Major assumptions used in accounting for the plan include the discount rate, expected return on plan assets, rate of increase in employee compensation levels and expected mortality. Assumptions are determined based on Company data and appropriate market indicators, and are evaluated annually as of the plan’s measurement date. A change in any of these assumptions would have an effect on net periodic pension costs reported in the consolidated financial statements.
n
n n n n n n
12
Higher market interest rates have resulted in us increasing the discount rate used in determining pension expense from 5.55% in 2006 to 5.90% in 2007. This change in assumption will result in lower pension expense during 2007. This rate was determined by using the Citigroup Pension Liability Index rate which, we believe, is a reasonable indicator of our plan’s future payment stream.
We have used an expected rate of return on pension plan assets of 8.0% for purposes of determining the net periodic pension benefit cost. In determining the expected return on pension plan assets, we consider the relative weighting of plan assets, the historical performance of total plan assets and individual asset classes and economic and other indicators of future performance. In addition, we consult with financial and investment management professionals in developing appropriate targeted rates of return.
We have estimated our rate of increase in employee compensation levels at 3.0% consistent with our internal budgeting.
As of December 31, 2004, we changed from the 1984 Unisex Pension mortality table to the 1994 Group Annuity Reserving mortality table for purposes of determining expected mortality. This change in assumption resulted in higher pension expense in 2005.
Based on these and other factors, 2007 pension expense is estimated at approximately $6.2 million compared to $6.9 million in 2006. Actual expense may vary significantly from this estimate.
We expect to contribute approximately $12.0 million to our pension plan in 2007.
During the year ended December 31, 2006, we adopted Statement of Financial Accounting Standards No. 158, “Employers’ Accounting for Defined Benefit Pension and Other Postretirement Plans – an amendment of FASB Statements No. 87, 88, 106, and 132(R)” (“SFAS 158”) which requires balance sheet recognition of the overfunded or underfunded status of pension and postretirement benefit plans. The effects of adopting SFAS 158 were an increase in total liabilities of approximately $8.5 million and a reduction to total shareholders’ equity of approximately $5.3 million.
See Note 10 to the Consolidated Financial Statements for further discussion.
Stock-Based Compensation
We adopted Statement of Financial Accounting Standards No. 123 (revised 2004), “Share-Based Payment” (“SFAS 123R”) effective January 1, 2006. SFAS 123R requires that all share-based payments to employees, including grants of employee stock options, restricted stock units and stock appreciation rights, be recognized in the financial statements based on their fair values. Prior to January 1, 2006, we accounted for stock-based compensation in accordance with Accounting Principles Board Opinion No. 25 “Accounting for Stock Issued to Employees” (“APB 25”). No compensation expense was recognized for stock options under the provisions of APB 25 since all options granted had an exercise price equal to the market value of the underlying stock on the grant date.
SFAS 123R was adopted using the modified prospective transition method. Under this method, the provisions of SFAS 123R apply to all awards granted or modified after the date of adoption. In addition, compensation expense must be recognized for any nonvested stock option awards outstanding as of the date of adoption. We recognize such expense using a straight-line method over the vesting period. Prior periods have not been restated.
We elected to adopt the alternative transition method, as permitted by FASB Staff Position No. FAS 123R-3 “Transition Election Related to Accounting for Tax Effects of Share-Based Payment Awards,” to calculate the tax effects of stock-based compensation pursuant to SFAS 123R for those employee awards that were outstanding upon adoption of SFAS 123R. The alternative transition method allows the
use of a simplified method to calculate the beginning pool of excess tax benefits available to absorb tax deficiencies recognized subsequent to the adoption of SFAS 123R.
See Note 8 to the Consolidated Financial Statements for further discussion.
Income Taxes
The recorded future tax benefit arising from net deductible temporary differences and tax carryforwards is approximately $35.0 million at December 31, 2006. Management believes that our earnings during the periods when the temporary differences become deductible will be sufficient to realize the related future income tax benefits.
We operate in multiple taxing jurisdictions, both within and outside the United States. We face audits from these various tax authorities regarding the amount of taxes due. Such audits can involve complex issues and may require an extended period of time to resolve. Our United States federal income tax returns examination by the Internal Revenue Service (“IRS”) for calendar years 2001 through 2004 was settled during 2006. As a result of the settlement of the income tax examinations, we adjusted our reserves to consider positions taken in our income tax return for periods subsequent to 2004. The net effect of these adjustments and the settlement was a $1.5 million reduction in income tax expense in 2006.
During the third quarter of 2006, we filed our United States federal income tax return for 2005. As a result of the filing, we identified a greater benefit than was originally anticipated associated with the extraterritorial income exclusion rules and research and development tax credit. The net effect of these adjustments was a $0.7 million reduction in income tax expense in 2006.
We have established a valuation allowance to reflect the uncertainty of realizing the benefits of certain net operating loss carryforwards recognized in connection with an acquisition. Any subsequently recognized tax benefits associated with the valuation allowance would be allocated to reduce goodwill. In assessing the need for a valuation allowance, we estimate future taxable income, considering the feasibility of ongoing tax planning strategies and the realizability of tax loss carryforwards. Valuation allowances related to deferred tax assets may be impacted by changes to tax laws, changes to statutory tax rates and future taxable income levels.
See Note 7 to the Consolidated Financial Statements for further discussion.
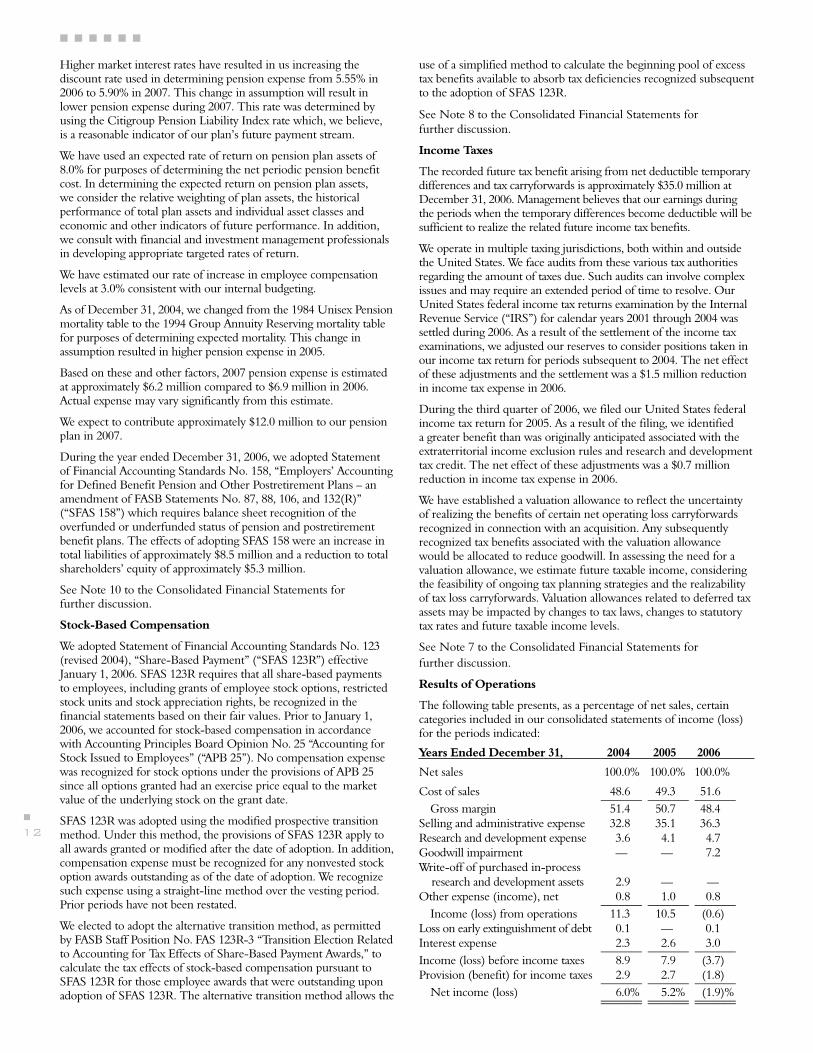
Results of Operations
The following table presents, as a percentage of net sales, certain categories included in our consolidated statements of income (loss) for the periods indicated:
Years Ended December 31, 2004 2005 2006
Net sales 100.0% 100.0% 100.0%
Cost of sales 48.6 49.3 51.6 _______ _______ _______ Gross margin 51.4 50.7 48.4Selling and administrative expense 32.8 35.1 36.3Research and development expense 3.6 4.1 4.7Goodwill impairment — — 7.2Write-off of purchased in-process research and development assets 2.9 — —Other expense (income), net 0.8 1.0 0.8 _______ _______ _______ Income (loss) from operations 11.3 10.5 (0.6)Loss on early extinguishment of debt 0.1 — 0.1Interest expense 2.3 2.6 3.0 _______ _______ _______Income (loss) before income taxes 8.9 7.9 (3.7 )Provision (benefit) for income taxes 2.9 2.7 (1.8 ) _______ _______ _______ Net income (loss) 6.0% 5.2% (1.9 )% _______ _______ _______ _______ _______ _______
n
13
2006 Compared to 2005
Sales for 2006 were $646.8 million, an increase of $29.5 million (4.8%) compared to sales of $617.3 million in 2005 with the increase occurring in all product lines except Endoscopic Technologies. Favorable foreign currency exchange rates in 2006 compared to 2005 accounted for $4.5 million of the increase.
Cost of sales increased to $334.0 million in 2006 compared to $304.3 million in 2005, primarily as a result of the increased sales volumes discussed above. Gross profit margins decreased 2.3 percentage points from 50.7% in 2005 to 48.4% in 2006. The total decrease of 2.3 percentage points is comprised of 1.2 percentage points attributable to decreased gross margins in our Endoscopic Technologies business, 0.7 percentage points attributable to decreased gross margins in our Patient Care business with the remaining 0.4 percentage point decrease attributable to decreased gross margins in our Endosurgery business. The Endoscopic Technologies business was acquired as a result of the Endoscopic Technologies acquisition and involved the transfer of substantially all of the Endoscopic Technologies production lines from C.R. Bard facilities to CONMED facilities. This transfer has proven to be more time-consuming, costly and complex than was originally anticipated. In addition, production and operational issues at an assembly operation in Mexico under contract to CONMED have resulted in product shortages and backorders. These operational issues, in combination with increased competition and pricing pressures in the marketplace have resulted in decreased sales and gross margins. The decreases in gross margin percentage attributable to Patient Care and Endosurgery are primarily a result of significant cost increases experienced in the second half of 2005 and in 2006 with respect to certain commodity and petroleum-based raw materials such as plastic resins and polymers used in the production of many of our products as well as higher spending related to quality assurance.
Selling and administrative expense increased to $234.8 million in 2006 compared to $216.7 million in 2005. Selling and administrative expense as a percentage of net sales increased to 36.3% in 2006 from 35.1% in 2005. This increase of 1.2 percentage points is primarily attributable to expensing stock options and other share-based payments in 2006 (0.6 percentage points) due to the adoption of SFAS 123R (see Note 8 to the Consolidated Financial Statements); increased administrative expenses associated with higher distribution costs (0.2 percentage points) due in part to higher petroleum prices; higher pension costs (0.2 percentage points) due primarily as a result of a decrease in the pension discount rate (see “Pension Plan” section of “Critical Accounting Estimates” above); increased spending on corporate quality systems and management (0.1 percentage points) to continue to maintain appropriate regulatory compliance; and other increases in selling and administrative costs (0.1 percentage points).
Research and development expense was $30.7 million in 2006 compared to $25.5 million in 2005. As a percentage of net sales, research and development expense increased to 4.7% in 2006 from 4.1% in 2005. The increase of 0.6 percentage points reflects an increased emphasis on new product development across all of our product lines with the most significant increases occurring in the areas of arthroscopy and powered instruments (0.3 percentage points).
As discussed above, the transfer of the Endoscopic Technologies production lines from C.R. Bard facilities to CONMED facilities has proven to be more time-consuming, costly and complex than was originally anticipated. In addition, production and operational issues at an assembly operation in Mexico under contract to CONMED have resulted in product shortages and backorders. These operational issues, in combination with increased competition and pricing pressures in the marketplace have resulted in decreased sales and gross margins and operating losses. As a result of these factors, during our fourth quarter 2006 goodwill impairment testing, we determined that the goodwill of our Endoscopic Technologies business was impaired and consequently we recorded an impairment
charge of $46.7 million to reduce the carrying amount of this business to its fair value. We estimated the fair value of the Endoscopic Technologies business using a discounted cash flow valuation methodology and measured the goodwill impairment in accordance with SFAS 142.
As discussed in Note 12 to the Consolidated Financial Statements, other expense in 2006 consisted of the following: $0.6 million in costs related to the closing of a manufacturing plant; $0.6 million in costs related to the write-off of inventory in settlement of a patent dispute; a $1.4 million charge related to the termination of our surgical lights product offering; and $2.6 million in Endoscopic Technologies acquisition and transition-integration related charges. Other expense in 2005 consisted of $1.5 million of expenses associated with the termination of our surgical lights product offering; $4.1 million in Endoscopic Technologies acquisition and transition-integration related charges; $0.7 million in environmental settlement costs; and $0.8 million of expense related to the loss on an equity investment.
During 2006, we recorded $0.7 million in losses on the early extinguishment of debt in connection with the refinancing of our senior credit agreement. See additional discussion under Management’s Discussion and Analysis of Financial Condition and Results of Operations—Liquidity and Capital Resources and Note 6 to the Consolidated Financial Statements.
Interest expense in 2006 was $19.1 million compared to $15.6 million in 2005. The increase in interest expense is primarily a result of higher weighted average borrowings outstanding in 2006 as compared to 2005 and higher weighted average interest rates on our borrowings (5.53% in 2006 as compared to 4.69% in 2005) inclusive of the finance charge on our accounts receivable sale facility. The increase in weighted average interest rates on our borrowings is primarily a result of market increases in interest rates on our variable rate debt.
A provision for income taxes was recorded at an effective rate of (48.7)% in 2006 and 33.6% in 2005. The effective rate for 2006 was lower than 2005. As a result of the settlement of our 2001 through 2004 income taxes as a result of IRS examinations, we adjusted our reserves to consider positions taken in our income tax returns for periods subsequent to 2004. The settlement and adjustment to our reserves resulted in a $1.5 million reduction in income tax expense in 2006. During the third quarter of 2006, we filed our United States federal income tax return for 2005. As a result of the filing, we identified a greater benefit than was originally anticipated associated with the extraterritorial income exclusion rules and research and development tax credit resulting in a $0.7 million reduction in income tax expense. The net effect of these adjustments was a $2.2 million reduction in income tax expense in 2006 as compared to the same period a year ago. A reconciliation of the United States statutory income tax rate to our effective tax rate is included in Note 7 to the Consolidated Financial Statements.
2005 Compared to 2004
Sales for 2005 were $617.3 million, an increase of $58.9 million (10.5%) compared to sales of $558.4 million in 2004 with the increase occurring in all product lines except Patient Care. The Endoscopic Technologies acquisition accounted for $43.2 million of the increase and favorable foreign currency exchange rates in 2005 compared to 2004 accounted for $3.6 million. The Endoscopic Technologies acquisition is described more fully in Note 2 to the Consolidated Financial Statements.
Cost of sales increased to $304.3 million in 2005 compared to $271.5 million in 2004, primarily as a result of the increased sales volumes discussed above. Gross profit margins decreased 0.7 percentage points from 51.4% in 2004 to 50.7% in 2005 primarily as a result of significant cost increases with respect to certain commodity and petroleum-based raw materials such as plastic resins and polymers used in the production of many of our

n
n n n n n n
14
products and higher spending related to quality assurance. These higher costs (approximately 1.2 percentage points) more than offset the improvement in margins we experienced as a result of the addition of the higher margin products acquired in the Endoscopic Technologies acquisition (0.5 percentage points).
Selling and administrative expense increased to $216.7 million in 2005 as compared to $183.2 million in 2004. Selling and administrative expense as a percentage of net sales increased to 35.1% in 2005 from 32.8% in 2004. This increase of 2.3 percentage points is primarily attributable to increased administrative expenses associated with higher distribution costs (0.4 percentage points) due in part to higher petroleum prices; higher pension costs (0.2 percentage points) due primarily as a result of changes in actuarial assumptions (see “Pension Plan” section of “Critical Accounting Estimates” above); increased spending on corporate quality systems and management (0.2 percentage points) to ensure we continue to maintain appropriate regulatory compliance; increased selling and marketing costs associated with the Endoscopic Technologies business (0.3 percentage points); other increases in selling and administrative costs (1.2 percentage points) including the Johnson & Johnson litigation. See Note 11 to the Consolidated Financial Statements.
Research and development expense was $25.5 million in 2005 compared to $20.2 million in 2004. As a percentage of net sales, research and development expense increased to 4.1% in 2005 from 3.6% in 2004. The increase of 0.5 percentage points in research and development expense as a percentage of sales is principally a result of increased spending on the development of our PRO2
® reflectance pulse oximetry system and ECOM endotracheal cardiac output monitor for our Patient Care business (0.2 percentage points) and the addition of the Endoscopic Technologies business in September 2004 (0.3 percentage points).
As discussed in Note 2 to the Consolidated Financial Statements, we wrote-off $16.4 million of purchased in-process research and development assets associated with the Endoscopic Technologies acquisition in 2004.
As discussed in Note 12 to the Consolidated Financial Statements, other expense in 2005 consisted of the following: $1.5 million of expenses associated with the termination of our surgical lights product offering; $4.1 million of Endoscopic Technologies acquisition and transition-integration related charges; $0.7 million in environmental settlement costs; and $0.8 million of expense related to the loss on an equity investment. Other expense in 2004 consisted primarily of $2.4 million of expenses associated with the termination of our surgical lights product offering and $1.5 million of Endoscopic Technologies acquisition and transition-integration related charges.
During 2004, we recorded $0.8 million in losses on the early extinguishment of debt related to the refinancing of a portion of the term loans under our senior credit agreement through the issuance of 2.50% convertible senior subordinated notes. See additional discussion under Management’s Discussion and Analysis of Financial Condition and Results of Operations—Liquidity and Capital Resources and Note 6 to the Consolidated Financial Statements.
Interest expense in 2005 was $15.6 million compared to $12.8 million in 2004. The increase in interest expense is primarily a result of higher weighted average borrowings outstanding in 2005 as compared to 2004 and higher weighted average interest rates on our borrowings (4.69% in 2005 as compared to 4.17% in 2004) inclusive of the finance charge on our accounts receivable sale facility. The increase in weighted average interest rates on our borrowing is primarily a result of our increased borrowings against our revolving credit facility coupled with market increases in interest rates on our variable rate debt.
A provision for income taxes was recorded at an effective rate of 33.6% in 2005 and 32.5% in 2004. The effective rate for 2005 was higher than 2004 because the 2004 effective tax rate reflected an adjustment to the estimated benefit to be realized from the extraterritorial income exclusion tax rules on foreign sales. A reconciliation of the United States statutory income tax rate to our effective tax rate is included in Note 7 to the Consolidated Financial Statements.
Operating Segment Results
Segment information is prepared on the same basis that we review financial information for operational decision-making purposes. We conduct our business through five principal operating units: CONMED Endoscopic Technologies, CONMED Endosurgery, CONMED Electrosurgery, CONMED Linvatec and CONMED Patient Care. Based upon the aggregation criteria for segment reporting under Statement of Financial Accounting Standards No. 131 “Disclosures about Segments of an Enterprise and Related Information” (“SFAS 131”), we have grouped our CONMED Endosurgery, CONMED Electrosurgery and CONMED Linvatec operating units into a single segment. The economic characteristics of CONMED Patient Care and CONMED Endoscopic Technologies do not meet the criteria for aggregation due to the lower overall operating income (loss) of these segments.
The following tables summarize the Company’s results of operations by segment for 2004, 2005 and 2006:
CONMED Endosurgery, CONMED Electrosurgery and CONMED Linvatec 2004 2005 2006 ________ _________ ________Net sales $ 466,771 $ 482,591 $ 515,937Income from operations 77,538 69,295 70,193Operating margin 16.6% 14.4% 13.6%
Product offerings include a complete line of endo-mechanical instrumentation for minimally invasive laparoscopic procedures, electrosurgical generators and related surgical instruments, arthroscopic instrumentation for use in orthopedic surgery and small bone, large bone and specialty powered surgical instruments.• Arthroscopy sales increased $16.8 million (7.9%) in 2006 to
$228.2 million from $211.4 million in 2005, on increased sales of our resection and video imaging products for arthroscopy and general surgery, and our integrated operating room systems and equipment; Arthroscopy sales increased $6.5 million (3.2%) in 2005 to $211.4 million from $204.9 million in 2004, on increased sales of our procedure specific, resection and video imaging products for arthroscopy and general surgery, and our integrated operating room systems and equipment.
• Powered Surgical Instrument sales increased $5.1 million (3.9%) in 2006 to $137.2 million from $132.0 million in 2005, on increased sales of small bone and large bone powered instrument products offset by slight decreases in our specialty powered instrument products; Powered Surgical Instrument sales increased $3.4 million (2.7%) in 2005 to $132.0 million from $128.6 million in 2004, on increased sales of our PowerPro® line of large bone powered instrument products and our PowerProMax™ line of small bone powered instrument products.
• Electrosurgery sales increased $9.3 million (10.6%) in 2006 to $97.8 million from $88.5 million in 2005, on increased sales of our System 5000™ electrosurgical generator, ABC® and UltraClean™ disposable surgical products; Electrosurgery sales increased $2.6 million (3.0%) in 2005 to $88.5 million from $85.9 million in 2004, on increased sales of the System 5000™ and Ultraclean™.
• Endosurgery sales increased $2.1 million (4.1%) in 2006 to $52.8 million from $50.7 million in 2005, as a result of increased sales of our hand held instruments, skin staplers, suction/irrigation products and various laparoscopic instrument products and
n
15
systems; Endosurgery sales increased $3.2 million (6.9%) in 2005 to $50.7 million from $47.4 million in 2004, on increased sales of our skin staplers, suction/irrigation products and various laparoscopic instrument products and systems.
• Operating margins as a percentage of net sales decreased 0.8 percentage points to 13.6% in 2006 compared to 14.4% in 2005 largely as a result of increased research and development spending (0.6 percentage points) in the CONMED Linvatec product lines. The remaining 0.2 percentage point decline in operating margin is due to decreased gross margins in the CONMED Endosurgery product lines as a result of significant cost increases experienced in the second half of 2005 and in 2006 with respect to certain commodity and petroleum-based raw materials such as plastic resins and polymers used in the production of the Endosurgery product lines as well as higher spending related to quality assurance.
• Operating margins decreased 2.2 percentage points to 14.4% in 2005 compared to 16.6% in 2004 due to increased selling and administrative expense comprised of higher distribution costs (0.4 percentage points), higher pension expense (0.2 percentage points) and other increases (0.6 percentage points); and decreased gross margin percentage (1.0 percentage points) in the CONMED Linvatec product lines as a result of higher than planned production variances.
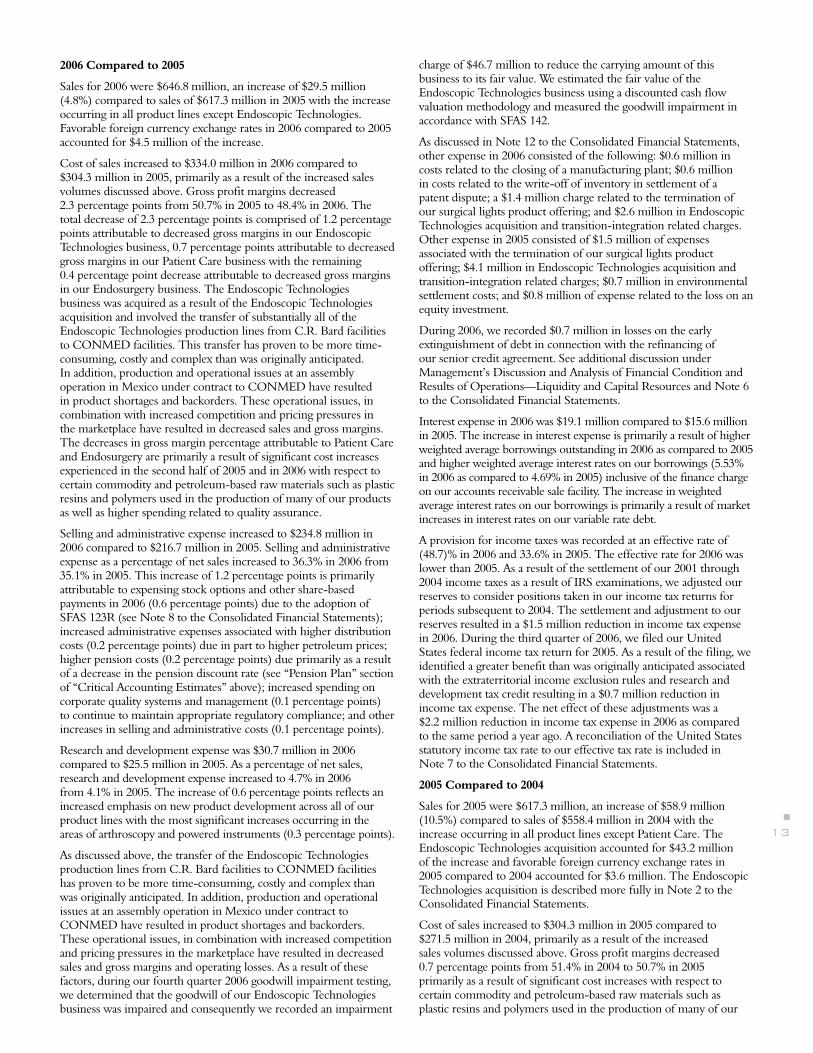
CONMED Patient Care 2004 2005 2006 ________ _________ ________Net sales $ 75,879 $ 75,879 $ 75,883Income (loss) from operations 7,314 5,734 (759 )Operating margin 9.6% 7.6% (1.0% )
Product offerings include a line of vital signs and cardiac monitoring products including pulse oximetry equipment and sensors, ECG electrodes and cables, cardiac defibrillation and pacing pads and blood pressure cuffs. We also offer a complete line of reusable surgical patient positioners and suction instruments and tubing for use in the operating room, as well as a line of IV products and hydrogel-based wound care dressings.• Patient Care net sales and the net sales of its principal ECG and
suction instruments product lines remained flat in 2006 when compared to 2005 and 2004 while increased sales of defibrillator pads and blood pressure cuffs have offset decreases in other patient care products during the same periods.
• Operating margins as a percentage of net sales decreased 8.6 percentage points to (1.0%) in 2006 compared to 7.6% in 2005 primarily as a result of decreased gross margins. Gross margins declined 6.1 percentage points in 2006 as compared to 2005 as a result of significant cost increases experienced in the second half of 2005 and in 2006 with respect to certain commodity and petroleum-based raw materials such as plastic resins and polymers as well as higher spending related to quality assurance. In addition, as a percentage of net sales, research and development expense increased 0.9 percentage points in 2006 compared to 2005 as a result of increased spending on the development of our PRO2
® reflectance pulse oximetry system and ECOM endotracheal cardiac output monitor. Selling and administrative expenses increased 1.6 percentage points in 2006 compared to 2005 as a result of higher distribution costs (0.5 percentage points), a charge to write-off inventory in settlement of a patent dispute (0.8 percentage points) and other increases (0.3 percentage points).
• Operating margins decreased 2.0 percentage points to 7.6% in 2005 compared to 2004 primarily as a result of decreased gross margins (1.7 percentage points) as discussed above. The remaining decrease in operating margin in 2005 compared to 2004 (0.3 percentage points) is a result of increased spending on the PRO2
® and ECOM projects.
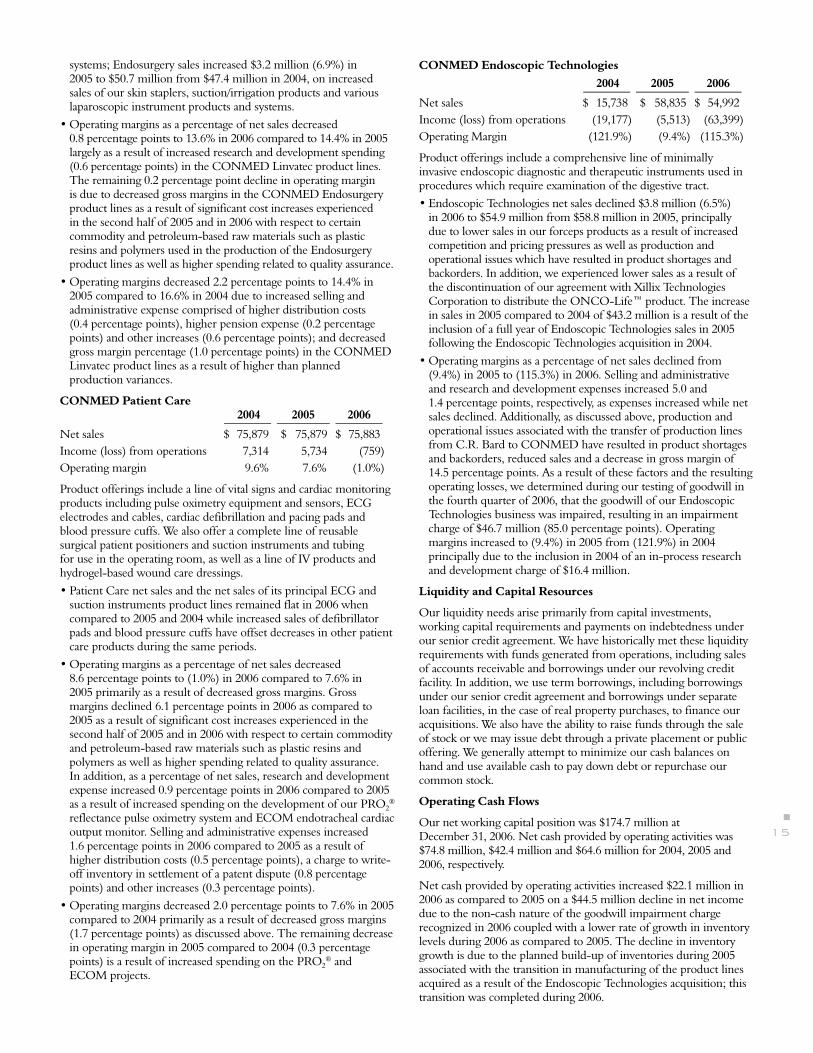
CONMED Endoscopic Technologies 2004 2005 2006 ________ _________ ________Net sales $ 15,738 $ 58,835 $ 54,992Income (loss) from operations (19,177 ) (5,513 ) (63,399 )Operating Margin (121.9% ) (9.4% ) (115.3% )
Product offerings include a comprehensive line of minimally invasive endoscopic diagnostic and therapeutic instruments used in procedures which require examination of the digestive tract.• Endoscopic Technologies net sales declined $3.8 million (6.5%)
in 2006 to $54.9 million from $58.8 million in 2005, principally due to lower sales in our forceps products as a result of increased competition and pricing pressures as well as production and operational issues which have resulted in product shortages and backorders. In addition, we experienced lower sales as a result of the discontinuation of our agreement with Xillix Technologies Corporation to distribute the ONCO-Life™ product. The increase in sales in 2005 compared to 2004 of $43.2 million is a result of the inclusion of a full year of Endoscopic Technologies sales in 2005 following the Endoscopic Technologies acquisition in 2004.
• Operating margins as a percentage of net sales declined from (9.4%) in 2005 to (115.3%) in 2006. Selling and administrative and research and development expenses increased 5.0 and 1.4 percentage points, respectively, as expenses increased while net sales declined. Additionally, as discussed above, production and operational issues associated with the transfer of production lines from C.R. Bard to CONMED have resulted in product shortages and backorders, reduced sales and a decrease in gross margin of 14.5 percentage points. As a result of these factors and the resulting operating losses, we determined during our testing of goodwill in the fourth quarter of 2006, that the goodwill of our Endoscopic Technologies business was impaired, resulting in an impairment charge of $46.7 million (85.0 percentage points). Operating margins increased to (9.4%) in 2005 from (121.9%) in 2004 principally due to the inclusion in 2004 of an in-process research and development charge of $16.4 million.
Liquidity and Capital Resources
Our liquidity needs arise primarily from capital investments, working capital requirements and payments on indebtedness under our senior credit agreement. We have historically met these liquidity requirements with funds generated from operations, including sales of accounts receivable and borrowings under our revolving credit facility. In addition, we use term borrowings, including borrowings under our senior credit agreement and borrowings under separate loan facilities, in the case of real property purchases, to finance our acquisitions. We also have the ability to raise funds through the sale of stock or we may issue debt through a private placement or public offering. We generally attempt to minimize our cash balances on hand and use available cash to pay down debt or repurchase our common stock.
Operating Cash Flows
Our net working capital position was $174.7 million at December 31, 2006. Net cash provided by operating activities was $74.8 million, $42.4 million and $64.6 million for 2004, 2005 and 2006, respectively.
Net cash provided by operating activities increased $22.1 million in 2006 as compared to 2005 on a $44.5 million decline in net income due to the non-cash nature of the goodwill impairment charge recognized in 2006 coupled with a lower rate of growth in inventory levels during 2006 as compared to 2005. The decline in inventory growth is due to the planned build-up of inventories during 2005 associated with the transition in manufacturing of the product lines acquired as a result of the Endoscopic Technologies acquisition; this transition was completed during 2006.
n
n n n n n n
16
Investing Cash Flows
Capital expenditures were $12.4 million, $16.2 million and $21.9 million for 2004, 2005 and 2006, respectively. The continued increase in capital expenditures in 2006 as compared to 2005 and 2004 is primarily due to ongoing expansion of our manufacturing and distribution capacity as a result of the Endoscopic Technologies acquisition and other infrastructure and technology upgrades including the ongoing implementation of an enterprise business software application. Capital expenditures are expected to approximate $15.0 million in 2007.
The sale of an equity investment resulted in proceeds of $1.2 million in 2006. The purchase of a distributor’s business resulted in a $2.5 million payment in 2006. Payments related to business acquisitions in 2005 totaled $0.4 million and are additional cash consideration paid for a business acquisition as a result of a purchase price adjustment. Investing cash flows in 2004 consisted primarily of $81.3 million in payments related to the Endoscopic Technologies acquisition.
Financing Cash Flows
Net cash provided by (used in) financing activities during 2006 consisted of the following: $2.7 million in proceeds from the issuance of common stock under our stock option plans and employee stock purchase plan (see Note 8 to the Consolidated Financial Statements); $7.8 million used to repurchase our common stock under our Board of Directors approved stock repurchase program described below; $130.2 million in repayments of term borrowings under our senior credit agreement; $43.0 million in repayments under the revolving credit facility of our senior credit agreement and $1.3 million in payments related to the issuance of long-term debt. These payments were offset by a $1.2 million net change in cash overdrafts and proceeds of $135.0 million from the term loan portion of our amended and restated senior credit agreement as described below.
During 2006, we entered into an amended and restated $235.0 million senior credit agreement (the “amended and restated senior credit agreement”). The amended and restated senior credit agreement consists of a $100.0 million revolving credit facility and a $135.0 million term loan. There were no borrowings outstanding on the revolving credit facility as of December 31, 2006. Our available borrowings on the revolving credit facility at December 31, 2006 were $93.0 million with approximately $7.0 million of the facility set aside for outstanding letters of credit. There were $103.0 million in borrowings outstanding on the term loan at December 31, 2006. The proceeds of the term loan portion of the amended and restated senior credit agreement were used to repay borrowings outstanding on the term loan and revolving credit facility of $142.5 million under the previously existing senior credit agreement. In connection with the refinancing, we recorded a $0.7 million loss on early extinguishment of debt of which $0.2 million related to the write-off of unamortized deferred financing costs under the previously existing senior credit agreement and $0.5 million related to financing costs associated with the amended and restated senior credit agreement.
The scheduled principal payments on the term loan portion of the amended and restated senior credit agreement are $1.4 million annually through December 2011, increasing to $95.5 million in 2012 with the remaining balance outstanding due and payable on April 12, 2013. We may also be required, under certain circumstances, to make additional principal payments based on excess cash flow as defined in the senior credit agreement. Interest rates on the term loan portion of the senior credit agreement are at LIBOR plus 2.00% (7.35% at December 31, 2006) or an alternative base rate; interest rates on the revolving credit facility portion of the senior credit agreement are at LIBOR plus 2.00% or an alternative base rate. For those borrowings where the Company elects to use the alternative base rate, the base rate will be the greater of the Prime Rate or the Federal Funds Rate in
effect on such date plus 0.50%, plus a margin of 0.75% for term loan borrowings or 0.50% for borrowings under the revolving credit facility.
The amended and restated senior credit agreement is collateralized by substantially all of our personal property and assets, except for our accounts receivable and related rights which are pledged in connection with our accounts receivable sales agreement. The senior credit agreement contains covenants and restrictions which, among other things, require the maintenance of certain financial ratios, and restrict dividend payments and the incurrence of certain indebtedness and other activities, including acquisitions and dispositions. We were in full compliance with these covenants and restrictions as of December 31, 2006. We are also required, under certain circumstances, to make mandatory prepayments from net cash proceeds from any issue of equity and asset sales.
Mortgage notes outstanding in connection with the property and facilities utilized by our CONMED Linvatec subsidiary consist of a note bearing interest at 7.50% per annum with semi-annual payments of principal and interest through June 2009 (the “Class A note”); and a note bearing interest at 8.25% per annum compounded semi-annually through June 2009, after which semi-annual payments of principal and interest will commence, continuing through June 2019 (the “Class C note”). The principal balances outstanding on the Class A note and Class C note aggregated $5.2 million and $9.6 million, respectively, at December 31, 2006. These mortgage notes are secured by the CONMED Linvatec property and facilities.
During 2004, we completed an offering of $150.0 million in 2.50% convertible senior subordinated notes (the “Notes”) due 2024. The Notes represent subordinated unsecured obligations and are convertible under certain circumstances, as defined in the bond indenture, into a combination of cash and CONMED common stock. Upon conversion, the holder of each Note will receive the conversion value of the Note payable in cash up to the principal amount of the Note and CONMED common stock for the Note’s conversion value in excess of such principal amount. Amounts in excess of the principal amount are at an initial conversion rate, subject to adjustment, of 26.1849 shares per $1,000 principal amount of the Note (which represents an initial conversion price of $38.19 per share). The Notes mature on November 15, 2024 and are not redeemable by us prior to November 15, 2011. Holders of the Notes will be able to require that we repurchase some or all of the Notes on November 15, 2011, 2014 and 2019.
The Notes contain two embedded derivatives. The embedded derivatives are recorded at fair value in other long-term liabilities and changes in their value are recorded through the consolidated statements of operations. The embedded derivatives have a nominal value, and it is our belief that any change in their fair value would not have a material adverse effect on our business, financial condition or results of operations.
Proceeds from the offering and cash on hand were used to repay $82.2 million on the term loan and a further $45.0 million in borrowings then outstanding on the revolving credit facility under our senior credit agreement. Additionally, in conjunction with the Notes offering, we repurchased $30.0 million of our common stock in privately negotiated transactions. As a result of the $82.2 million prepayment on the term loan, we recorded $0.8 million in losses on the early extinguishment of debt related to the write-off of unamortized deferred financing fees.
Our Board of Directors has authorized a share repurchase program under which we may repurchase up to $100.0 million of our common stock, although no more than $50.0 million may be purchased in any calendar year. The repurchase program calls for shares to be purchased in the open market or in private transactions from time to time. We may suspend or discontinue the share repurchase program at any time. During 2006, we repurchased $7.8 million in common stock in order to offset the dilutive effect
n
17
of the issuance of shares under our employee stock option and employee stock purchase plans. We have financed the repurchases and may finance additional repurchases through the proceeds from the issuance of common stock under our stock option plans, from operating cash flow and from available borrowings under our revolving credit facility.
Management believes that cash flow from operations, including accounts receivable sales, cash and cash equivalents on hand and available borrowing capacity under our senior credit agreement will be adequate to meet our anticipated operating working capital requirements, debt service, funding of capital expenditures and common stock repurchases in the foreseeable future. See Forward Looking Statements.
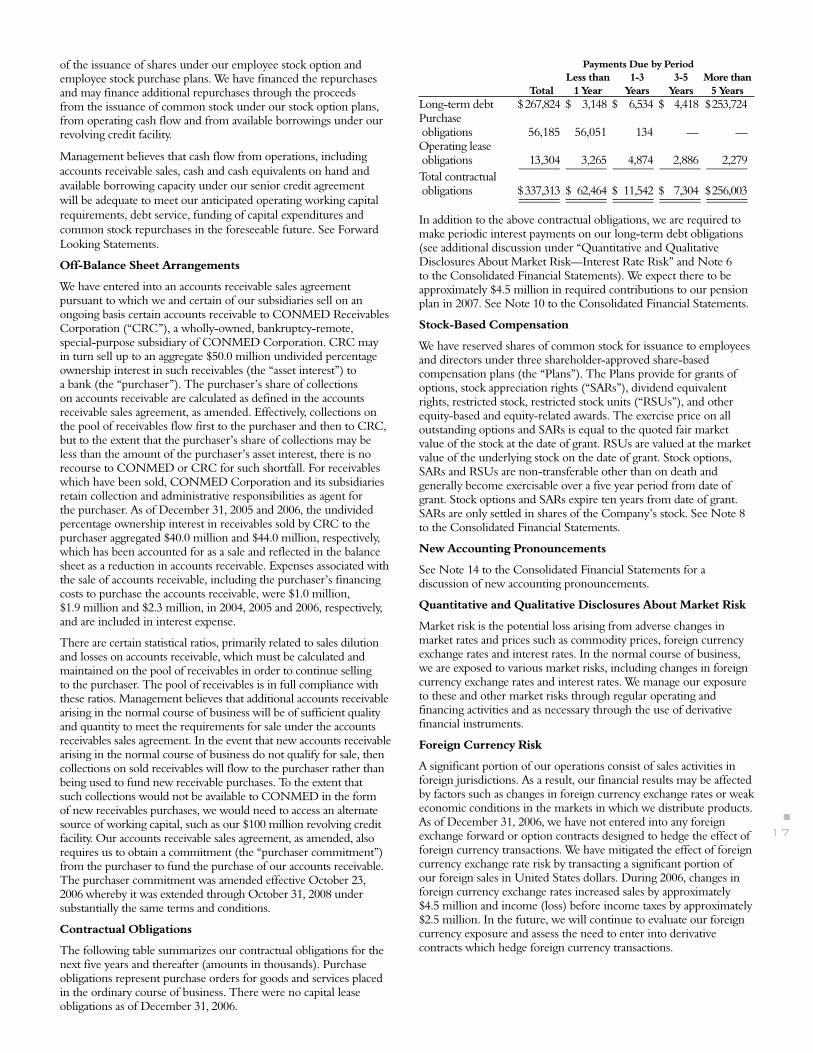
Off-Balance Sheet Arrangements
We have entered into an accounts receivable sales agreement pursuant to which we and certain of our subsidiaries sell on an ongoing basis certain accounts receivable to CONMED Receivables Corporation (“CRC”), a wholly-owned, bankruptcy-remote, special-purpose subsidiary of CONMED Corporation. CRC may in turn sell up to an aggregate $50.0 million undivided percentage ownership interest in such receivables (the “asset interest”) to a bank (the “purchaser”). The purchaser’s share of collections on accounts receivable are calculated as defined in the accounts receivable sales agreement, as amended. Effectively, collections on the pool of receivables flow first to the purchaser and then to CRC, but to the extent that the purchaser’s share of collections may be less than the amount of the purchaser’s asset interest, there is no recourse to CONMED or CRC for such shortfall. For receivables which have been sold, CONMED Corporation and its subsidiaries retain collection and administrative responsibilities as agent for the purchaser. As of December 31, 2005 and 2006, the undivided percentage ownership interest in receivables sold by CRC to the purchaser aggregated $40.0 million and $44.0 million, respectively, which has been accounted for as a sale and reflected in the balance sheet as a reduction in accounts receivable. Expenses associated with the sale of accounts receivable, including the purchaser’s financing costs to purchase the accounts receivable, were $1.0 million, $1.9 million and $2.3 million, in 2004, 2005 and 2006, respectively, and are included in interest expense.
There are certain statistical ratios, primarily related to sales dilution and losses on accounts receivable, which must be calculated and maintained on the pool of receivables in order to continue selling to the purchaser. The pool of receivables is in full compliance with these ratios. Management believes that additional accounts receivable arising in the normal course of business will be of sufficient quality and quantity to meet the requirements for sale under the accounts receivables sales agreement. In the event that new accounts receivable arising in the normal course of business do not qualify for sale, then collections on sold receivables will flow to the purchaser rather than being used to fund new receivable purchases. To the extent that such collections would not be available to CONMED in the form of new receivables purchases, we would need to access an alternate source of working capital, such as our $100 million revolving credit facility. Our accounts receivable sales agreement, as amended, also requires us to obtain a commitment (the “purchaser commitment”) from the purchaser to fund the purchase of our accounts receivable. The purchaser commitment was amended effective October 23, 2006 whereby it was extended through October 31, 2008 under substantially the same terms and conditions.
Contractual Obligations
The following table summarizes our contractual obligations for the next five years and thereafter (amounts in thousands). Purchase obligations represent purchase orders for goods and services placed in the ordinary course of business. There were no capital lease obligations as of December 31, 2006.
Payments Due by Period Less than 1-3 3-5 More than Total 1 Year Years Years 5 YearsLong-term debt $ 267,824 $ 3,148 $ 6,534 $ 4,418 $ 253,724Purchase obligations 56,185 56,051 134 — —Operating lease obligations 13,304 3,265 4,874 2,886 2,279 _______ _______ _______ _______ _______Total contractual obligations $ 337,313 $ 62,464 $ 11,542 $ 7,304 $ 256,003 _______ _______ _______ _______ _______ _______ _______ _______ _______ _______
In addition to the above contractual obligations, we are required to make periodic interest payments on our long-term debt obligations (see additional discussion under “Quantitative and Qualitative Disclosures About Market Risk—Interest Rate Risk” and Note 6 to the Consolidated Financial Statements). We expect there to be approximately $4.5 million in required contributions to our pension plan in 2007. See Note 10 to the Consolidated Financial Statements.
Stock-Based Compensation
We have reserved shares of common stock for issuance to employees and directors under three shareholder-approved share-based compensation plans (the “Plans”). The Plans provide for grants of options, stock appreciation rights (“SARs”), dividend equivalent rights, restricted stock, restricted stock units (“RSUs”), and other equity-based and equity-related awards. The exercise price on all outstanding options and SARs is equal to the quoted fair market value of the stock at the date of grant. RSUs are valued at the market value of the underlying stock on the date of grant. Stock options, SARs and RSUs are non-transferable other than on death and generally become exercisable over a five year period from date of grant. Stock options and SARs expire ten years from date of grant. SARs are only settled in shares of the Company’s stock. See Note 8 to the Consolidated Financial Statements.
New Accounting Pronouncements
See Note 14 to the Consolidated Financial Statements for a discussion of new accounting pronouncements.
Quantitative and Qualitative Disclosures About Market Risk
Market risk is the potential loss arising from adverse changes in market rates and prices such as commodity prices, foreign currency exchange rates and interest rates. In the normal course of business, we are exposed to various market risks, including changes in foreign currency exchange rates and interest rates. We manage our exposure to these and other market risks through regular operating and financing activities and as necessary through the use of derivative financial instruments.
Foreign Currency Risk
A significant portion of our operations consist of sales activities in foreign jurisdictions. As a result, our financial results may be affected by factors such as changes in foreign currency exchange rates or weak economic conditions in the markets in which we distribute products. As of December 31, 2006, we have not entered into any foreign exchange forward or option contracts designed to hedge the effect of foreign currency transactions. We have mitigated the effect of foreign currency exchange rate risk by transacting a significant portion of our foreign sales in United States dollars. During 2006, changes in foreign currency exchange rates increased sales by approximately $4.5 million and income (loss) before income taxes by approximately $2.5 million. In the future, we will continue to evaluate our foreign currency exposure and assess the need to enter into derivative contracts which hedge foreign currency transactions.
n
n n n n n n
18
Interest Rate Risk
At December 31, 2006, we had approximately $103.0 million of variable rate long-term debt under our senior credit agreement; we are not a party to any interest rate swap agreements as of December 31, 2006. Assuming no repayments other than our 2007 scheduled term loan payments, if market interest rates for similar borrowings average 1.0% more in 2007 than they did in 2006, interest expense would increase, and income (loss) before income taxes would decrease by $1.5 million. Comparatively, if market interest rates for similar borrowings average 1.0% less in 2007 than they did in 2006, our interest expense would decrease, and income (loss) before income taxes would increase by $1.5 million.
Forward-Looking Statements
This Annual Report contains certain forward-looking statements (as such term is defined in the Private Securities Litigation Reform Act of 1995) and information relating to CONMED Corporation which are based on the beliefs of our management, as well as assumptions made by and information currently available to our management.
When used in this Annual Report, the words “estimate,” “project,” “believe,” “anticipate,” “intend,” “expect” and similar expressions are intended to identify forward-looking statements. These statements involve known and unknown risks, uncertainties and other factors, which may cause our actual results, performance or achievements, or industry results, to be materially different from any future results, performance or achievements expressed or implied by such forward-looking statements. Such factors include, among others, the following: • general economic and business conditions; • cyclical customer purchasing patterns due to budgetary and other
constraints;• changes in customer preferences;• competition;• changes in technology;• the introduction and acceptance of new products;• the ability to evaluate, finance and integrate acquired businesses,
products and companies;• changes in business strategy;• the availability and cost of materials;• the possibility that United States or foreign regulatory and/or
administrative agencies may initiate enforcement actions against us or our distributors;
• future levels of indebtedness and capital spending;• changes in foreign exchange and interest rates;• quality of our management and business abilities and the judgment
of our personnel;• the availability, terms and deployment of capital; • the risk of litigation, especially patent litigation as well as the cost
associated with patent and other litigation; and• changes in regulatory requirements.
You are cautioned not to place undue reliance on these forward-looking statements, which speak only as of the date hereof. We do not undertake any obligation to publicly release any revisions to these forward-looking statements or to reflect the occurrence of unanticipated events.
n
19
The management of CONMED Corporation is responsible for establishing and maintaining adequate internal control over financial reporting. Internal control over financial reporting is a process designed to provide reasonable assurance regarding the reliability of financial reporting and the preparation of financial statements for external reporting purposes in accordance with generally accepted accounting principles. Our internal control over financial reporting includes policies and procedures that pertain to the maintenance of records that, in reasonable detail, accurately and fairly reflect transactions and dispositions of assets; provide reasonable assurances that transactions are recorded as necessary to permit preparation of financial statements in accordance with accounting principles generally accepted in the United States of America, and that receipts and expenditures are being made only in accordance with authorizations of management and the directors of the Company; and provide reasonable assurance regarding prevention or timely detection of unauthorized acquisition, use or disposition of our assets that could have a material effect on our financial statements. Because of its inherent limitations, internal control over financial reporting may not prevent or detect misstatements. Management assessed the effectiveness of CONMED’s internal control over financial reporting as of December 31, 2006. In making its assessment, management utilized the criteria set forth by the Committee of Sponsoring Organizations of the Treadway Commission (“COSO”) in Internal Control - Integrated Framework. Management has concluded that based on its assessment, CONMED’s internal control over financial reporting was effective as of December 31, 2006. Management’s assessment of the effectiveness of CONMED’s internal control over financial reporting as of December 31, 2006 has been audited by PricewaterhouseCoopers LLP, an independent registered public accounting firm, as stated in their report which appears on page 20.
Joseph J. Corasanti Robert D. Shallish, Jr.President and Vice President-Finance andChief Executive Officer Chief Financial Officer
management’S report on internal control over Financial reporting

n
n n n n n n
20
To the Board of Directors and Shareholders of CONMED Corporation:We have completed integrated audits of CONMED Corporation’s consolidated financial statements and of its internal control over financial reporting as of December 31, 2006, in accordance with the standards of the Public Company Accounting Oversight Board (United States). Our opinions, based on our audits, are presented below.
Consolidated financial statements and financial statement schedule
In our opinion, the consolidated financial statements listed in the index appearing under Item 15(a)(1) present fairly, in all material respects, the financial position of CONMED Corporation and its subsidiaries at December 31, 2006 and 2005, and the results of their operations and their cash flows for each of the three years in the period ended December 31, 2006 in conformity with accounting principles generally accepted in the United States of America. In addition, in our opinion, the financial statement schedule listed in the index appearing under Item 15(a)(2) presents fairly, in all material respects, the information set forth therein when read in conjunction with the related consolidated financial statements. These financial statements and financial statement schedule are the responsibility of the Company’s management. Our responsibility is to express an opinion on these financial statements and financial statement schedule based on our audits. We conducted our audits of these statements in accordance with the standards of the Public Company Accounting Oversight Board (United States). Those standards require that we plan and perform the audit to obtain reasonable assurance about whether the financial statements are free of material misstatement. An audit of financial statements includes examining, on a test basis, evidence supporting the amounts and disclosures in the financial statements, assessing the accounting principles used and significant estimates made by management, and evaluating the overall financial statement presentation. We believe that our audits provide a reasonable basis for our opinion.
As discussed in Note 8 to the consolidated financial statements, the Company changed the manner in which it accounts for share-based compensation in 2006. As discussed in Note 10 to the consolidated financial statements, the Company changed the manner in which it accounts for its defined benefit pension plan in 2006.
Internal control over financial reporting
Also, in our opinion, management’s assessment, included in “Management’s Report on Internal Control Over Financial Reporting” appearing on page 19, that the Company maintained effective internal control over financial reporting as of December 31, 2006 based on criteria established in Internal Control - Integrated Framework, issued by the Committee of Sponsoring Organizations of the Treadway Commission (COSO), is fairly stated, in all material respects, based on those criteria. Furthermore, in our opinion, the Company maintained, in all material respects, effective internal control over financial reporting as of December 31, 2006 based on criteria established in Internal Control - Integrated Framework, issued by the COSO. The Company’s management is responsible for maintaining effective internal control over financial reporting and for its assessment of the effectiveness of internal control over financial reporting. Our responsibility is to express opinions on management’s assessment and on the effectiveness of the Company’s internal control over financial reporting based on our audit. We conducted our audit of internal control over financial reporting in accordance with the standards of the Public Company Accounting Oversight Board (United States). Those standards require that we plan and perform the audit to obtain reasonable assurance about whether effective internal control over financial reporting was maintained in all material respects. An audit of internal control over financial reporting includes obtaining an understanding of internal control over financial reporting, evaluating management’s assessment, testing and evaluating the design and operating effectiveness of internal control, and performing such other procedures as we consider necessary in the circumstances. We believe that our audit provides a reasonable basis for our opinions.
A company’s internal control over financial reporting is a process designed to provide reasonable assurance regarding the reliability of financial reporting and the preparation of financial statements for external purposes in accordance with generally accepted accounting principles. A company’s internal control over financial reporting includes those policies and procedures that (i) pertain to the maintenance of records that, in reasonable detail, accurately and fairly reflect the transactions and dispositions of the assets of the company; (ii) provide reasonable assurance that transactions are recorded as necessary to permit preparation of financial statements in accordance with generally accepted accounting principles, and that receipts and expenditures of the company are being made only in accordance with authorizations of management and directors of the company; and (iii) provide reasonable assurance regarding prevention or timely detection of unauthorized acquisition, use, or disposition of the company’s assets that could have a material effect on the financial statements.
Because of its inherent limitations, internal control over financial reporting may not prevent or detect misstatements. Also, projections of any evaluation of effectiveness to future periods are subject to the risk that controls may become inadequate because of changes in conditions, or that the degree of compliance with the policies or procedures may deteriorate.
PricewaterhouseCoopers LLP
Syracuse, New YorkFebruary 27, 2007
report oF independent regiStered puBlic accounting Firm
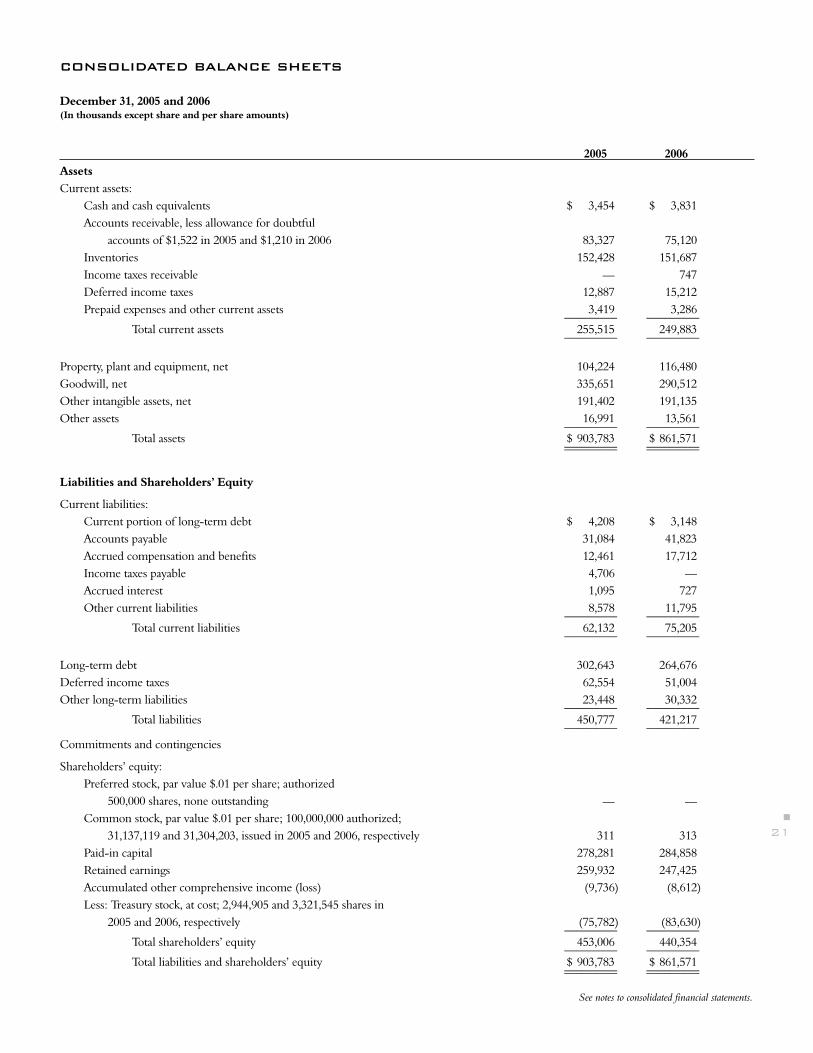
n
21
December 31, 2005 and 2006(In thousands except share and per share amounts)
2005 2006AssetsCurrent assets: Cash and cash equivalents $ 3,454 $ 3,831 Accounts receivable, less allowance for doubtful accounts of $1,522 in 2005 and $1,210 in 2006 83,327 75,120 Inventories 152,428 151,687 Income taxes receivable — 747 Deferred income taxes 12,887 15,212 Prepaid expenses and other current assets 3,419 3,286 _________ _________ Total current assets 255,515 249,883 _________ _________
Property, plant and equipment, net 104,224 116,480Goodwill, net 335,651 290,512Other intangible assets, net 191,402 191,135Other assets 16,991 13,561 _________ _________ Total assets $ 903,783 $ 861,571 _________ _________ _________ _________
Liabilities and Shareholders’ Equity
Current liabilities: Current portion of long-term debt $ 4,208 $ 3,148 Accounts payable 31,084 41,823 Accrued compensation and benefits 12,461 17,712 Income taxes payable 4,706 — Accrued interest 1,095 727 Other current liabilities 8,578 11,795 _________ _________ Total current liabilities 62,132 75,205 _________ _________
Long-term debt 302,643 264,676Deferred income taxes 62,554 51,004Other long-term liabilities 23,448 30,332 _________ _________ Total liabilities 450,777 421,217 _________ _________
Commitments and contingencies
Shareholders’ equity: Preferred stock, par value $.01 per share; authorized 500,000 shares, none outstanding — — Common stock, par value $.01 per share; 100,000,000 authorized; 31,137,119 and 31,304,203, issued in 2005 and 2006, respectively 311 313 Paid-in capital 278,281 284,858 Retained earnings 259,932 247,425 Accumulated other comprehensive income (loss) (9,736 ) (8,612 ) Less: Treasury stock, at cost; 2,944,905 and 3,321,545 shares in 2005 and 2006, respectively (75,782 ) (83,630 ) _________ _________ Total shareholders’ equity 453,006 440,354 _________ _________ Total liabilities and shareholders’ equity $ 903,783 $ 861,571 _________ _________ _________ _________
conSolidated Balance SheetS
See notes to consolidated financial statements.
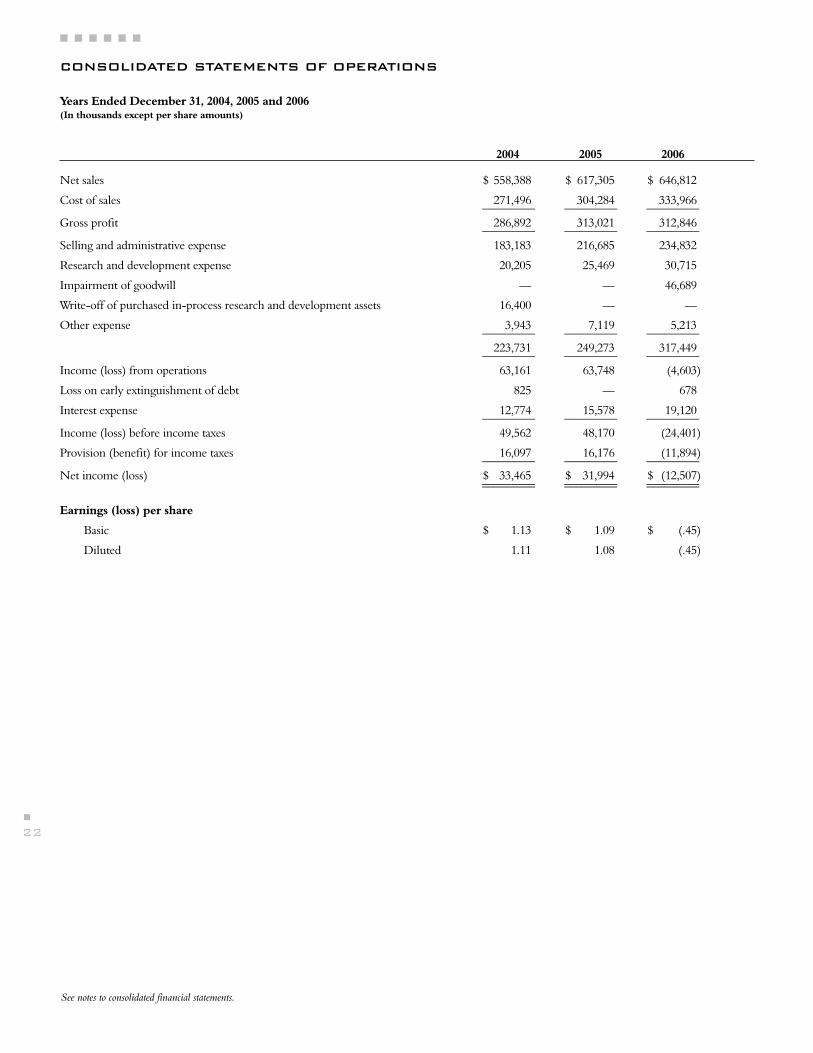
n
n n n n n n
22
See notes to consolidated financial statements.
Years Ended December 31, 2004, 2005 and 2006(In thousands except per share amounts)
2004 2005 2006
Net sales $ 558,388 $ 617,305 $ 646,812
Cost of sales 271,496 304,284 333,966 _________ _________ _________
Gross profit 286,892 313,021 312,846 _________ _________ _________
Selling and administrative expense 183,183 216,685 234,832
Research and development expense 20,205 25,469 30,715
Impairment of goodwill — — 46,689
Write-off of purchased in-process research and development assets 16,400 — —
Other expense 3,943 7,119 5,213 _________ _________ _________
223,731 249,273 317,449 _________ _________ _________
Income (loss) from operations 63,161 63,748 (4,603 )
Loss on early extinguishment of debt 825 — 678
Interest expense 12,774 15,578 19,120 _________ _________ _________
Income (loss) before income taxes 49,562 48,170 (24,401 )
Provision (benefit) for income taxes 16,097 16,176 (11,894 ) _________ _________ _________
Net income (loss) $ 33,465 $ 31,994 $ (12,507 ) _________ _________ _________ _________ _________ _________
Earnings (loss) per share
Basic $ 1.13 $ 1.09 $ (.45 )
Diluted 1.11 1.08 (.45 )
conSolidated StatementS oF operationS
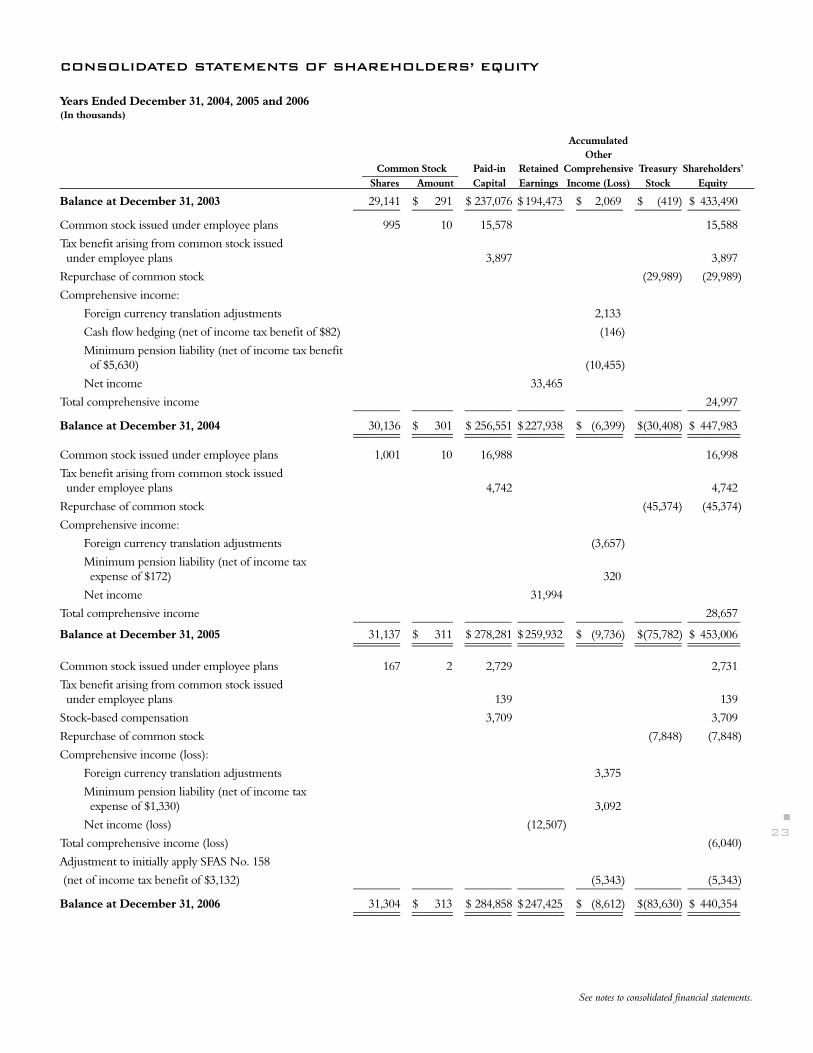
n
23
Years Ended December 31, 2004, 2005 and 2006(In thousands)
Accumulated Other Common Stock Paid-in Retained Comprehensive Treasury Shareholders’ ____________________ Shares Amount Capital Earnings Income (Loss) Stock Equity
Balance at December 31, 2003 29,141 $ 291 $ 237,076 $ 194,473 $ 2,069 $ (419 ) $ 433,490 ________ _______ ________ ________ ________ ________ _________
Common stock issued under employee plans 995 10 15,578 15,588
Tax benefit arising from common stock issued under employee plans 3,897 3,897
Repurchase of common stock (29,989 ) (29,989 )
Comprehensive income:
Foreign currency translation adjustments 2,133
Cash flow hedging (net of income tax benefit of $82) (146 )
Minimum pension liability (net of income tax benefit of $5,630) (10,455 )
Net income 33,465
Total comprehensive income 24,997 ________ _______ ________ ________ ________ ________ _________
Balance at December 31, 2004 30,136 $ 301 $ 256,551 $ 227,938 $ (6,399 ) $ (30,408 ) $ 447,983 ________ _______ ________ ________ ________ ________ _________ ________ _______ ________ ________ ________ ________ _________
Common stock issued under employee plans 1,001 10 16,988 16,998
Tax benefit arising from common stock issued under employee plans 4,742 4,742
Repurchase of common stock (45,374 ) (45,374 )
Comprehensive income:
Foreign currency translation adjustments (3,657 )
Minimum pension liability (net of income tax expense of $172) 320
Net income 31,994
Total comprehensive income 28,657 ________ _______ ________ ________ ________ ________ _________
Balance at December 31, 2005 31,137 $ 311 $ 278,281 $ 259,932 $ (9,736 ) $ (75,782 ) $ 453,006 ________ _______ ________ ________ ________ ________ _________ ________ _______ ________ ________ ________ ________ _________
Common stock issued under employee plans 167 2 2,729 2,731
Tax benefit arising from common stock issued under employee plans 139 139
Stock-based compensation 3,709 3,709
Repurchase of common stock (7,848 ) (7,848 )
Comprehensive income (loss):
Foreign currency translation adjustments 3,375
Minimum pension liability (net of income tax expense of $1,330) 3,092
Net income (loss) (12,507 )
Total comprehensive income (loss) (6,040 )
Adjustment to initially apply SFAS No. 158
(net of income tax benefit of $3,132) (5,343 ) (5,343 ) ________ _______ ________ ________ ________ ________ _________
Balance at December 31, 2006 31,304 $ 313 $ 284,858 $ 247,425 $ (8,612 ) $ (83,630 ) $ 440,354 ________ _______ ________ ________ ________ ________ _________ ________ _______ ________ ________ ________ ________ _________
See notes to consolidated financial statements.
conSolidated StatementS oF ShareholderS’ equitY

n
n n n n n n
24
Years Ended December 31, 2004, 2005 and 2006(In thousands)
2004 2005 2006
Cash flows from operating activities: Net income (loss) $ 33,465 $ 31,994 $ (12,507 ) _________ _________ _________ Adjustments to reconcile net income (loss) to net cash provided by operating activities: Depreciation 10,962 12,466 11,738 Amortization 15,906 18,320 18,113 Stock-based compensation — — 3,709 Goodwill impairment — — 46,689 Deferred income taxes 4,301 10,128 (12,289 ) Income tax benefit of stock option exercises 3,897 4,742 139 Excess tax benefits from stock-based compensation — — (139 ) Contributions to pension plans less than net pension cost 3,619 2,062 1,877 Write-off of purchased in-process research and development assets 16,400 — — Loss on extinguishment of debt 825 — 203 Loss on sale of equity investment — 794 — Increase (decrease) in cash flows from changes in assets and liabilities, net of effects from acquisitions: Sale of accounts receivable 5,000 (9,000 ) 4,000 Accounts receivable (19,144 ) 266 (126 ) Inventories 1,441 (33,620 ) (9,380 ) Accounts payable 4,350 8,273 7,016 Income taxes payable (2,532 ) 675 (1,944 ) Accrued compensation and benefits 1,626 (194 ) 5,251 Accrued interest 469 347 (368 ) Other assets (3,884 ) (4,402 ) (1,582 ) Other liabilities (1,861 ) (417 ) 4,172 _________ _________ _________ 41,375 10,440 77,079 _________ _________ _________ Net cash provided by operating activities 74,840 42,434 64,572 _________ _________ _________Cash flows from investing activities: Payments related to business acquisitions, net of cash acquired (81,645 ) (372 ) (2,466 ) Proceeds from sale of equity investment — — 1,205 Purchases of property, plant and equipment, net (12,419 ) (16,242 ) (21,895 ) _________ _________ _________
Net cash used in investing activities (94,064 ) (16,614 ) (23,156 ) _________ _________ _________Cash flows from financing activities: Net proceeds from common stock issued under employee plans 15,200 16,998 2,731 Excess tax benefits from stock-based compensation — — 139 Repurchase of common stock (29,989 ) (45,374 ) (7,848 ) Payments on senior credit agreement (114,937 ) (29,917 ) (173,160 ) Proceeds of senior credit agreement — 43,000 135,000 Payments on mortgage notes (5,132 ) (754 ) (867 ) Proceeds from issuance of 2.50% convertible senior subordinated notes 150,000 — — Payments related to issuance of debt (5,848 ) (185 ) (1,260 ) Net change in cash overdrafts 6,209 (6,102 ) 1,166 _________ _________ _________ Net cash provided by (used in) financing activities 15,503 (22,334 ) (44,099 ) _________ _________ _________Effect of exchange rate changes on cash and cash equivalents 1,924 (4,221 ) 3,060 _________ _________ _________Net increase (decrease) in cash and cash equivalents (1,797 ) (735 ) 377Cash and cash equivalents at beginning of year 5,986 4,189 3,454 _________ _________ _________Cash and cash equivalents at end of year $ 4,189 $ 3,454 $ 3,831 _________ _________ _________ _________ _________ _________Supplemental disclosures of cash flow information: Cash paid during the year for: Interest $ 12,680 $ 13,794 $ 18,247 Income taxes 11,994 3,921 2,168
Supplemental disclosures of non-cash investing and financing activities:We assumed $3.5 million in liabilities in connection with a business acquisition in 2004 described more fully in Note 2.
conSolidated StatementS oF caSh FlowS
See notes to consolidated financial statements.
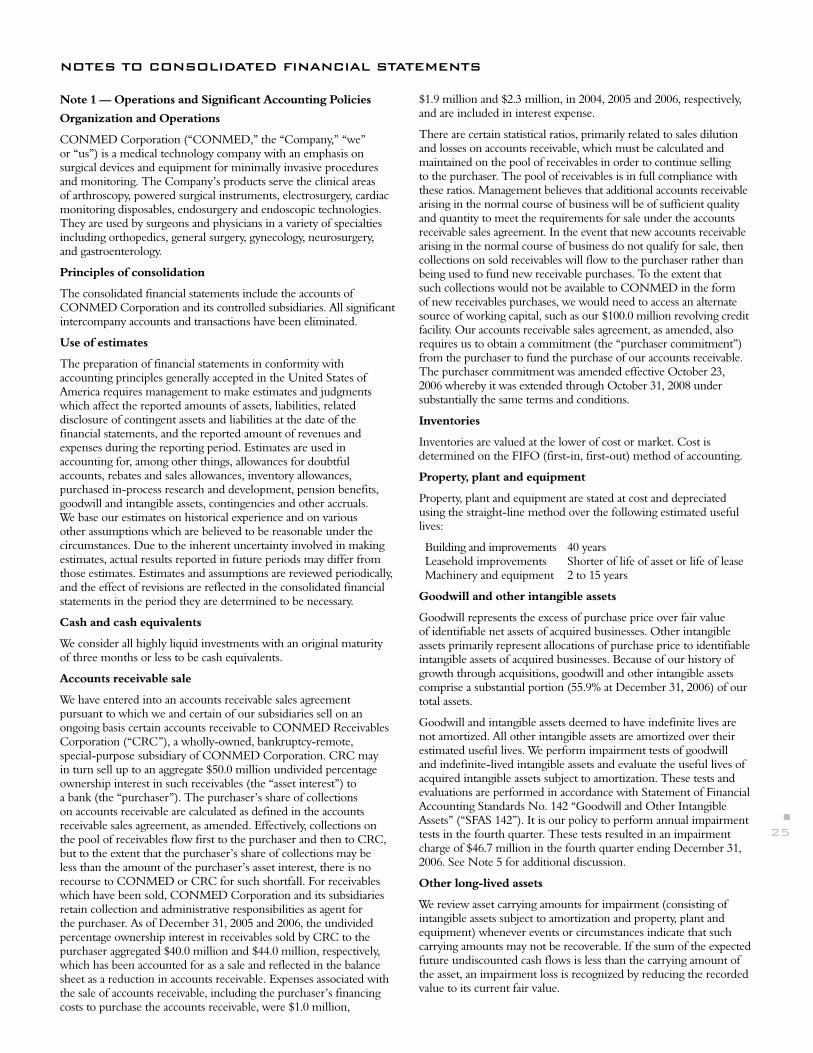
n
25
Note 1 — Operations and Significant Accounting Policies
Organization and Operations
CONMED Corporation (“CONMED,” the “Company,” “we” or “us”) is a medical technology company with an emphasis on surgical devices and equipment for minimally invasive procedures and monitoring. The Company’s products serve the clinical areas of arthroscopy, powered surgical instruments, electrosurgery, cardiac monitoring disposables, endosurgery and endoscopic technologies. They are used by surgeons and physicians in a variety of specialties including orthopedics, general surgery, gynecology, neurosurgery, and gastroenterology.
Principles of consolidation
The consolidated financial statements include the accounts of CONMED Corporation and its controlled subsidiaries. All significant intercompany accounts and transactions have been eliminated.
Use of estimates
The preparation of financial statements in conformity with accounting principles generally accepted in the United States of America requires management to make estimates and judgments which affect the reported amounts of assets, liabilities, related disclosure of contingent assets and liabilities at the date of the financial statements, and the reported amount of revenues and expenses during the reporting period. Estimates are used in accounting for, among other things, allowances for doubtful accounts, rebates and sales allowances, inventory allowances, purchased in-process research and development, pension benefits, goodwill and intangible assets, contingencies and other accruals. We base our estimates on historical experience and on various other assumptions which are believed to be reasonable under the circumstances. Due to the inherent uncertainty involved in making estimates, actual results reported in future periods may differ from those estimates. Estimates and assumptions are reviewed periodically, and the effect of revisions are reflected in the consolidated financial statements in the period they are determined to be necessary.
Cash and cash equivalents
We consider all highly liquid investments with an original maturity of three months or less to be cash equivalents.
Accounts receivable sale
We have entered into an accounts receivable sales agreement pursuant to which we and certain of our subsidiaries sell on an ongoing basis certain accounts receivable to CONMED Receivables Corporation (“CRC”), a wholly-owned, bankruptcy-remote, special-purpose subsidiary of CONMED Corporation. CRC may in turn sell up to an aggregate $50.0 million undivided percentage ownership interest in such receivables (the “asset interest”) to a bank (the “purchaser”). The purchaser’s share of collections on accounts receivable are calculated as defined in the accounts receivable sales agreement, as amended. Effectively, collections on the pool of receivables flow first to the purchaser and then to CRC, but to the extent that the purchaser’s share of collections may be less than the amount of the purchaser’s asset interest, there is no recourse to CONMED or CRC for such shortfall. For receivables which have been sold, CONMED Corporation and its subsidiaries retain collection and administrative responsibilities as agent for the purchaser. As of December 31, 2005 and 2006, the undivided percentage ownership interest in receivables sold by CRC to the purchaser aggregated $40.0 million and $44.0 million, respectively, which has been accounted for as a sale and reflected in the balance sheet as a reduction in accounts receivable. Expenses associated with the sale of accounts receivable, including the purchaser’s financing costs to purchase the accounts receivable, were $1.0 million,
$1.9 million and $2.3 million, in 2004, 2005 and 2006, respectively, and are included in interest expense.
There are certain statistical ratios, primarily related to sales dilution and losses on accounts receivable, which must be calculated and maintained on the pool of receivables in order to continue selling to the purchaser. The pool of receivables is in full compliance with these ratios. Management believes that additional accounts receivable arising in the normal course of business will be of sufficient quality and quantity to meet the requirements for sale under the accounts receivable sales agreement. In the event that new accounts receivable arising in the normal course of business do not qualify for sale, then collections on sold receivables will flow to the purchaser rather than being used to fund new receivable purchases. To the extent that such collections would not be available to CONMED in the form of new receivables purchases, we would need to access an alternate source of working capital, such as our $100.0 million revolving credit facility. Our accounts receivable sales agreement, as amended, also requires us to obtain a commitment (the “purchaser commitment”) from the purchaser to fund the purchase of our accounts receivable. The purchaser commitment was amended effective October 23, 2006 whereby it was extended through October 31, 2008 under substantially the same terms and conditions.
Inventories
Inventories are valued at the lower of cost or market. Cost is determined on the FIFO (first-in, first-out) method of accounting.
Property, plant and equipment
Property, plant and equipment are stated at cost and depreciated using the straight-line method over the following estimated useful lives:
Building and improvements 40 years Leasehold improvements Shorter of life of asset or life of lease Machinery and equipment 2 to 15 years
Goodwill and other intangible assets
Goodwill represents the excess of purchase price over fair value of identifiable net assets of acquired businesses. Other intangible assets primarily represent allocations of purchase price to identifiable intangible assets of acquired businesses. Because of our history of growth through acquisitions, goodwill and other intangible assets comprise a substantial portion (55.9% at December 31, 2006) of our total assets.
Goodwill and intangible assets deemed to have indefinite lives are not amortized. All other intangible assets are amortized over their estimated useful lives. We perform impairment tests of goodwill and indefinite-lived intangible assets and evaluate the useful lives of acquired intangible assets subject to amortization. These tests and evaluations are performed in accordance with Statement of Financial Accounting Standards No. 142 “Goodwill and Other Intangible Assets” (“SFAS 142”). It is our policy to perform annual impairment tests in the fourth quarter. These tests resulted in an impairment charge of $46.7 million in the fourth quarter ending December 31, 2006. See Note 5 for additional discussion.
Other long-lived assets
We review asset carrying amounts for impairment (consisting of intangible assets subject to amortization and property, plant and equipment) whenever events or circumstances indicate that such carrying amounts may not be recoverable. If the sum of the expected future undiscounted cash flows is less than the carrying amount of the asset, an impairment loss is recognized by reducing the recorded value to its current fair value.
noteS to conSolidated Financial StatementS
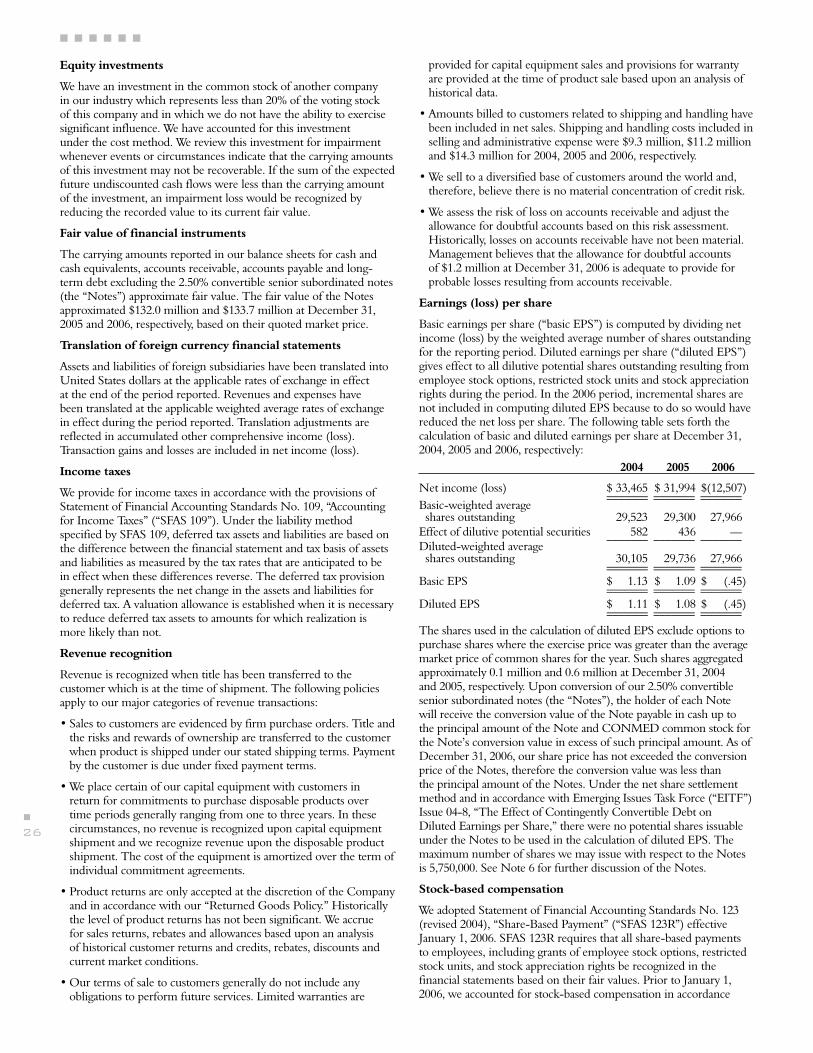
n
n n n n n n
26
Equity investments
We have an investment in the common stock of another company in our industry which represents less than 20% of the voting stock of this company and in which we do not have the ability to exercise significant influence. We have accounted for this investment under the cost method. We review this investment for impairment whenever events or circumstances indicate that the carrying amounts of this investment may not be recoverable. If the sum of the expected future undiscounted cash flows were less than the carrying amount of the investment, an impairment loss would be recognized by reducing the recorded value to its current fair value.
Fair value of financial instruments
The carrying amounts reported in our balance sheets for cash and cash equivalents, accounts receivable, accounts payable and long-term debt excluding the 2.50% convertible senior subordinated notes (the “Notes”) approximate fair value. The fair value of the Notes approximated $132.0 million and $133.7 million at December 31, 2005 and 2006, respectively, based on their quoted market price.
Translation of foreign currency financial statements
Assets and liabilities of foreign subsidiaries have been translated into United States dollars at the applicable rates of exchange in effect at the end of the period reported. Revenues and expenses have been translated at the applicable weighted average rates of exchange in effect during the period reported. Translation adjustments are reflected in accumulated other comprehensive income (loss). Transaction gains and losses are included in net income (loss).
Income taxes
We provide for income taxes in accordance with the provisions of Statement of Financial Accounting Standards No. 109, “Accounting for Income Taxes” (“SFAS 109”). Under the liability method specified by SFAS 109, deferred tax assets and liabilities are based on the difference between the financial statement and tax basis of assets and liabilities as measured by the tax rates that are anticipated to be in effect when these differences reverse. The deferred tax provision generally represents the net change in the assets and liabilities for deferred tax. A valuation allowance is established when it is necessary to reduce deferred tax assets to amounts for which realization is more likely than not.
Revenue recognition
Revenue is recognized when title has been transferred to the customer which is at the time of shipment. The following policies apply to our major categories of revenue transactions:
• Sales to customers are evidenced by firm purchase orders. Title and the risks and rewards of ownership are transferred to the customer when product is shipped under our stated shipping terms. Payment by the customer is due under fixed payment terms.
• We place certain of our capital equipment with customers in return for commitments to purchase disposable products over time periods generally ranging from one to three years. In these circumstances, no revenue is recognized upon capital equipment shipment and we recognize revenue upon the disposable product shipment. The cost of the equipment is amortized over the term of individual commitment agreements.
• Product returns are only accepted at the discretion of the Company and in accordance with our “Returned Goods Policy.” Historically the level of product returns has not been significant. We accrue for sales returns, rebates and allowances based upon an analysis of historical customer returns and credits, rebates, discounts and current market conditions.
• Our terms of sale to customers generally do not include any obligations to perform future services. Limited warranties are
provided for capital equipment sales and provisions for warranty are provided at the time of product sale based upon an analysis of historical data.
• Amounts billed to customers related to shipping and handling have been included in net sales. Shipping and handling costs included in selling and administrative expense were $9.3 million, $11.2 million and $14.3 million for 2004, 2005 and 2006, respectively.
• We sell to a diversified base of customers around the world and, therefore, believe there is no material concentration of credit risk.
• We assess the risk of loss on accounts receivable and adjust the allowance for doubtful accounts based on this risk assessment. Historically, losses on accounts receivable have not been material. Management believes that the allowance for doubtful accounts of $1.2 million at December 31, 2006 is adequate to provide for probable losses resulting from accounts receivable.
Earnings (loss) per share
Basic earnings per share (“basic EPS”) is computed by dividing net income (loss) by the weighted average number of shares outstanding for the reporting period. Diluted earnings per share (“diluted EPS”) gives effect to all dilutive potential shares outstanding resulting from employee stock options, restricted stock units and stock appreciation rights during the period. In the 2006 period, incremental shares are not included in computing diluted EPS because to do so would have reduced the net loss per share. The following table sets forth the calculation of basic and diluted earnings per share at December 31, 2004, 2005 and 2006, respectively: 2004 2005 2006
Net income (loss) $ 33,465 $ 31,994 $ (12,507) _______ _______ _______ _______ _______ _______Basic-weighted average shares outstanding 29,523 29,300 27,966Effect of dilutive potential securities 582 436 — _______ _______ _______Diluted-weighted average shares outstanding 30,105 29,736 27,966 _______ _______ _______ _______ _______ _______Basic EPS $ 1.13 $ 1.09 $ (.45 ) _______ _______ _______ _______ _______ _______Diluted EPS $ 1.11 $ 1.08 $ (.45 ) _______ _______ _______ _______ _______ _______
The shares used in the calculation of diluted EPS exclude options to purchase shares where the exercise price was greater than the average market price of common shares for the year. Such shares aggregated approximately 0.1 million and 0.6 million at December 31, 2004 and 2005, respectively. Upon conversion of our 2.50% convertible senior subordinated notes (the “Notes”), the holder of each Note will receive the conversion value of the Note payable in cash up to the principal amount of the Note and CONMED common stock for the Note’s conversion value in excess of such principal amount. As of December 31, 2006, our share price has not exceeded the conversion price of the Notes, therefore the conversion value was less than the principal amount of the Notes. Under the net share settlement method and in accordance with Emerging Issues Task Force (“EITF”) Issue 04-8, “The Effect of Contingently Convertible Debt on Diluted Earnings per Share,” there were no potential shares issuable under the Notes to be used in the calculation of diluted EPS. The maximum number of shares we may issue with respect to the Notes is 5,750,000. See Note 6 for further discussion of the Notes.
Stock-based compensation
We adopted Statement of Financial Accounting Standards No. 123 (revised 2004), “Share-Based Payment” (“SFAS 123R”) effective January 1, 2006. SFAS 123R requires that all share-based payments to employees, including grants of employee stock options, restricted stock units, and stock appreciation rights be recognized in the financial statements based on their fair values. Prior to January 1, 2006, we accounted for stock-based compensation in accordance
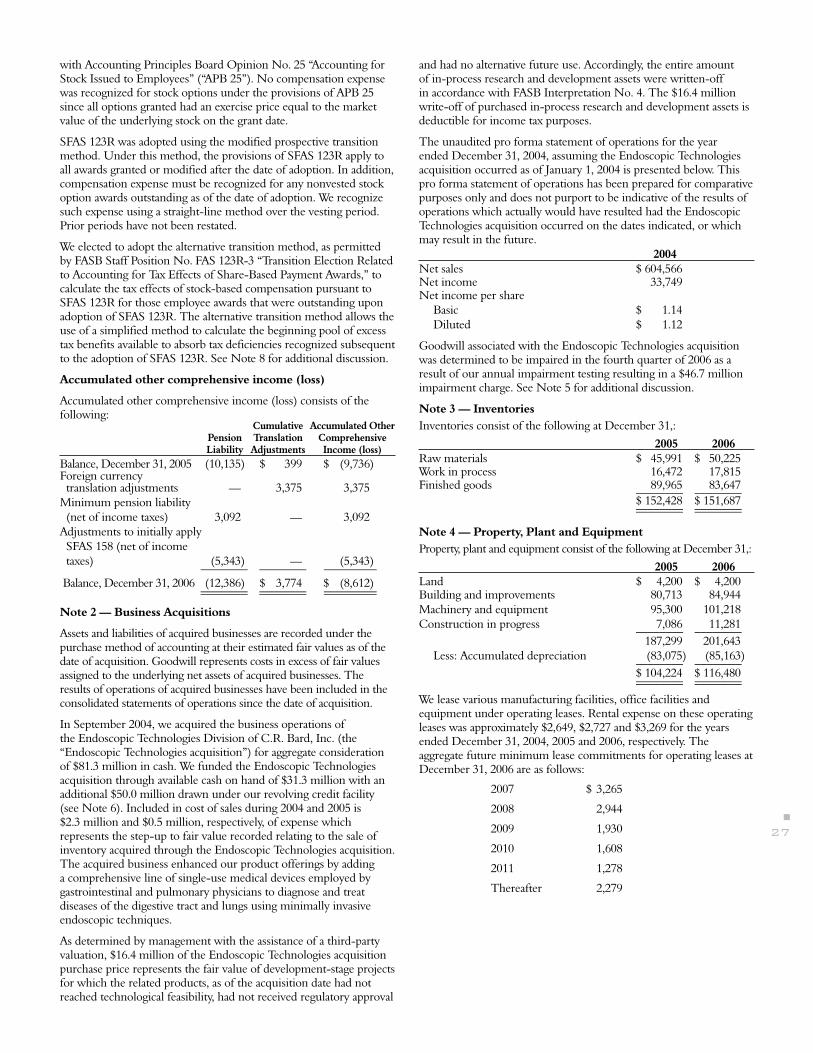
n
27
with Accounting Principles Board Opinion No. 25 “Accounting for Stock Issued to Employees” (“APB 25”). No compensation expense was recognized for stock options under the provisions of APB 25 since all options granted had an exercise price equal to the market value of the underlying stock on the grant date.
SFAS 123R was adopted using the modified prospective transition method. Under this method, the provisions of SFAS 123R apply to all awards granted or modified after the date of adoption. In addition, compensation expense must be recognized for any nonvested stock option awards outstanding as of the date of adoption. We recognize such expense using a straight-line method over the vesting period. Prior periods have not been restated.
We elected to adopt the alternative transition method, as permitted by FASB Staff Position No. FAS 123R-3 “Transition Election Related to Accounting for Tax Effects of Share-Based Payment Awards,” to calculate the tax effects of stock-based compensation pursuant to SFAS 123R for those employee awards that were outstanding upon adoption of SFAS 123R. The alternative transition method allows the use of a simplified method to calculate the beginning pool of excess tax benefits available to absorb tax deficiencies recognized subsequent to the adoption of SFAS 123R. See Note 8 for additional discussion.
Accumulated other comprehensive income (loss)
Accumulated other comprehensive income (loss) consists of the following: Cumulative Accumulated Other Pension Translation Comprehensive Liability Adjustments Income (loss)Balance, December 31, 2005 (10,135 ) $ 399 $ (9,736 )Foreign currency translation adjustments — 3,375 3,375Minimum pension liability (net of income taxes) 3,092 — 3,092Adjustments to initially apply SFAS 158 (net of income taxes) (5,343 ) — (5,343 ) ________ ________ _________
Balance, December 31, 2006 (12,386 ) $ 3,774 $ (8,612 ) ________ ________ _________ ________ ________ _________
Note 2 — Business Acquisitions
Assets and liabilities of acquired businesses are recorded under the purchase method of accounting at their estimated fair values as of the date of acquisition. Goodwill represents costs in excess of fair values assigned to the underlying net assets of acquired businesses. The results of operations of acquired businesses have been included in the consolidated statements of operations since the date of acquisition.
In September 2004, we acquired the business operations of the Endoscopic Technologies Division of C.R. Bard, Inc. (the “Endoscopic Technologies acquisition”) for aggregate consideration of $81.3 million in cash. We funded the Endoscopic Technologies acquisition through available cash on hand of $31.3 million with an additional $50.0 million drawn under our revolving credit facility (see Note 6). Included in cost of sales during 2004 and 2005 is $2.3 million and $0.5 million, respectively, of expense which represents the step-up to fair value recorded relating to the sale of inventory acquired through the Endoscopic Technologies acquisition. The acquired business enhanced our product offerings by adding a comprehensive line of single-use medical devices employed by gastrointestinal and pulmonary physicians to diagnose and treat diseases of the digestive tract and lungs using minimally invasive endoscopic techniques.
As determined by management with the assistance of a third-party valuation, $16.4 million of the Endoscopic Technologies acquisition purchase price represents the fair value of development-stage projects for which the related products, as of the acquisition date had not reached technological feasibility, had not received regulatory approval
and had no alternative future use. Accordingly, the entire amount of in-process research and development assets were written-off in accordance with FASB Interpretation No. 4. The $16.4 million write-off of purchased in-process research and development assets is deductible for income tax purposes.
The unaudited pro forma statement of operations for the year ended December 31, 2004, assuming the Endoscopic Technologies acquisition occurred as of January 1, 2004 is presented below. This pro forma statement of operations has been prepared for comparative purposes only and does not purport to be indicative of the results of operations which actually would have resulted had the Endoscopic Technologies acquisition occurred on the dates indicated, or which may result in the future. 2004Net sales $ 604,566Net income 33,749 Net income per share Basic $ 1.14 Diluted $ 1.12
Goodwill associated with the Endoscopic Technologies acquisition was determined to be impaired in the fourth quarter of 2006 as a result of our annual impairment testing resulting in a $46.7 million impairment charge. See Note 5 for additional discussion.
Note 3 — InventoriesInventories consist of the following at December 31,:
2005 2006Raw materials $ 45,991 $ 50,225Work in process 16,472 17,815Finished goods 89,965 83,647 ________ ________ $ 152,428 $ 151,687 ________ ________ ________ ________
Note 4 — Property, Plant and EquipmentProperty, plant and equipment consist of the following at December 31,:
2005 2006Land $ 4,200 $ 4,200Building and improvements 80,713 84,944Machinery and equipment 95,300 101,218Construction in progress 7,086 11,281 ________ ________ 187,299 201,643 Less: Accumulated depreciation (83,075 ) (85,163 ) ________ ________ $ 104,224 $ 116,480 ________ ________ ________ ________
We lease various manufacturing facilities, office facilities and equipment under operating leases. Rental expense on these operating leases was approximately $2,649, $2,727 and $3,269 for the years ended December 31, 2004, 2005 and 2006, respectively. The aggregate future minimum lease commitments for operating leases at December 31, 2006 are as follows:
2007 $ 3,265
2008 2,944
2009 1,930
2010 1,608
2011 1,278
Thereafter 2,279

n
n n n n n n
28
Note 5 — Goodwill and Other Intangible Assets
The changes in the net carrying amount of goodwill for the years ended December 31, are as follows:
2005 2006Balance as of January 1, $ 334,483 $ 335,651Goodwill impairment — (46,689 )Adjustments to goodwill resulting from business acquisitions finalized 372 1,705Foreign currency translation 796 ( 155 ) ________ ________Balance as of December 31, $ 335,651 $ 290,512 ________ ________ ________ ________
Goodwill associated with each of our principal operating units at December 31, is as follows:
2005 2006
CONMED Electrosurgery $ 16,645 $ 16,645CONMED Endoscopic Technologies 46,649 —CONMED Endosurgery 42,404 42,419CONMED Linvatec 175,853 173,007CONMED Patient Care 54,100 58,441 ________ ________Balance as of December 31, $ 335,651 $ 290,512 ________ ________ ________ ________
The Endoscopic Technologies acquisition described in Note 2 involved the transfer of substantially all of the Endoscopic Technologies production lines from C.R. Bard facilities to CONMED facilities. This transfer has proven to be more time-consuming, costly and complex than was originally anticipated. In addition, production and operational issues at an assembly operation in Mexico under contract to CONMED have resulted in product shortages and backorders. These operational issues, in combination with increased competition and pricing pressures in the marketplace have resulted in decreased sales and gross margins and operating losses. As a result of these factors, during our fourth quarter 2006 goodwill impairment testing, we determined that the goodwill of our Endoscopic Technologies operating unit was impaired and consequently we recorded a goodwill impairment charge of $46.7 million to reduce the carrying amount of the unit to its fair value. We estimated the fair value of the Endoscopic Technologies operating unit using a discounted cash flow valuation methodology and measured the goodwill impairment in accordance with SFAS 142.
Other intangible assets consist of the following:
Dec. 31, 2005 Dec. 31, 2006 ____________________ ____________________ Gross Gross Carrying Accumulated Carrying Accumulated Amount Amortization Amount AmortizationAmortized intangible assets:
Customer relationships $ 110,612 $ (21,317 ) $ 113,376 $ (24,498 )Patents and other intangible assets 37,344 (22,581 ) 39,609 (24,696 )Unamortized intangible assets:
Trademarks and tradenames 87,344 — 87,344 — ________ ________ ________ ________ $ 235,300 $ (43,898 ) $ 240,329 $ (49,194 ) ________ ________ ________ ________ ________ ________ ________ ________
Other intangible assets primarily represent allocations of purchase price to identifiable intangible assets of acquired businesses. The weighted average amortization period for intangible assets which are amortized is 25 years. Customer relationships are being amortized over a weighted average life of 36 years. Patents and other intangible assets are being amortized over a weighted average life of 12 years.
Customer relationship assets were acquired primarily in connection with the 1997 acquisition of Linvatec Corporation, 2003 Bionx acquisition and 2004 Endoscopic Technologies acquisition. These assets represent the value associated with business expected to be generated from acquired customers as of the acquisition date. Asset values were determined by measuring the present value of the projected future earnings attributable to these assets. Additionally, while the useful lives of these assets are not limited by contract or any other economic, regulatory or other known factors, the weighted average useful life of 36 years was determined as of acquisition date by historical customer attrition. In accordance with SFAS 142 and as clarified by EITF Issue 02-17, “Recognition of Customer Relationship Intangible Assets Acquired in a Business Combination,” customer relationships evidenced by customer purchase orders are contractual in nature and therefore continue to be recognized separate from goodwill and are amortized over their weighted average 36 year life.
Trademarks and tradenames were recognized in connection with the 1997 acquisition of Linvatec Corporation, 2003 Bionx acquisition and 2004 Endoscopic Technologies acquisition. We continue to market products, release new product and product extensions and maintain and promote these trademarks and tradenames in the marketplace through legal registration and such methods as advertising, medical education and trade shows. It is our belief that these trademarks and tradenames will generate cash flow for an indefinite period of time. Therefore, in accordance with SFAS 142, our trademarks and tradenames intangible assets are not amortized.
Amortization expense related to intangible assets for the year ending December 31, 2006 and estimated amortization expense for each of the five succeeding years is as follows:
2006 $ 5,296
2007 5,555
2008 5,555
2009 5,534
2010 4,984
2011 4,777
Note 6 — Long-term DebtLong-term debt consists of the following at December 31,:
2005 2006Revolving line of credit $ 43,000 $ —Term loan borrowings on senior credit facility 98,147 102,9882.50% Convertible senior subordinated notes 150,000 150,000Mortgage notes 15,704 14,836 ________ ________ Total long-term debt 306,851 267,824Less: Current portion 4,208 3,148 ________ ________ $ 302,643 $ 264,676 ________ ________ ________ ________
During 2006, we entered into an amended and restated $235.0 million senior credit agreement (the “amended and restated senior credit agreement”). The amended and restated senior credit agreement consists of a $100.0 million revolving credit facility and a $135.0 million term loan. There were no borrowings outstanding on the revolving credit facility as of December 31, 2006. Our available borrowings on the revolving credit facility at December 31, 2006 were $93.0 million with approximately $7.0 million of the facility set aside for outstanding letters of credit. There were $103.0 million in borrowings outstanding on the term loan at December 31, 2006. The proceeds of the term loan portion of the amended and restated senior credit agreement were used to repay borrowings outstanding on the term loan and revolving credit facility of $142.5 million under the previously existing senior credit agreement. In connection with the refinancing, we recorded a $0.7 million loss on early extinguishment

n
29
of debt of which $0.2 million related to the write-off of unamortized deferred financing costs under the previously existing senior credit agreement and $0.5 million related to financing costs associated with the amended and restated senior credit agreement.
The scheduled principal payments on the term loan portion of the amended and restated senior credit agreement are $1.4 million annually through December 2011, increasing to $95.5 million in 2012 with the remaining balance outstanding due and payable on April 12, 2013. We may also be required, under certain circumstances, to make additional principal payments based on excess cash flow as defined in the senior credit agreement. Interest rates on the term loan portion of the senior credit agreement are at LIBOR plus 2.00% (7.35% at December 31, 2006) or an alternative base rate; interest rates on the revolving credit facility portion of the senior credit agreement are at LIBOR plus 2.00% or an alternative base rate. For those borrowings where the Company elects to use the alternative base rate, the base rate will be the greater of the Prime Rate or the Federal Funds Rate in effect on such date plus 0.50%, plus a margin of 0.75% for term loan borrowings or 0.50% for borrowings under the revolving credit facility.
The amended and restated senior credit agreement is collateralized by substantially all of our personal property and assets, except for our accounts receivable and related rights which are pledged in connection with our accounts receivable sales agreement. The amended and restated credit agreement contains covenants and restrictions which, among other things, require the maintenance of certain financial ratios, and restrict dividend payments and the incurrence of certain indebtedness and other activities, including acquisitions and dispositions. We were in full compliance with these covenants and restrictions as of December 31, 2006. We are also required, under certain circumstances, to make mandatory prepayments from net cash proceeds from any issue of equity and asset sales.
Mortgage notes outstanding in connection with the property and facilities utilized by our CONMED Linvatec subsidiary consist of a note bearing interest at 7.50% per annum with semi-annual payments of principal and interest through June 2009 (the “Class A note”); and a note bearing interest at 8.25% per annum compounded semi-annually through June 2009, after which semi-annual payments of principal and interest will commence, continuing through June 2019 (the “Class C note”). The principal balances outstanding on the Class A note and Class C note aggregated $5.2 million and $9.6 million, respectively, at December 31, 2006. These mortgage notes are collateralized by the CONMED Linvatec property and facilities.
During 2004, we completed an offering of $150.0 million in 2.50% convertible senior subordinated notes (the “Notes”) due 2024. The Notes represent subordinated unsecured obligations and are convertible under certain circumstances, as defined in the bond indenture, into a combination of cash and CONMED common stock. Upon conversion, the holder of each Note will receive the conversion value of the Note payable in cash up to the principal amount of the Note and CONMED common stock for the Note’s conversion value in excess of such principal amount. Amounts in excess of the principal amount are at an initial conversion rate, subject to adjustment, of 26.1849 shares per $1,000 principal amount of the Note (which represents an initial conversion price of $38.19 per share). The Notes mature on November 15, 2024 and are not redeemable by us prior to November 15, 2011. Holders of the Notes will be able to require that we repurchase some or all of the Notes on November 15, 2011, 2014 and 2019.
The Notes contain two embedded derivatives. The embedded derivatives are recorded at fair value in other long-term liabilities and changes in their value are recorded through the Consolidated Statements of Operations. The embedded derivatives have a nominal value, and it is our belief that any change in their fair value would
not have a material adverse effect on our business, financial condition or results of operations.
Proceeds from the offering and cash on hand were used to repay $82.2 million on the term loan and a further $45.0 million in borrowings then outstanding on the revolving credit facility under our senior credit agreement. Additionally, in conjunction with the Notes offering, we repurchased $30.0 million of our common stock in privately negotiated transactions. As a result of the $82.2 million prepayment on the term loan, we recorded $0.8 million in losses on the early extinguishment of debt related to the write-off of unamortized deferred financing fees.
The scheduled maturities of long-term debt outstanding at December 31, 2006 are as follows:
2007 $ 3,148
2008 3,349
2009 3,185
2010 2,174
2011 2,244
Thereafter 253,724
Note 7 — Income Taxes
The provision for income taxes for the years ended December 31, 2004, 2005 and 2006 consists of the following:
2004 2005 2006Current tax expense: Federal $ 9,138 $ 3,083 $ (2,582 ) State 975 795 1,006 Foreign 1,683 2,170 1,846 ________ ________ ________ 11,796 6,048 270Deferred income tax expense 4,301 10,128 (12,164 ) ________ ________ ________ Provision for income taxes $ 16,097 $ 16,176 $ (11,894 ) ________ ________ ________ ________ ________ ________
A reconciliation between income taxes computed at the statutory federal rate and the provision for income taxes for the years ended December 31, 2004, 2005 and 2006 follows: 2004 2005 2006Tax provision at statutory rate based on income (loss) before income taxes 35.00% 35.00% (35.00)%Extraterritorial income exclusion (5.30) (2.78) (5.39)State income taxes 2.75 .66 (3.24)Stock-based compensation — — 3.49Research and development credit (.64) (.53) (3.87)Settlement of taxing authority examinations — — (6.08)Other nondeductible permanent differences .36 .85 1.81Other, net .31 .38 (.46) ________ ________ ________ 32.48% 33.58% (48.74)% ________ ________ ________ ________ ________ ________

n
n n n n n n
30
The tax effects of the significant temporary differences which comprise the deferred tax assets and liabilities at December 31, 2005 and 2006 are as follows: 2005 2006Assets: Inventory $ 10,913 $ 10,899 Net operating losses 8,663 13,707 Deferred compensation 1,931 2,680 Accounts receivable 865 3,134 Accrued pension 5,457 7,259 Research and development credit — 1,980 State taxes — 156 Other 2,400 2,043 Valuation allowance (6,160 ) (6,892 ) ________ ________ 24,069 34,966 ________ ________Liabilities: Goodwill and intangible assets 63,601 59,969 Depreciation 5,568 5,329 Employee benefits 722 103 State taxes 1,116 — Contingent interest 2,729 5,357 ________ ________ 73,736 70,758 ________ ________ Net liability $ (49,667 ) $ (35,792 ) ________ ________ ________ ________
Earnings before income (loss) taxes consists of the following U.S. and foreign income (loss): 2004 2005 2006U.S. income (loss) $ 45,876 $ 42,653 $ (29,659 )Foreign income 3,686 5,517 5,258 ________ ________ ________Total income (loss) $ 49,562 $ 48,170 $ (24,401 ) ________ ________ ________ ________ ________ ________
The net operating loss carryforwards of acquired subsidiaries begin to expire in 2008. We have established a valuation allowance to reflect the uncertainty of realizing the benefits of certain net operating loss carryforwards recognized in connection with an acquisition. Any subsequently recognized tax benefits associated with the valuation allowance would be allocated to reduce goodwill.
We operate in multiple taxing jurisdictions, both within and outside the United States. We face audits from these various tax authorities regarding the amount of taxes due. Such audits can involve complex issues and may require an extended period of time to resolve. Our United States federal income tax returns have been examined by the Internal Revenue Service (“IRS”) for calendar years ending through 2004. During 2006, as a result of the settlement of our 2001 through 2004 income taxes as a result of IRS examinations, we adjusted our reserves to consider positions taken in our income tax return for periods subsequent to 2004. The net effect of these adjustments and the settlement of the 2001 through 2004 IRS examinations, was a $1.5 million reduction in income tax expense in 2006. During the third quarter of 2006, we filed our United States federal income tax return for 2005. As a result of the filing, we identified a greater benefit than was originally anticipated associated with the extraterritorial income exclusion rules and research and development tax credit resulting in a $0.7 million reduction in income tax expense. The net effect of these adjustments was a $2.2 million reduction in income tax expense in 2006.
Note 8 — Shareholders’ Equity
Our shareholders have authorized 500,000 shares of preferred stock, par value $.01 per share, which may be issued in one or more series by the Board of Directors without further action by the shareholders. As of December 31, 2005 and 2006, no preferred stock had been issued.
In November 2004, we repurchased 1.1 million shares of our common stock in privately negotiated transactions at an aggregate cost of $30.0 million. This repurchase coincided with our 2.50% convertible senior subordinated notes transaction (see Note 6).
On February 15, 2005, our Board of Directors authorized a share repurchase program under which we may repurchase up to $50.0 million of our common stock, although no more than $25.0 million could be purchased in any calendar year. The Board subsequently amended this program on December 2, 2005 to authorize repurchases up to $100.0 million of our common stock, although no more than $50.0 million may be purchased in any calendar year. The repurchase program calls for shares to be purchased in the open market or in private transactions from time to time. We may suspend or discontinue the share repurchase program at any time. We have repurchased a total of 2.2 million shares of common stock as of December 31, 2006 under this authorization.
We adopted Statement of Financial Accounting Standards No. 123 (revised 2004), “Share-Based Payment” (“SFAS 123R”) effective January 1, 2006. SFAS 123R requires that all share-based payments to employees, including grants of employee stock options, be recognized in the financial statements based on their fair values.
Prior to January 1, 2006, we accounted for stock-based compensation in accordance with Accounting Principles Board Opinion No. 25 “Accounting for Stock Issued to Employees” (“APB 25”). No compensation expense was recognized for stock options under the provisions of APB 25 since all options granted had an exercise price equal to the market value of the underlying stock on the grant date.
SFAS 123R was adopted using the modified prospective transition method. Under this method, the provisions of SFAS 123R apply to all awards granted or modified after the date of adoption. In addition, compensation expense must be recognized for any nonvested stock option awards outstanding as of the date of adoption. Prior periods have not been restated.
We have elected to adopt the alternative transition method, as permitted by FASB Staff Position No. FAS 123R-3 “Transition Election Related to Accounting for Tax Effects of Share-Based Payment Awards,” to calculate the tax effects of stock-based compensation pursuant to SFAS 123R for those employee awards that were outstanding upon adoption of SFAS 123R. The alternative transition method allows the use of a simplified method to calculate the beginning pool of excess tax benefits available to absorb tax deficiencies recognized subsequent to the adoption of SFAS 123R.
Prior to the adoption of SFAS 123R, we reported all tax benefits resulting from the exercise of stock options as operating cash flows in the Consolidated Statements of Cash Flows. SFAS 123R requires cash flows resulting from the tax deductions in excess of the related compensation cost recognized in the financial statements (excess tax benefits) to be classified as financing cash flows. In accordance with SFAS 123R, excess tax benefits recognized in periods after the adoption date have been classified as financing cash flows. Excess tax benefits recognized in periods prior to the adoption date are classified as operating cash flows.
During the second quarter of 2006, the shareholders approved the 2006 Stock Incentive Plan (“the 2006 Plan”). Awards under this plan may be made to any officer, director, employee, consultant or to any other individual who may perform services for the Company and its subsidiaries and affiliates selected by the committee that administers the 2006 Plan. The 2006 Plan provides for grants of options, stock appreciation rights (“SARs”), dividend equivalent rights, restricted stock, restricted stock units (“RSUs”), and other equity-based and equity-related awards.
We have reserved 4.7 million shares of common stock for issuance to employees and directors under three shareholder-approved share-based compensation plans (the “Plans”) of which approximately 785,000 shares remain available for grant at December 31, 2006. The exercise price on all outstanding options and SARs is equal to the quoted fair market value of the stock at the date of grant. RSUs are valued at the market value of the underlying stock on the date of grant. Stock options, SARs and RSUs are non-transferable other than

n
31
on death and generally become exercisable over a five year period from date of grant. Stock options and SARs expire ten years from date of grant. SARs are only settled in shares of the Company’s stock.
Total pre-tax stock-based compensation expense recognized in the Consolidated Statements of Operations was $3.7 million for the year ended December 31, 2006. This amount is included in selling and administrative expenses on the Consolidated Statements of Operations. Tax related benefits of $440 were also recognized for the year ended December 31, 2006. Cash received from the exercise of stock options was $14.4 million, $15.9 million and $1.7 million for the years ended December 31, 2004, 2005 and 2006, respectively and is reflected in cash flows from financing activities in the Consolidated Statements of Cash Flows.
The weighted average fair value of awards of options and SARs granted in the years ended December 31, 2004, 2005 and 2006 was $14.59, $16.51 and $8.92, respectively. The fair value of these options and SARs was estimated at the date of grant using a Black-Scholes option pricing model with the following weighted-average assumptions for options and SARs granted in the years ended December 31, 2004, 2005 and 2006, respectively: risk-free interest rate of 4.04%, 4.16% and 5.13%; volatility factor of the expected market price of the Company’s common stock of 51.20%, 53.26% and 37.79%; a weighted-average expected life of the option and SAR of 7.3 years, 5.7 years and 5.7 years; and that no dividends would be paid on common stock. The risk free interest rate is based on the option and SAR grant date for a traded zero-coupon U.S. Treasury bond with a maturity date equal to the expected life. Expected volatilities are based upon historical volatility of the Company’s stock over a period equal to the expected life of each option and SAR grant. The expected life selected for options and SARs granted during the year ended December 31, 2006 represents the period of time that the options and SARs are expected to be outstanding based on a study of historical data of option holder exercise and termination behavior.
The following table illustrates the stock option and SAR activity for the years ended December 31, 2004, 2005 and 2006:
Number Weighted-Average of Shares Exercise PriceOutstanding at December 31, 2003 3,994 $ 17.55 Granted 659 25.03 Forfeited (152 ) 19.16 Exercised (940 ) 15.28 _______ _______Outstanding at December 31, 2004 3,561 $ 19.45 Granted 504 30.75 Forfeited (26 ) 24.33 Exercised (954 ) 16.67 _______ _______Outstanding at December 31, 2005 3,085 $ 22.12 Granted 265 20.04 Forfeited (69 ) 23.29 Exercised (115 ) 14.80 _______ _______Outstanding at December 31, 2006 3,166 $ 22.23 _______ _______ _______ _______ Exercisable at December 31, 2006 2,243 $ 21.57 _______ _______ _______ _______
The weighted average remaining contractual term for stock options and SARs outstanding and exercisable at December 31, 2006 was 6.1 years and 5.3 years, respectively. The aggregate intrinsic value of stock options and SARs outstanding and exercisable at December 31, 2006 was $8.8 million and $7.1 million, respectively. The aggregate intrinsic value of stock options exercised during the year ended December 31, 2005 and 2006 was $12.9 million and $0.7 million, respectively.
The following table illustrates the RSU activity as of December 31, 2006, including changes during the year ended December 31, 2006. There were no RSUs granted prior to 2006.
Weighted-Average Number Grant-Date of Shares Fair ValueRSUs outstanding at December 31, 2005 — — Granted 145 $ 20.21 Vested — Forfeited (1 ) 19.93 ________ ________Outstanding at December 31, 2006 144 $ 20.22 ________ ________ ________ ________
As of December 31, 2006, there was $9.9 million of total unrecognized compensation cost related to nonvested stock options, SARs and RSUs granted under the Plan which is expected to be recognized over 5.0 years (weighted average period of 1.8 years).
The following table illustrates the effect on net earnings and earnings per share as if we had applied the fair value recognition provisions of SFAS 123R to stock-based employee compensation for the years ended December 31, 2004 and 2005. The pro forma disclosures are based on the fair value of awards at the grant date, amortized to expense over the service period. 2004 2005Net income — as reported $ 33,465 $ 31,994 _________ _________
Pro forma stock-based employee compensation expense, net of related income tax effect (4,598 ) (4,075 ) _________ _________Net income — pro forma $ 28,867 $ 27,919 _________ _________ _________ _________
Earnings per share — as reported: Basic $ 1.13 $ 1.09 Diluted $ 1.11 $ 1.08Earnings per share — pro forma: Basic $ 0.98 $ 0.95 Diluted $ 0.96 $ 0.94
We offer to our employees a shareholder-approved Employee Stock Purchase Plan (the “Employee Plan”), under which we have reserved 1.0 million shares of common stock for issuance to our employees. The Employee Plan provides employees with the opportunity to invest from 1% to 10% of their annual salary to purchase shares of CONMED common stock through the exercise of stock options granted by the Company at a purchase price equal to 95% of the fair market value of the common stock on the exercise date. During 2006, we issued approximately 52,000 shares of common stock under the Employee Plan. No stock-based compensation expense has been recognized in the accompanying consolidated financial statements as a result of common stock issuances under the Employee Plan.
Note 9 — Business Segments and Geographic Areas
CONMED conducts its business through five principal operating units: CONMED Endoscopic Technologies, CONMED Endosurgery, CONMED Electrosurgery, CONMED Linvatec and CONMED Patient Care. We believe each of our segments are similar in the nature of products, production processes, customer base, distribution methods and regulatory environment. In accordance with Statement of Financial Accounting Standards No. 131 “Disclosures About Segments of an Enterprise and Related Information” (“SFAS 131”), our CONMED Endosurgery, CONMED Electrosurgery and CONMED Linvatec operating units also have similar economic characteristics and therefore qualify for aggregation under SFAS 131. Our CONMED Patient Care and CONMED Endoscopic Technologies operating units do not qualify for aggregation under SFAS 131 since their economic characteristics do not meet the criteria for aggregation as a result of the lower overall operating income (loss) in these segments.
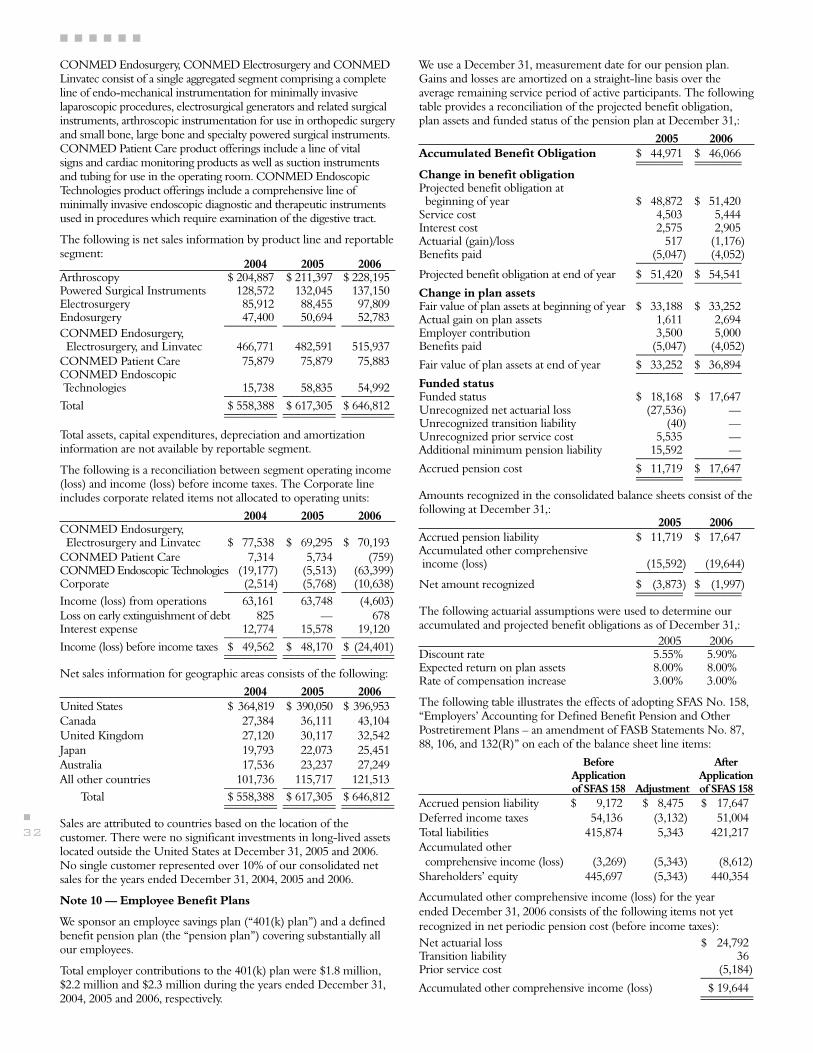
n
n n n n n n
32
CONMED Endosurgery, CONMED Electrosurgery and CONMED Linvatec consist of a single aggregated segment comprising a complete line of endo-mechanical instrumentation for minimally invasive laparoscopic procedures, electrosurgical generators and related surgical instruments, arthroscopic instrumentation for use in orthopedic surgery and small bone, large bone and specialty powered surgical instruments. CONMED Patient Care product offerings include a line of vital signs and cardiac monitoring products as well as suction instruments and tubing for use in the operating room. CONMED Endoscopic Technologies product offerings include a comprehensive line of minimally invasive endoscopic diagnostic and therapeutic instruments used in procedures which require examination of the digestive tract.
The following is net sales information by product line and reportable segment: 2004 2005 2006Arthroscopy $ 204,887 $ 211,397 $ 228,195Powered Surgical Instruments 128,572 132,045 137,150Electrosurgery 85,912 88,455 97,809Endosurgery 47,400 50,694 52,783 _________ _________ _________CONMED Endosurgery, Electrosurgery, and Linvatec 466,771 482,591 515,937CONMED Patient Care 75,879 75,879 75,883CONMED Endoscopic Technologies 15,738 58,835 54,992 _________ _________ _________Total $ 558,388 $ 617,305 $ 646,812 _________ _________ _________ _________ _________ _________
Total assets, capital expenditures, depreciation and amortization information are not available by reportable segment.
The following is a reconciliation between segment operating income (loss) and income (loss) before income taxes. The Corporate line includes corporate related items not allocated to operating units:
2004 2005 2006CONMED Endosurgery, Electrosurgery and Linvatec $ 77,538 $ 69,295 $ 70,193CONMED Patient Care 7,314 5,734 (759 )CONMED Endoscopic Technologies (19,177 ) (5,513 ) (63,399 )Corporate (2,514 ) (5,768 ) (10,638 ) _________ _________ _________Income (loss) from operations 63,161 63,748 (4,603 )Loss on early extinguishment of debt 825 — 678Interest expense 12,774 15,578 19,120 _________ _________ _________Income (loss) before income taxes $ 49,562 $ 48,170 $ (24,401 ) _________ _________ _________ _________ _________ _________
Net sales information for geographic areas consists of the following:
2004 2005 2006United States $ 364,819 $ 390,050 $ 396,953Canada 27,384 36,111 43,104United Kingdom 27,120 30,117 32,542Japan 19,793 22,073 25,451Australia 17,536 23,237 27,249All other countries 101,736 115,717 121,513 _________ _________ _________ Total $ 558,388 $ 617,305 $ 646,812 _________ _________ _________ _________ _________ _________
Sales are attributed to countries based on the location of the customer. There were no significant investments in long-lived assets located outside the United States at December 31, 2005 and 2006. No single customer represented over 10% of our consolidated net sales for the years ended December 31, 2004, 2005 and 2006.
Note 10 — Employee Benefit Plans
We sponsor an employee savings plan (“401(k) plan”) and a defined benefit pension plan (the “pension plan”) covering substantially all our employees.
Total employer contributions to the 401(k) plan were $1.8 million, $2.2 million and $2.3 million during the years ended December 31, 2004, 2005 and 2006, respectively.
We use a December 31, measurement date for our pension plan. Gains and losses are amortized on a straight-line basis over the average remaining service period of active participants. The following table provides a reconciliation of the projected benefit obligation, plan assets and funded status of the pension plan at December 31,:
2005 2006Accumulated Benefit Obligation $ 44,971 $ 46,066 ________ ________ ________ ________ Change in benefit obligationProjected benefit obligation at beginning of year $ 48,872 $ 51,420Service cost 4,503 5,444Interest cost 2,575 2,905Actuarial (gain)/loss 517 (1,176 )Benefits paid (5,047 ) (4,052 ) ________ ________ Projected benefit obligation at end of year $ 51,420 $ 54,541 ________ ________ Change in plan assetsFair value of plan assets at beginning of year $ 33,188 $ 33,252Actual gain on plan assets 1,611 2,694Employer contribution 3,500 5,000Benefits paid (5,047 ) (4,052 ) ________ ________ Fair value of plan assets at end of year $ 33,252 $ 36,894 ________ ________ Funded statusFunded status $ 18,168 $ 17,647Unrecognized net actuarial loss (27,536 ) —Unrecognized transition liability (40 ) —Unrecognized prior service cost 5,535 —Additional minimum pension liability 15,592 — ________ ________ Accrued pension cost $ 11,719 $ 17,647 ________ ________ ________ ________
Amounts recognized in the consolidated balance sheets consist of the following at December 31,: 2005 2006Accrued pension liability $ 11,719 $ 17,647Accumulated other comprehensive income (loss) (15,592 ) (19,644 ) ________ ________ Net amount recognized $ (3,873 ) $ (1,997 ) ________ ________ ________ ________
The following actuarial assumptions were used to determine our accumulated and projected benefit obligations as of December 31,: 2005 2006Discount rate 5.55% 5.90%Expected return on plan assets 8.00% 8.00%Rate of compensation increase 3.00% 3.00%
The following table illustrates the effects of adopting SFAS No. 158, “Employers’ Accounting for Defined Benefit Pension and Other Postretirement Plans – an amendment of FASB Statements No. 87, 88, 106, and 132(R)” on each of the balance sheet line items:
Before After Application Application of SFAS 158 Adjustment of SFAS 158
Accrued pension liability $ 9,172 $ 8,475 $ 17,647Deferred income taxes 54,136 (3,132 ) 51,004Total liabilities 415,874 5,343 421,217Accumulated other comprehensive income (loss) (3,269 ) (5,343 ) (8,612 )Shareholders’ equity 445,697 (5,343 ) 440,354
Accumulated other comprehensive income (loss) for the year ended December 31, 2006 consists of the following items not yet recognized in net periodic pension cost (before income taxes):Net actuarial loss $ 24,792Transition liability 36Prior service cost (5,184 ) _________ Accumulated other comprehensive income (loss) $ 19,644 _________ _________
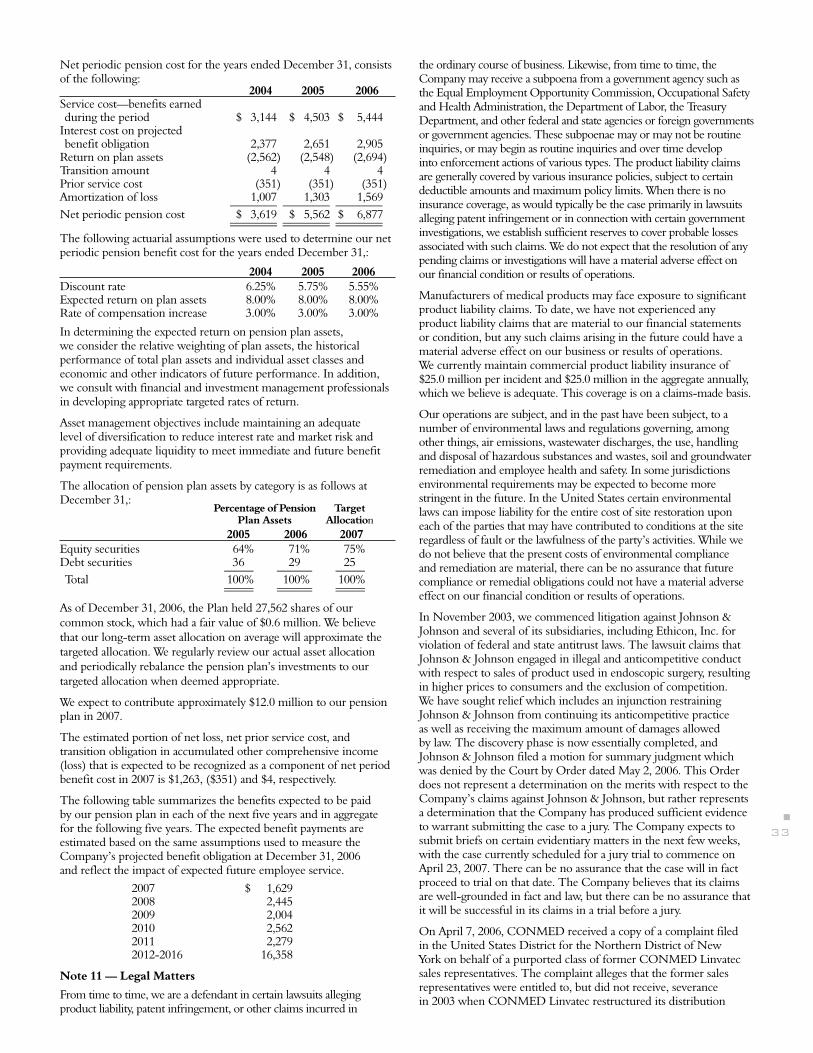
n
33
Net periodic pension cost for the years ended December 31, consists of the following: 2004 2005 2006Service cost—benefits earned during the period $ 3,144 $ 4,503 $ 5,444
Interest cost on projected benefit obligation 2,377 2,651 2,905
Return on plan assets (2,562 ) (2,548 ) (2,694 )Transition amount 4 4 4Prior service cost (351 ) (351 ) (351 )Amortization of loss 1,007 1,303 1,569 ________ ________ ________Net periodic pension cost $ 3,619 $ 5,562 $ 6,877 ________ ________ ________ ________ ________ ________
The following actuarial assumptions were used to determine our net periodic pension benefit cost for the years ended December 31,:
2004 2005 2006Discount rate 6.25% 5.75% 5.55%Expected return on plan assets 8.00% 8.00% 8.00%Rate of compensation increase 3.00% 3.00% 3.00%
In determining the expected return on pension plan assets, we consider the relative weighting of plan assets, the historical performance of total plan assets and individual asset classes and economic and other indicators of future performance. In addition, we consult with financial and investment management professionals in developing appropriate targeted rates of return.
Asset management objectives include maintaining an adequate level of diversification to reduce interest rate and market risk and providing adequate liquidity to meet immediate and future benefit payment requirements.
The allocation of pension plan assets by category is as follows at December 31,: Percentage of Pension Target Plan Assets Allocation 2005 2006 2007Equity securities 64% 71% 75%Debt securities 36 29 25 _____ ______ _____ Total 100% 100% 100% _____ ______ _____ _____ ______ _____ As of December 31, 2006, the Plan held 27,562 shares of our common stock, which had a fair value of $0.6 million. We believe that our long-term asset allocation on average will approximate the targeted allocation. We regularly review our actual asset allocation and periodically rebalance the pension plan’s investments to our targeted allocation when deemed appropriate.
We expect to contribute approximately $12.0 million to our pension plan in 2007.
The estimated portion of net loss, net prior service cost, and transition obligation in accumulated other comprehensive income (loss) that is expected to be recognized as a component of net period benefit cost in 2007 is $1,263, ($351) and $4, respectively.
The following table summarizes the benefits expected to be paid by our pension plan in each of the next five years and in aggregate for the following five years. The expected benefit payments are estimated based on the same assumptions used to measure the Company’s projected benefit obligation at December 31, 2006 and reflect the impact of expected future employee service.
2007 $ 1,6292008 2,4452009 2,0042010 2,5622011 2,2792012-2016 16,358
Note 11 — Legal Matters
From time to time, we are a defendant in certain lawsuits alleging product liability, patent infringement, or other claims incurred in
the ordinary course of business. Likewise, from time to time, the Company may receive a subpoena from a government agency such as the Equal Employment Opportunity Commission, Occupational Safety and Health Administration, the Department of Labor, the Treasury Department, and other federal and state agencies or foreign governments or government agencies. These subpoenae may or may not be routine inquiries, or may begin as routine inquiries and over time develop into enforcement actions of various types. The product liability claims are generally covered by various insurance policies, subject to certain deductible amounts and maximum policy limits. When there is no insurance coverage, as would typically be the case primarily in lawsuits alleging patent infringement or in connection with certain government investigations, we establish sufficient reserves to cover probable losses associated with such claims. We do not expect that the resolution of any pending claims or investigations will have a material adverse effect on our financial condition or results of operations.
Manufacturers of medical products may face exposure to significant product liability claims. To date, we have not experienced any product liability claims that are material to our financial statements or condition, but any such claims arising in the future could have a material adverse effect on our business or results of operations. We currently maintain commercial product liability insurance of $25.0 million per incident and $25.0 million in the aggregate annually, which we believe is adequate. This coverage is on a claims-made basis.
Our operations are subject, and in the past have been subject, to a number of environmental laws and regulations governing, among other things, air emissions, wastewater discharges, the use, handling and disposal of hazardous substances and wastes, soil and groundwater remediation and employee health and safety. In some jurisdictions environmental requirements may be expected to become more stringent in the future. In the United States certain environmental laws can impose liability for the entire cost of site restoration upon each of the parties that may have contributed to conditions at the site regardless of fault or the lawfulness of the party’s activities. While we do not believe that the present costs of environmental compliance and remediation are material, there can be no assurance that future compliance or remedial obligations could not have a material adverse effect on our financial condition or results of operations.
In November 2003, we commenced litigation against Johnson & Johnson and several of its subsidiaries, including Ethicon, Inc. for violation of federal and state antitrust laws. The lawsuit claims that Johnson & Johnson engaged in illegal and anticompetitive conduct with respect to sales of product used in endoscopic surgery, resulting in higher prices to consumers and the exclusion of competition. We have sought relief which includes an injunction restraining Johnson & Johnson from continuing its anticompetitive practice as well as receiving the maximum amount of damages allowed by law. The discovery phase is now essentially completed, and Johnson & Johnson filed a motion for summary judgment which was denied by the Court by Order dated May 2, 2006. This Order does not represent a determination on the merits with respect to the Company’s claims against Johnson & Johnson, but rather represents a determination that the Company has produced sufficient evidence to warrant submitting the case to a jury. The Company expects to submit briefs on certain evidentiary matters in the next few weeks, with the case currently scheduled for a jury trial to commence on April 23, 2007. There can be no assurance that the case will in fact proceed to trial on that date. The Company believes that its claims are well-grounded in fact and law, but there can be no assurance that it will be successful in its claims in a trial before a jury.
On April 7, 2006, CONMED received a copy of a complaint filed in the United States District for the Northern District of New York on behalf of a purported class of former CONMED Linvatec sales representatives. The complaint alleges that the former sales representatives were entitled to, but did not receive, severance in 2003 when CONMED Linvatec restructured its distribution
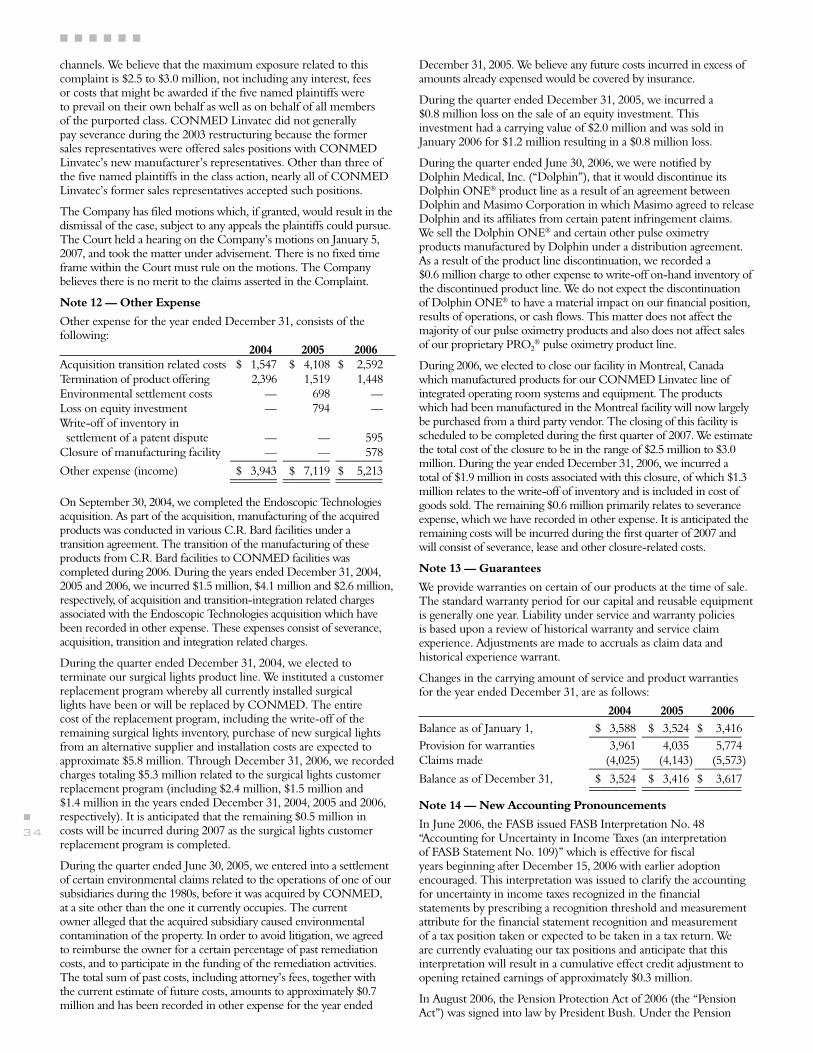
n
n n n n n n
34
channels. We believe that the maximum exposure related to this complaint is $2.5 to $3.0 million, not including any interest, fees or costs that might be awarded if the five named plaintiffs were to prevail on their own behalf as well as on behalf of all members of the purported class. CONMED Linvatec did not generally pay severance during the 2003 restructuring because the former sales representatives were offered sales positions with CONMED Linvatec’s new manufacturer’s representatives. Other than three of the five named plaintiffs in the class action, nearly all of CONMED Linvatec’s former sales representatives accepted such positions.
The Company has filed motions which, if granted, would result in the dismissal of the case, subject to any appeals the plaintiffs could pursue. The Court held a hearing on the Company’s motions on January 5, 2007, and took the matter under advisement. There is no fixed time frame within the Court must rule on the motions. The Company believes there is no merit to the claims asserted in the Complaint.
Note 12 — Other Expense
Other expense for the year ended December 31, consists of the following: 2004 2005 2006Acquisition transition related costs $ 1,547 $ 4,108 $ 2,592Termination of product offering 2,396 1,519 1,448Environmental settlement costs — 698 —Loss on equity investment — 794 —Write-off of inventory in settlement of a patent dispute — — 595Closure of manufacturing facility — — 578 ________ ________ ________Other expense (income) $ 3,943 $ 7,119 $ 5,213 ________ ________ ________ ________ ________ ________
On September 30, 2004, we completed the Endoscopic Technologies acquisition. As part of the acquisition, manufacturing of the acquired products was conducted in various C.R. Bard facilities under a transition agreement. The transition of the manufacturing of these products from C.R. Bard facilities to CONMED facilities was completed during 2006. During the years ended December 31, 2004, 2005 and 2006, we incurred $1.5 million, $4.1 million and $2.6 million, respectively, of acquisition and transition-integration related charges associated with the Endoscopic Technologies acquisition which have been recorded in other expense. These expenses consist of severance, acquisition, transition and integration related charges.
During the quarter ended December 31, 2004, we elected to terminate our surgical lights product line. We instituted a customer replacement program whereby all currently installed surgical lights have been or will be replaced by CONMED. The entire cost of the replacement program, including the write-off of the remaining surgical lights inventory, purchase of new surgical lights from an alternative supplier and installation costs are expected to approximate $5.8 million. Through December 31, 2006, we recorded charges totaling $5.3 million related to the surgical lights customer replacement program (including $2.4 million, $1.5 million and $1.4 million in the years ended December 31, 2004, 2005 and 2006, respectively). It is anticipated that the remaining $0.5 million in costs will be incurred during 2007 as the surgical lights customer replacement program is completed.
During the quarter ended June 30, 2005, we entered into a settlement of certain environmental claims related to the operations of one of our subsidiaries during the 1980s, before it was acquired by CONMED, at a site other than the one it currently occupies. The current owner alleged that the acquired subsidiary caused environmental contamination of the property. In order to avoid litigation, we agreed to reimburse the owner for a certain percentage of past remediation costs, and to participate in the funding of the remediation activities. The total sum of past costs, including attorney’s fees, together with the current estimate of future costs, amounts to approximately $0.7 million and has been recorded in other expense for the year ended
December 31, 2005. We believe any future costs incurred in excess of amounts already expensed would be covered by insurance.
During the quarter ended December 31, 2005, we incurred a $0.8 million loss on the sale of an equity investment. This investment had a carrying value of $2.0 million and was sold in January 2006 for $1.2 million resulting in a $0.8 million loss.
During the quarter ended June 30, 2006, we were notified by Dolphin Medical, Inc. (“Dolphin”), that it would discontinue its Dolphin ONE® product line as a result of an agreement between Dolphin and Masimo Corporation in which Masimo agreed to release Dolphin and its affiliates from certain patent infringement claims. We sell the Dolphin ONE® and certain other pulse oximetry products manufactured by Dolphin under a distribution agreement. As a result of the product line discontinuation, we recorded a $0.6 million charge to other expense to write-off on-hand inventory of the discontinued product line. We do not expect the discontinuation of Dolphin ONE® to have a material impact on our financial position, results of operations, or cash flows. This matter does not affect the majority of our pulse oximetry products and also does not affect sales of our proprietary PRO2
® pulse oximetry product line.
During 2006, we elected to close our facility in Montreal, Canada which manufactured products for our CONMED Linvatec line of integrated operating room systems and equipment. The products which had been manufactured in the Montreal facility will now largely be purchased from a third party vendor. The closing of this facility is scheduled to be completed during the first quarter of 2007. We estimate the total cost of the closure to be in the range of $2.5 million to $3.0 million. During the year ended December 31, 2006, we incurred a total of $1.9 million in costs associated with this closure, of which $1.3 million relates to the write-off of inventory and is included in cost of goods sold. The remaining $0.6 million primarily relates to severance expense, which we have recorded in other expense. It is anticipated the remaining costs will be incurred during the first quarter of 2007 and will consist of severance, lease and other closure-related costs.
Note 13 — Guarantees
We provide warranties on certain of our products at the time of sale. The standard warranty period for our capital and reusable equipment is generally one year. Liability under service and warranty policies is based upon a review of historical warranty and service claim experience. Adjustments are made to accruals as claim data and historical experience warrant.
Changes in the carrying amount of service and product warranties for the year ended December 31, are as follows:
2004 2005 2006Balance as of January 1, $ 3,588 $ 3,524 $ 3,416 ________ ________ ________Provision for warranties 3,961 4,035 5,774Claims made (4,025 ) (4,143 ) (5,573 ) ________ ________ ________Balance as of December 31, $ 3,524 $ 3,416 $ 3,617 ________ ________ ________ ________ ________ ________
Note 14 — New Accounting Pronouncements
In June 2006, the FASB issued FASB Interpretation No. 48 “Accounting for Uncertainty in Income Taxes (an interpretation of FASB Statement No. 109)” which is effective for fiscal years beginning after December 15, 2006 with earlier adoption encouraged. This interpretation was issued to clarify the accounting for uncertainty in income taxes recognized in the financial statements by prescribing a recognition threshold and measurement attribute for the financial statement recognition and measurement of a tax position taken or expected to be taken in a tax return. We are currently evaluating our tax positions and anticipate that this interpretation will result in a cumulative effect credit adjustment to opening retained earnings of approximately $0.3 million.
In August 2006, the Pension Protection Act of 2006 (the “Pension Act”) was signed into law by President Bush. Under the Pension
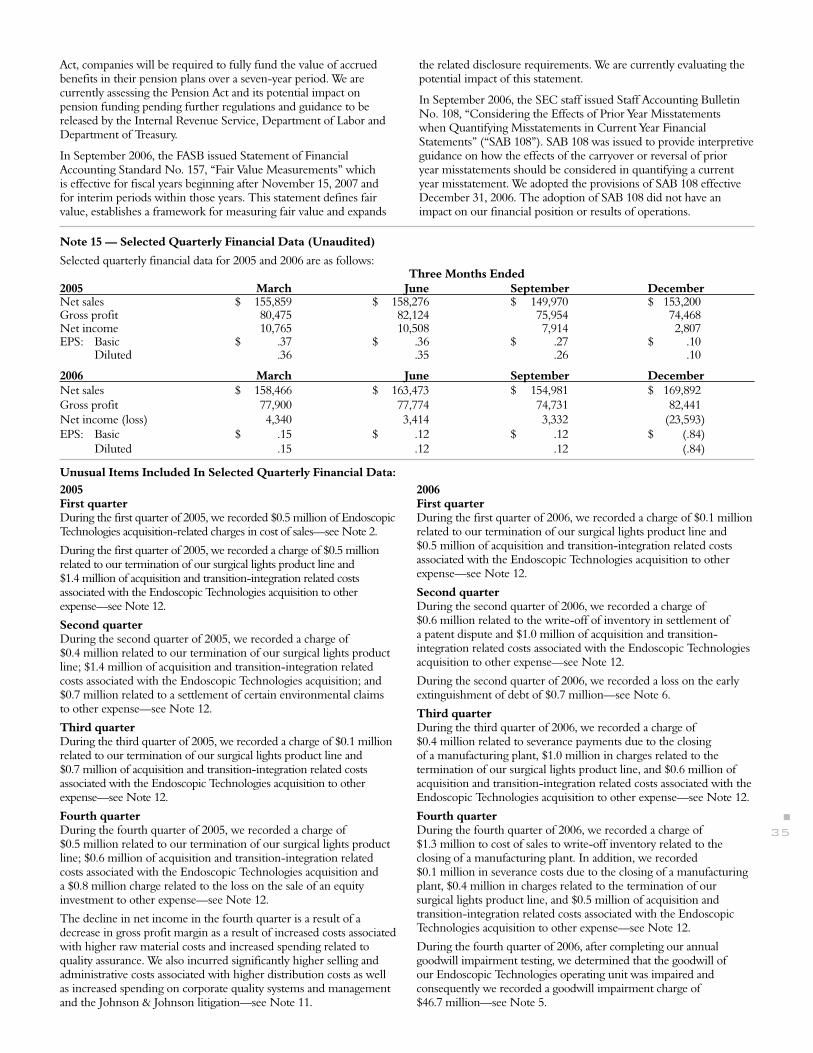
n
35
Act, companies will be required to fully fund the value of accrued benefits in their pension plans over a seven-year period. We are currently assessing the Pension Act and its potential impact on pension funding pending further regulations and guidance to be released by the Internal Revenue Service, Department of Labor and Department of Treasury.
In September 2006, the FASB issued Statement of Financial Accounting Standard No. 157, “Fair Value Measurements” which is effective for fiscal years beginning after November 15, 2007 and for interim periods within those years. This statement defines fair value, establishes a framework for measuring fair value and expands
the related disclosure requirements. We are currently evaluating the potential impact of this statement.
In September 2006, the SEC staff issued Staff Accounting Bulletin No. 108, “Considering the Effects of Prior Year Misstatements when Quantifying Misstatements in Current Year Financial Statements” (“SAB 108”). SAB 108 was issued to provide interpretive guidance on how the effects of the carryover or reversal of prior year misstatements should be considered in quantifying a current year misstatement. We adopted the provisions of SAB 108 effective December 31, 2006. The adoption of SAB 108 did not have an impact on our financial position or results of operations.
Note 15 — Selected Quarterly Financial Data (Unaudited)
Selected quarterly financial data for 2005 and 2006 are as follows: Three Months Ended2005 March June September DecemberNet sales $ 155,859 $ 158,276 $ 149,970 $ 153,200Gross profit 80,475 82,124 75,954 74,468Net income 10,765 10,508 7,914 2,807EPS: Basic $ .37 $ .36 $ .27 $ .10 Diluted .36 .35 .26 .10
2006 March June September DecemberNet sales $ 158,466 $ 163,473 $ 154,981 $ 169,892Gross profit 77,900 77,774 74,731 82,441Net income (loss) 4,340 3,414 3,332 (23,593 )EPS: Basic $ .15 $ .12 $ .12 $ (.84 ) Diluted .15 .12 .12 (.84 )
Unusual Items Included In Selected Quarterly Financial Data:2005First quarterDuring the first quarter of 2005, we recorded $0.5 million of Endoscopic Technologies acquisition-related charges in cost of sales—see Note 2.
During the first quarter of 2005, we recorded a charge of $0.5 million related to our termination of our surgical lights product line and $1.4 million of acquisition and transition-integration related costs associated with the Endoscopic Technologies acquisition to other expense—see Note 12.
Second quarterDuring the second quarter of 2005, we recorded a charge of $0.4 million related to our termination of our surgical lights product line; $1.4 million of acquisition and transition-integration related costs associated with the Endoscopic Technologies acquisition; and $0.7 million related to a settlement of certain environmental claims to other expense—see Note 12.
Third quarterDuring the third quarter of 2005, we recorded a charge of $0.1 million related to our termination of our surgical lights product line and $0.7 million of acquisition and transition-integration related costs associated with the Endoscopic Technologies acquisition to other expense—see Note 12.
Fourth quarterDuring the fourth quarter of 2005, we recorded a charge of $0.5 million related to our termination of our surgical lights product line; $0.6 million of acquisition and transition-integration related costs associated with the Endoscopic Technologies acquisition and a $0.8 million charge related to the loss on the sale of an equity investment to other expense—see Note 12.
The decline in net income in the fourth quarter is a result of a decrease in gross profit margin as a result of increased costs associated with higher raw material costs and increased spending related to quality assurance. We also incurred significantly higher selling and administrative costs associated with higher distribution costs as well as increased spending on corporate quality systems and management and the Johnson & Johnson litigation—see Note 11.
2006First quarterDuring the first quarter of 2006, we recorded a charge of $0.1 million related to our termination of our surgical lights product line and $0.5 million of acquisition and transition-integration related costs associated with the Endoscopic Technologies acquisition to other expense—see Note 12.
Second quarterDuring the second quarter of 2006, we recorded a charge of $0.6 million related to the write-off of inventory in settlement of a patent dispute and $1.0 million of acquisition and transition-integration related costs associated with the Endoscopic Technologies acquisition to other expense—see Note 12.
During the second quarter of 2006, we recorded a loss on the early extinguishment of debt of $0.7 million—see Note 6.
Third quarterDuring the third quarter of 2006, we recorded a charge of $0.4 million related to severance payments due to the closing of a manufacturing plant, $1.0 million in charges related to the termination of our surgical lights product line, and $0.6 million of acquisition and transition-integration related costs associated with the Endoscopic Technologies acquisition to other expense—see Note 12.
Fourth quarterDuring the fourth quarter of 2006, we recorded a charge of $1.3 million to cost of sales to write-off inventory related to the closing of a manufacturing plant. In addition, we recorded $0.1 million in severance costs due to the closing of a manufacturing plant, $0.4 million in charges related to the termination of our surgical lights product line, and $0.5 million of acquisition and transition-integration related costs associated with the Endoscopic Technologies acquisition to other expense—see Note 12.
During the fourth quarter of 2006, after completing our annual goodwill impairment testing, we determined that the goodwill of our Endoscopic Technologies operating unit was impaired and consequently we recorded a goodwill impairment charge of $46.7 million—see Note 5.

n
n n n n n n
36
1 EUGENE R. cORAsANTI is Vice Chairman of the Company and Chairman of the Board of Directors. Mr. Corasanti also served as the Company’s Chief Executive Officer from its founding until 2006, as well as President and Chief Operating Officer from its founding until August 1999. Prior to the founding of the Company, Mr. Corasanti was an independent public accountant. Mr. Corasanti holds a B.B.A. degree in Accounting from Niagara University. Eugene R. Corasanti’s son, Joseph J. Corasanti, is President and Chief Executive Officer and a Director of the Company.
2 JOsEPH J. cORAsANTI has served as President and Chief Executive Officer since January 1, 2007, having served as President and Chief Operating Officer from August 1999 through December 2006. Mr. Corasanti has been a Director of the Company since May 1994. Mr. Corasanti is also on the Board of Directors of II-VI, Inc. He previously served as General Counsel and Vice President-Legal Affairs, and Executive Vice-President/General Manager of the Company. Prior to that time he was an Associate Attorney with the law firm of Morgan, Wenzel & McNicholas. Mr. Corasanti holds a B.A. degree in Political Science from Hobart College and a J.D. degree from Whittier College School of Law. Joseph J. Corasanti is the son of Eugene R. Corasanti, Vice Chairman and Chairman of the Board of Directors.
3 bRUcE F. dANIELs has served as a Director of the Company since August 1992. Mr. Daniels is a retired executive. From August 1974 to June 1997, Mr. Daniels held various executive positions, including a position as Controller with Chicago Pneumatic Tool Company. Mr. Daniels holds a B.S. degree in Business from Utica College of Syracuse University.
4 JO ANN GOLdEN joined the Board of Directors in 2003. Ms. Golden is a certified public accountant and managing partner of the New Hartford, NY office of Dermody Burke and Brown, CPAs, LLC. Ms. Golden is past President of the New York State Society of CPAs and the New York State Society’s Foundation for Accounting Education. She also served as Secretary and Vice President of the State Society and was a member of the governing Council of the American Institute of Certified Public Accountants, where she served on the Global Credential Survey Task Force in 2001. Ms. Golden holds a B.A. degree from the State University College at New Paltz, and a B.S. degree in Accounting from Utica College of Syracuse University.
5 sTEPHEN M. MANdIA has served as a Director of the Company since July 2002. Mr. Mandia has been Chief Executive Officer of East Coast Olive Oil Corp. since 1991. Mr. Mandia also possesses financial ownership and sits on the Board of Gem Packing Corp., Utica Plastics, LLC, ECOO Realty Corp., Olive Transport Corp. and Northside Gourmet Corp. Mr. Mandia holds a B.S. degree from Bentley College, having also undertaken undergraduate studies at Richmond College in London.
6 wILLIAM d. MATTHEws has served as a Director of the Company since August 1997. From 1986 until retiring from the positions in 1999, Mr. Matthews was the Chairman of the Board and the Chief Executive Officer of Oneida Ltd. Mr. Matthews is the Chairman of the Board of Directors and a member of the audit committee of Oneida Financial Corporation, and a former director of Coyne Textile Services. Mr. Matthews holds a B.A. degree from Union College and an L.L.B. degree from Cornell University School of Law.
7 sTUART J. scHwARTZ has served as a Director of the Company since May 1998. Dr. Schwartz is a retired physician. From 1969 to December 1997 he was engaged in private practice as a urologist. Dr. Schwartz holds a B.A. degree from Cornell University and an M.D. degree from SUNY Upstate Medical College, Syracuse.
board of directors n biographies
1 2 3 4 5 6 7

executive and Senior officers
Joseph J. corasanti, esq.President and cEO
william w. abrahamsenior vice President
thomas m. aceyTreasurer and secretary
daniel S. Jonas, esq.General counsel and vice President – Legal Affairs
alexander r. Jonesvice President – corporate sales
Jane e. metcalfvice President – corporate Regulatory Affairs
david r. murrayPresident – cONMEd Electrosurgery
luke a. pomiliovice President – corporate controller
robert d. Shallish, Jr.vice President – Finance and chief Financial Officer
John J. Stottsvice President – cONMEd Patient care
dennis m. wergervice President, General Manager – cONMEd Endoscopic Technologies
Frank r. williams vice President – cONMEd Endosurgery
gerald g. woodardPresident – cONMEd Linvatec
Shareholder information
interested shareholders may obtain a copy of the company’s Form 10-k without charge upon written request to:Investor Relations department cONMEd corporation 525 French Road Utica, NY 13502
transfer agent/registrarRegistrar and Transfer company 10 commerce drive cranford, NJ 07016
StockThe NAsdAQ stock Market® stock symbol: cNMd
independent registered public accounting FirmPricewaterhousecoopers LLP One Lincoln center syracuse, NY 13202
general counseldaniel s. Jonas, Esq. 525 French Road Utica, NY 13502
Special counselsullivan & cromwell 125 broad street New York, NY 10004
corporate officescONMEd corporation 525 French Road Utica, NY 13502 Phone (315) 797-8375 Fax (315) 797-0321customer service 1-800-448-6506 email: [email protected]: www.conmed.com
ethics policy Available at www.conmed.com
operating Subsidiaries cONMEd ElectrosurgerycONMEd Endoscopic TechnologiescONMEd Integrated systems canadacONMEd Linvatec cONMEd Linvatec AustraliacONMEd Linvatec AustriacONMEd Linvatec belgiumcONMEd Linvatec biomaterialscONMEd Linvatec canadacONMEd Linvatec deutschlandcONMEd Linvatec EuropecONMEd Linvatec FrancecONMEd Linvatec IsraelcONMEd Linvatec koreacONMEd Linvatec NederlandcONMEd Linvatec PolandcONMEd Linvatec spaincONMEd Linvatec U.k.cONMEd Receivables corporationD
esig
ned
by R
oman
elli
Com
mun
icat
ions
officers n shareholder information n subsidiaries

525 FRENcH ROAd, UTIcA, NY 13502 UsA
©cONMEd cORPORATION 4/07, ??M, PRINTEd IN THE U.s.A.