Embed Size (px)
Citation preview
7/27/2011
1
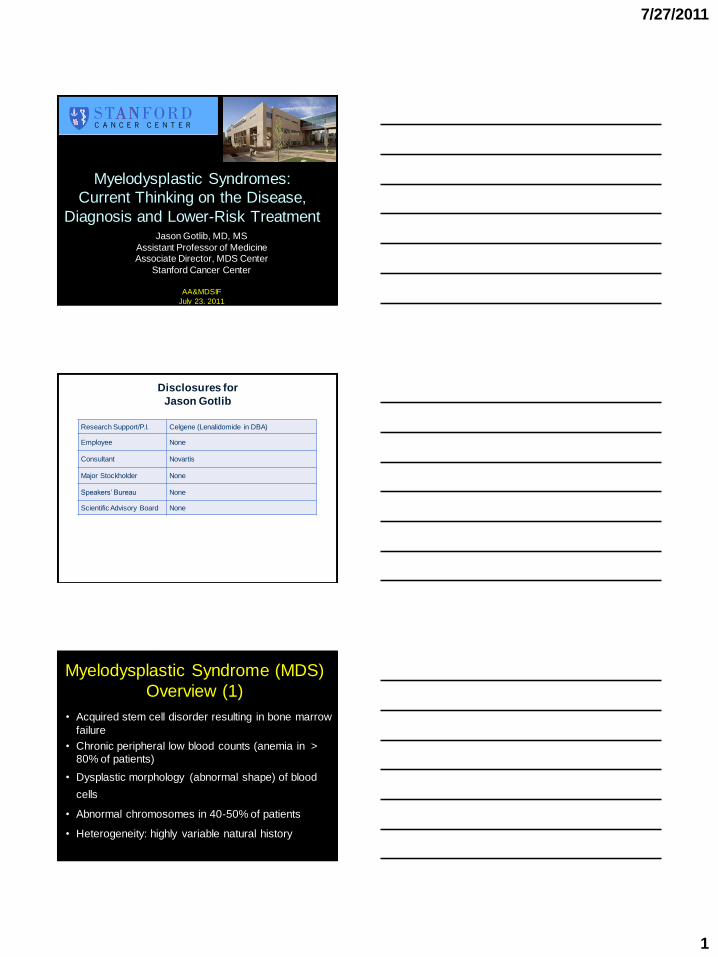
Myelodysplastic Syndromes:
Current Thinking on the Disease,
Diagnosis and Lower-Risk TreatmentJason Gotlib, MD, MS
Assistant Professor of MedicineAssociate Director, MDS Center
Stanford Cancer Center
AA&MDSIF
July 23, 2011
Disclosures for
Jason Gotlib
Research Support/P.I. Celgene (Lenalidomide in DBA)
Employee None
Consultant Novartis
Major Stockholder None
Speakers’ Bureau None
Scientific Advisory Board None
Myelodysplastic Syndrome (MDS)
Overview (1)
• Acquired stem cell disorder resulting in bone marrow
failure
• Chronic peripheral low blood counts (anemia in >
80% of patients)
• Dysplastic morphology (abnormal shape) of blood
cells
• Abnormal chromosomes in 40-50% of patients
• Heterogeneity: highly variable natural history

7/27/2011
2
Myelodysplastic Syndrome (MDS)
Overview (2)Morbidity/mortality relate to:
• Cytopenia-related complications
(fatigue, infection, bleeding)
• Evolution to acute myeloid leukemia (30- 40% of
patients)
• Patients’ advanced age / co-morbidities
• Iron overload from chronic RBC transfusions
Age (Median) Newly diagnosed 71 years
Established 72-75 years
Sex (Mean) Male (Newly diagnosed)
(Established)
55%
51-57%
Duration of MDS
(Median)13-16 months
MDS Status Primary 88 – 93%
Secondary 7 – 12%
Secondary Chemotherapy 55 – 80%
Cause Radiation 6 – 21%
Chemical exposure 2 – 9%
Cross-sectional analysis of 4514 MDS patients in the
U.S. in 2005-2007
U.S. MDS Characteristics
Sekeres et al. J National Cancer Inst 2008;100:1542
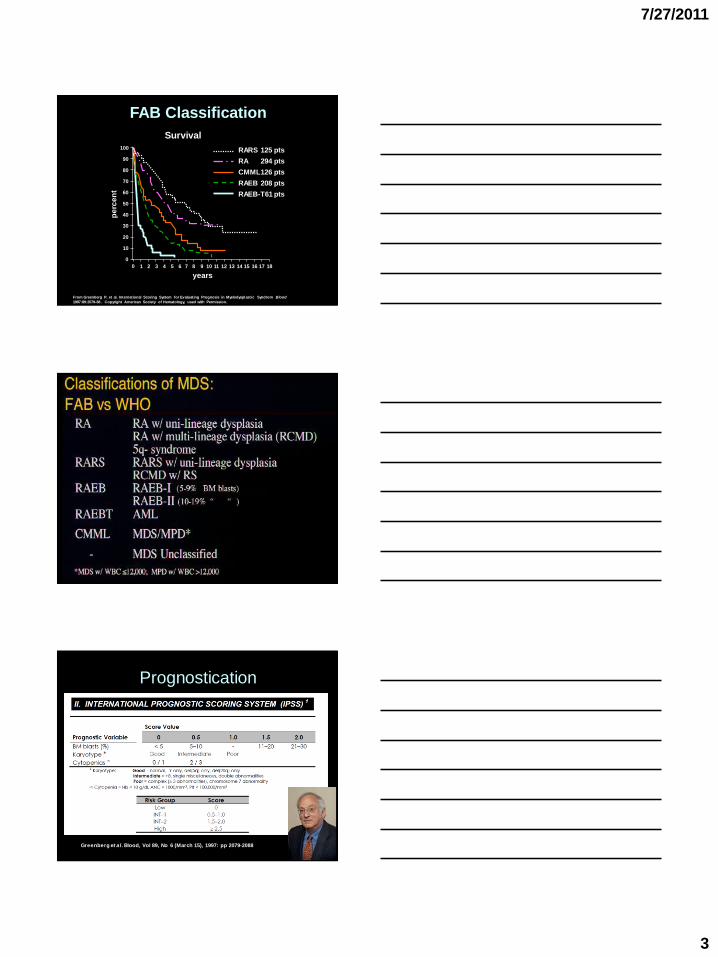
FAB Classification (1982)Name (Abbreviation) BM Blast PB Blasts RS
Refractory anemia (RA) 0-5% 0% <15%
Refractory anemia 0-5% 0% >15%
with ringed sideroblasts (RARS)
Refractory anemia 6-19% 1-4% Variable
with excess blasts (RAEB)
Chronic myelomonocytic leukemia 0-19% 1-4% <15%
(CMML)
Refractory anemia with excess 20-29% 5-29% Variable
blasts in transformation (RAEB-T)
Bennett JM, et al. Br J Haematol 1982. 51:189-199.
Steensma DP, et al. Leukemia Research 2003. 27: 95-120.
List AF, et al. The Myelodysplastic Syndromes. In: W introbe’s Hematology 2003.Silverman LR. The Myelodysplastic Syndromes. In: Cancer Medicine. 2000.
Classifies MDS according to morphology and % of myeloblasts in
the bone marrow and peripheral blood
7/27/2011
3
From Greenberg P, et al. International Scoring System for Evaluating Prognosis in Myelodysplastic Syndrom Blood
1997:89:2079-88. Copyright American Society of Hematology, used with Permission.
FAB Classification
years
pe
rce
nt
Survival
125 pts
294 pts
126 pts
208 pts
61 pts
RARS
RA
CMML
RAEB
RAEB-T
100
90
80
70
60
50
40
30
20
10
0
0 1 2 3 4 5 6 7 8 9 10 11 12 13 14 15 16 17 18
Prognostication
Greenberg et al. Blood, Vol 89, No 6 (March 15), 1997: pp 2079-2088
7/27/2011
4
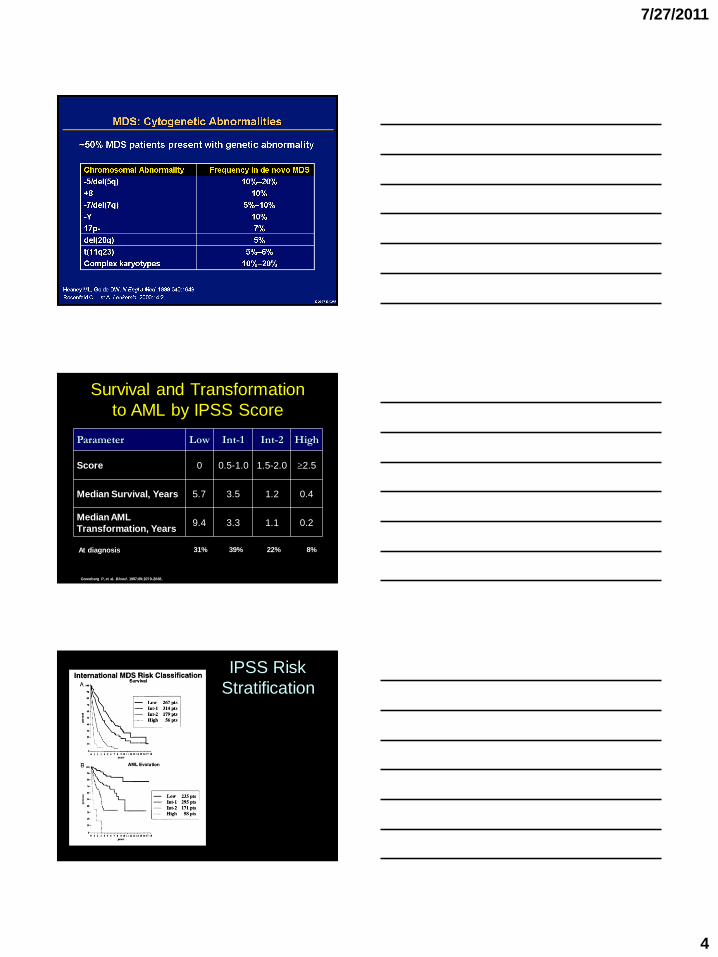
Survival and Transformation
to AML by IPSS Score
Parameter Low Int-1 Int-2 High
Score 0 0.5-1.0 1.5-2.0 2.5
Median Survival, Years 5.7 3.5 1.2 0.4
Median AML
Transformation, Years9.4 3.3 1.1 0.2
At diagnosis
Greenberg P, et al. Blood. 1997;89:2079-2088.
31% 39% 22% 8%
IPSS Risk
Stratification
7/27/2011
5
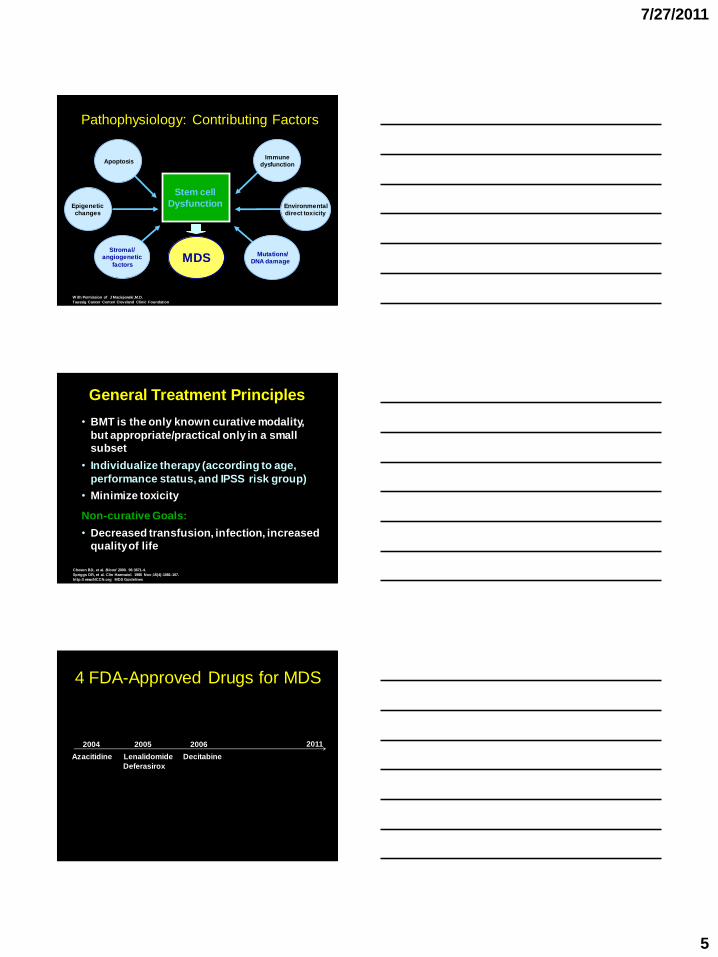
Pathophysiology: Contributing Factors
W ith Permission of J Maciejewski,M.D.
Taussig Cancer Center/ Cleveland Clinic Foundation
MDS
Stem cell dysfunction
Stem cell
Dysfunction
Apoptosis
Stromal/angiogenetic
factors
Epigenetic changes
Immunedysfunction
Environmentaldirect toxicity
Mutations/DNA damage
• BMT is the only known curative modality,
but appropriate/practical only in a small
subset
• Individualize therapy (according to age,
performance status, and IPSS risk group)
• Minimize toxicity
Non-curative Goals:
• Decreased transfusion, infection, increased
quality of life
General Treatment Principles
Cheson BD, et al. Blood 2000. 96:3671-4.
Spriggs DR, et al. Clin Haematol. 1986 Nov;15(4):1081-107.
http:// www.NCCN.org MDS Guidelines
4 FDA-Approved Drugs for MDS
2004 2005 2006 2011
Azacitidine Lenalidomide Decitabine
Deferasirox
7/27/2011
6
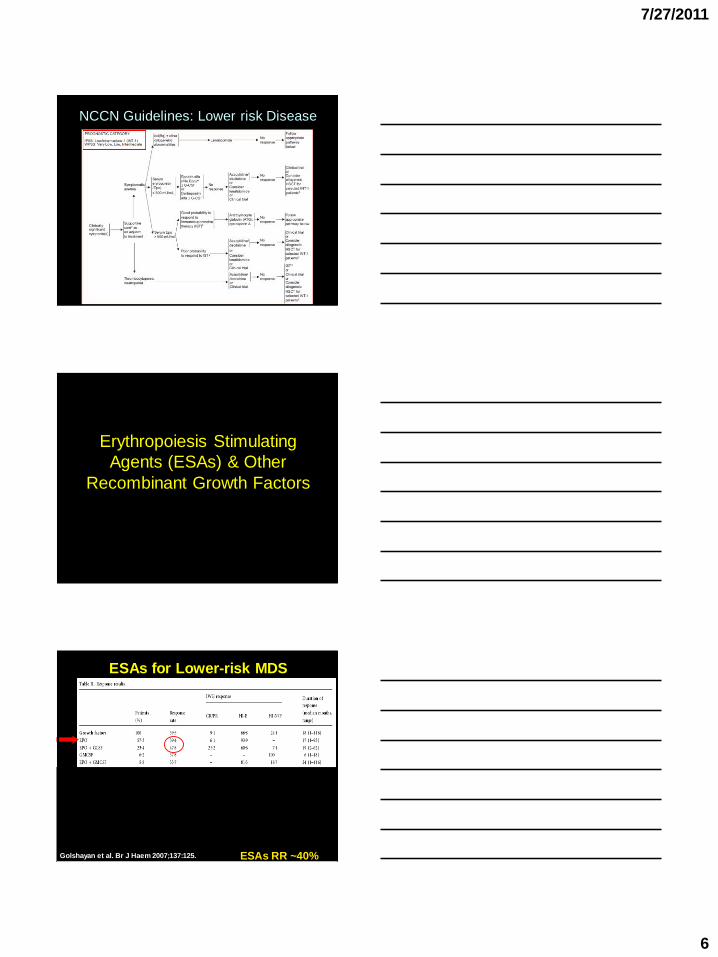
NCCN Guidelines: Lower risk Disease
Erythropoiesis Stimulating
Agents (ESAs) & Other
Recombinant Growth Factors
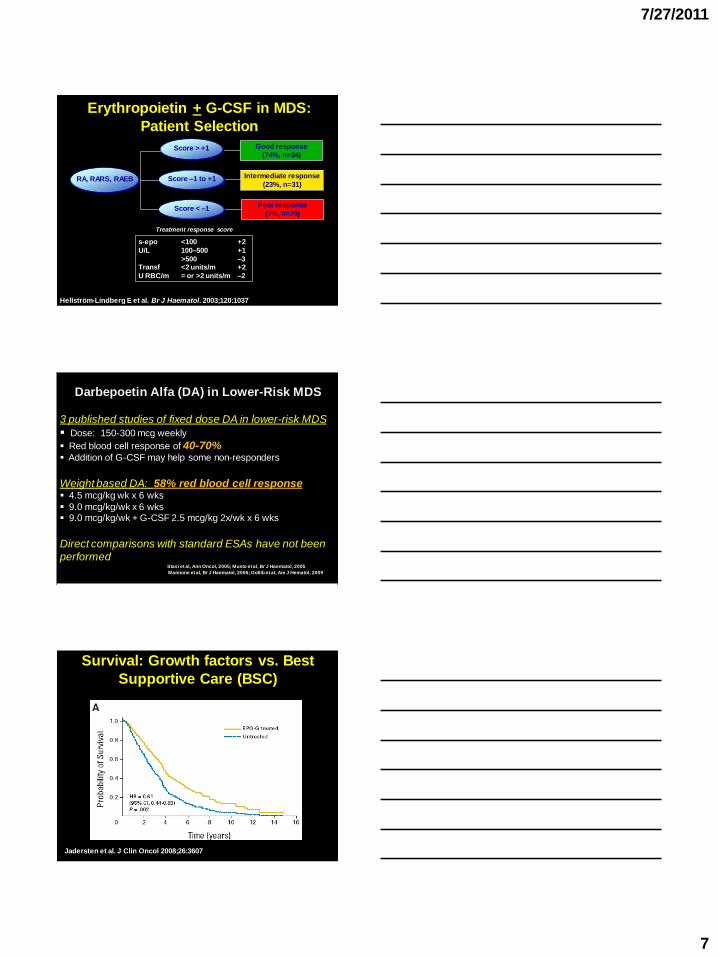
ESAs for Lower-risk MDS
Golshayan et al. Br J Haem 2007;137:125. ESAs RR ~40%
7/27/2011
7
Erythropoietin + G-CSF in MDS:
Patient Selection
Hellström-Lindberg E et al. Br J Haematol. 2003;120:1037
Good response
(74%, n=34)
Intermediate response
(23%, n=31)
Poor response
(7%, n=29)
s-epo <100 +2
U/L 100–500 +1
>500 –3Transf <2 units/m +2
U RBC/m = or >2 units/m –2
Treatment response score
RA, RARS, RAEB
Score > +1
Score –1 to +1
Score < –1
Darbepoetin Alfa (DA) in Lower-Risk MDS
3 published studies of fixed dose DA in lower-risk MDS
Dose: 150-300 mcg weekly
Red blood cell response of 40-70% Addition of G-CSF may help some non-responders
Weight based DA: 58% red blood cell response 4.5 mcg/kg wk x 6 wks
9.0 mcg/kg/wk x 6 wks 9.0 mcg/kg/wk + G-CSF 2.5 mcg/kg 2x/wk x 6 wks
Direct comparisons with standard ESAs have not been
performedStasi et al, Ann Oncol, 2005; Musto et al, Br J Haematol, 2005
Mannone et al, Br J Haematol, 2006; Gotlib et al, Am J Hematol, 2009
Survival: Growth factors vs. Best
Supportive Care (BSC)
Jadersten et al. J Clin Oncol 2008;26:3607
7/27/2011
8
ESAs: Summary
• ESAs are used widely in MDS
• They work in approximately 40% of patients
• EPO+G-CSF upfront for RARS patients
• We have ways of determining in whom they will work best
• They may provide a survival advantage compared to no growth factors or transfusions
• There is no data to suggest that ESAs cause harm in MDS as
it relates to increasing the risk of leukemia, or decreasing overall survival
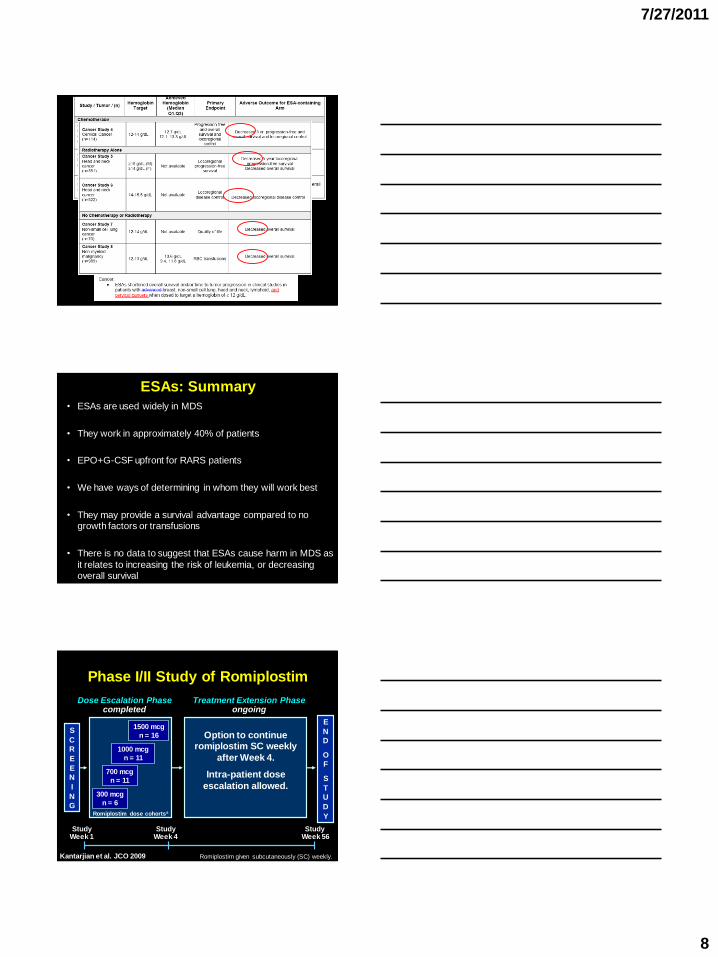
Phase I/II Study of Romiplostim
S
C
R
E
E
N
I
N
G
Dose Escalation Phasecompleted
Treatment Extension Phaseongoing
Study Week 1
Study Week 4
Option to continue romiplostim SC weekly
after Week 4.
Intra-patient dose
escalation allowed.
E
N
D
O
F
S
T
U
D
Y
1000 mcg
n = 11
300 mcg
n = 6
700 mcg
n = 11
1500 mcg
n = 16
Romiplostim dose cohortsa
StudyWeek 56
Romiplostim given subcutaneously (SC) weekly.Kantarjian et al. JCO 2009
7/27/2011
9
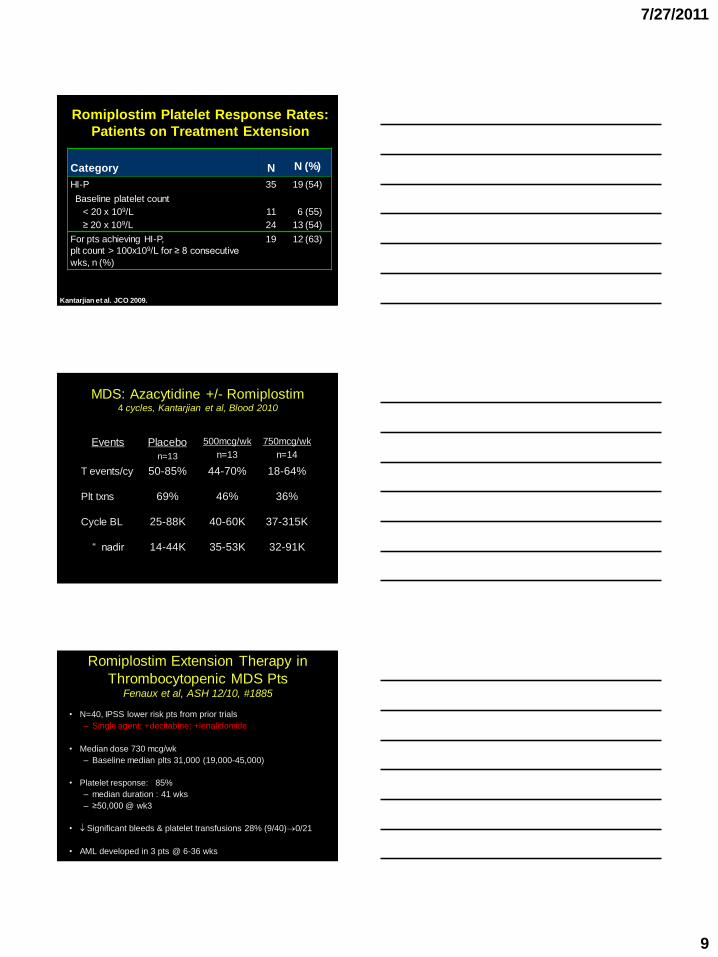
Romiplostim Platelet Response Rates:
Patients on Treatment Extension
Category N N (%)
HI-P 35 19 (54)
Baseline platelet count
< 20 x 109/L 11 6 (55)
≥ 20 x 109/L 24 13 (54)
For pts achieving HI-P,
plt count > 100x109/L for ≥ 8 consecutive
wks, n (%)
19 12 (63)
Kantarjian et al. JCO 2009.
MDS: Azacytidine +/- Romiplostim4 cycles, Kantarjian et al, Blood 2010
Events Placebo
n=13
500mcg/wk
n=13
750mcg/wk
n=14
T events/cy 50-85% 44-70% 18-64%
Plt txns 69% 46% 36%
Cycle BL 25-88K 40-60K 37-315K
“ nadir 14-44K 35-53K 32-91K
Romiplostim Extension Therapy in
Thrombocytopenic MDS PtsFenaux et al, ASH 12/10, #1885
• N=40, IPSS lower risk pts from prior trials
– Single agent; +decitabine; +lenalidomide
• Median dose 730 mcg/wk
– Baseline median plts 31,000 (19,000-45,000)
• Platelet response: 85%
– median duration : 41 wks
– ≥50,000 @ wk3
• Significant bleeds & platelet transfusions 28% (9/40)0/21
• AML developed in 3 pts @ 6-36 wks
7/27/2011
10
Romiplostim: Summary
• Platelet responses in 54% of patients; independent of baseline platelet count(≥ 20 x 109/L or < 20 x 109/L)
• Achieving platelet response associated with:
–Fewer transfusions, bleeding events
• Evaluation as a single agent and in combination with AZA, DAC, LEN.
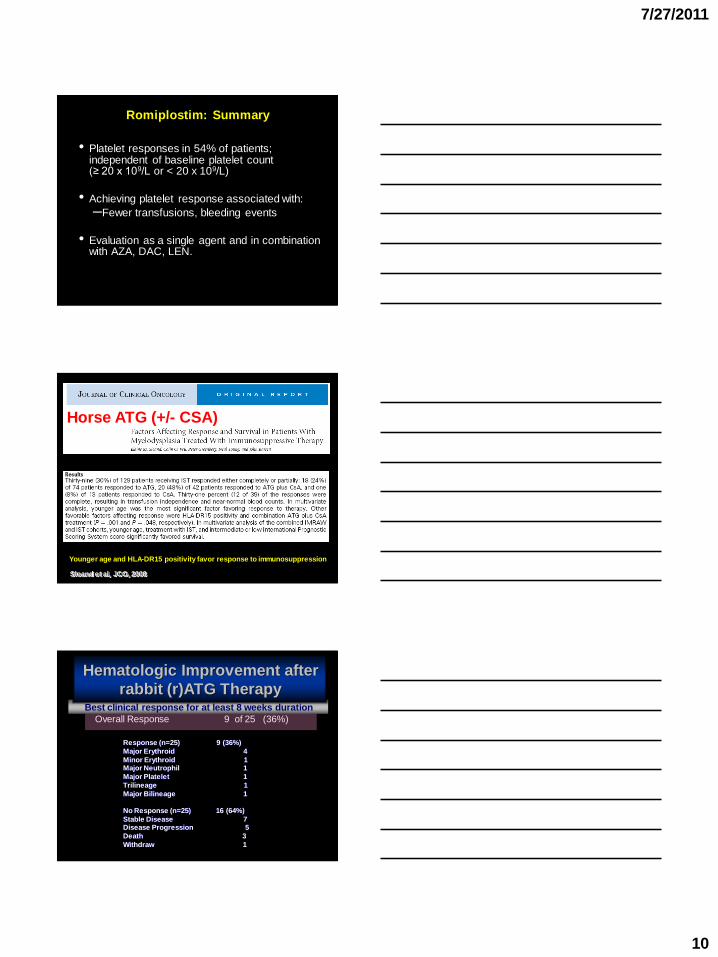
Sloand et al, JCO, 2008
Horse ATG (+/- CSA)
Younger age and HLA-DR15 positivity favor response to immunosuppression
Overall Response 9 of 25 (36%)
Best clinical response for at least 8 weeks duration
Hematologic Improvement after
rabbit (r)ATG Therapy
Response (n=25) 9 (36%)
Major Erythroid 4
Minor Erythroid 1Major Neutrophil 1
Major Platelet 1
Trilineage 1
Major Bilineage 1
No Response (n=25) 16 (64%)
Stable Disease 7Disease Progression 5
Death 3
Withdraw 1
7/27/2011
11
o Median time to respond was 75 days (range 3 days-114 days)
o Median duration of response was 8.2 months (range 4 months to >22.2 months at time of last follow up)
o No difference observed in time to respond or duration of response by age, HLA-DR15 or IPSS classification
o Two responders progressed during long-term follow up
Median time to progress 17 months (range 12.4 – 21.5 months)
Int-2 at baseline
Time to Respond and Durability
of Response to rATG
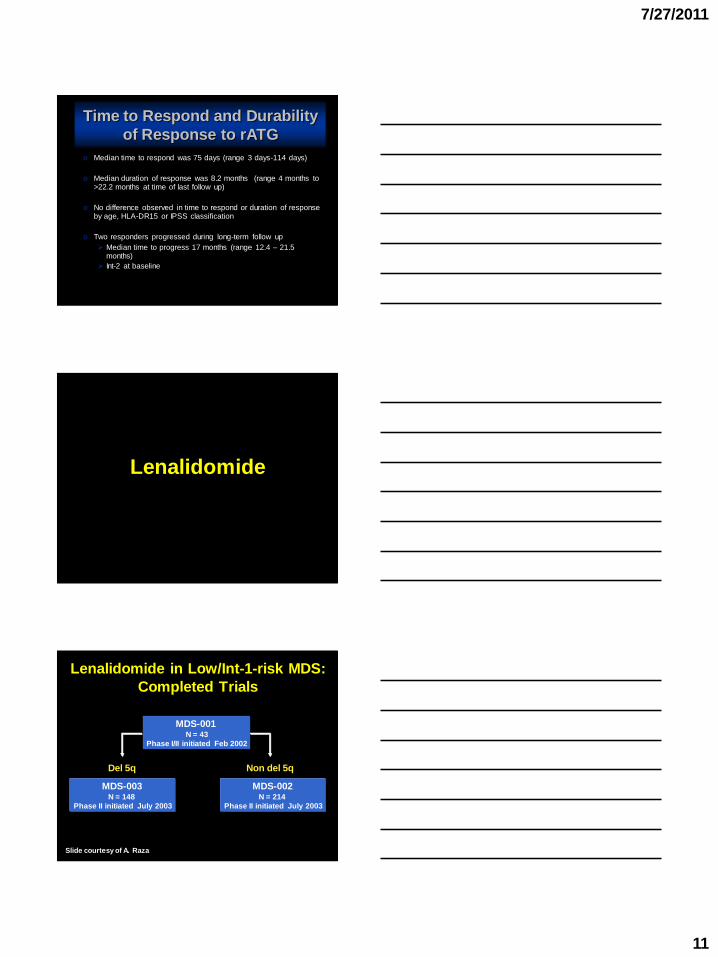
Lenalidomide
MDS-001 N = 43
Phase I/II initiated Feb 2002
Del 5q
MDS-003 N = 148
Phase II initiated July 2003
MDS-002 N = 214
Phase II initiated July 2003
Non del 5q
Lenalidomide in Low/Int-1-risk MDS:
Completed Trials
Slide courtesy of A. Raza
7/27/2011
12
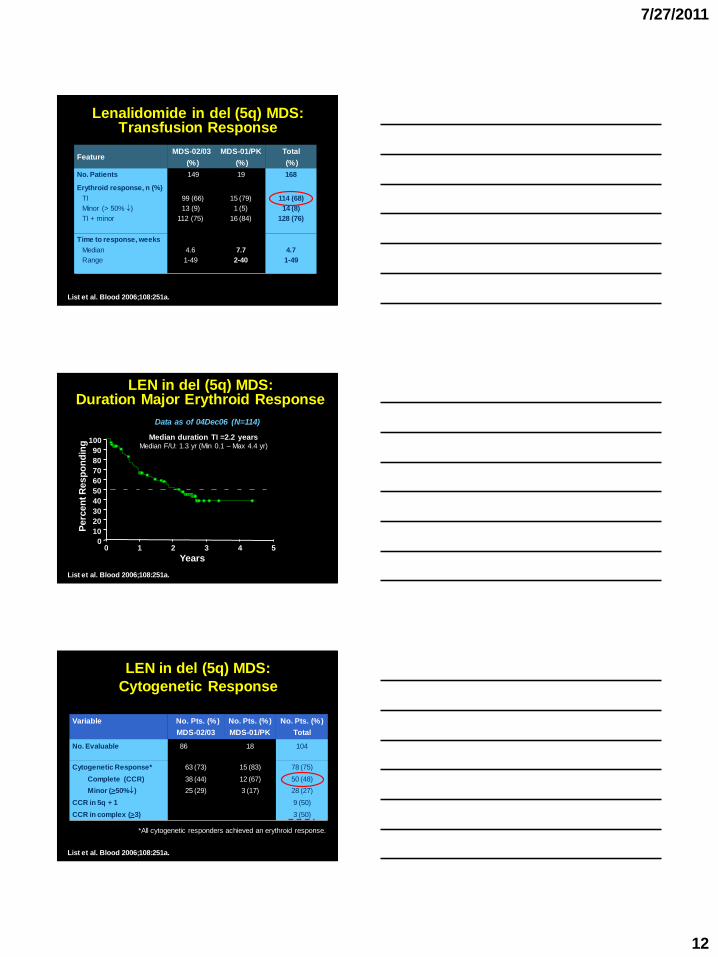
Lenalidomide in del (5q) MDS: Transfusion Response
FeatureMDS-02/03
(%)
MDS-01/PK
(%)
Total
(%)
No. Patients 149 19 168
Erythroid response, n (%)
TI
Minor (> 50% )
TI + minor
99 (66)
13 (9)
112 (75)
15 (79)
1 (5)
16 (84)
114 (68)
14 (8)
128 (76)
Time to response, weeks
Median
Range
4.6
1-49
7.7
2-40
4.7
1-49
List et al. Blood 2006;108:251a.
LEN in del (5q) MDS: Duration Major Erythroid Response
0 1 2 3 4 50
10
20
30
40
50
60
70
80
90
100
Years
Perc
en
t R
esp
on
din
g
Median duration TI =2.2 yearsMedian F/U: 1.3 yr (Min 0.1 – Max 4.4 yr)
Data as of 04Dec06 (N=114)
List et al. Blood 2006;108:251a.
Variable No. Pts. (%)
MDS-02/03
No. Pts. (%)
MDS-01/PK
No. Pts. (%)
Total
No. Evaluable 86 18 104
Cytogenetic Response*
Complete (CCR)
Minor (>50%)
CCR in 5q + 1
CCR in complex (>3)
63 (73)
38 (44)
25 (29)
15 (83)
12 (67)
3 (17)
78 (75)
50 (48)
28 (27)
9 (50)
3 (50)
LEN in del (5q) MDS:
Cytogenetic Response
*All cytogenetic responders achieved an erythroid response.
List et al. Blood 2006;108:251a.
7/27/2011
13
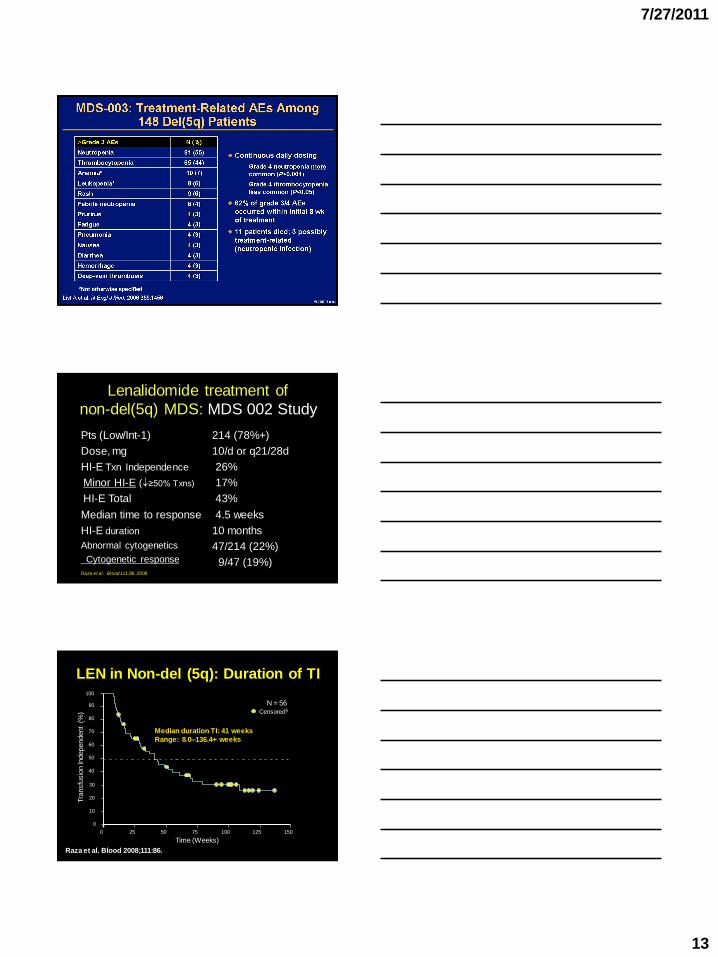
Lenalidomide treatment of
non-del(5q) MDS: MDS 002 Study
Pts (Low/Int-1)
Dose, mg
HI-E Txn Independence
Minor HI-E (≥50% Txns)
HI-E Total
Median time to response
HI-E duration
Abnormal cytogenetics
Cytogenetic response
214 (78%+)
10/d or q21/28d
26%
17%
43%
4.5 weeks
10 months
47/214 (22%)
9/47 (19%)Raza et al. Blood 111:86, 2008
LEN in Non-del (5q): Duration of TI
0 25 50 75 100 125 150
0
10
20
30
40
50
60
70
80
90
100
Time (Weeks)
Tra
nsfu
sio
n In
dependent
(%)
Median duration TI: 41 weeks
Range: 8.0–136.4+ weeks
Censored§
N = 56
Raza et al. Blood 2008;111:86.
7/27/2011
14
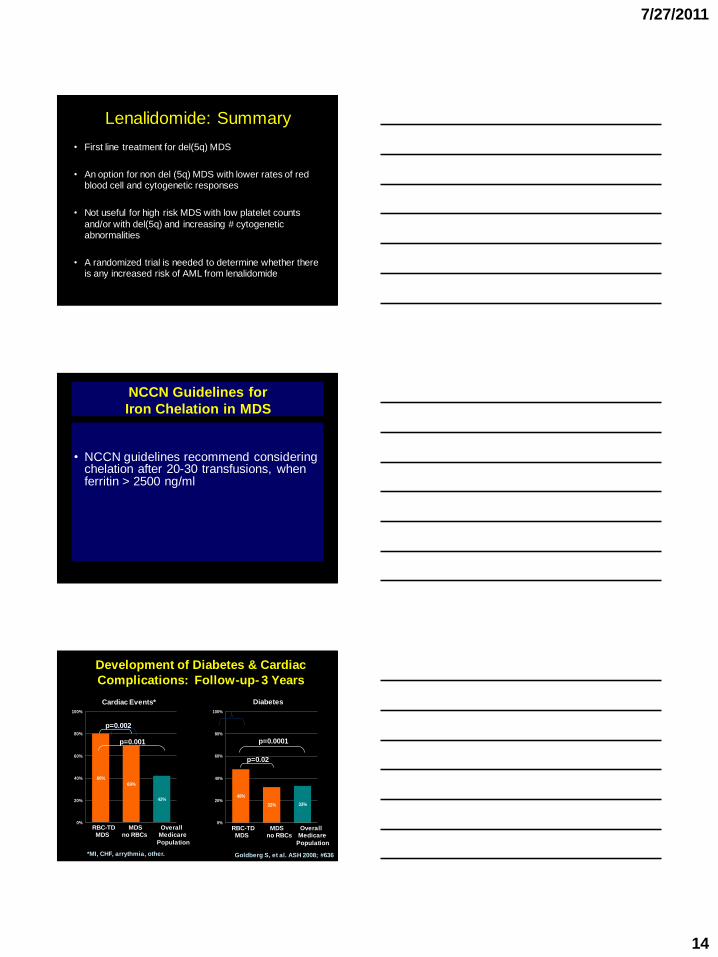
Lenalidomide: Summary
• First line treatment for del(5q) MDS
• An option for non del (5q) MDS with lower rates of red blood cell and cytogenetic responses
• Not useful for high risk MDS with low platelet counts
and/or with del(5q) and increasing # cytogenetic abnormalities
• A randomized trial is needed to determine whether there is any increased risk of AML from lenalidomide
NCCN Guidelines for
Iron Chelation in MDS
• NCCN guidelines recommend considering chelation after 20-30 transfusions, when ferritin > 2500 ng/ml
Development of Diabetes & Cardiac
Complications: Follow-up- 3 Years
48%
32% 33%
0%
20%
40%
60%
80%
100%
p=0.0001
p=0.02
Diabetes
RBC-TD MDS OverallMDS no RBCs Medicare
Population
80%
69%
42%
0%
20%
40%
60%
80%
100%
Cardiac Events*
*MI, CHF, arrythmia, other.
RBC-TD MDS OverallMDS no RBCs Medicare
Population
p=0.001
p=0.002
Goldberg S, et al. ASH 2008; #636
7/27/2011
15
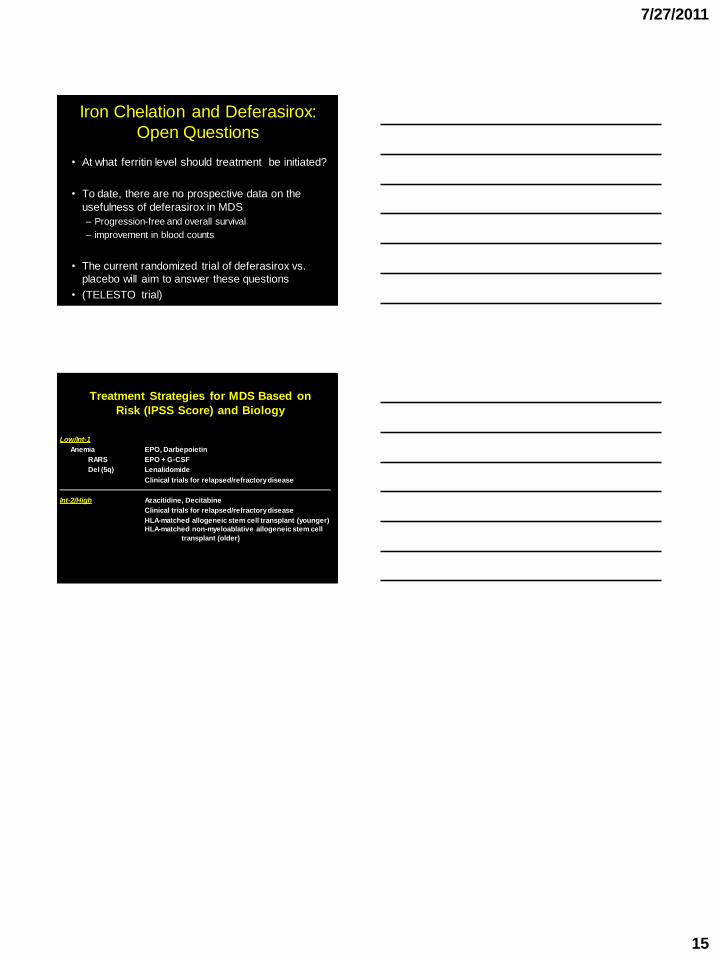
Iron Chelation and Deferasirox:
Open Questions
• At what ferritin level should treatment be initiated?
• To date, there are no prospective data on the
usefulness of deferasirox in MDS
– Progression-free and overall survival
– improvement in blood counts
• The current randomized trial of deferasirox vs.
placebo will aim to answer these questions
• (TELESTO trial)
Treatment Strategies for MDS Based on
Risk (IPSS Score) and Biology
Low/Int-1
Anemia EPO, Darbepoietin
RARS EPO + G-CSF
Del (5q) Lenalidomide
Clinical trials for relapsed/refractory disease
Int-2/High Azacitidine, Decitabine
Clinical trials for relapsed/refractory disease
HLA-matched allogeneic stem cell transplant (younger)
HLA-matched non-myeloablative allogeneic stem cell
transplant (older)