Embed Size (px)
Citation preview
Financial Results Q2 FY 2020
September 2019
MUTHOOT FINANCE LIMITED
SAFE HARBOUR STATEMENT
This presentation may include statements, which may constitute forward-looking statements. All statements that address
expectations or projections about the future, including, but not limited to, statements about the strategy for growth, business
development, market position, expenditures, and financial results, are forward looking statements. Forward-looking statements
are based on certain assumptions and expectations of future events. The company cannot guarantee that these assumptions
and expectations are accurate or will be realised. The actual results, performance or achievements, could thus differ materially
from those projected in any such forward-looking statements.
The company assumes no responsibility to publicly amend, modify or revise any forward-looking statements, on the basis of
any subsequent developments, information or events, or otherwise. While every effort is made to ensure that this presentation
conforms with all applicable legal requirements, the company does not warrant that it is complete, comprehensive or accurate,
or commit to its being updated. No part of the information provided herein is to be construed as a solicitation to make any
financial investment and is provided for information only.
Any person/ party intending to provide finance / invest in the shares/businesses of the Company shall do so after seeking their
own professional advice and after carrying out their own due diligence procedure to ensure that they are making an informed
decision. In no event shall the company be liable for any damages whatsoever, whether direct, incidental, indirect,
consequential or special damages of any kind or including, without limitation, those resulting from loss of profit, loss of
contracts, goodwill, data, information, income, expected savings or business relationships arising out of or in connection with
the use of this presentation.
1
Primary BusinessShareholding of holding
company (%)
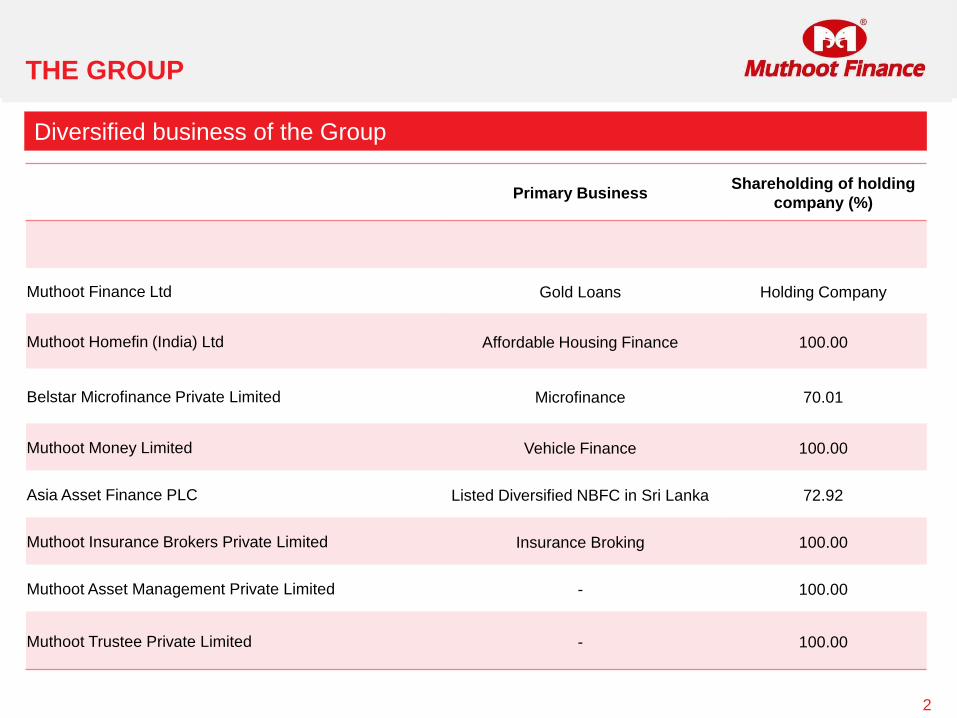
Muthoot Finance Ltd Gold Loans Holding Company
Muthoot Homefin (India) Ltd Affordable Housing Finance 100.00
Belstar Microfinance Private Limited Microfinance 70.01
Muthoot Money Limited Vehicle Finance 100.00
Asia Asset Finance PLC Listed Diversified NBFC in Sri Lanka 72.92
Muthoot Insurance Brokers Private Limited Insurance Broking 100.00
Muthoot Asset Management Private Limited - 100.00
Muthoot Trustee Private Limited - 100.00
2
THE GROUP
Diversified business of the Group
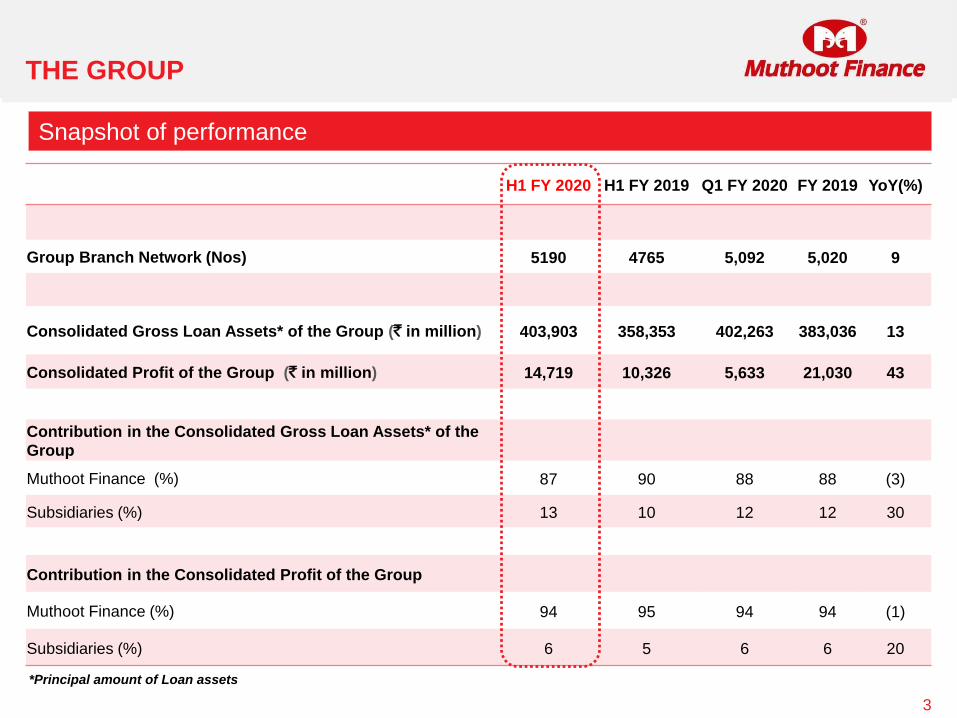
H1 FY 2020 H1 FY 2019 Q1 FY 2020 FY 2019 YoY(%)
Group Branch Network (Nos) 5190 4765 5,092 5,020 9
Consolidated Gross Loan Assets* of the Group (` in million) 403,903 358,353 402,263 383,036 13
Consolidated Profit of the Group (` in million) 14,719 10,326 5,633 21,030 43
Contribution in the Consolidated Gross Loan Assets* of the
Group
Muthoot Finance (%) 87 90 88 88 (3)
Subsidiaries (%) 13 10 12 12 30
Contribution in the Consolidated Profit of the Group
Muthoot Finance (%) 94 95 94 94 (1)
Subsidiaries (%) 6 5 6 6 20
3
THE GROUP
Snapshot of performance
*Principal amount of Loan assets
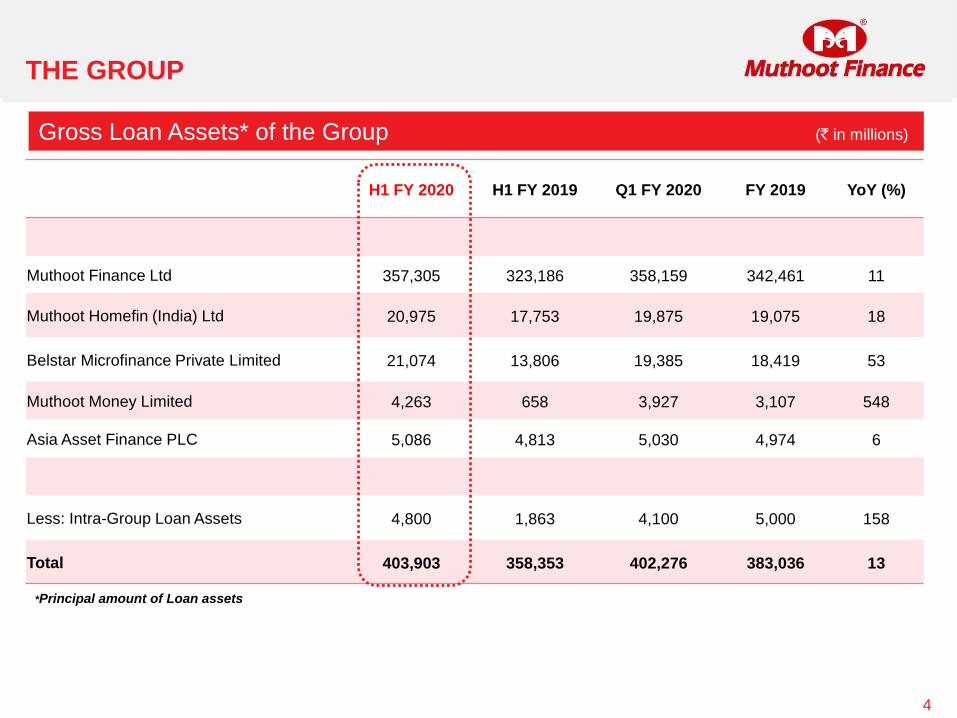
H1 FY 2020 H1 FY 2019 Q1 FY 2020 FY 2019 YoY (%)
Muthoot Finance Ltd 357,305 323,186 358,159 342,461 11
Muthoot Homefin (India) Ltd 20,975 17,753 19,875 19,075 18
Belstar Microfinance Private Limited 21,074 13,806 19,385 18,419 53
Muthoot Money Limited 4,263 658 3,927 3,107 548
Asia Asset Finance PLC 5,086 4,813 5,030 4,974 6
Less: Intra-Group Loan Assets 4,800 1,863 4,100 5,000 158
Total 403,903 358,353 402,276 383,036 13
4
THE GROUP
Gross Loan Assets* of the Group (` in millions)
*Principal amount of Loan assets
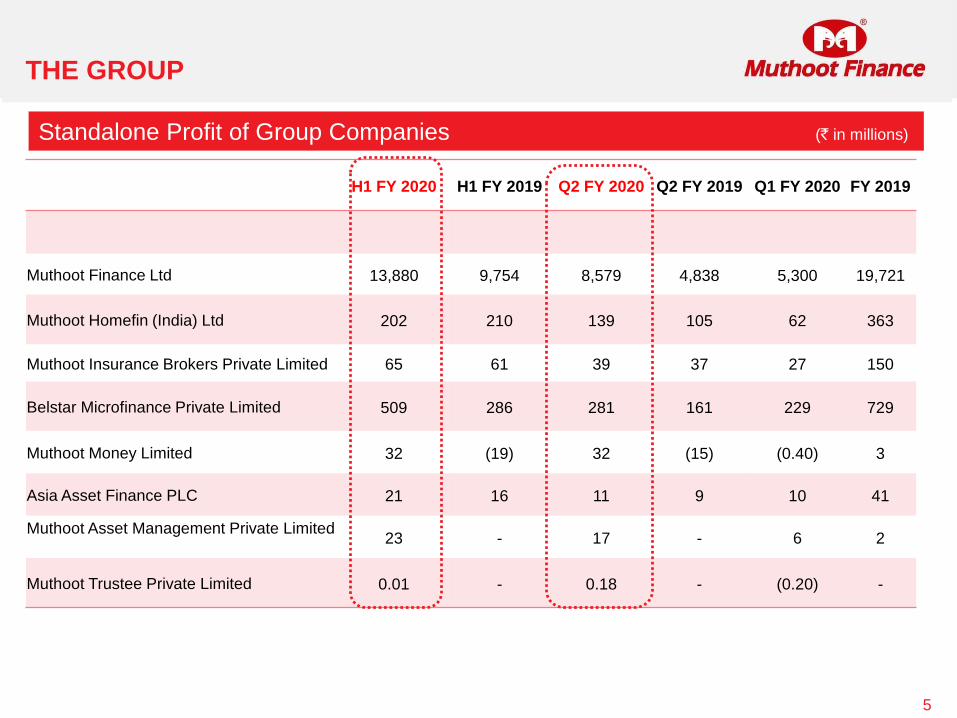
H1 FY 2020 H1 FY 2019 Q2 FY 2020 Q2 FY 2019 Q1 FY 2020 FY 2019
Muthoot Finance Ltd 13,880 9,754 8,579 4,838 5,300 19,721
Muthoot Homefin (India) Ltd 202 210 139 105 62 363
Muthoot Insurance Brokers Private Limited 65 61 39 37 27 150
Belstar Microfinance Private Limited 509 286 281 161 229 729
Muthoot Money Limited 32 (19) 32 (15) (0.40) 3
Asia Asset Finance PLC 21 16 11 9 10 41
Muthoot Asset Management Private Limited23 - 17 - 6 2
Muthoot Trustee Private Limited 0.01 - 0.18 - (0.20) -
5
THE GROUP
Standalone Profit of Group Companies (` in millions)
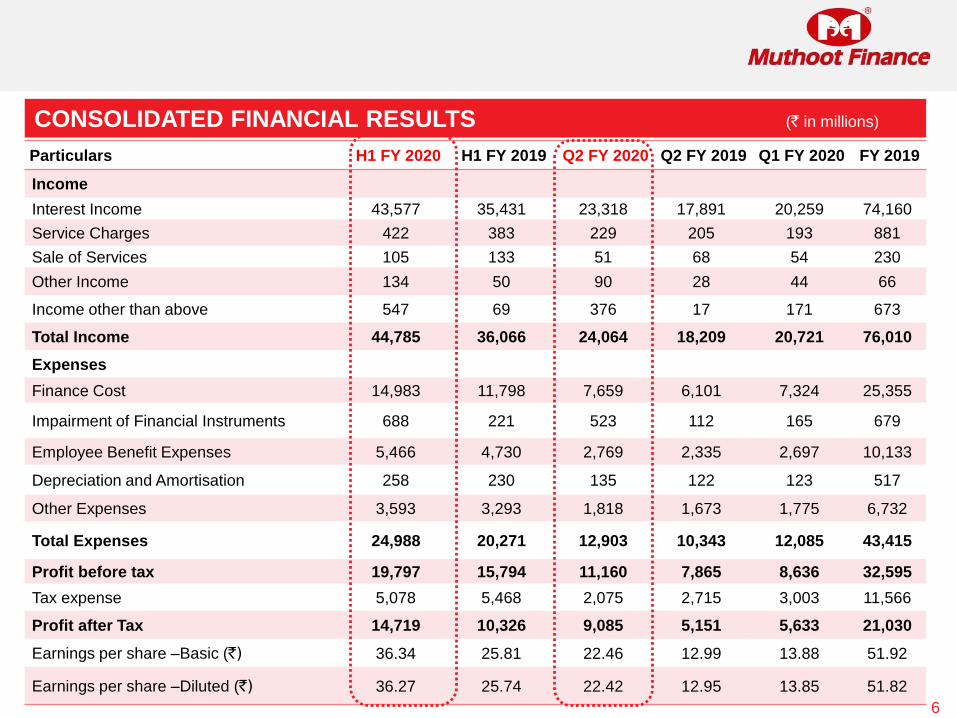
Particulars H1 FY 2020 H1 FY 2019 Q2 FY 2020 Q2 FY 2019 Q1 FY 2020 FY 2019
Income
Interest Income 43,577 35,431 23,318 17,891 20,259 74,160
Service Charges 422 383 229 205 193 881
Sale of Services 105 133 51 68 54 230
Other Income 134 50 90 28 44 66
Income other than above 547 69 376 17 171 673
Total Income 44,785 36,066 24,064 18,209 20,721 76,010
Expenses
Finance Cost 14,983 11,798 7,659 6,101 7,324 25,355
Impairment of Financial Instruments 688 221 523 112 165 679
Employee Benefit Expenses 5,466 4,730 2,769 2,335 2,697 10,133
Depreciation and Amortisation 258 230 135 122 123 517
Other Expenses 3,593 3,293 1,818 1,673 1,775 6,732
Total Expenses 24,988 20,271 12,903 10,343 12,085 43,415
Profit before tax 19,797 15,794 11,160 7,865 8,636 32,595
Tax expense 5,078 5,468 2,075 2,715 3,003 11,566
Profit after Tax 14,719 10,326 9,085 5,151 5,633 21,030
Earnings per share –Basic (`) 36.34 25.81 22.46 12.99 13.88 51.92
Earnings per share –Diluted (`) 36.27 25.74 22.42 12.95 13.85 51.82
6
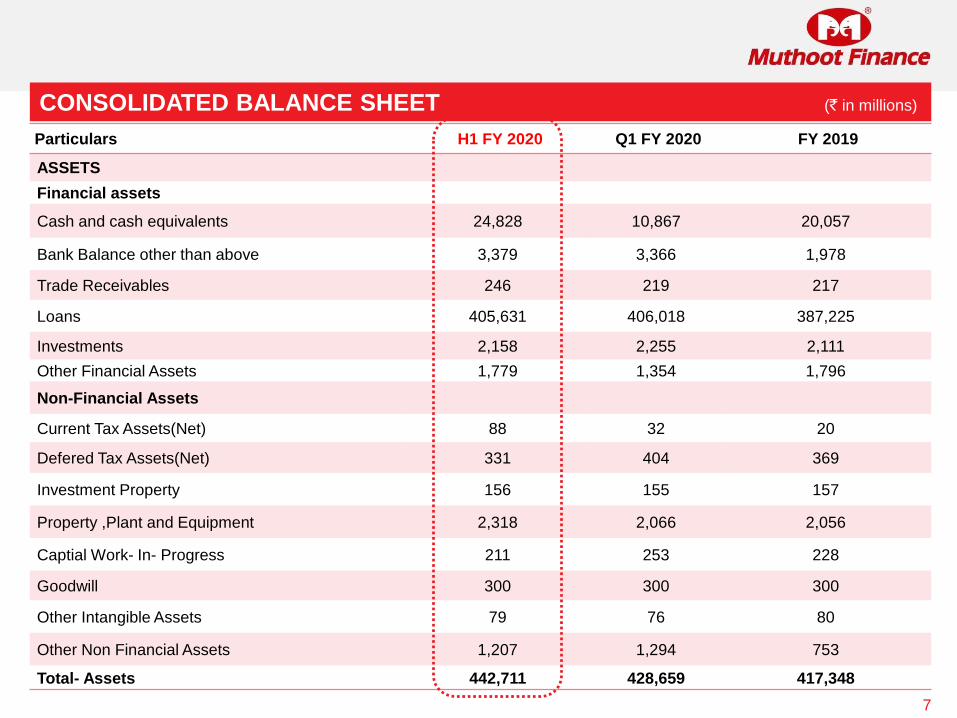
CONSOLIDATED FINANCIAL RESULTS (` in millions)
Particulars H1 FY 2020 Q1 FY 2020 FY 2019
ASSETS
Financial assets
Cash and cash equivalents 24,828 10,867 20,057
Bank Balance other than above 3,379 3,366 1,978
Trade Receivables 246 219 217
Loans 405,631 406,018 387,225
Investments 2,158 2,255 2,111
Other Financial Assets 1,779 1,354 1,796
Non-Financial Assets
Current Tax Assets(Net) 88 32 20
Defered Tax Assets(Net) 331 404 369
Investment Property 156 155 157
Property ,Plant and Equipment 2,318 2,066 2,056
Captial Work- In- Progress 211 253 228
Goodwill 300 300 300
Other Intangible Assets 79 76 80
Other Non Financial Assets 1,207 1,294 753
Total- Assets 442,711 428,659 417,348
7
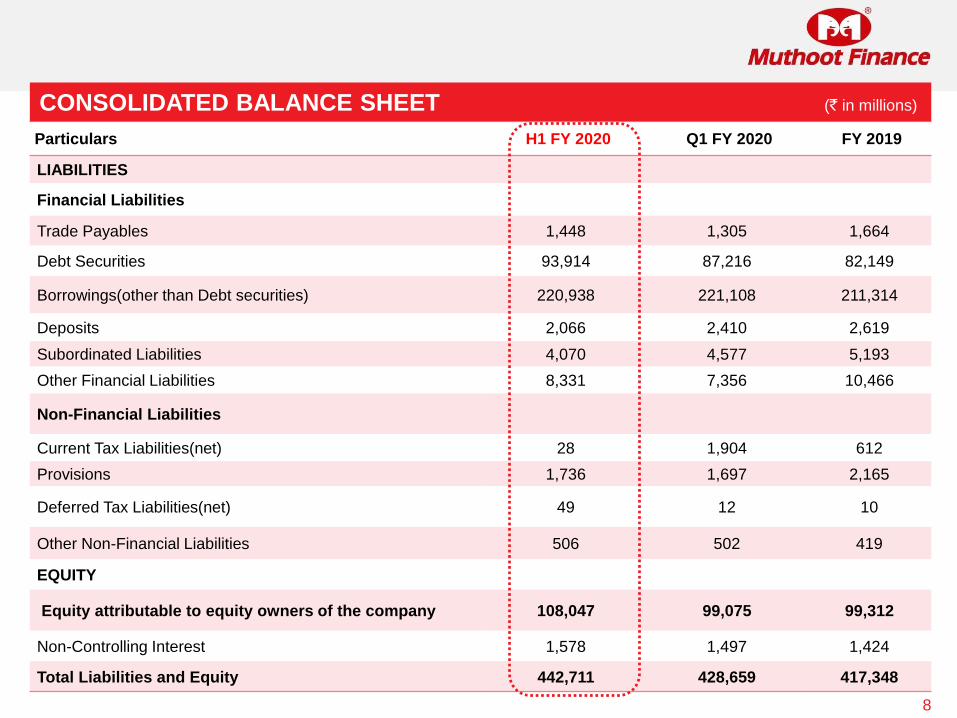
CONSOLIDATED BALANCE SHEET (` in millions)
Particulars H1 FY 2020 Q1 FY 2020 FY 2019
LIABILITIES
Financial Liabilities
Trade Payables 1,448 1,305 1,664
Debt Securities 93,914 87,216 82,149
Borrowings(other than Debt securities) 220,938 221,108 211,314
Deposits 2,066 2,410 2,619
Subordinated Liabilities 4,070 4,577 5,193
Other Financial Liabilities 8,331 7,356 10,466
Non-Financial Liabilities
Current Tax Liabilities(net) 28 1,904 612
Provisions 1,736 1,697 2,165
Deferred Tax Liabilities(net) 49 12 10
Other Non-Financial Liabilities 506 502 419
EQUITY
Equity attributable to equity owners of the company 108,047 99,075 99,312
Non-Controlling Interest 1,578 1,497 1,424
Total Liabilities and Equity 442,711 428,659 417,348
8
CONSOLIDATED BALANCE SHEET (` in millions)
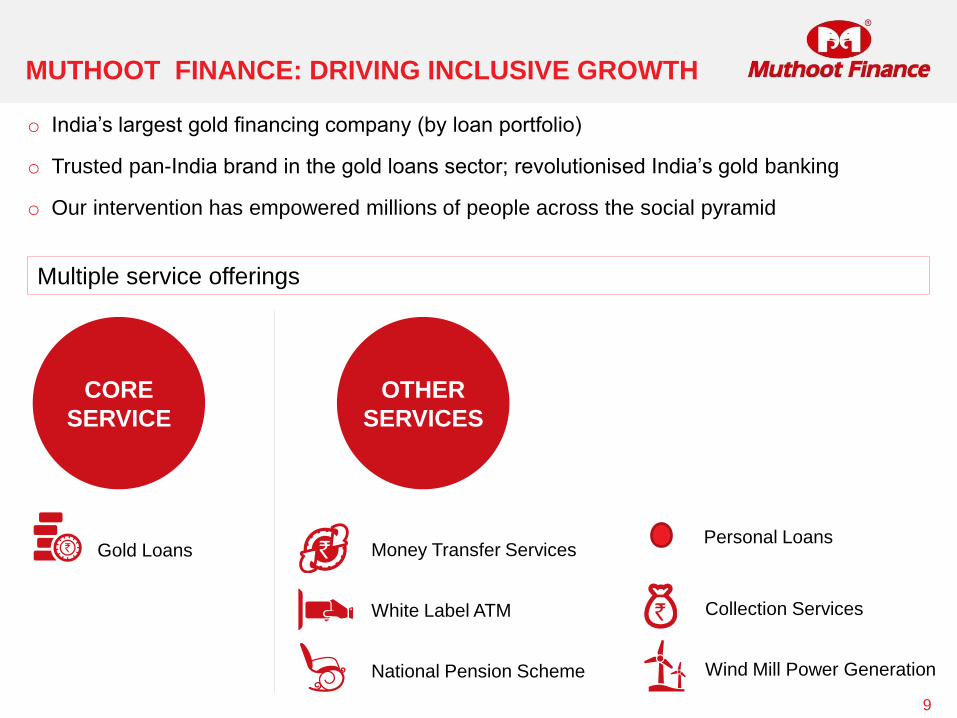
MUTHOOT FINANCE: DRIVING INCLUSIVE GROWTH
9
o India’s largest gold financing company (by loan portfolio)
o Trusted pan-India brand in the gold loans sector; revolutionised India’s gold banking
o Our intervention has empowered millions of people across the social pyramid
Gold Loans Money Transfer Services
White Label ATM
National Pension Scheme
CORE
SERVICE
OTHER
SERVICES
Collection Services
Wind Mill Power Generation
Multiple service offerings
Personal Loans
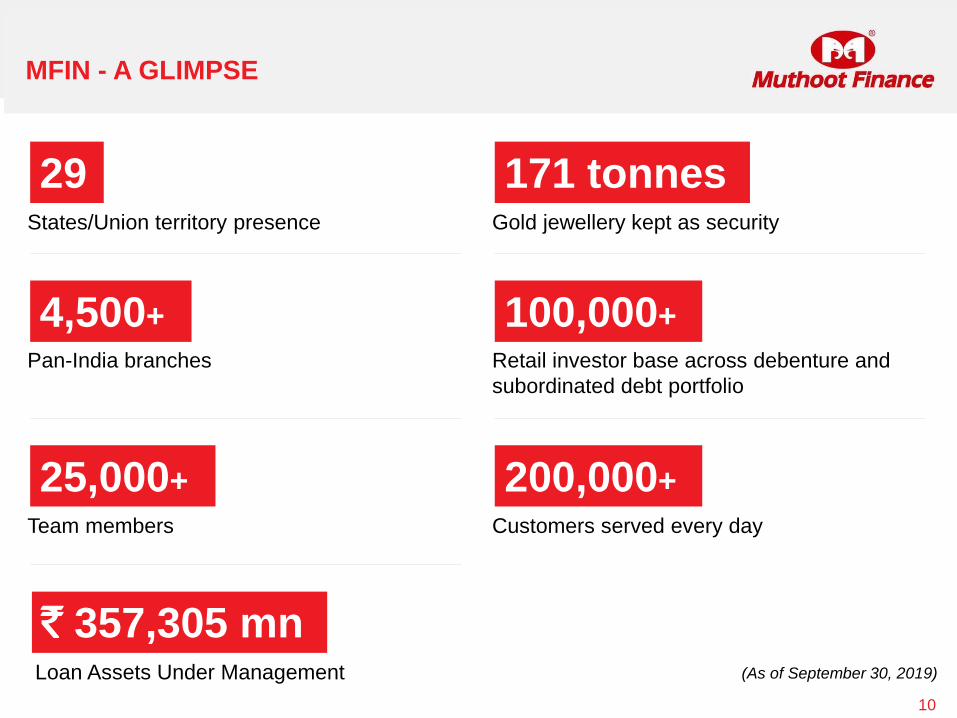
MFIN - A GLIMPSE
10
29States/Union territory presence
4,500+
Pan-India branches
25,000+
Team members
171 tonnesGold jewellery kept as security
100,000+
Retail investor base across debenture and
subordinated debt portfolio
200,000+
Customers served every day
` 357,305 mnLoan Assets Under Management (As of September 30, 2019)

SHAREHOLDING PATTERN
11
NSE Ticker
MUTHOOTFIN
BSE Ticker
533398
Market Capitalisation (as on September 30, 2019)
` 270,855 million
Strong promoter interest in business with 74% stake
(%) Shareholding as on
September 30, 2019
73.65
23.293.06
Promoters & Relatives
FII, FC, MF & Others
Public
DIVIDEND PAYOUT
12
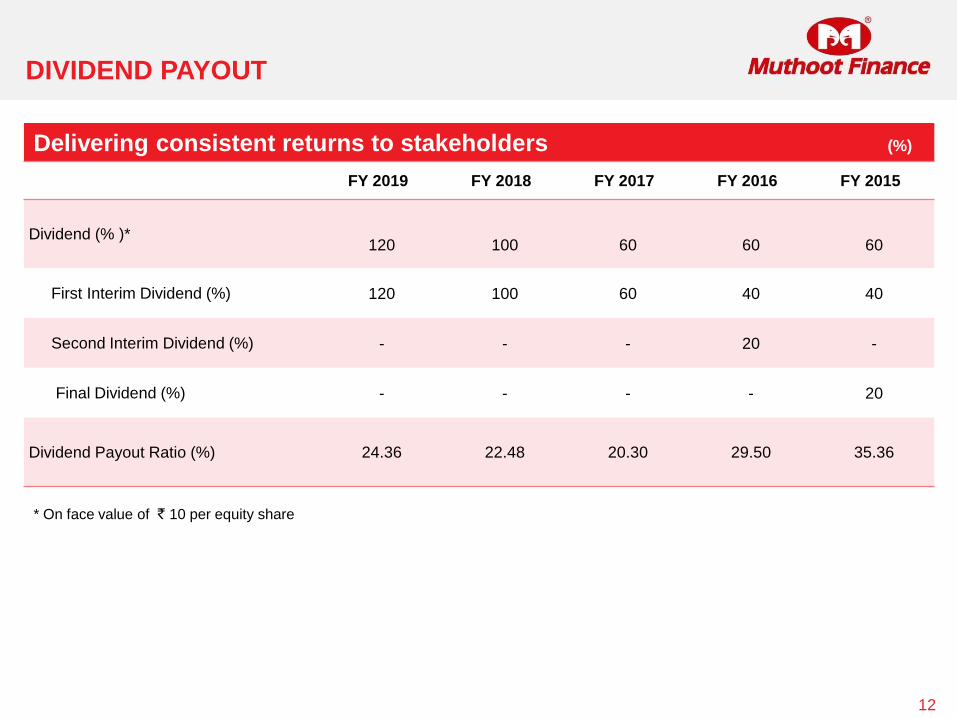
Delivering consistent returns to stakeholders (%)
FY 2019 FY 2018 FY 2017 FY 2016 FY 2015
Dividend (% )*120 100 60 60 60
First Interim Dividend (%) 120 100 60 40 40
Second Interim Dividend (%) - - - 20 -
Final Dividend (%) - - - - 20
Dividend Payout Ratio (%) 24.36 22.48 20.30 29.50 35.36
* On face value of ` 10 per equity share
GEOGRAPHICAL PRESENCE
13
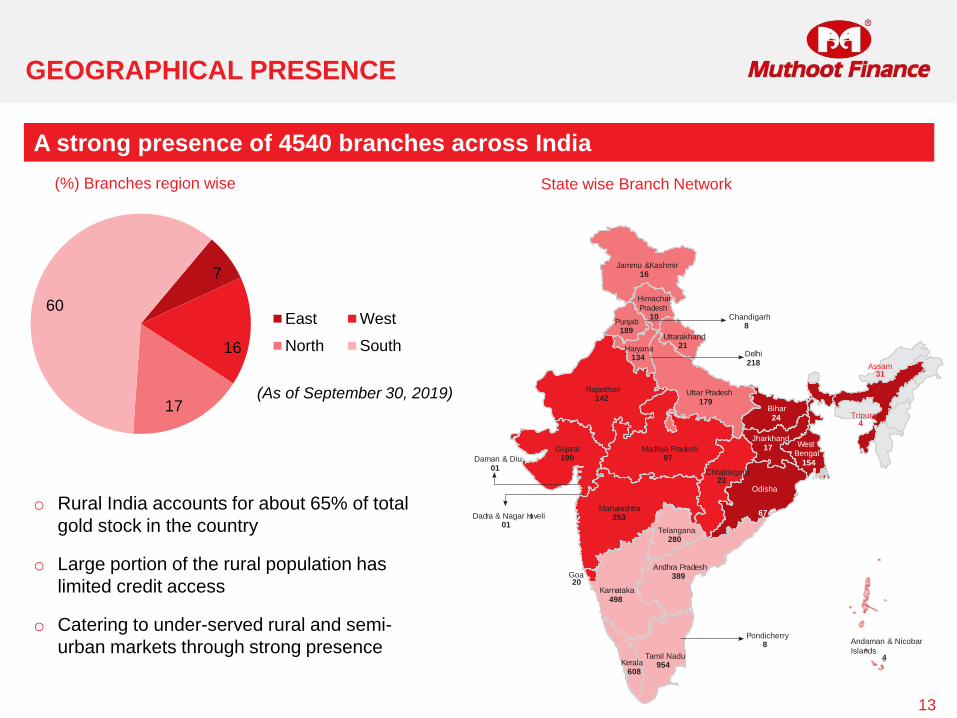
A strong presence of 4540 branches across India
(%) Branches region wise State wise Branch Network
7
16
17
60East West
North South
(As of September 30, 2019)
o Rural India accounts for about 65% of total
gold stock in the country
o Large portion of the rural population has
limited credit access
o Catering to under-served rural and semi-
urban markets through strong presence
Jammu &Kashmir16
HimachalPradesh
10Punjab
189
Chandigarh8
Delhi218
Rajasthan142
Gujarat190Daman & Diu
01
Dadra & Nagar Haveli01
Madhya Pradesh97
Uttar Pradesh179
Bihar24
Uttarakhand21Haryana
134
Maharashtra253
Karnataka498
Goa20
Tamil Nadu954
Pondicherry8
Andhra Pradesh389
Telangana280
Chhattisgarh23
Odisha
67
Jharkhand17 West
Bengal
154
Kerala608
Assam31
Tripura4
4
Andaman & Nicobar
Islands
DIGITAL INITIATIVES
14
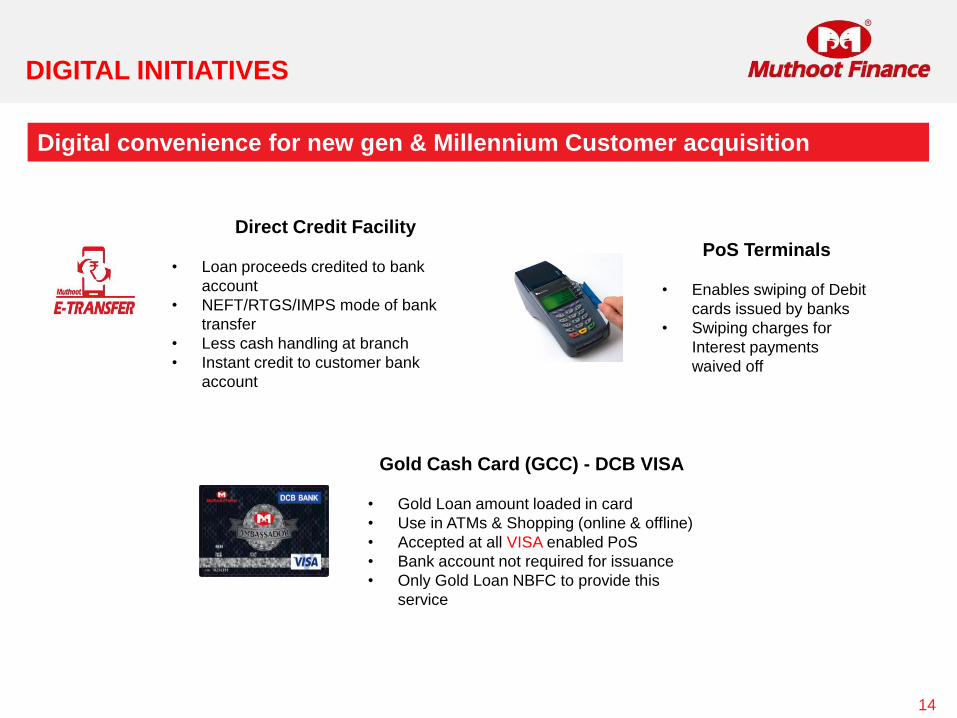
Digital convenience for new gen & Millennium Customer acquisition
Direct Credit Facility
• Loan proceeds credited to bank
account
• NEFT/RTGS/IMPS mode of bank
transfer
• Less cash handling at branch
• Instant credit to customer bank
account
Gold Cash Card (GCC) - DCB VISA
• Gold Loan amount loaded in card
• Use in ATMs & Shopping (online & offline)
• Accepted at all VISA enabled PoS
• Bank account not required for issuance
• Only Gold Loan NBFC to provide this
service
PoS Terminals
• Enables swiping of Debit
cards issued by banks
• Swiping charges for
Interest payments
waived off
DIGITAL INITIATIVES
15
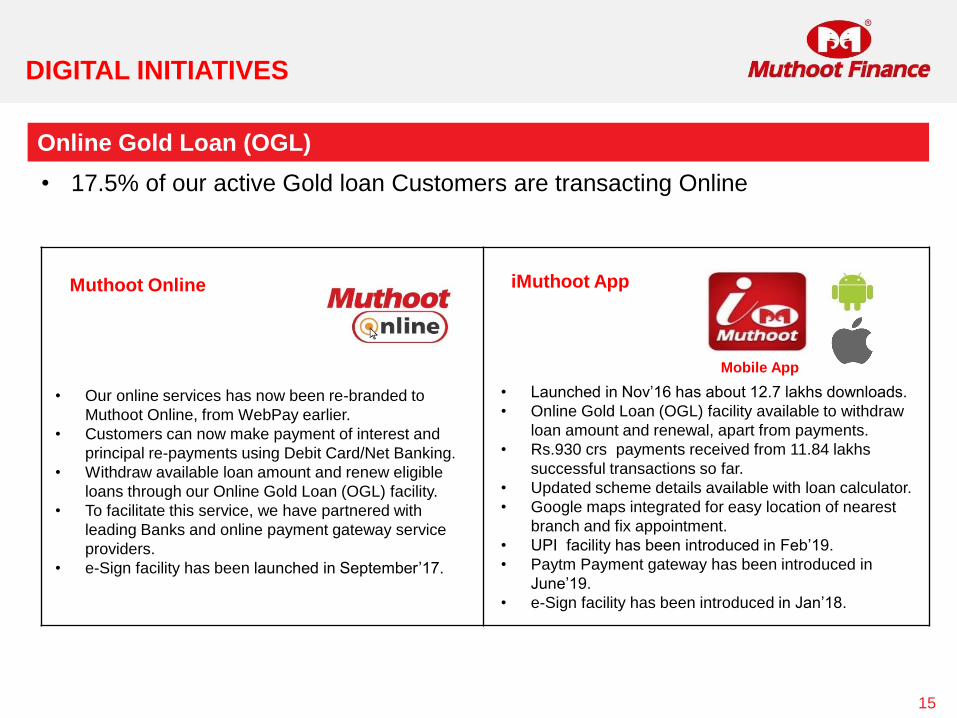
Online Gold Loan (OGL)
• 17.5% of our active Gold loan Customers are transacting Online
Muthoot Online iMuthoot App
Mobile App
• Our online services has now been re-branded to
Muthoot Online, from WebPay earlier.
• Customers can now make payment of interest and
principal re-payments using Debit Card/Net Banking.
• Withdraw available loan amount and renew eligible
loans through our Online Gold Loan (OGL) facility.
• To facilitate this service, we have partnered with
leading Banks and online payment gateway service
providers.
• e-Sign facility has been launched in September’17.
• Launched in Nov’16 has about 12.7 lakhs downloads.
• Online Gold Loan (OGL) facility available to withdraw
loan amount and renewal, apart from payments.
• Rs.930 crs payments received from 11.84 lakhs
successful transactions so far.
• Updated scheme details available with loan calculator.
• Google maps integrated for easy location of nearest
branch and fix appointment.
• UPI facility has been introduced in Feb’19.
• Paytm Payment gateway has been introduced in
June’19.
• e-Sign facility has been introduced in Jan’18.
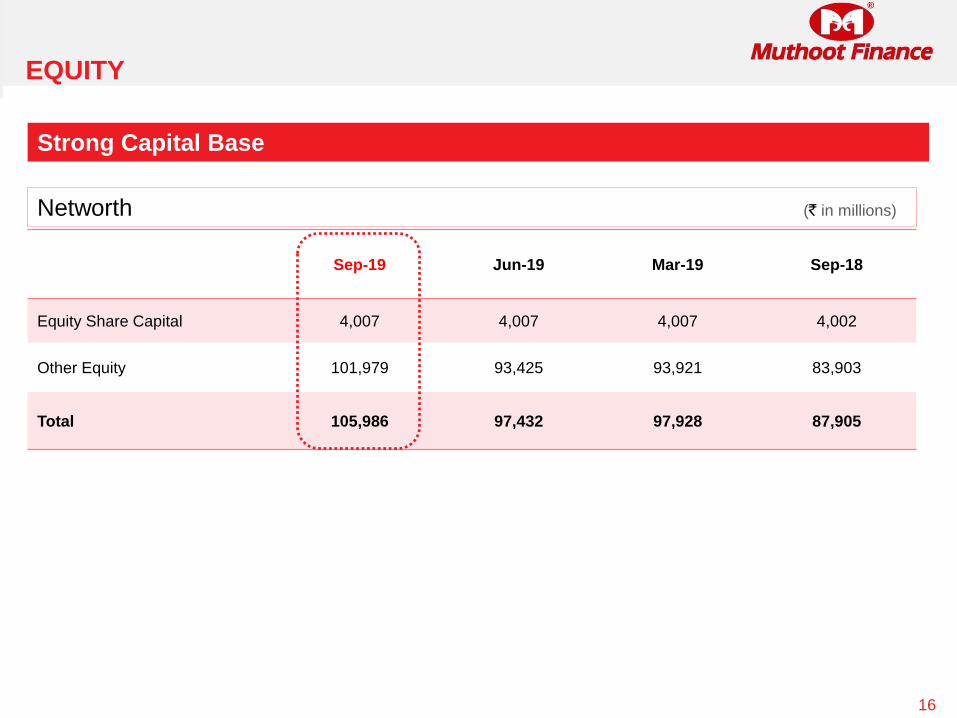
EQUITY
16
Sep-19 Jun-19 Mar-19 Sep-18
Equity Share Capital 4,007 4,007 4,007 4,002
Other Equity 101,979 93,425 93,921 83,903
Total 105,986 97,432 97,928 87,905
Networth (` in millions)
Strong Capital Base
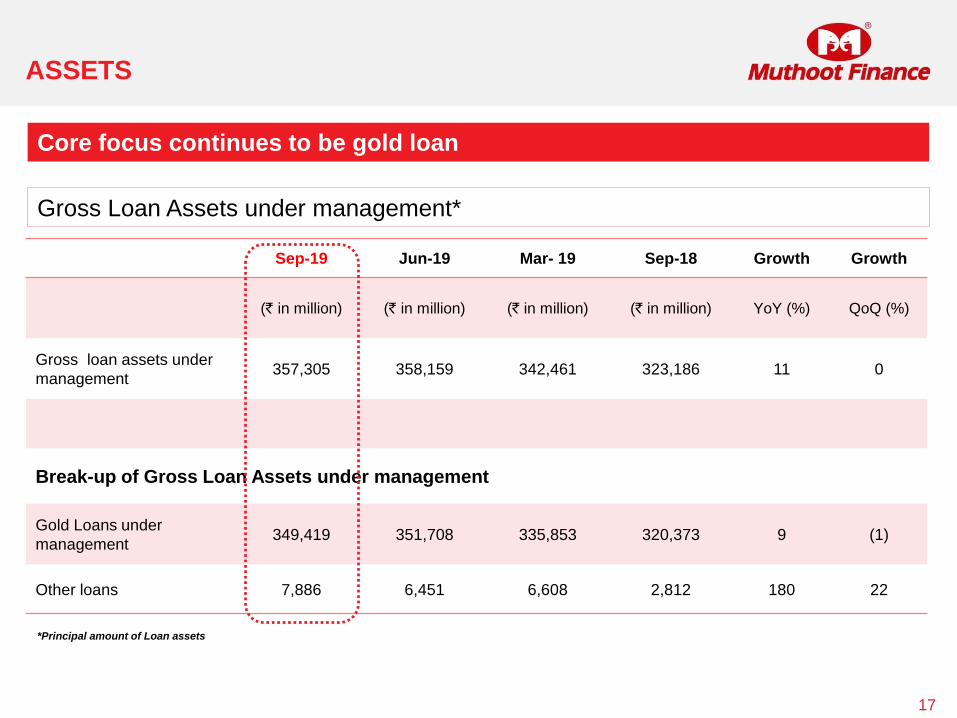
ASSETS
17
Gross Loan Assets under management*
Core focus continues to be gold loan
*Principal amount of Loan assets
Sep-19 Jun-19 Mar- 19 Sep-18 Growth Growth
(` in million) (` in million) (` in million) (` in million) YoY (%) QoQ (%)
Gross loan assets under
management 357,305 358,159 342,461 323,186 11 0
Break-up of Gross Loan Assets under management
Gold Loans under
management 349,419 351,708 335,853 320,373 9 (1)
Other loans 7,886 6,451 6,608 2,812 180 22
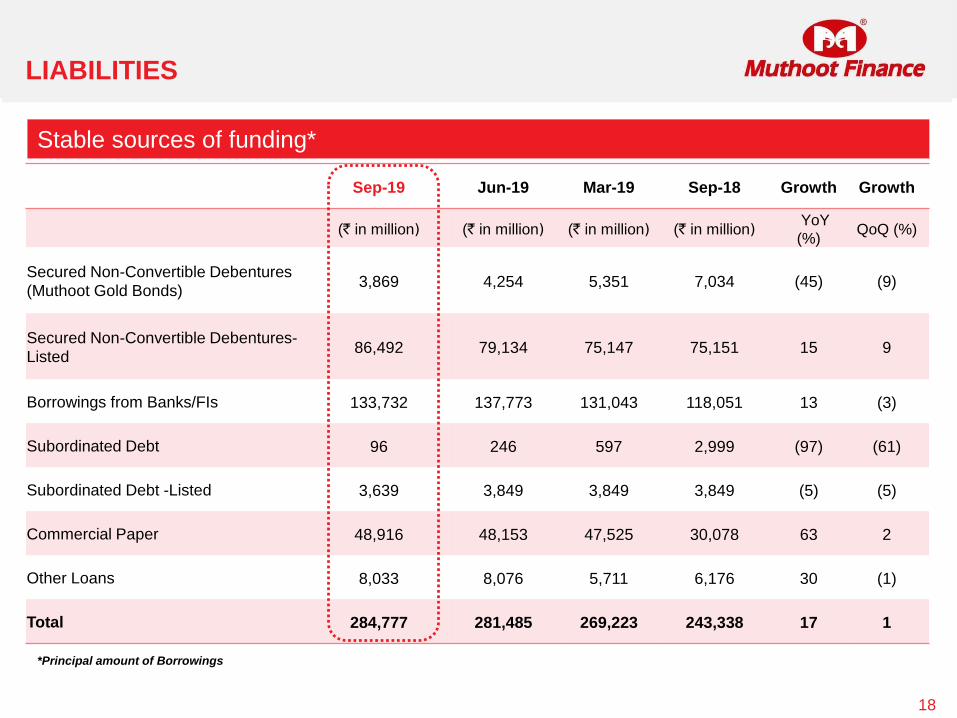
LIABILITIES
Sep-19 Jun-19 Mar-19 Sep-18 Growth Growth
(` in million) (` in million) (` in million) (` in million)YoY
(%)QoQ (%)
Secured Non-Convertible Debentures
(Muthoot Gold Bonds)3,869 4,254 5,351 7,034 (45) (9)
Secured Non-Convertible Debentures-
Listed86,492 79,134 75,147 75,151 15 9
Borrowings from Banks/FIs 133,732 137,773 131,043 118,051 13 (3)
Subordinated Debt 96 246 597 2,999 (97) (61)
Subordinated Debt -Listed 3,639 3,849 3,849 3,849 (5) (5)
Commercial Paper 48,916 48,153 47,525 30,078 63 2
Other Loans 8,033 8,076 5,711 6,176 30 (1)
Total 284,777 281,485 269,223 243,338 17 1
Stable sources of funding*
18
*Principal amount of Borrowings
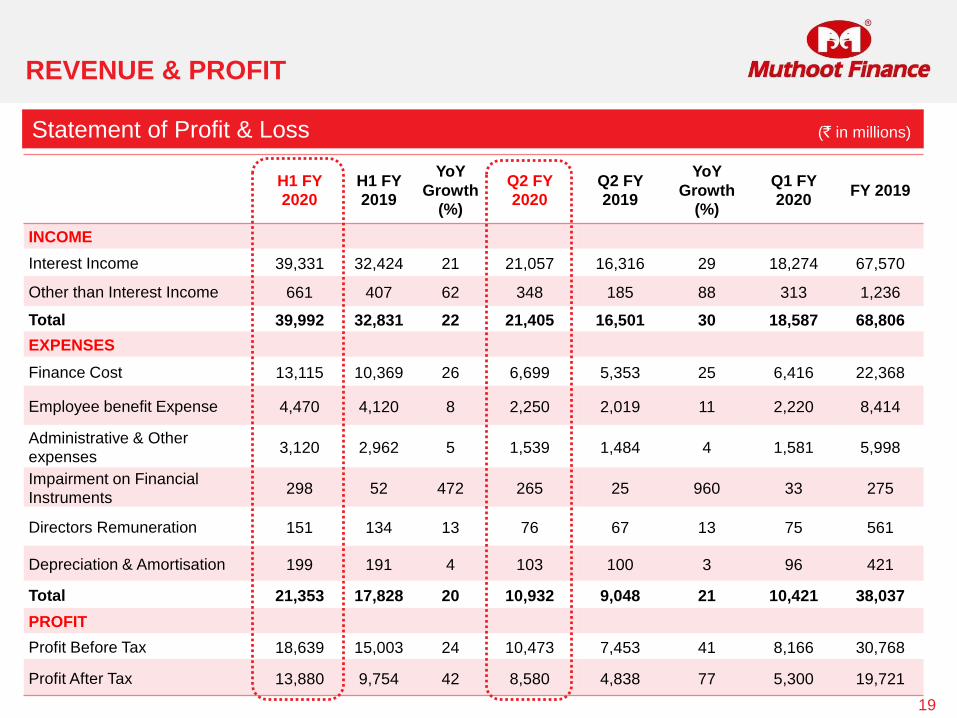
REVENUE & PROFIT
19
H1 FY
2020
H1 FY
2019
YoY
Growth
(%)
Q2 FY
2020
Q2 FY
2019
YoY
Growth
(%)
Q1 FY
2020FY 2019
INCOME
Interest Income 39,331 32,424 21 21,057 16,316 29 18,274 67,570
Other than Interest Income 661 407 62 348 185 88 313 1,236
Total 39,992 32,831 22 21,405 16,501 30 18,587 68,806
EXPENSES
Finance Cost 13,115 10,369 26 6,699 5,353 25 6,416 22,368
Employee benefit Expense 4,470 4,120 8 2,250 2,019 11 2,220 8,414
Administrative & Other
expenses3,120 2,962 5 1,539 1,484 4 1,581 5,998
Impairment on Financial
Instruments298 52 472 265 25 960 33 275
Directors Remuneration 151 134 13 76 67 13 75 561
Depreciation & Amortisation 199 191 4 103 100 3 96 421
Total 21,353 17,828 20 10,932 9,048 21 10,421 38,037
PROFIT
Profit Before Tax 18,639 15,003 24 10,473 7,453 41 8,166 30,768
Profit After Tax 13,880 9,754 42 8,580 4,838 77 5,300 19,721
Statement of Profit & Loss (` in millions)
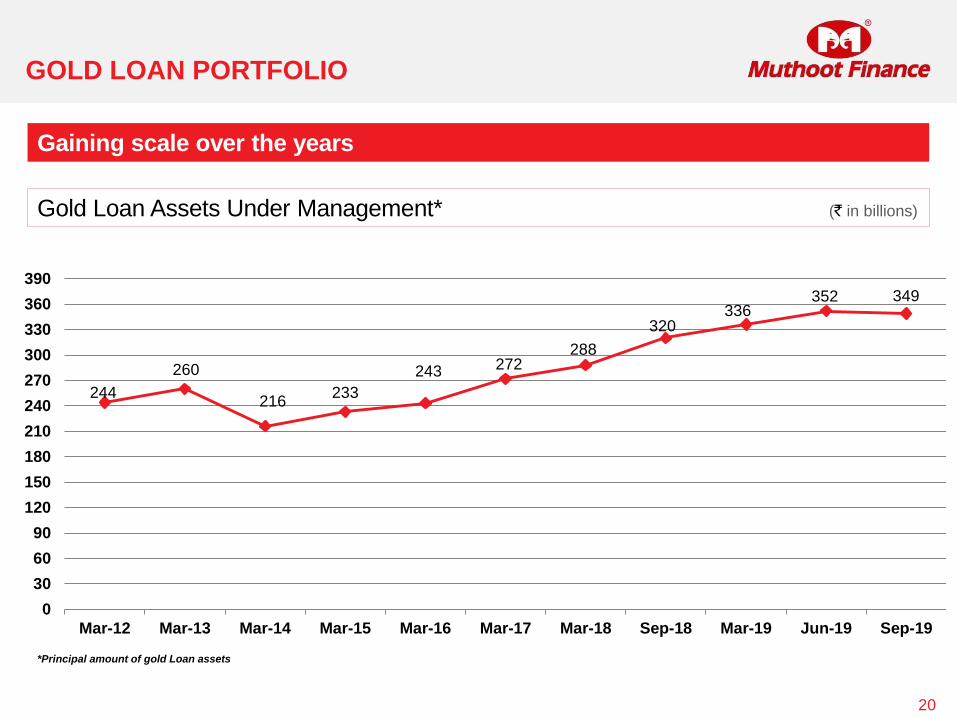
Gold Loan Assets Under Management* (` in billions)
GOLD LOAN PORTFOLIO
20
Gaining scale over the years
244
260
216233
243 272288
320336
352 349
0
30
60
90
120
150
180
210
240
270
300
330
360
390
Mar-12 Mar-13 Mar-14 Mar-15 Mar-16 Mar-17 Mar-18 Sep-18 Mar-19 Jun-19 Sep-19
*Principal amount of gold Loan assets
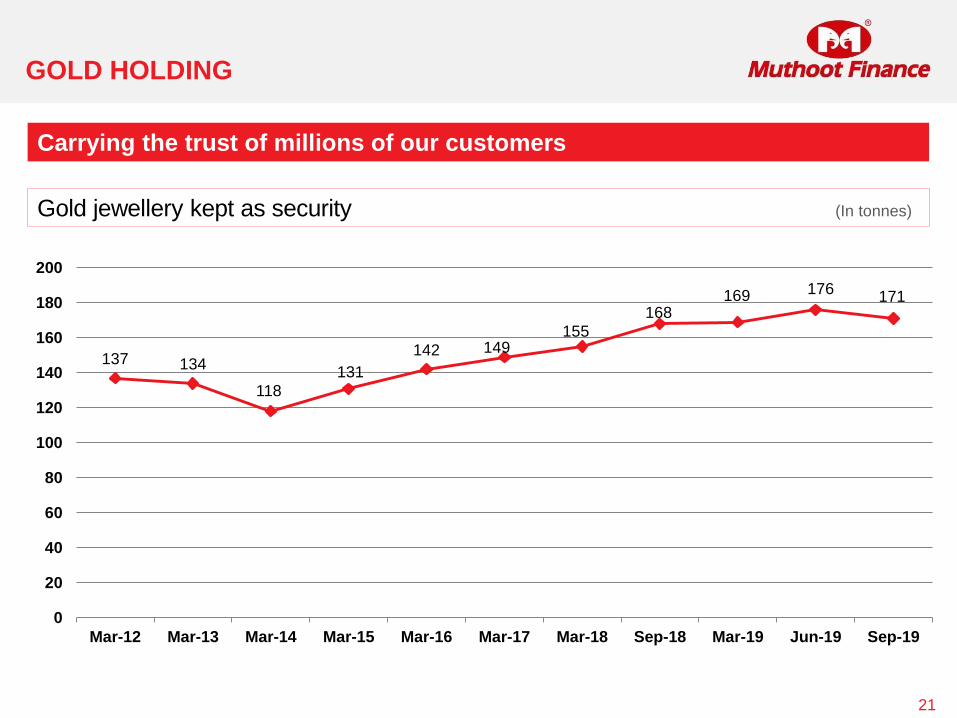
GOLD HOLDING
21
Carrying the trust of millions of our customers
Gold jewellery kept as security (In tonnes)
137 134
118
131
142 149155
168169 176
171
0
20
40
60
80
100
120
140
160
180
200
Mar-12 Mar-13 Mar-14 Mar-15 Mar-16 Mar-17 Mar-18 Sep-18 Mar-19 Jun-19 Sep-19
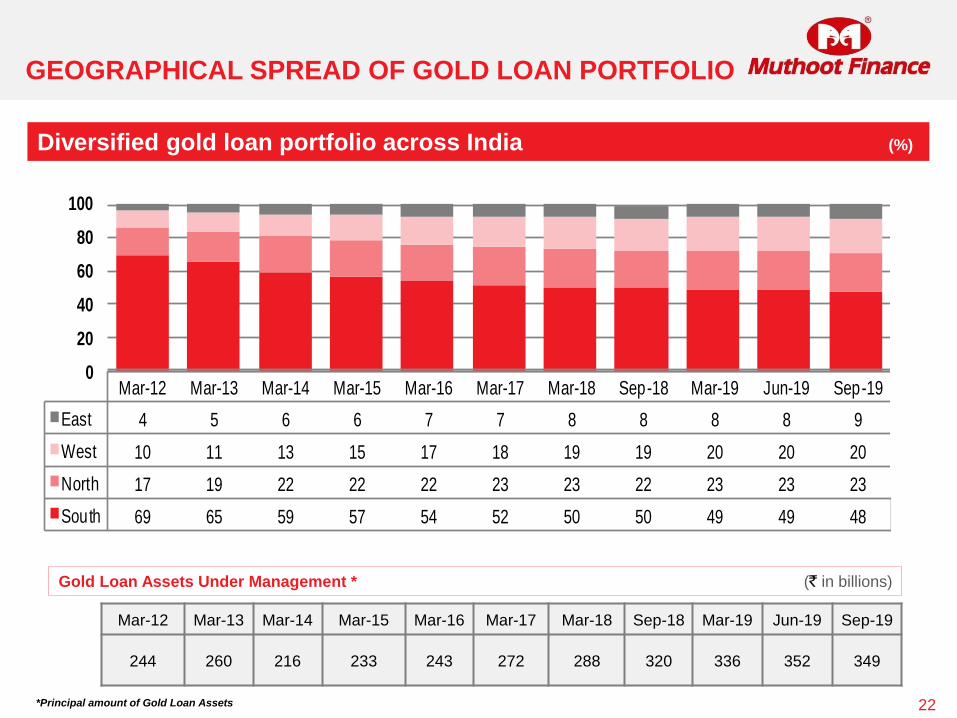
Diversified gold loan portfolio across India (%)
GEOGRAPHICAL SPREAD OF GOLD LOAN PORTFOLIO
22
Mar-12 Mar-13 Mar-14 Mar-15 Mar-16 Mar-17 Mar-18 Sep-18 Mar-19 Jun-19 Sep-19
244 260 216 233 243 272 288 320 336 352 349
Gold Loan Assets Under Management * (` in billions)
Mar-12 Mar-13 Mar-14 Mar-15 Mar-16 Mar-17 Mar-18 Sep-18 Mar-19 Jun-19 Sep-19
East 4 5 6 6 7 7 8 8 8 8 9
West 10 11 13 15 17 18 19 19 20 20 20
North 17 19 22 22 22 23 23 22 23 23 23
South 69 65 59 57 54 52 50 50 49 49 48
0
20
40
60
80
100
*Principal amount of Gold Loan Assets

PRODUCTIVITY
23
Average Gold Loan Per Branch * (` in millions)
66.39
63.69
50.6355.01
56.93
63.20
66.70
73.31 74.9778.12 76.96
15
25
35
45
55
65
75
85
Mar-12 Mar-13 Mar-14 Mar-15 Mar-16 Mar-17 Mar-18 Sep-18 Mar-19 Jun-19 Sep-19
Widening presence with increasing gold loan business per branch
*Principal amount of Gold Loan Assets
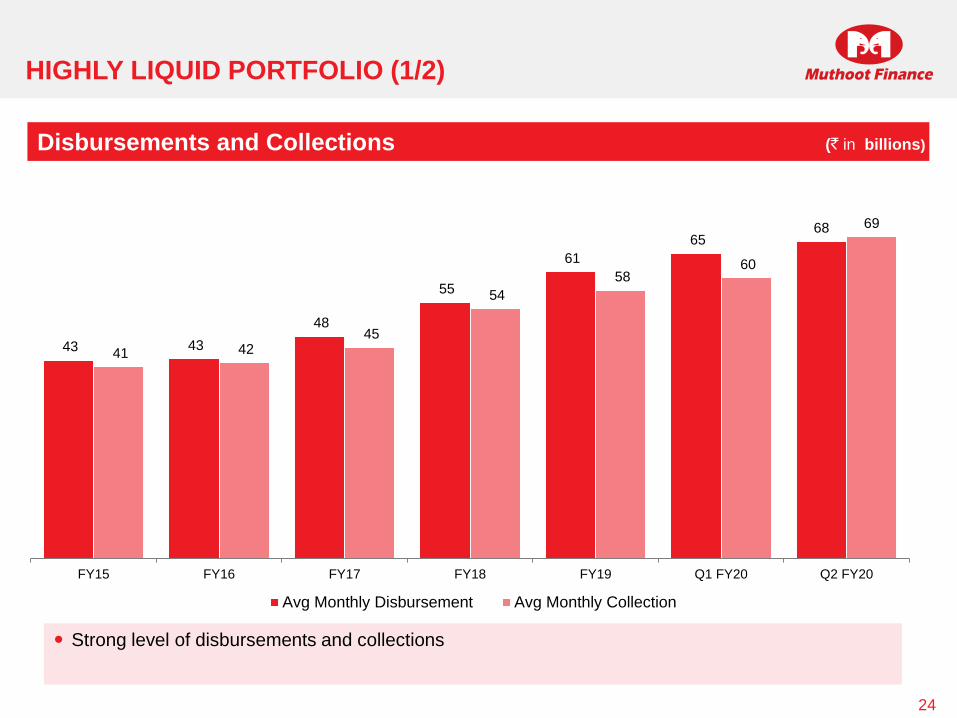
Disbursements and Collections
HIGHLY LIQUID PORTFOLIO (1/2)
24
(` in billions)
43 43
48
55
61
65 68
41 42 45
54
58 60
69
FY15 FY16 FY17 FY18 FY19 Q1 FY20 Q2 FY20
Avg Monthly Disbursement Avg Monthly Collection
Strong level of disbursements and collections
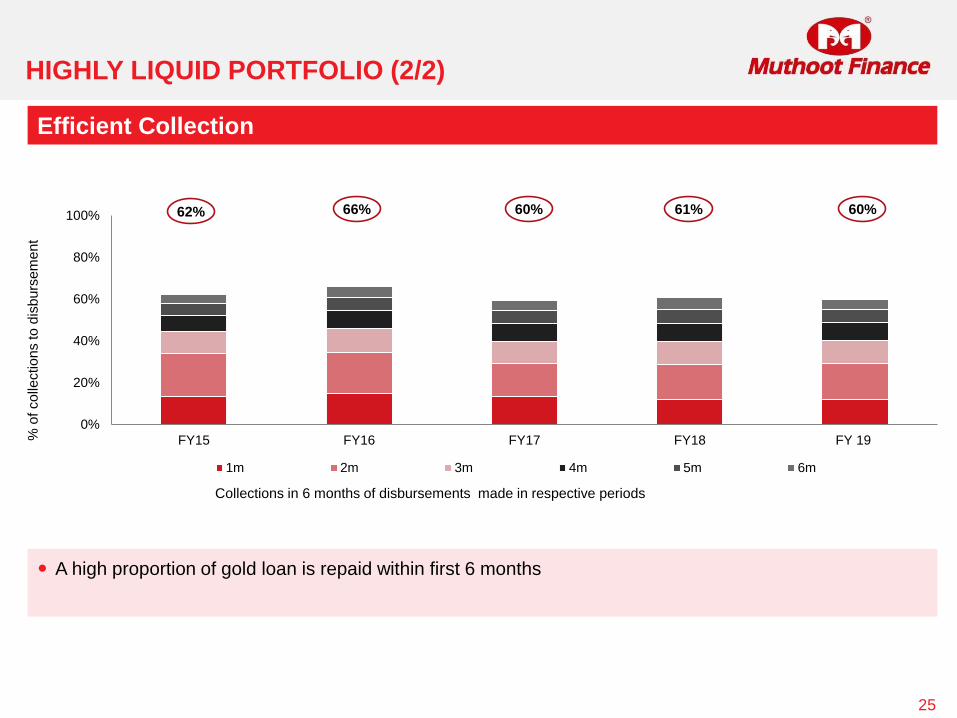
HIGHLY LIQUID PORTFOLIO (2/2)
25
0%
20%
40%
60%
80%
100%
FY15 FY16 FY17 FY18 FY 19
1m 2m 3m 4m 5m 6m
62% 66% 60% 61% 60%
A high proportion of gold loan is repaid within first 6 months
Efficient Collection
Collections in 6 months of disbursements made in respective periods
% o
f co
llectio
ns to
dis
bu
rse
me
nt
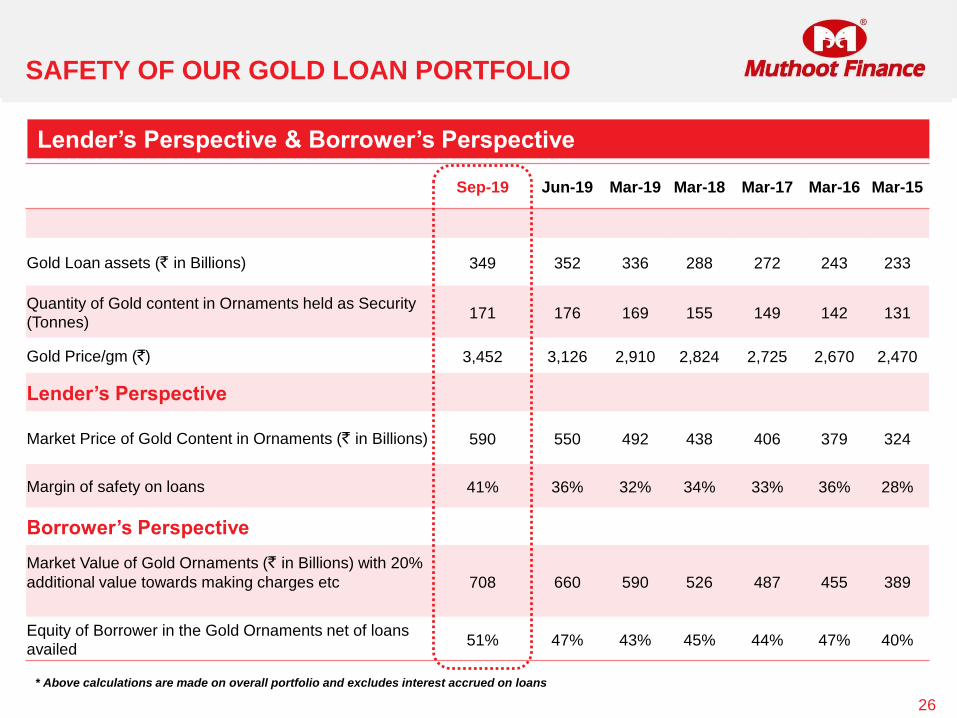
SAFETY OF OUR GOLD LOAN PORTFOLIO
Sep-19 Jun-19 Mar-19 Mar-18 Mar-17 Mar-16 Mar-15
Gold Loan assets (` in Billions) 349 352 336 288 272 243 233
Quantity of Gold content in Ornaments held as Security
(Tonnes)171 176 169 155 149 142 131
Gold Price/gm (`) 3,452 3,126 2,910 2,824 2,725 2,670 2,470
Lender’s Perspective
Market Price of Gold Content in Ornaments (` in Billions) 590 550 492 438 406 379 324
Margin of safety on loans 41% 36% 32% 34% 33% 36% 28%
Borrower’s Perspective
Market Value of Gold Ornaments (` in Billions) with 20%
additional value towards making charges etc 708 660 590 526 487 455 389
Equity of Borrower in the Gold Ornaments net of loans
availed 51% 47% 43% 45% 44% 47% 40%
Lender’s Perspective & Borrower’s Perspective
26
* Above calculations are made on overall portfolio and excludes interest accrued on loans
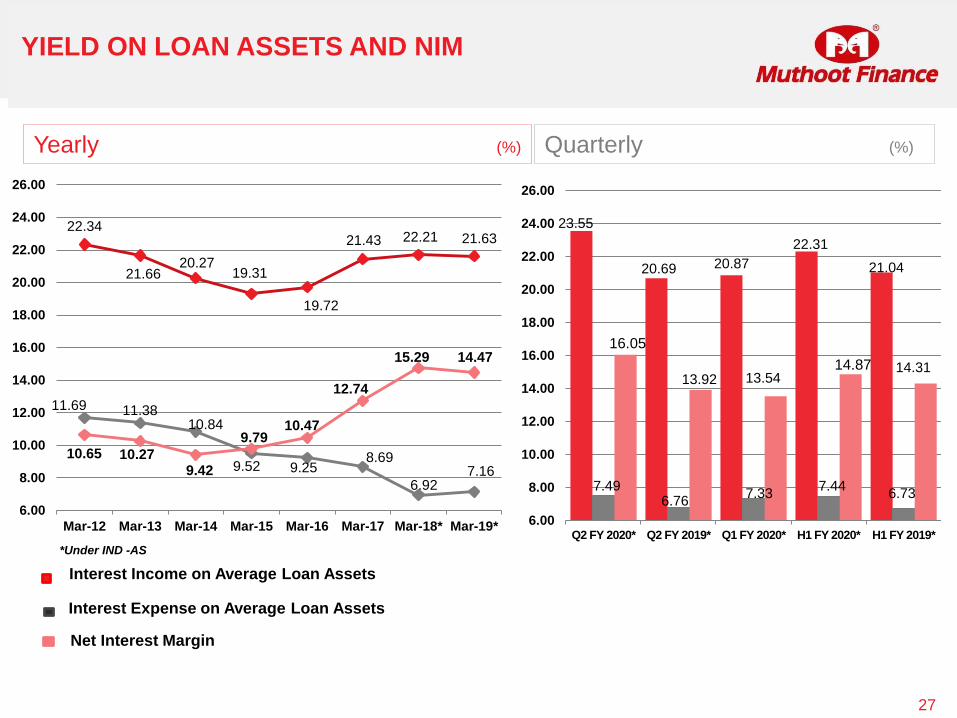
YIELD ON LOAN ASSETS AND NIM
27
22.34
21.6620.27
19.31
19.72
21.43 22.21 21.63
6.00
8.00
10.00
12.00
14.00
16.00
18.00
20.00
22.00
24.00
26.00
Mar-12 Mar-13 Mar-14 Mar-15 Mar-16 Mar-17 Mar-18* Mar-19*
10.65
15.29
9.79
9.42
10.47
11.69
9.25
11.38
9.52
10.84
10.27 8.69
12.74
7.16
14.47
6.92
23.55
20.69 20.87
22.31
21.04
6.00
8.00
10.00
12.00
14.00
16.00
18.00
20.00
22.00
24.00
26.00
Q2 FY 2020* Q2 FY 2019* Q1 FY 2020* H1 FY 2020* H1 FY 2019*
7.447.49
13.9214.87
16.05
6.767.33
13.54
6.73
14.31
Yearly (%) Quarterly (%)
Interest Income on Average Loan Assets
Interest Expense on Average Loan Assets
Net Interest Margin
*Under IND -AS
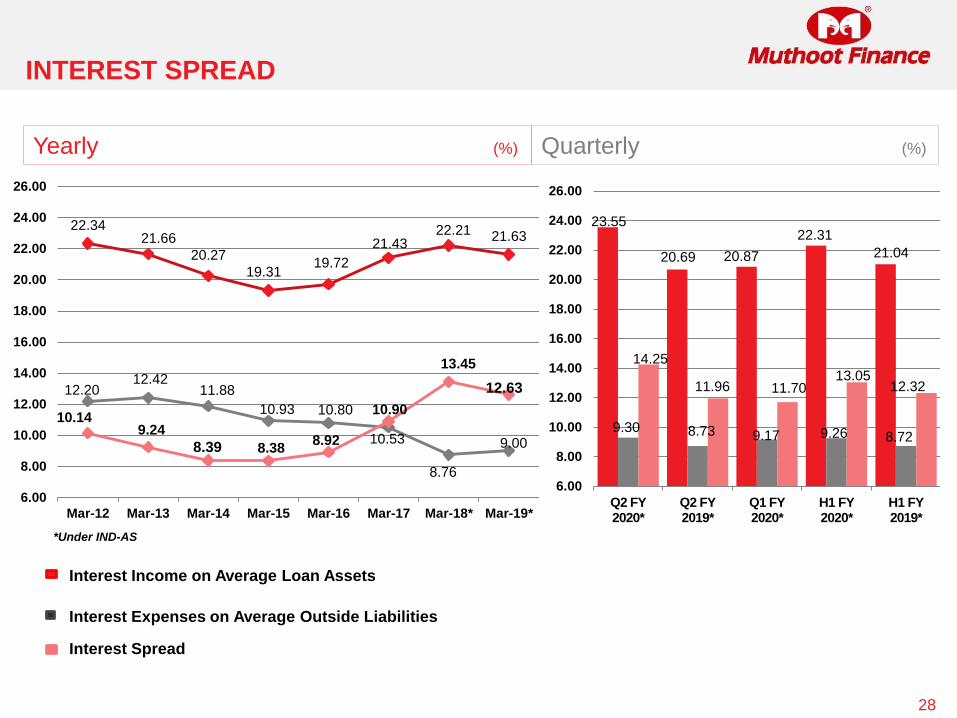
INTEREST SPREAD
28
22.3421.66
20.27
19.3119.72
21.4322.21 21.63
6.00
8.00
10.00
12.00
14.00
16.00
18.00
20.00
22.00
24.00
26.00
Mar-12 Mar-13 Mar-14 Mar-15 Mar-16 Mar-17 Mar-18* Mar-19*
13.45
10.149.24
8.39 9.00
8.76
12.2012.42
11.88
10.80
8.92 10.53
10.90
12.63
23.55
20.69 20.87
22.31
21.04
6.00
8.00
10.00
12.00
14.00
16.00
18.00
20.00
22.00
24.00
26.00
Q2 FY 2020*
Q2 FY 2019*
Q1 FY 2020*
H1 FY 2020*
H1 FY 2019*
9.30
14.25
8.728.73
11.96
9.17
11.7013.05
12.32
Yearly (%) Quarterly (%)
Interest Income on Average Loan Assets
Interest Expenses on Average Outside Liabilities
Interest Spread
8.38
10.93
*Under IND-AS
9.26

RETURN ON AVERAGE LOAN ASSETS
29
Yearly (%) Quarterly (%)
Attractive returns over the years
4.404.05
3.223.03 3.32
4.47
6.36
6.31
3.00
4.00
5.00
6.00
7.00
8.00
9.00
10.00
Mar-12 Mar-13 Mar-14 Mar-15 Mar-16 Mar-17 Mar-18* Mar-19*
9.59
6.11 6.05
7.87
6.33
3.00
4.00
5.00
6.00
7.00
8.00
9.00
10.00
Q2 FY2020*
Q2 FY2019*
Q1 FY2020*
H1 FY2020*
H1 FY2019*
*Under IND-AS
IMPAIRMENT OF LOAN ASSETS
30
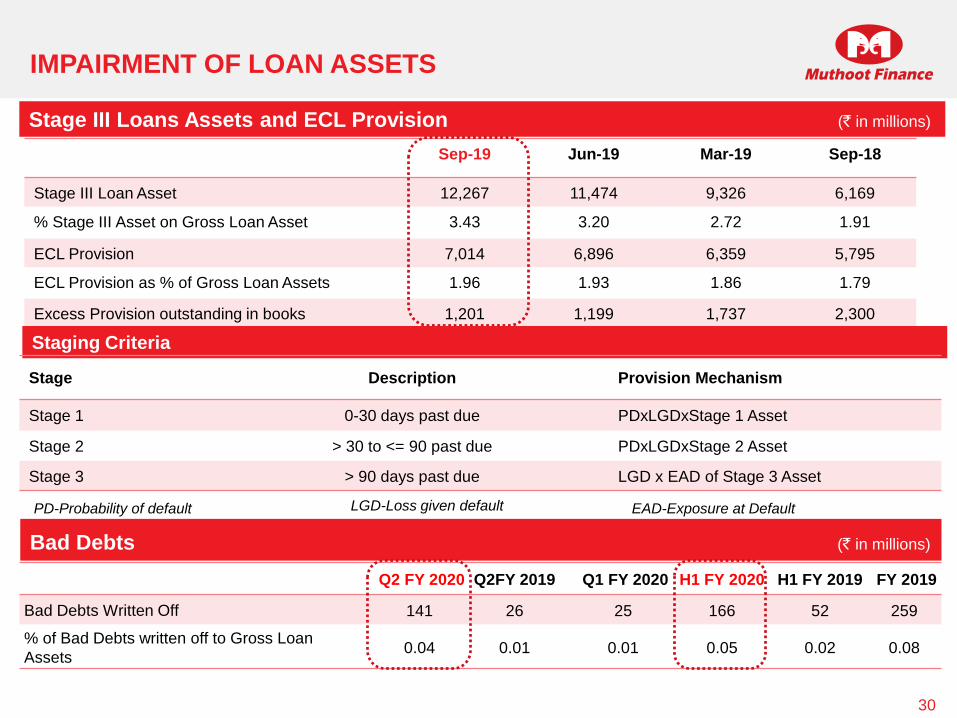
Sep-19 Jun-19 Mar-19 Sep-18
Stage III Loan Asset 12,267 11,474 9,326 6,169
% Stage III Asset on Gross Loan Asset 3.43 3.20 2.72 1.91
ECL Provision 7,014 6,896 6,359 5,795
ECL Provision as % of Gross Loan Assets 1.96 1.93 1.86 1.79
Excess Provision outstanding in books 1,201 1,199 1,737 2,300
Stage III Loans Assets and ECL Provision (` in millions)
Staging Criteria
Stage Description Provision Mechanism
Stage 1 0-30 days past due PDxLGDxStage 1 Asset
Stage 2 > 30 to <= 90 past due PDxLGDxStage 2 Asset
Stage 3 > 90 days past due LGD x EAD of Stage 3 Asset
PD-Probability of default LGD-Loss given default EAD-Exposure at Default
Bad Debts (` in millions)
Q2 FY 2020 Q2FY 2019 Q1 FY 2020 H1 FY 2020 H1 FY 2019 FY 2019
Bad Debts Written Off 141 26 25 166 52 259
% of Bad Debts written off to Gross Loan
Assets0.04 0.01 0.01 0.05 0.02 0.08
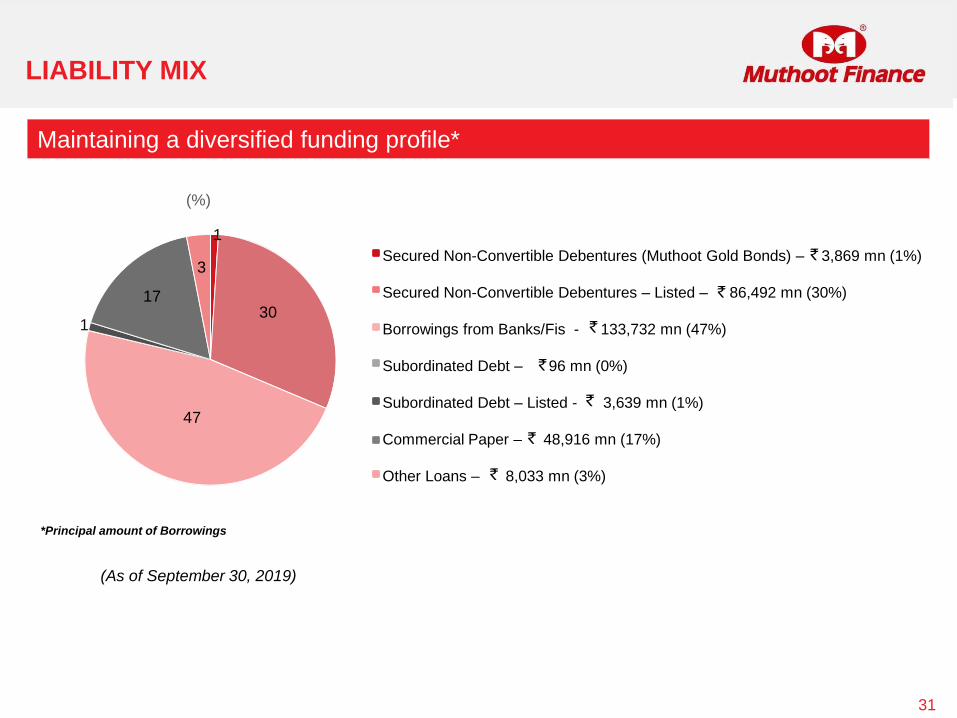
LIABILITY MIX
31
Maintaining a diversified funding profile*
(%)
(As of September 30, 2019)
30
1
Secured Non-Convertible Debentures (Muthoot Gold Bonds) – 3,869 mn (1%)
Secured Non-Convertible Debentures – Listed – 86,492 mn (30%)
Borrowings from Banks/Fis - 133,732 mn (47%)
Subordinated Debt – 96 mn (0%)
Subordinated Debt – Listed - 3,639 mn (1%)
Commercial Paper – 48,916 mn (17%)
Other Loans – 8,033 mn (3%)
47
3
1
`
`
`
`
`
`
`
17
*Principal amount of Borrowings
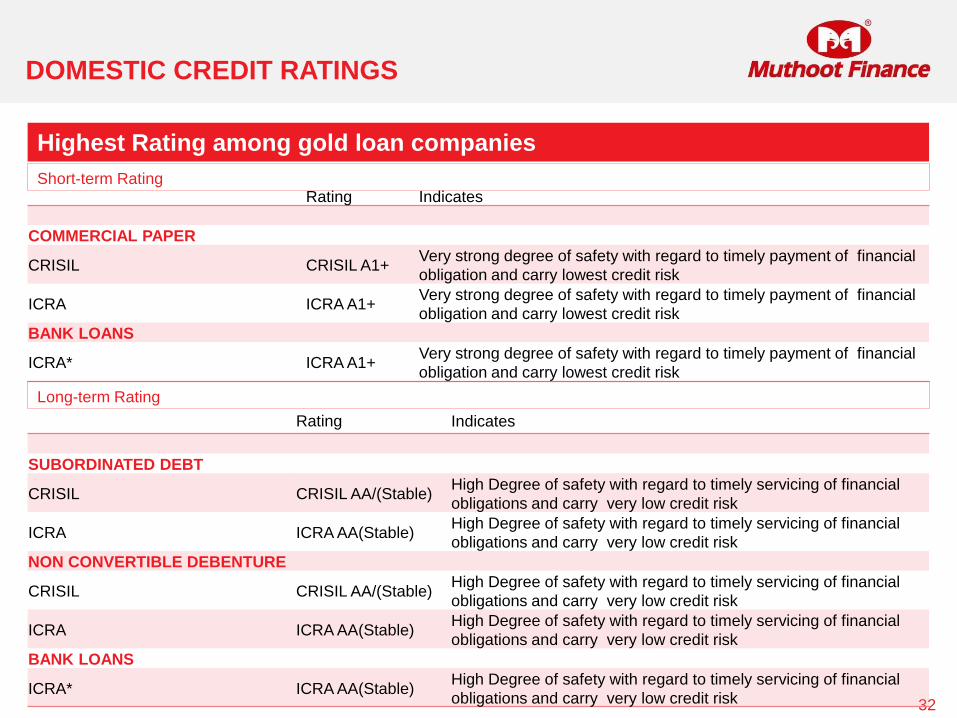
DOMESTIC CREDIT RATINGS
32
Rating Indicates
COMMERCIAL PAPER
CRISIL CRISIL A1+Very strong degree of safety with regard to timely payment of financial
obligation and carry lowest credit risk
ICRA ICRA A1+Very strong degree of safety with regard to timely payment of financial
obligation and carry lowest credit risk
BANK LOANS
ICRA* ICRA A1+Very strong degree of safety with regard to timely payment of financial
obligation and carry lowest credit risk
Long-term Rating
Rating Indicates
SUBORDINATED DEBT
CRISIL CRISIL AA/(Stable)High Degree of safety with regard to timely servicing of financial
obligations and carry very low credit risk
ICRA ICRA AA(Stable)High Degree of safety with regard to timely servicing of financial
obligations and carry very low credit risk
NON CONVERTIBLE DEBENTURE
CRISIL CRISIL AA/(Stable)High Degree of safety with regard to timely servicing of financial
obligations and carry very low credit risk
ICRA ICRA AA(Stable)High Degree of safety with regard to timely servicing of financial
obligations and carry very low credit risk
BANK LOANS
ICRA* ICRA AA(Stable)High Degree of safety with regard to timely servicing of financial
obligations and carry very low credit risk
Short-term Rating
Highest Rating among gold loan companies
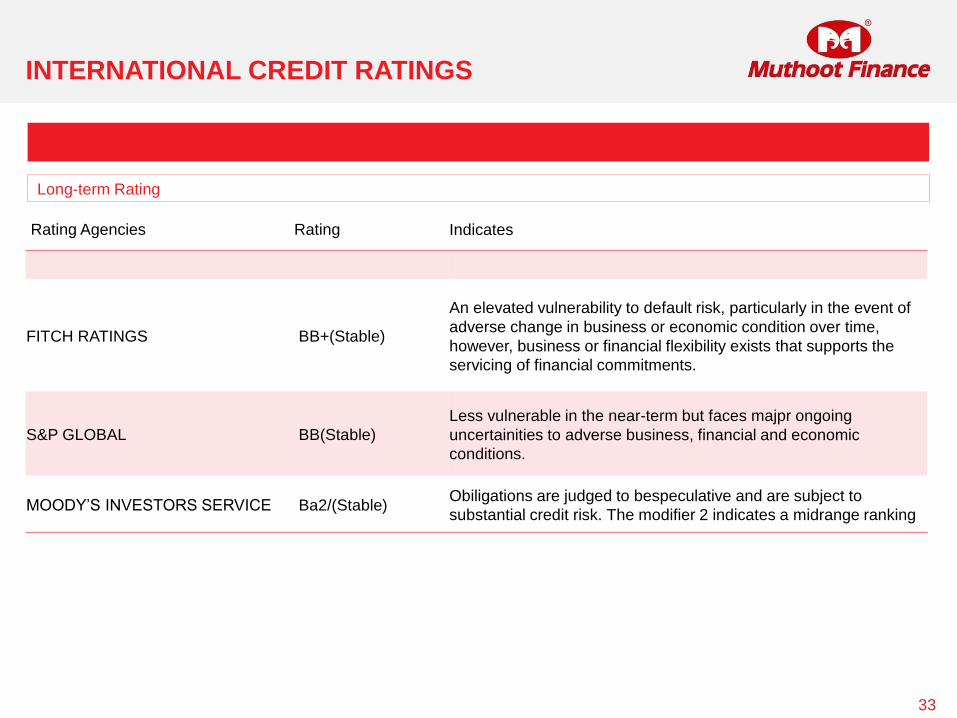
INTERNATIONAL CREDIT RATINGS
33
Long-term Rating
Rating Agencies Rating Indicates
FITCH RATINGS BB+(Stable)
An elevated vulnerability to default risk, particularly in the event of
adverse change in business or economic condition over time,
however, business or financial flexibility exists that supports the
servicing of financial commitments.
S&P GLOBAL BB(Stable)
Less vulnerable in the near-term but faces majpr ongoing
uncertainities to adverse business, financial and economic
conditions.
MOODY’S INVESTORS SERVICE Ba2/(Stable)Obiligations are judged to bespeculative and are subject to
substantial credit risk. The modifier 2 indicates a midrange ranking
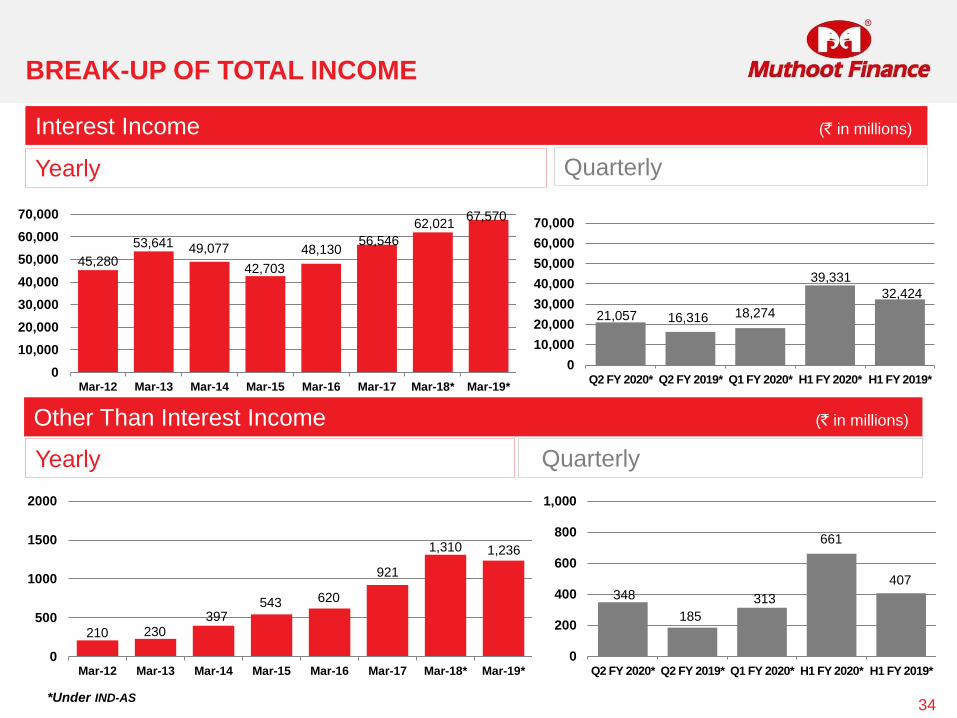
Interest Income (` in millions)
BREAK-UP OF TOTAL INCOME
34
Other Than Interest Income (` in millions)
21,057 16,316 18,274
39,331
32,424
0
10,000
20,000
30,000
40,000
50,000
60,000
70,000
Q2 FY 2020* Q2 FY 2019* Q1 FY 2020* H1 FY 2020* H1 FY 2019*
45,280
53,641 49,077
42,703
48,13056,546
62,02167,570
0
10,000
20,000
30,000
40,000
50,000
60,000
70,000
Mar-12 Mar-13 Mar-14 Mar-15 Mar-16 Mar-17 Mar-18* Mar-19*
210 230397
543 620
921
1,310 1,236
0
500
1000
1500
2000
Mar-12 Mar-13 Mar-14 Mar-15 Mar-16 Mar-17 Mar-18* Mar-19*
348
185
313
661
407
0
200
400
600
800
1,000
Q2 FY 2020* Q2 FY 2019* Q1 FY 2020* H1 FY 2020* H1 FY 2019*
Yearly Quarterly
Yearly Quarterly
*Under IND-AS

OPERATING EXPENSES TO AVERAGE LOAN ASSETS
35
4.024.08
4.46
5.01 5.10
5.635.43
4.89
2.50
3.00
3.50
4.00
4.50
5.00
5.50
6.00
6.50
7.00
7.50
8.00
Mar-12 Mar-13 Mar-14 Mar-15 Mar-16 Mar-17 Mar-18* Mar-19*
4.64 4.55 4.47 4.57 4.72
2.50
3.00
3.50
4.00
4.50
5.00
5.50
6.00
6.50
7.00
7.50
8.00
Q2 FY 2020*Q2 FY 2019*Q1 FY 2020*H1 FY 2020*H1 FY 2019*
Operational efficiency over the years
Yearly (%) Quarterly (%)
*Under IND AS
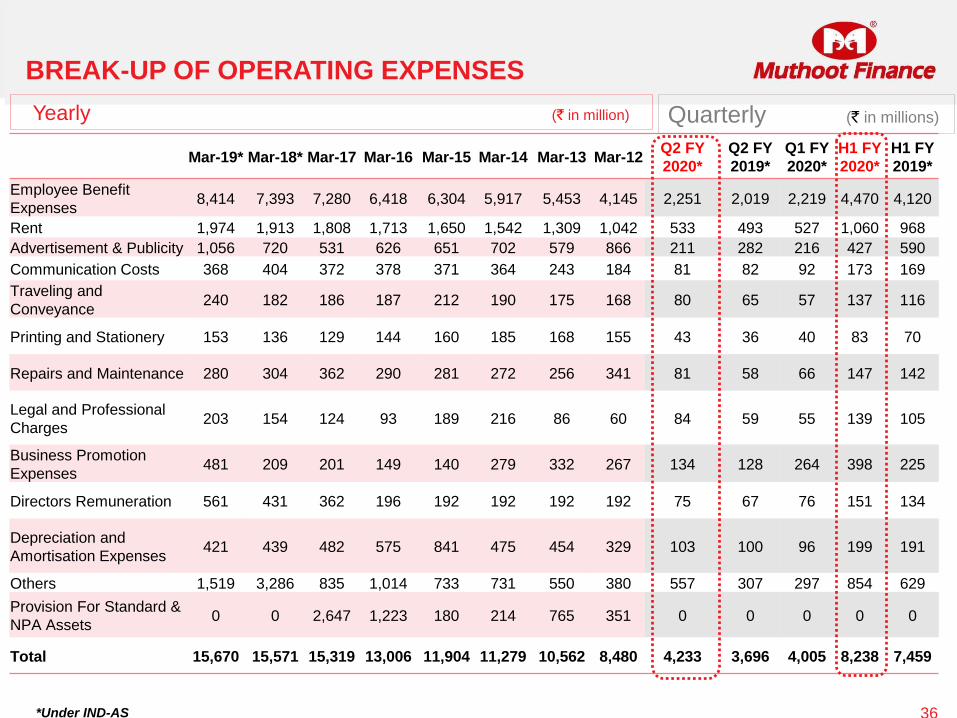
BREAK-UP OF OPERATING EXPENSES
Mar-19* Mar-18* Mar-17 Mar-16 Mar-15 Mar-14 Mar-13 Mar-12Q2 FY
2020*
Q2 FY
2019*
Q1 FY
2020*
H1 FY
2020*
H1 FY
2019*
Employee Benefit
Expenses8,414 7,393 7,280 6,418 6,304 5,917 5,453 4,145 2,251 2,019 2,219 4,470 4,120
Rent 1,974 1,913 1,808 1,713 1,650 1,542 1,309 1,042 533 493 527 1,060 968
Advertisement & Publicity 1,056 720 531 626 651 702 579 866 211 282 216 427 590
Communication Costs 368 404 372 378 371 364 243 184 81 82 92 173 169
Traveling and
Conveyance240 182 186 187 212 190 175 168 80 65 57 137 116
Printing and Stationery 153 136 129 144 160 185 168 155 43 36 40 83 70
Repairs and Maintenance 280 304 362 290 281 272 256 341 81 58 66 147 142
Legal and Professional
Charges203 154 124 93 189 216 86 60 84 59 55 139 105
Business Promotion
Expenses481 209 201 149 140 279 332 267 134 128 264 398 225
Directors Remuneration 561 431 362 196 192 192 192 192 75 67 76 151 134
Depreciation and
Amortisation Expenses421 439 482 575 841 475 454 329 103 100 96 199 191
Others 1,519 3,286 835 1,014 733 731 550 380 557 307 297 854 629
Provision For Standard &
NPA Assets0 0 2,647 1,223 180 214 765 351 0 0 0 0 0
Total 15,670 15,571 15,319 13,006 11,904 11,279 10,562 8,480 4,233 3,696 4,005 8,238 7,459
Yearly (` in million) Quarterly (` in millions)
36*Under IND-AS
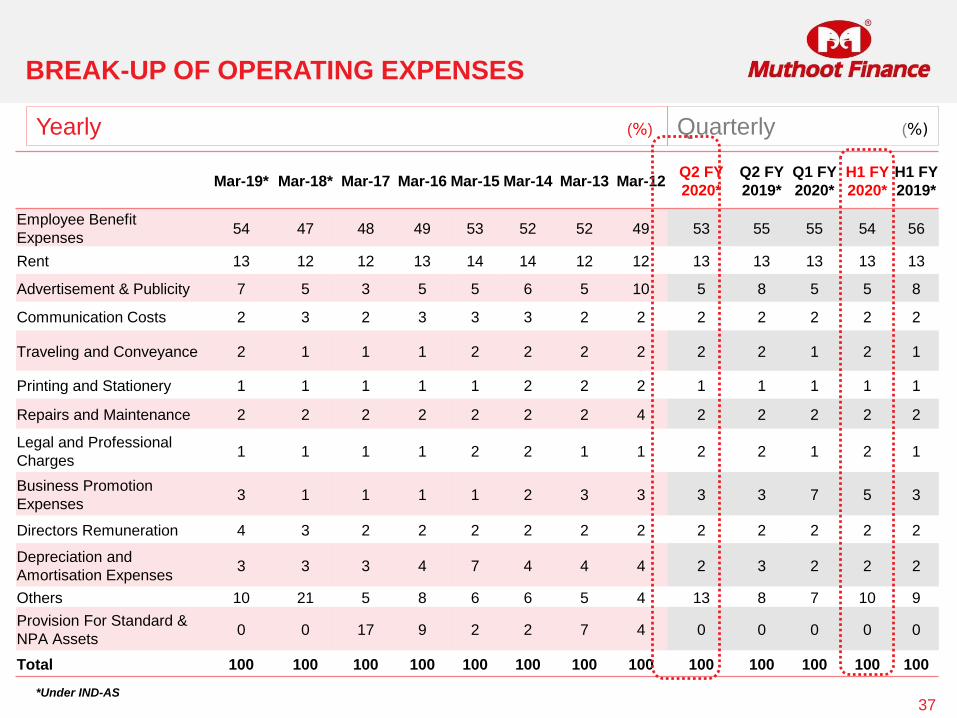
BREAK-UP OF OPERATING EXPENSES
Mar-19* Mar-18* Mar-17 Mar-16 Mar-15 Mar-14 Mar-13 Mar-12Q2 FY
2020*
Q2 FY
2019*
Q1 FY
2020*
H1 FY
2020*
H1 FY
2019*
Employee Benefit
Expenses54 47 48 49 53 52 52 49 53 55 55 54 56
Rent 13 12 12 13 14 14 12 12 13 13 13 13 13
Advertisement & Publicity 7 5 3 5 5 6 5 10 5 8 5 5 8
Communication Costs 2 3 2 3 3 3 2 2 2 2 2 2 2
Traveling and Conveyance 2 1 1 1 2 2 2 2 2 2 1 2 1
Printing and Stationery 1 1 1 1 1 2 2 2 1 1 1 1 1
Repairs and Maintenance 2 2 2 2 2 2 2 4 2 2 2 2 2
Legal and Professional
Charges1 1 1 1 2 2 1 1 2 2 1 2 1
Business Promotion
Expenses3 1 1 1 1 2 3 3 3 3 7 5 3
Directors Remuneration 4 3 2 2 2 2 2 2 2 2 2 2 2
Depreciation and
Amortisation Expenses3 3 3 4 7 4 4 4 2 3 2 2 2
Others 10 21 5 8 6 6 5 4 13 8 7 10 9
Provision For Standard &
NPA Assets0 0 17 9 2 2 7 4 0 0 0 0 0
Total 100 100 100 100 100 100 100 100 100 100 100 100 100
Yearly (%) Quarterly (%)
37*Under IND-AS
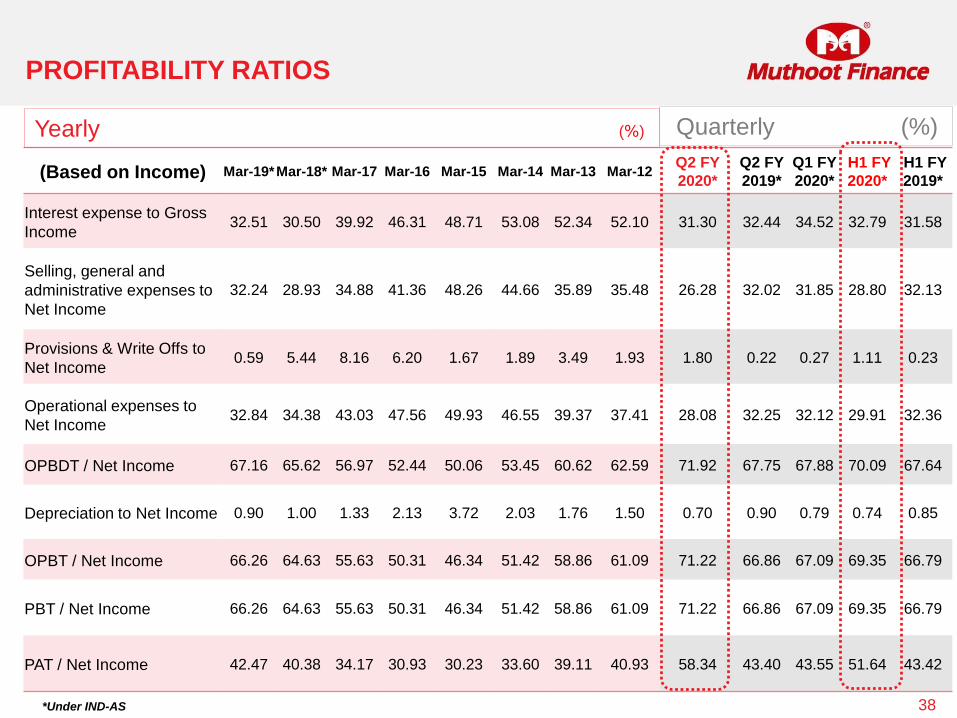
PROFITABILITY RATIOS
(Based on Income) Mar-19*Mar-18* Mar-17 Mar-16 Mar-15 Mar-14 Mar-13 Mar-12Q2 FY
2020*
Q2 FY
2019*
Q1 FY
2020*
H1 FY
2020*
H1 FY
2019*
Interest expense to Gross
Income32.51 30.50 39.92 46.31 48.71 53.08 52.34 52.10 31.30 32.44 34.52 32.79 31.58
Selling, general and
administrative expenses to
Net Income
32.24 28.93 34.88 41.36 48.26 44.66 35.89 35.48 26.28 32.02 31.85 28.80 32.13
Provisions & Write Offs to
Net Income0.59 5.44 8.16 6.20 1.67 1.89 3.49 1.93 1.80 0.22 0.27 1.11 0.23
Operational expenses to
Net Income32.84 34.38 43.03 47.56 49.93 46.55 39.37 37.41 28.08 32.25 32.12 29.91 32.36
OPBDT / Net Income 67.16 65.62 56.97 52.44 50.06 53.45 60.62 62.59 71.92 67.75 67.88 70.09 67.64
Depreciation to Net Income 0.90 1.00 1.33 2.13 3.72 2.03 1.76 1.50 0.70 0.90 0.79 0.74 0.85
OPBT / Net Income 66.26 64.63 55.63 50.31 46.34 51.42 58.86 61.09 71.22 66.86 67.09 69.35 66.79
PBT / Net Income 66.26 64.63 55.63 50.31 46.34 51.42 58.86 61.09 71.22 66.86 67.09 69.35 66.79
PAT / Net Income 42.47 40.38 34.17 30.93 30.23 33.60 39.11 40.93 58.34 43.40 43.55 51.64 43.42
Yearly (%) Quarterly (%)
38*Under IND-AS
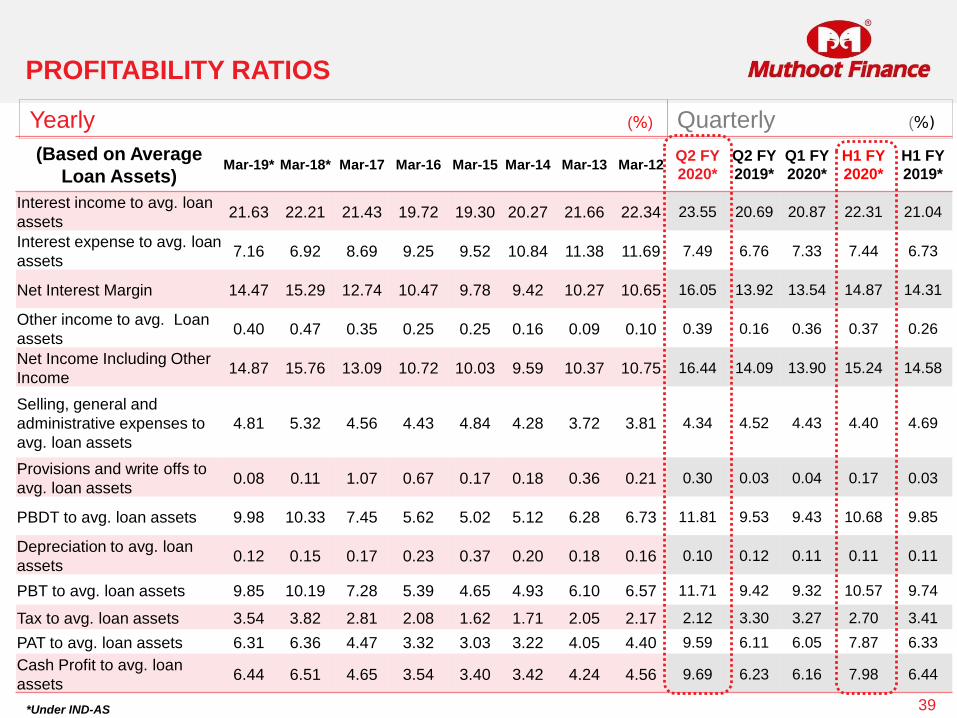
(Based on Average
Loan Assets)Mar-19* Mar-18* Mar-17 Mar-16 Mar-15 Mar-14 Mar-13 Mar-12
Q2 FY
2020*
Q2 FY
2019*
Q1 FY
2020*
H1 FY
2020*
H1 FY
2019*
Interest income to avg. loan
assets21.63 22.21 21.43 19.72 19.30 20.27 21.66 22.34 23.55 20.69 20.87 22.31 21.04
Interest expense to avg. loan
assets7.16 6.92 8.69 9.25 9.52 10.84 11.38 11.69 7.49 6.76 7.33 7.44 6.73
Net Interest Margin 14.47 15.29 12.74 10.47 9.78 9.42 10.27 10.65 16.05 13.92 13.54 14.87 14.31
Other income to avg. Loan
assets0.40 0.47 0.35 0.25 0.25 0.16 0.09 0.10 0.39 0.16 0.36 0.37 0.26
Net Income Including Other
Income14.87 15.76 13.09 10.72 10.03 9.59 10.37 10.75 16.44 14.09 13.90 15.24 14.58
Selling, general and
administrative expenses to
avg. loan assets
4.81 5.32 4.56 4.43 4.84 4.28 3.72 3.81 4.34 4.52 4.43 4.40 4.69
Provisions and write offs to
avg. loan assets0.08 0.11 1.07 0.67 0.17 0.18 0.36 0.21 0.30 0.03 0.04 0.17 0.03
PBDT to avg. loan assets 9.98 10.33 7.45 5.62 5.02 5.12 6.28 6.73 11.81 9.53 9.43 10.68 9.85
Depreciation to avg. loan
assets0.12 0.15 0.17 0.23 0.37 0.20 0.18 0.16 0.10 0.12 0.11 0.11 0.11
PBT to avg. loan assets 9.85 10.19 7.28 5.39 4.65 4.93 6.10 6.57 11.71 9.42 9.32 10.57 9.74
Tax to avg. loan assets 3.54 3.82 2.81 2.08 1.62 1.71 2.05 2.17 2.12 3.30 3.27 2.70 3.41
PAT to avg. loan assets 6.31 6.36 4.47 3.32 3.03 3.22 4.05 4.40 9.59 6.11 6.05 7.87 6.33
Cash Profit to avg. loan
assets6.44 6.51 4.65 3.54 3.40 3.42 4.24 4.56 9.69 6.23 6.16 7.98 6.44
Yearly (%) Quarterly (%)
39
PROFITABILITY RATIOS
*Under IND-AS
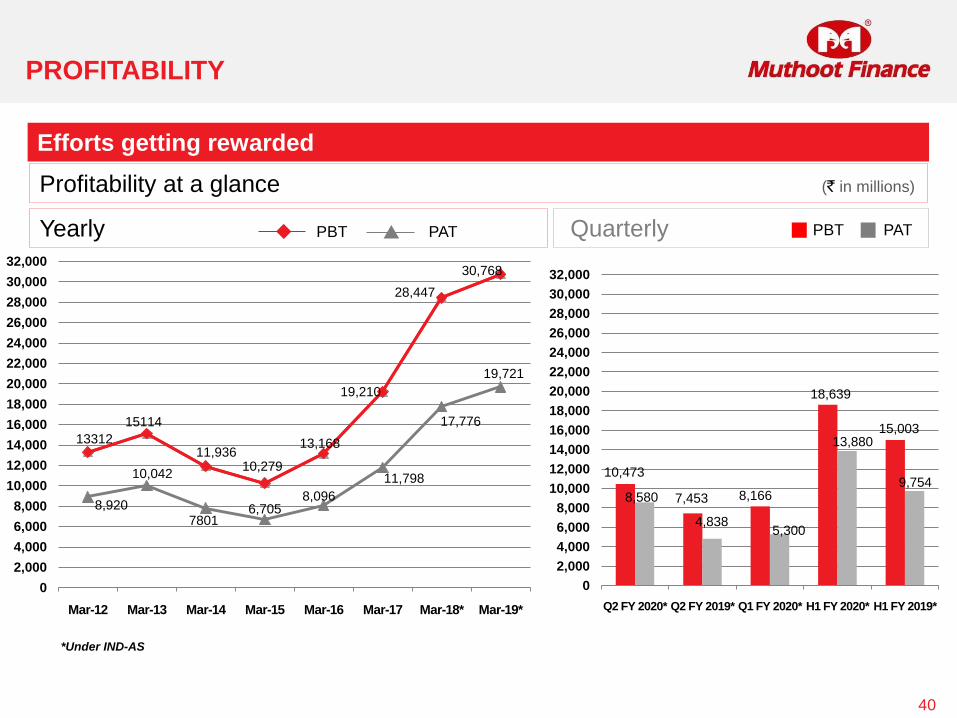
PROFITABILITY
40
Profitability at a glance (` in millions)
Efforts getting rewarded
13312
15114
11,936
28,447
13,168
10,279
8,920
10,042
78016,705
8,096
11,798
17,776
19,721
0
2,000
4,000
6,000
8,000
10,000
12,000
14,000
16,000
18,000
20,000
22,000
24,000
26,000
28,000
30,000
32,000
Mar-12 Mar-13 Mar-14 Mar-15 Mar-16 Mar-17 Mar-18* Mar-19*
19,210
30,768
10,473
7,453 8,166
18,639
9,7548,580
4,8385,300
13,88015,003
0
2,000
4,000
6,000
8,000
10,000
12,000
14,000
16,000
18,000
20,000
22,000
24,000
26,000
28,000
30,000
32,000
Q2 FY 2020* Q2 FY 2019* Q1 FY 2020* H1 FY 2020* H1 FY 2019*
Yearly QuarterlyPBT PAT PATPBT
*Under IND-AS
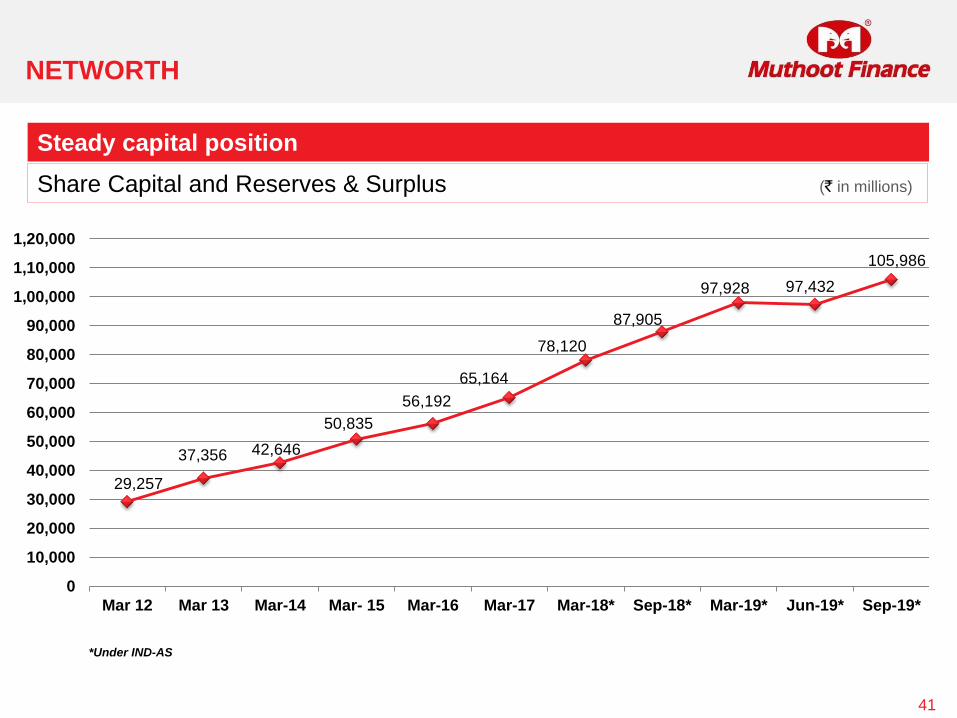
NETWORTH
41
Share Capital and Reserves & Surplus (` in millions)
Steady capital position
29,257
37,356 42,646
50,835
56,192
65,164
78,120
87,905
97,928 97,432
105,986
0
10,000
20,000
30,000
40,000
50,000
60,000
70,000
80,000
90,000
1,00,000
1,10,000
1,20,000
Mar 12 Mar 13 Mar-14 Mar- 15 Mar-16 Mar-17 Mar-18* Sep-18* Mar-19* Jun-19* Sep-19*
*Under IND-AS
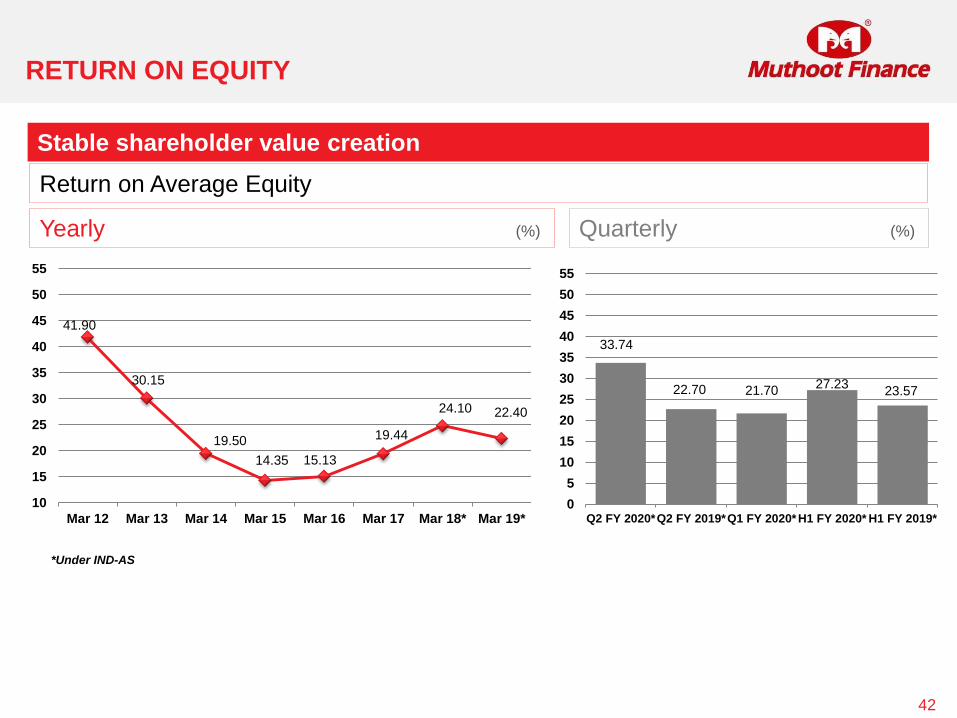
RETURN ON EQUITY
42
Return on Average Equity
Stable shareholder value creation
41.90
30.15
19.50
14.35 15.13
19.44
24.10 22.40
10
15
20
25
30
35
40
45
50
55
Mar 12 Mar 13 Mar 14 Mar 15 Mar 16 Mar 17 Mar 18* Mar 19*
33.74
22.70 21.7027.23
23.57
0
5
10
15
20
25
30
35
40
45
50
55
Q2 FY 2020*Q2 FY 2019*Q1 FY 2020* H1 FY 2020* H1 FY 2019*
Yearly (%) Quarterly (%)
*Under IND-AS
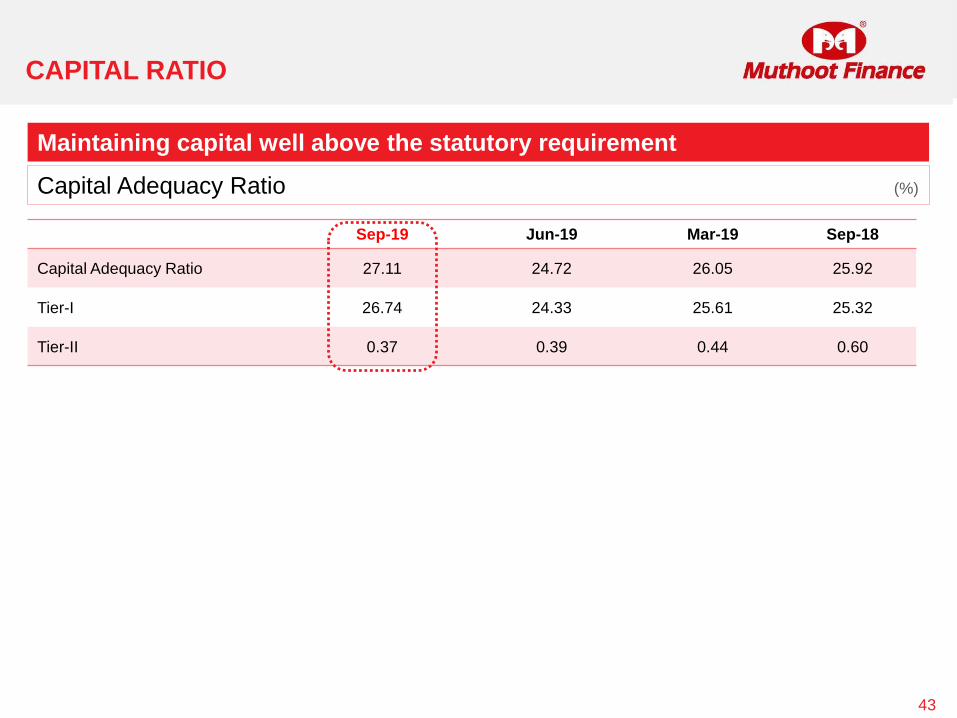
CAPITAL RATIO
43
Sep-19 Jun-19 Mar-19 Sep-18
Capital Adequacy Ratio 27.11 24.72 26.05 25.92
Tier-I 26.74 24.33 25.61 25.32
Tier-II 0.37 0.39 0.44 0.60
Maintaining capital well above the statutory requirement
Capital Adequacy Ratio (%)
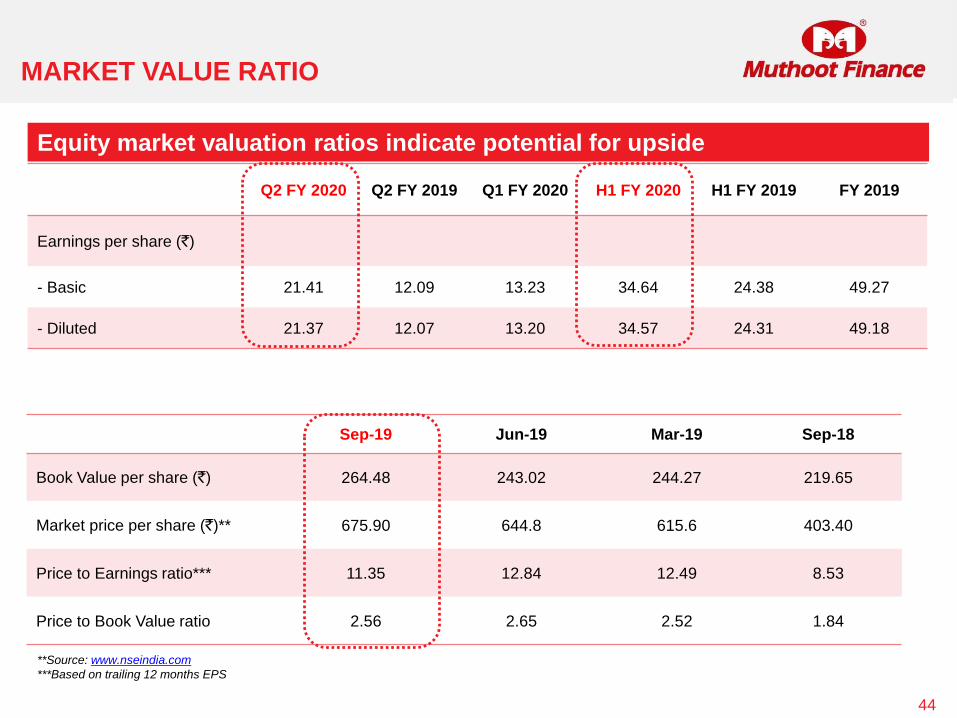
MARKET VALUE RATIO
44
Q2 FY 2020 Q2 FY 2019 Q1 FY 2020 H1 FY 2020 H1 FY 2019 FY 2019
Earnings per share (`)
- Basic 21.41 12.09 13.23 34.64 24.38 49.27
- Diluted 21.37 12.07 13.20 34.57 24.31 49.18
**Source: www.nseindia.com
***Based on trailing 12 months EPS
Equity market valuation ratios indicate potential for upside
Sep-19 Jun-19 Mar-19 Sep-18
Book Value per share (`) 264.48 243.02 244.27 219.65
Market price per share (`)** 675.90 644.8 615.6 403.40
Price to Earnings ratio*** 11.35 12.84 12.49 8.53
Price to Book Value ratio 2.56 2.65 2.52 1.84
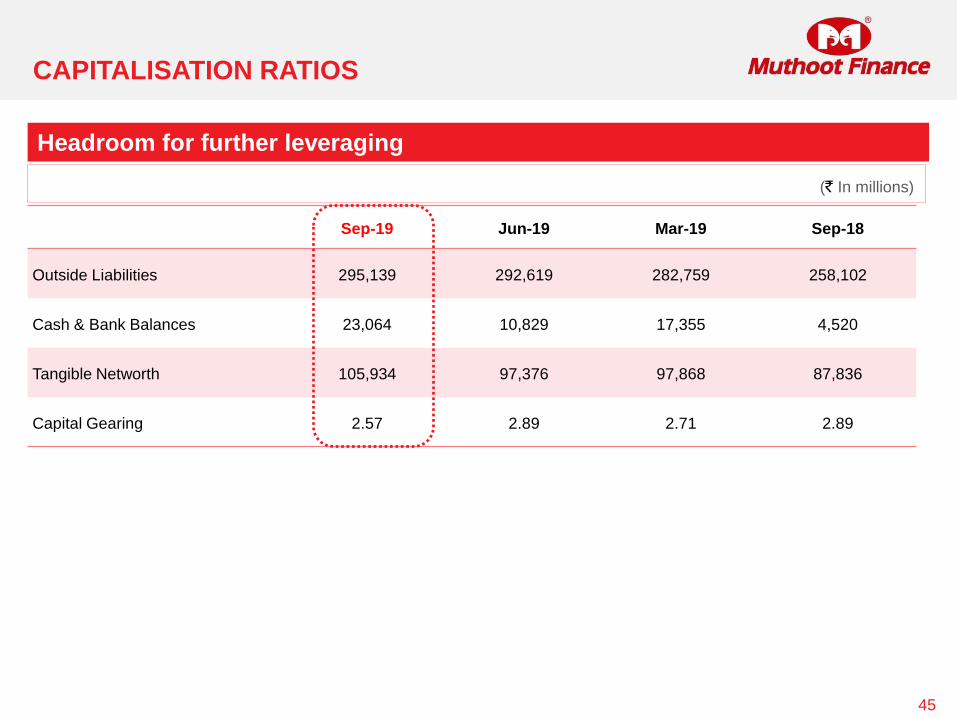
CAPITALISATION RATIOS
45
Sep-19 Jun-19 Mar-19 Sep-18
Outside Liabilities 295,139 292,619 282,759 258,102
Cash & Bank Balances 23,064 10,829 17,355 4,520
Tangible Networth 105,934 97,376 97,868 87,836
Capital Gearing 2.57 2.89 2.71 2.89
(` In millions)
Headroom for further leveraging
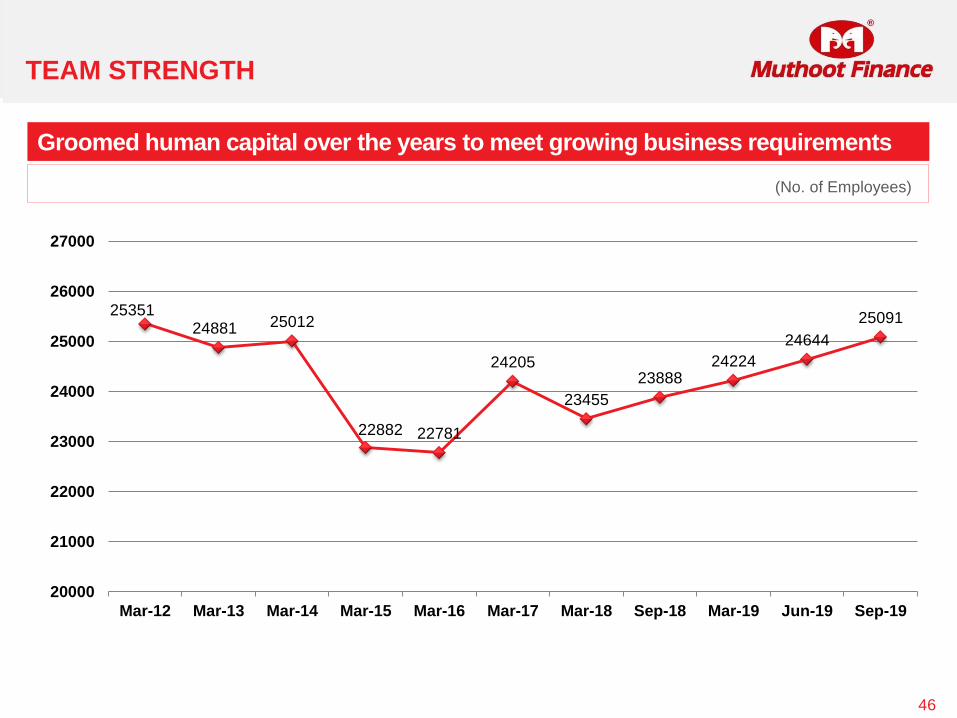
TEAM STRENGTH
46
2535124881 25012
22882 22781
24205
23455
2388824224
24644
25091
20000
21000
22000
23000
24000
25000
26000
27000
Mar-12 Mar-13 Mar-14 Mar-15 Mar-16 Mar-17 Mar-18 Sep-18 Mar-19 Jun-19 Sep-19
Groomed human capital over the years to meet growing business requirements
(No. of Employees)

OUR SUBSIDIARY
47

ASIA ASSET FINANCE PLC – AN OVERVIEW
48
Asia Asset Finance PLC, (AAF) Colombo, Sri Lanka became a foreign subsidiary of Muthoot Finance on
December 31, 2014 . As on September 30, 2019, total holding in AAF stood at 90 million equity shares
representing 72.92% of their total capital. The loan portfolio stands at LKR 13,143 million as on September 30,
2019
AAF is a Registered Financial Company based in Sri Lanka a fully licensed, deposit-taking institution
registered with the Central Bank of Sri Lanka and listed in the Colombo Stock Exchange
AAF is in lending business since 1970. At present the company is involved in Retail Finance, Hire Purchase
& Business Loans and has 25 branches across Sri Lanka.
The company formerly known as Finance and Land Sales has been in operation for over 48 years, evolving
to serve the growing needs of people of Sri Lanka.
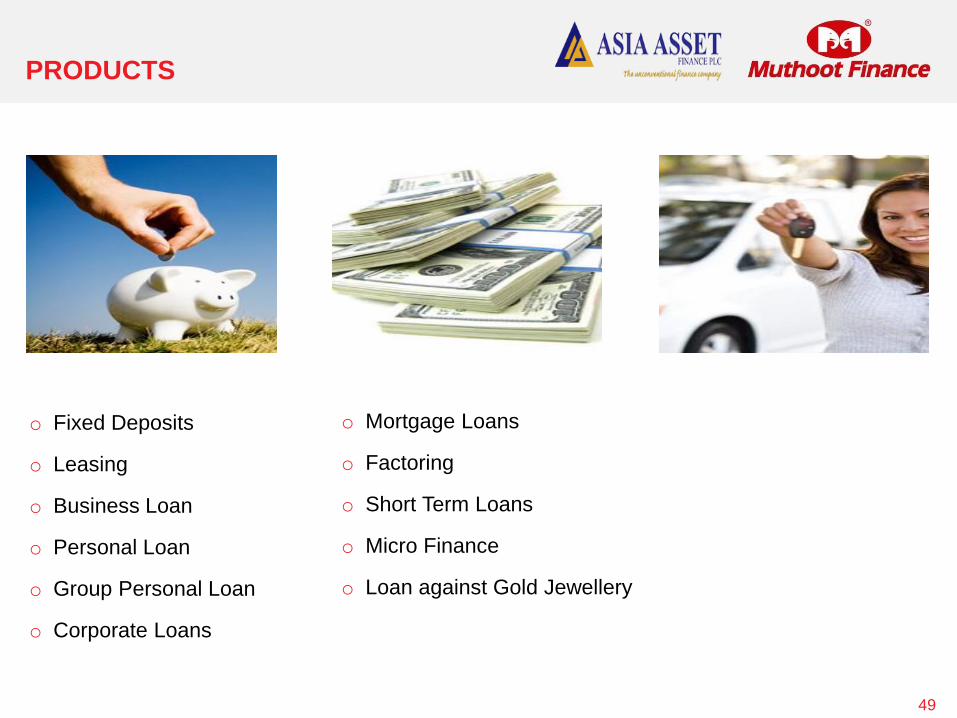
PRODUCTS
49
o Fixed Deposits
o Leasing
o Business Loan
o Personal Loan
o Group Personal Loan
o Corporate Loans
o Mortgage Loans
o Factoring
o Short Term Loans
o Micro Finance
o Loan against Gold Jewellery
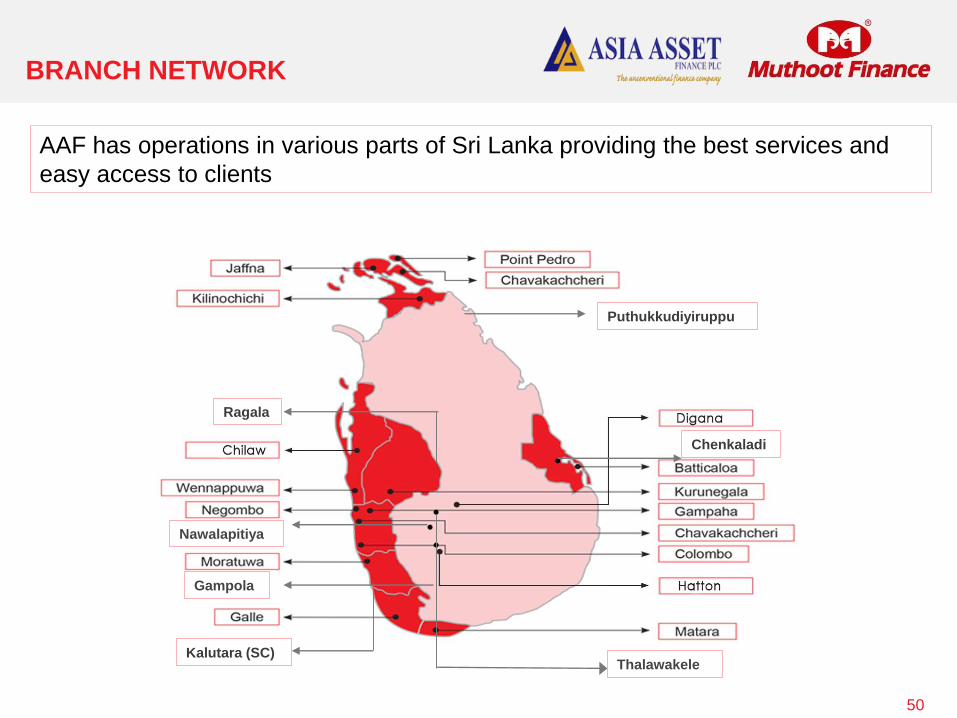
BRANCH NETWORK
50
AAF has operations in various parts of Sri Lanka providing the best services and
easy access to clients
Chenkaladi
Thalawakele
Nawalapitiya
Gampola
Puthukkudiyiruppu
Kalutara (SC)
Ragala
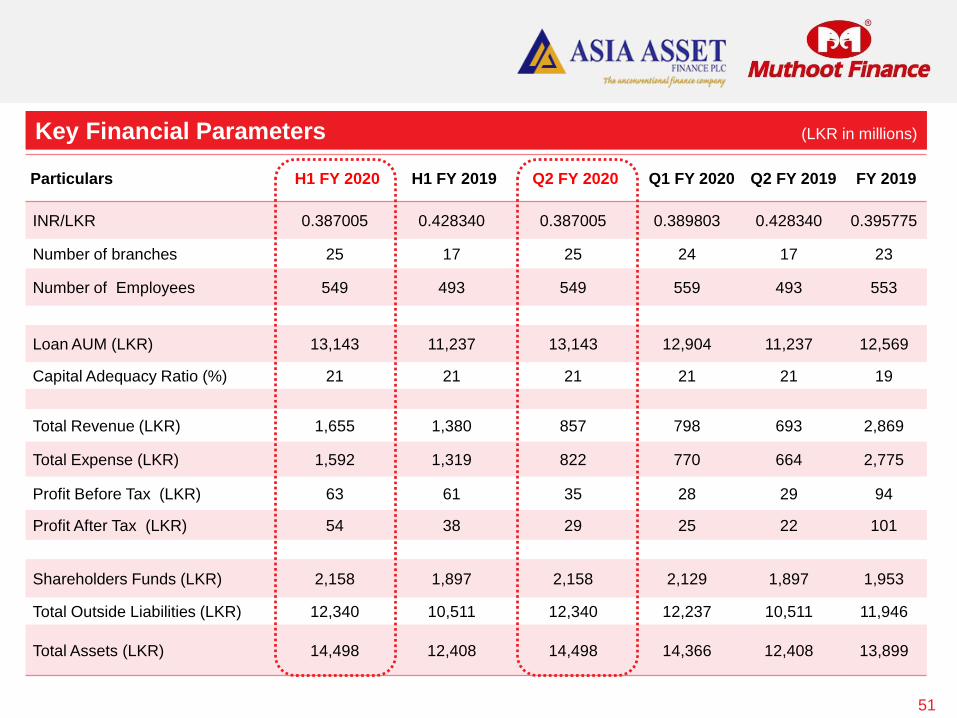
Particulars H1 FY 2020 H1 FY 2019 Q2 FY 2020 Q1 FY 2020 Q2 FY 2019 FY 2019
INR/LKR 0.387005 0.428340 0.387005 0.389803 0.428340 0.395775
Number of branches 25 17 25 24 17 23
Number of Employees 549 493 549 559 493 553
Loan AUM (LKR) 13,143 11,237 13,143 12,904 11,237 12,569
Capital Adequacy Ratio (%) 21 21 21 21 21 19
Total Revenue (LKR) 1,655 1,380 857 798 693 2,869
Total Expense (LKR) 1,592 1,319 822 770 664 2,775
Profit Before Tax (LKR) 63 61 35 28 29 94
Profit After Tax (LKR) 54 38 29 25 22 101
Shareholders Funds (LKR) 2,158 1,897 2,158 2,129 1,897 1,953
Total Outside Liabilities (LKR) 12,340 10,511 12,340 12,237 10,511 11,946
Total Assets (LKR) 14,498 12,408 14,498 14,366 12,408 13,899
51
Key Financial Parameters (LKR in millions)
OUR SUBSIDIARY
52

MUTHOOT HOMEFIN – AN OVERVIEW
Muthoot Homefin (India) Limited is a Housing Finance Company registered with The National Housing Bank
(NHB). It became a wholly owned subsidiary of Muthoot Finance Ltd in Aug’17.
MHIL focuses on extending affordable housing finance and targets customers in Economically Weaker
Sections (EWS) and Lower Income Groups (LIG) in Tier II & Tier III locations.
It operates on a ‘Hub and Spoke’ model, with the centralised processing at Corporate Office at Mumbai. MHIL
has operations in Kerala, Maharashtra, Gujarat, Rajasthan, Madhya Pradesh, Chandigarh, Andhra Pradesh,
Telangana, Karnataka, Uttar Pradesh, Haryana, Punjab, Delhi, Tamil Nadu, Chattisgarh and Pondicherry.
As on September 30, 2019, it has a loan portfolio of Rs.20,975 million.
53
ICRA assigned Long Term Debt Rating of ICRA AA-(Stable) for its Bank limits and Short Term Debt Rating
of ICRA A1+ for its Commercial Paper. CRISIL Upgraded long term rating from AA-(Stable) to AA (Stable).
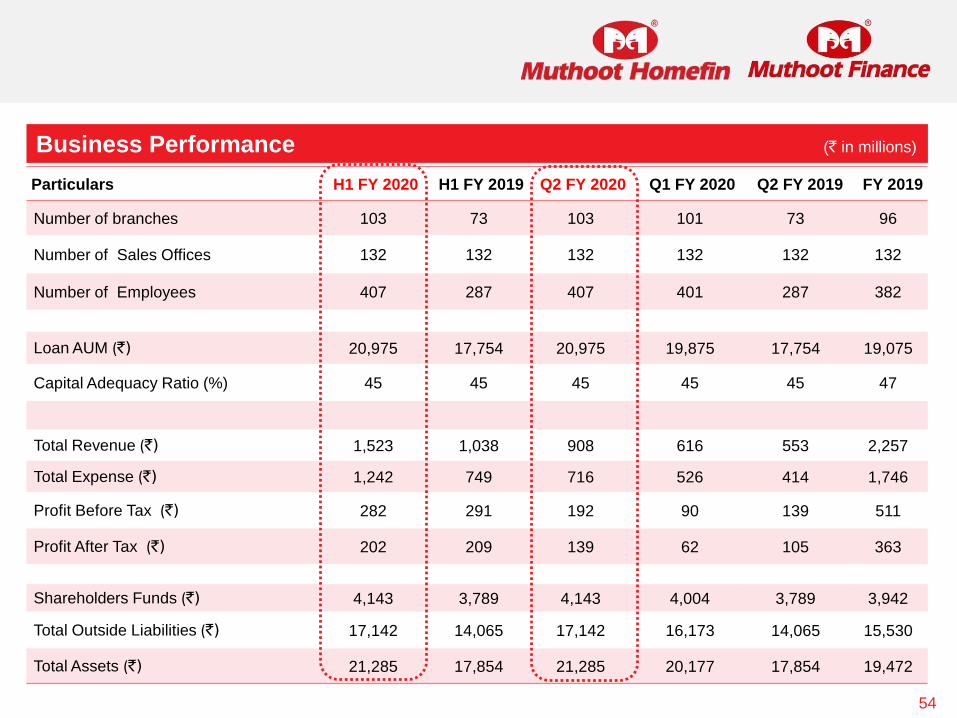
Particulars H1 FY 2020 H1 FY 2019 Q2 FY 2020 Q1 FY 2020 Q2 FY 2019 FY 2019
Number of branches 103 73 103 101 73 96
Number of Sales Offices 132 132 132 132 132 132
Number of Employees 407 287 407 401 287 382
Loan AUM (`) 20,975 17,754 20,975 19,875 17,754 19,075
Capital Adequacy Ratio (%) 45 45 45 45 45 47
Total Revenue (`) 1,523 1,038 908 616 553 2,257
Total Expense (`) 1,242 749 716 526 414 1,746
Profit Before Tax (`) 282 291 192 90 139 511
Profit After Tax (`) 202 209 139 62 105 363
Shareholders Funds (`) 4,143 3,789 4,143 4,004 3,789 3,942
Total Outside Liabilities (`) 17,142 14,065 17,142 16,173 14,065 15,530
Total Assets (`) 21,285 17,854 21,285 20,177 17,854 19,472
Business Performance (` in millions)
54
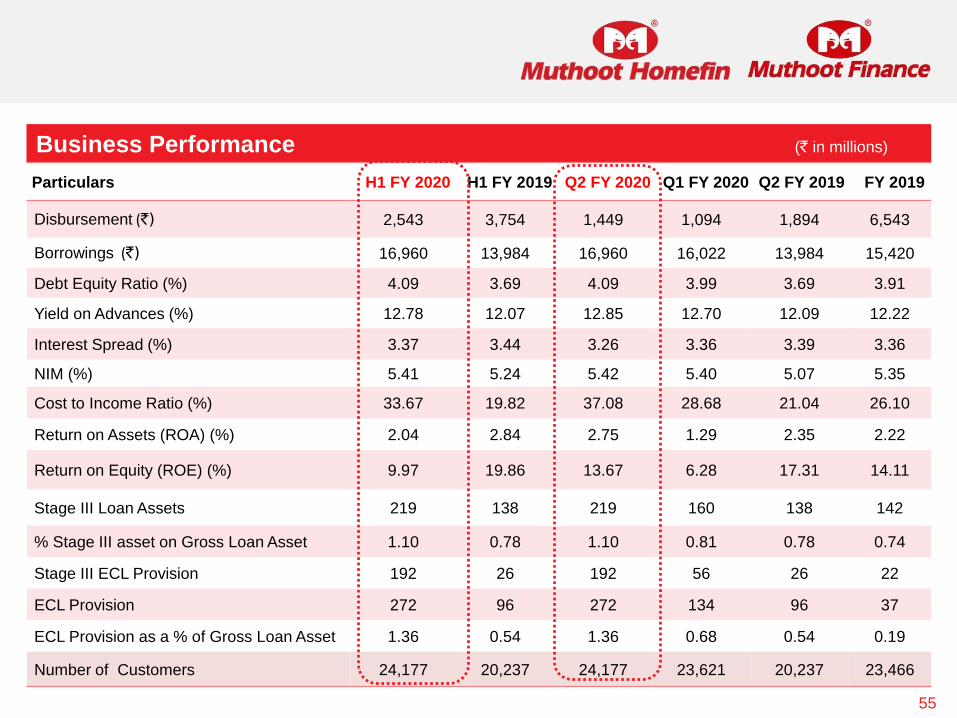
Business Performance (` in millions)
Particulars H1 FY 2020 H1 FY 2019 Q2 FY 2020 Q1 FY 2020 Q2 FY 2019 FY 2019
Disbursement (`) 2,543 3,754 1,449 1,094 1,894 6,543
Borrowings (`) 16,960 13,984 16,960 16,022 13,984 15,420
Debt Equity Ratio (%) 4.09 3.69 4.09 3.99 3.69 3.91
Yield on Advances (%) 12.78 12.07 12.85 12.70 12.09 12.22
Interest Spread (%) 3.37 3.44 3.26 3.36 3.39 3.36
NIM (%) 5.41 5.24 5.42 5.40 5.07 5.35
Cost to Income Ratio (%) 33.67 19.82 37.08 28.68 21.04 26.10
Return on Assets (ROA) (%) 2.04 2.84 2.75 1.29 2.35 2.22
Return on Equity (ROE) (%) 9.97 19.86 13.67 6.28 17.31 14.11
Stage III Loan Assets 219 138 219 160 138 142
% Stage III asset on Gross Loan Asset 1.10 0.78 1.10 0.81 0.78 0.74
Stage III ECL Provision 192 26 192 56 26 22
ECL Provision 272 96 272 134 96 37
ECL Provision as a % of Gross Loan Asset 1.36 0.54 1.36 0.68 0.54 0.19
Number of Customers 24,177 20,237 24,177 23,621 20,237 23,466
55
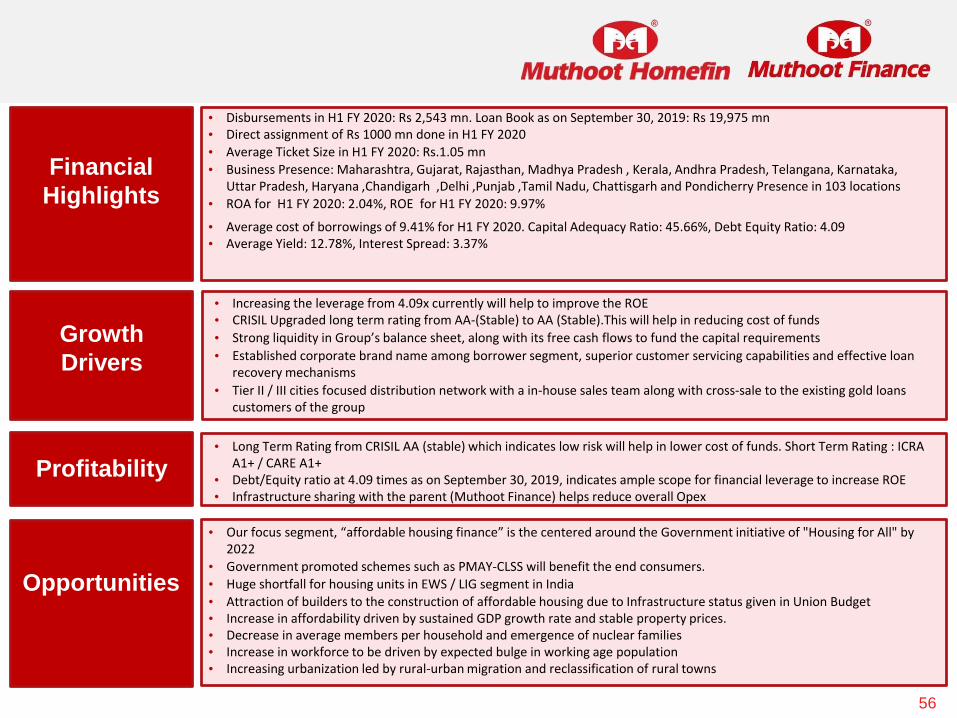
Financial
Highlights
Growth
Drivers
Profitability
Opportunities
• Disbursements in H1 FY 2020: Rs 2,543 mn. Loan Book as on September 30, 2019: Rs 19,975 mn• Direct assignment of Rs 1000 mn done in H1 FY 2020
• Average Ticket Size in H1 FY 2020: Rs.1.05 mn
• Business Presence: Maharashtra, Gujarat, Rajasthan, Madhya Pradesh , Kerala, Andhra Pradesh, Telangana, Karnataka, Uttar Pradesh, Haryana ,Chandigarh ,Delhi ,Punjab ,Tamil Nadu, Chattisgarh and Pondicherry Presence in 103 locations
• ROA for H1 FY 2020: 2.04%, ROE for H1 FY 2020: 9.97%
• Average cost of borrowings of 9.41% for H1 FY 2020. Capital Adequacy Ratio: 45.66%, Debt Equity Ratio: 4.09• Average Yield: 12.78%, Interest Spread: 3.37%
• Increasing the leverage from 4.09x currently will help to improve the ROE• CRISIL Upgraded long term rating from AA-(Stable) to AA (Stable).This will help in reducing cost of funds
• Strong liquidity in Group’s balance sheet, along with its free cash flows to fund the capital requirements
• Established corporate brand name among borrower segment, superior customer servicing capabilities and effective loan recovery mechanisms
• Tier II / III cities focused distribution network with a in-house sales team along with cross-sale to the existing gold loans customers of the group
• Long Term Rating from CRISIL AA (stable) which indicates low risk will help in lower cost of funds. Short Term Rating : ICRA A1+ / CARE A1+
• Debt/Equity ratio at 4.09 times as on September 30, 2019, indicates ample scope for financial leverage to increase ROE• Infrastructure sharing with the parent (Muthoot Finance) helps reduce overall Opex
• Our focus segment, “affordable housing finance” is the centered around the Government initiative of "Housing for All" by 2022
• Government promoted schemes such as PMAY-CLSS will benefit the end consumers.
• Huge shortfall for housing units in EWS / LIG segment in India
• Attraction of builders to the construction of affordable housing due to Infrastructure status given in Union Budget• Increase in affordability driven by sustained GDP growth rate and stable property prices.• Decrease in average members per household and emergence of nuclear families• Increase in workforce to be driven by expected bulge in working age population• Increasing urbanization led by rural-urban migration and reclassification of rural towns
56

OUR SUBSIDIARY
57

MUTHOOT INSURANCE – AN OVERVIEW
MIBPL became a wholly owned subsidiary of Muthoot Finance Ltd in Sep 2016. MIBPL is an unlisted private
limited company holding a licence to act as Direct Broker from IRDA since 2013.
It is actively distributing both life and non-life insurance products of various insurance companies.
During Q2 FY20,it has insured more than 7,18,000 lives with a First year premium collection of Rs.461 million
During Q2 FY19,it has insured more than 5,40,000 lives with a First year premium collection of Rs.477 million
under Traditional ,Term and Health products..
58
59
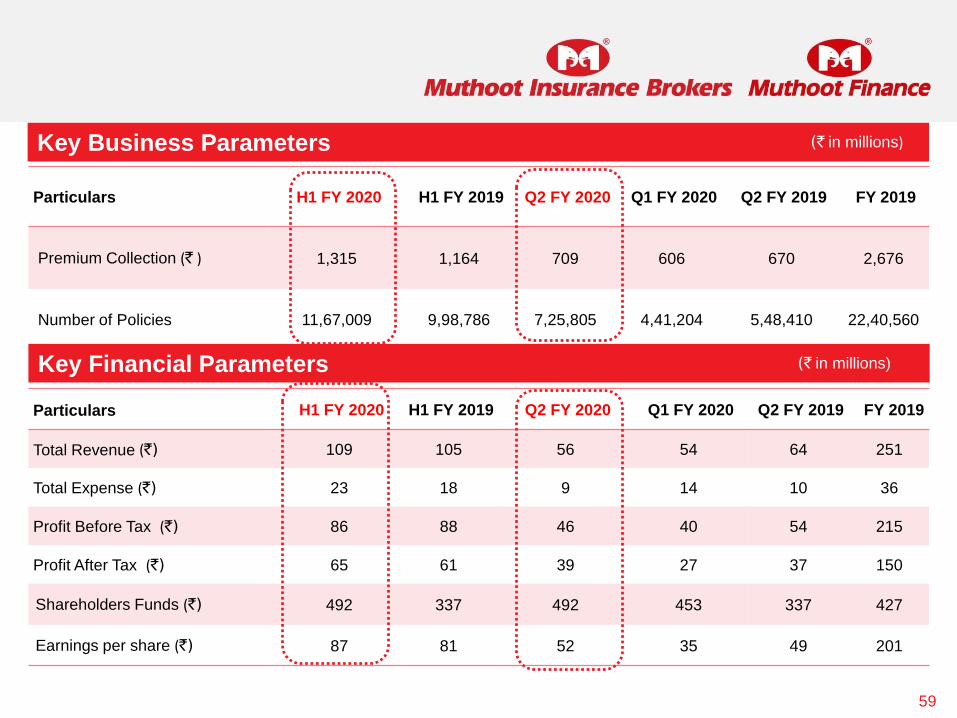
Particulars H1 FY 2020 H1 FY 2019 Q2 FY 2020 Q1 FY 2020 Q2 FY 2019 FY 2019
Premium Collection (` ) 1,315 1,164 709 606 670 2,676
Number of Policies 11,67,009 9,98,786 7,25,805 4,41,204 5,48,410 22,40,560
Key Business Parameters (` in millions)
Particulars H1 FY 2020 H1 FY 2019 Q2 FY 2020 Q1 FY 2020 Q2 FY 2019 FY 2019
Total Revenue (`) 109 105 56 54 64 251
Total Expense (`) 23 18 9 14 10 36
Profit Before Tax (`) 86 88 46 40 54 215
Profit After Tax (`) 65 61 39 27 37 150
Shareholders Funds (`) 492 337 492 453 337 427
Earnings per share (`) 87 81 52 35 49 201
Key Financial Parameters (` in millions)
OUR SUBSIDIARY
60
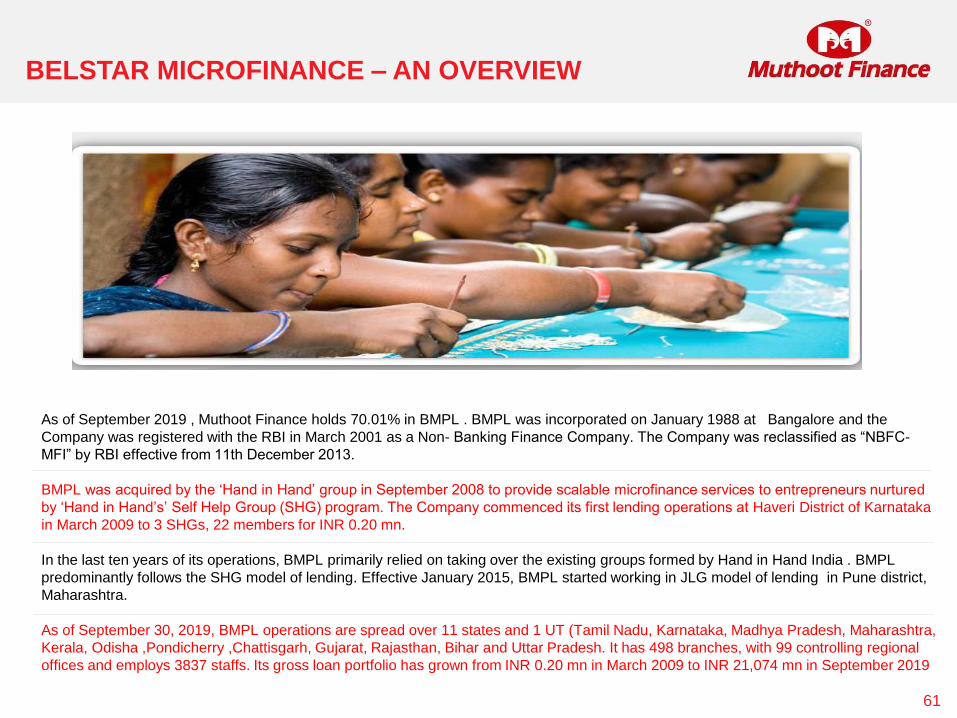
BELSTAR MICROFINANCE – AN OVERVIEW
As of September 2019 , Muthoot Finance holds 70.01% in BMPL . BMPL was incorporated on January 1988 at Bangalore and the
Company was registered with the RBI in March 2001 as a Non- Banking Finance Company. The Company was reclassified as “NBFC-
MFI” by RBI effective from 11th December 2013.
BMPL was acquired by the ‘Hand in Hand’ group in September 2008 to provide scalable microfinance services to entrepreneurs nurtured
by ‘Hand in Hand’s’ Self Help Group (SHG) program. The Company commenced its first lending operations at Haveri District of Karnataka
in March 2009 to 3 SHGs, 22 members for INR 0.20 mn.
In the last ten years of its operations, BMPL primarily relied on taking over the existing groups formed by Hand in Hand India . BMPL
predominantly follows the SHG model of lending. Effective January 2015, BMPL started working in JLG model of lending in Pune district,
Maharashtra.
As of September 30, 2019, BMPL operations are spread over 11 states and 1 UT (Tamil Nadu, Karnataka, Madhya Pradesh, Maharashtra,
Kerala, Odisha ,Pondicherry ,Chattisgarh, Gujarat, Rajasthan, Bihar and Uttar Pradesh. It has 498 branches, with 99 controlling regional
offices and employs 3837 staffs. Its gross loan portfolio has grown from INR 0.20 mn in March 2009 to INR 21,074 mn in September 2019
61
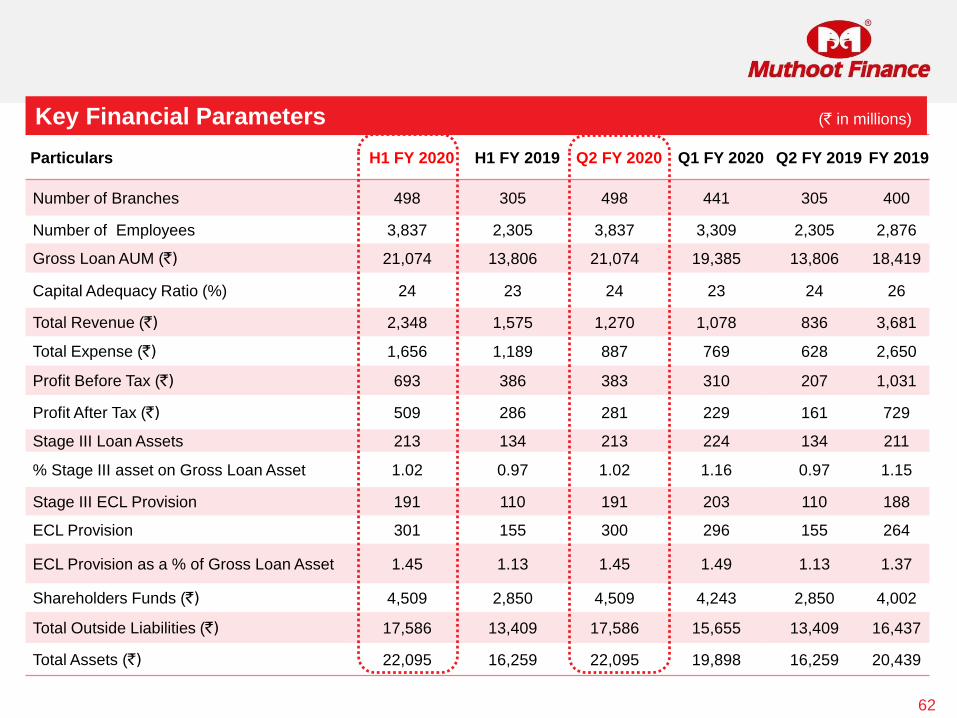
Particulars H1 FY 2020 H1 FY 2019 Q2 FY 2020 Q1 FY 2020 Q2 FY 2019 FY 2019
Number of Branches 498 305 498 441 305 400
Number of Employees 3,837 2,305 3,837 3,309 2,305 2,876
Gross Loan AUM (`) 21,074 13,806 21,074 19,385 13,806 18,419
Capital Adequacy Ratio (%) 24 23 24 23 24 26
Total Revenue (`) 2,348 1,575 1,270 1,078 836 3,681
Total Expense (`) 1,656 1,189 887 769 628 2,650
Profit Before Tax (`) 693 386 383 310 207 1,031
Profit After Tax (`) 509 286 281 229 161 729
Stage III Loan Assets 213 134 213 224 134 211
% Stage III asset on Gross Loan Asset 1.02 0.97 1.02 1.16 0.97 1.15
Stage III ECL Provision 191 110 191 203 110 188
ECL Provision 301 155 300 296 155 264
ECL Provision as a % of Gross Loan Asset 1.45 1.13 1.45 1.49 1.13 1.37
Shareholders Funds (`) 4,509 2,850 4,509 4,243 2,850 4,002
Total Outside Liabilities (`) 17,586 13,409 17,586 15,655 13,409 16,437
Total Assets (`) 22,095 16,259 22,095 19,898 16,259 20,439
62
Key Financial Parameters (` in millions)
OUR SUBSIDIARY
63

OUR SUBSIDIARY
45
Muthoot Money Ltd (MML), became a wholly owned subsidiary of Muthoot Finance Ltd in October 2018. MML is
a RBI registered Non- Banking Finance Company engaged mainly in extending loans for vehicles.
The operations are now centered in Hyderabad. Recently , Company has started extending loans for
Commercial Vehicles and Equipments.
As on 30th September, 2019 it has a total loan portfolio of Rs.4,263 million.
MUTHOOT MONEY– AN OVERVIEW
64

OUR SUBSIDIARY
45
Key Financial Parameters (` in millions)
Particulars H1 FY 2020 Q2 FY 2020 Q1 FY 2020 FY 2019
Number of branches 24 24 24 21
Number of Employees 277 277 245 247
Gross Loan AUM (`) 4,263 4,263 3,927 3,107
Capital Adequacy Ratio(%) 24 24 26 32
Total Revenue (`) 311 169 142 156
Total Expense (`) 258 126 132 149
Profit Before Tax (`) 54 43 9 7
Profit After Tax (`) 32 32 (0.40) 3
Stage III Loan Assets 38 38 12 -
% Stage III asset on Gross Loan Asset 0.90 0.90 0.30 -
Stage III ECL Provision 9.57 9.57 12 -
ECL Provision 51.66 51.66 48 15
ECL Provision as a % of Gross Loan Asset 1.21 1.21 1.24 0.47
Shareholders Funds (`) 1,067 1,067 1,035 1,035
Total Outside Liabilities (`) 3,455 3,455 3,116 2,317
Total Assets (`) 4,522 4,522 4,151 3,35265
66
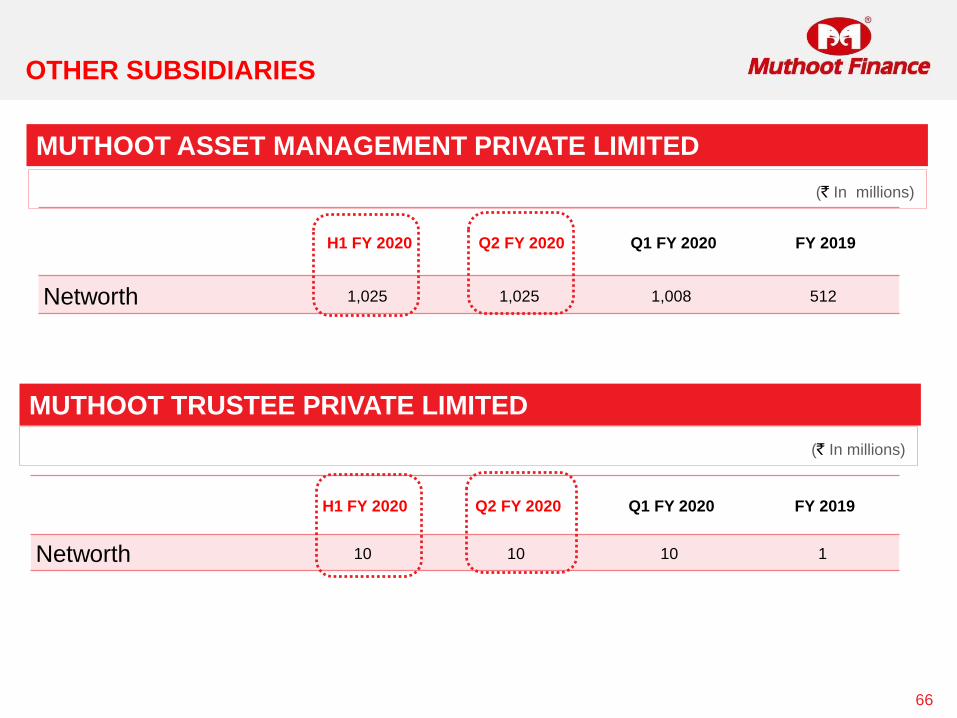
OTHER SUBSIDIARIES
MUTHOOT ASSET MANAGEMENT PRIVATE LIMITED
(` In millions)
H1 FY 2020 Q2 FY 2020 Q1 FY 2020 FY 2019
Networth 1,025 1,025 1,008 512
MUTHOOT TRUSTEE PRIVATE LIMITED
(` In millions)
H1 FY 2020 Q2 FY 2020 Q1 FY 2020 FY 2019
Networth 10 10 10 1
(Individual & Corporate Investors)
(Institutional Investors)
REGISTERED OFFICE
2nd Floor, Muthoot Chambers
Opposite Saritha Theatre Complex
Banerji Road, Kochi
Kerala – 682 018. India
Tel: (91484) 2394712
Fax: (91484) 2396506
www.muthootfinance.com
CIN: L65910KL1997PLC011300
RBI Reg No: N 16.00167