Embed Size (px)
Citation preview

Mutational landscape, clonal evolution patterns,and role of RAS mutations in relapsed acutelymphoblastic leukemiaKoichi Oshimaa,1, Hossein Khiabanianb,c,d,1, Ana C. da Silva-Almeidaa, Gannie Tzonevaa, Francesco Abateb,c,Alberto Ambesi-Impiombatoa, Marta Sanchez-Martina, Zachary Carpenterb,c, Alex Pensonb,c, Arianne Perez-Garciaa,Cornelia Eckerte,f, Concepción Nicolasg, Milagros Balbinh, Maria Luisa Sulisi, Motohiro Katoj, Katsuyoshi Kohj,Maddalena Paganink, Giuseppe Bassok, Julie M. Gastier-Fosterl,m,n,o, Meenakshi Devidasp, Mignon L. Lohq,r,Renate Kirschner-Schwabee,f, Teresa Palomeroa,s,2, Raul Rabadanb,c,2, and Adolfo A. Ferrandoa,i,s,2
aInstitute for Cancer Genetics, Columbia University, New York, NY 10032; bDepartment of Systems Biology, Columbia University, New York, NY 10032;cDepartment of Biomedical Informatics, Columbia University, New York, NY 10032; dRutgers Cancer Institute, Rutgers University, New Brunswick, NJ 08903;eDepartment of Pediatric Oncology/Hematology, Charité-Universitätsmedizin Berlin, 13353 Berlin, Germany; fGerman Cancer Consortium, German CancerResearch Center, 69120 Heidelberg, Germany; gHematology Service, Hospital Central de Asturias, 33011 Oviedo, Spain; hMolecular Oncology Laboratory,Instituto Universitario de Oncologia del Principado de Asturias, Hospital Universitario Central de Asturias, 33011 Oviedo, Spain; iDepartment of Pediatrics,Columbia University Medical Center, New York, NY 10032; jDepartment of Hematology-Oncology, Saitama Children’s Medical Center, Saitama 339-8551,Japan; kOnco-Hematology Division, Department, Salute della Donna e del Bambino (SDB), University of Padua, 35128 Padua, Italy; lDepartment ofPathology and Laboratory Medicine, Nationwide Children’s Hospital, Columbus, OH 43205; mDepartment of Pathology, Ohio State University School ofMedicine, Columbus, OH 43210; nDepartment of Pediatrics, Ohio State University School of Medicine, Columbus, OH 43210; oChildren’s Oncology Group,Arcadia, CA 91006; pDepartment of Biostatistics, University of Florida, Gainesville, FL 32611; qDepartment of Pediatrics, University of California, SanFrancisco, CA 94143; rHelen Diller Family Comprehensive Cancer Center, San Francisco, CA 94115; and sDepartment of Pathology, ColumbiaUniversity Medical Center, New York, NY 10032
Edited by Louis M. Staudt, National Cancer Institute, NIH, Bethesda, MD, and approved August 9, 2016 (received for review May 25, 2016)
Although multiagent combination chemotherapy is curative in asignificant fraction of childhood acute lymphoblastic leukemia (ALL)patients, 20% of cases relapse and most die because of chemo-refractory disease. Here we used whole-exome and whole-genomesequencing to analyze the mutational landscape at relapse in pediatricALL cases. These analyses identified numerous relapse-associated mu-tated genes intertwined in chemotherapy resistance-related proteincomplexes. In this context, RAS-MAPK pathway-activating mutationsin the neuroblastoma RAS viral oncogene homolog (NRAS), kirstenrat sarcoma viral oncogene homolog (KRAS), and protein tyrosine phos-phatase, nonreceptor type 11 (PTPN11) genes were present in 24 of 55(44%) cases in our series. Interestingly, some leukemias showed reten-tion or emergence of RAS mutant clones at relapse, whereas in othersRAS mutant clones present at diagnosis were replaced by RAS wild-type populations, supporting a role for both positive and negativeselection evolutionary pressures in clonal evolution of RAS-mutant leu-kemia. Consistently, functional dissection of mouse and humanwild-type and mutant RAS isogenic leukemia cells demonstratedinduction of methotrexate resistance but also improved the re-sponse to vincristine in mutant RAS-expressing lymphoblasts. Theseresults highlight the central role of chemotherapy-driven selection asa central mechanism of leukemia clonal evolution in relapsed ALL, anddemonstrate a previously unrecognized dual role of RAS mutations asdrivers of both sensitivity and resistance to chemotherapy.
acute lymphoblastic leukemia | relapsed leukemia | chemotherapyresistance | genome sequencing
Acute lymphoblastic leukemia (ALL) is the most common ma-lignancy in children (1–4). Current therapy of pediatric newly
diagnosed ALL includes initial clearance of leukemic lymphoblastswith cytotoxic drugs and glucocorticoids followed by delivery ofchemotherapy to the central nervous system and a prolonged lowerintensity maintenance treatment phase aimed at securing long-termremission by reducing the rates of leukemia relapse (3). Altogether95% of pediatric ALL patients achieve a complete hematologicremission during induction and 80% of them remain leukemia free(5). However, the prognosis of patients showing refractory diseaseor those whose leukemia relapses after an initial transient responseremains disappointingly poor, with cure rates of less than 40% (6, 7).Several mechanisms have been implicated as drivers of leukemia
relapse, including the presence of rare quiescent and intrinsicallychemoresistant leukemia stem cells with increased self-renewal ca-pacity (8), protection from chemotherapy by safe-haven microenvi-ronment niches (9, 10), and selection of secondary genetic alterationspromoting chemotherapy resistance in leukemic lymphoblasts (11–13). In this regard, early studies described the presence of tumorprotein p53 (TP53) mutations in relapsed ALL, supporting a role forescape from genotoxic stress in leukemia progression (14). Similarly,loss of nuclear receptor subfamily 3 group C member 1 (NR3C1)encoding the glucocorticoid receptor has been associated with
Significance
Relapsed acute lymphoblastic leukemia (ALL) is associated withchemotherapy resistance and poor prognosis. This study ana-lyzes the emergence of acquired mutations in relapsed ALLsamples, identifying genes implicated in disease progressionand defining the process of clonal evolution leading to relapse.These analyses revealed that ALL relapse emerges from sub-clonal populations sharing only part of the mutations presentin the dominant leukemia population found at diagnosis.Moreover, we show mutations in genes implicated in chemo-therapy resistance pathways at relapse. RAS mutations arehighly prevalent in high-risk ALL, yet their capacity to conferresistance to methotrexate and sensitivity to vincristine, twocore drugs used in the treatment of ALL, influences their pos-itive or negative selection at relapse.
Author contributions: T.P., R.R., and A.A.F. designed research; K.O., A.C.d.S.-A., G.T., M.S.-M.,A.P.-G., C.E., M.L.S., and T.P. performed research; C.N., M.B., M.L.S., M.K., K.K., M.P., G.B.,J.M.G.-F., M.D., M.L.L., and R.K.-S. contributed new reagents/analytic tools; K.O., H.K., F.A.,A.A.-I., Z.C., A.P., C.E., R.K.-S., R.R., and A.A.F. analyzed data; and K.O., H.K., T.P., and A.A.F.wrote the paper.
The authors declare no conflict of interest.
This article is a PNAS Direct Submission.
Data deposition: The sequences reported in this paper has been deposited in the dbGaPdatabase (accession no. phs001072.v1.p1).1K.O. and H.K. contributed equally to this work.2To whom correspondence may be addressed. Email: [email protected], [email protected], or [email protected].
This article contains supporting information online at www.pnas.org/lookup/suppl/doi:10.1073/pnas.1608420113/-/DCSupplemental.
www.pnas.org/cgi/doi/10.1073/pnas.1608420113 PNAS Early Edition | 1 of 6
MED
ICALSC
IENCE
S

relapse in ETV6-RUNX1 rearranged leukemias (15). In addition,mutations disrupting the genes encoding for the CREB binding pro-tein (CREBBP), a histone acetyl transferase implicated in glucocor-ticoid response (16), and a number of other epigenetic factors (17)have been associated with relapse. Finally, genomic profiling of di-agnostic and relapsed leukemias has identified relapse-associatedmutations in the 5′-nucleotidase, cytosolic II (NT5C2) gene as driversof resistance to thiopurine chemotherapy in about 20% of T-ALLand 5% of B-precursor ALL cases at relapse (11, 12, 18). However,the genomic landscape of relapse ALL remains largely unexplored,and the mechanisms mediating escape from therapy, disease pro-gression, and leukemia relapse remain incompletely understood.
ResultsTo explore the landscape of genetic alterations involved in relapsedALL, we performed whole-exome sequence analysis of matcheddiagnosis, germ line (remission), and relapse DNA samples in apanel of 55 pediatric ALL patients including 33 T-cell ALLs and 22B-cell precursor ALLs (Datasets S1 and S2). Somatic mutationvariant calling using the SAVI algorithm (19) identified an averageof nine mutations present in diagnostic samples and 17 mutations inrelapsed leukemia DNAs (SI Appendix, Figs. S1 and S2 and DatasetsS3 and S4). Recurrently somatically mutated genes in our seriesincluded known oncogenes and tumor suppressors mutated in B-cellprecursor ALL [KRAS, NRAS, Fms related tyrosine kinase 3(FLT3), Janus kinase 2 (JAK2), Janus kinase 3 (JAK3), andCREBBP] (20) and T-cell ALL [Notch1 (NOTCH1), FBXW7, PHF6,DNM2, WT1, JAK1, JAK3, BCL11B, TP53, CREBBP, RPL10,RUNX1, and CNOT3] (16, 21–27). In addition, we also identifiedrecurrently ALL mutated genes including ZFHX3, ubiquitin specificpeptidase 9, X-linked (USP9X), calcium voltage-gated channel sub-unit alpha1 H (CACNA1H), EPHA3, SHROOM3, USP7, RPGR,5-hydroxytryptamine receptor 3A (HTR3A), mediator complex sub-unit 12 (MED12), teneurin transmembrane protein 3 (TENM3), andIL17RA (Fig. 1, SI Appendix, Fig. S3, and Datasets S3 and S4). Copynumber analyses identified an average of 10.4 somatic copy numbervariants (CNVs) per sample (8.7 in T-cell ALL and 13.1 in B-cellprecursor ALL) for a total of 501 alterations in our series. Of these,248 CNVs were detected at diagnosis and 253 at the time of relapse,with 180 variants present in both diagnostic and relapsed samples (SIAppendix, Figs. S4 and S5 and Dataset S5).Analysis of clonal evolution dynamics of relapsed ALL revealed a
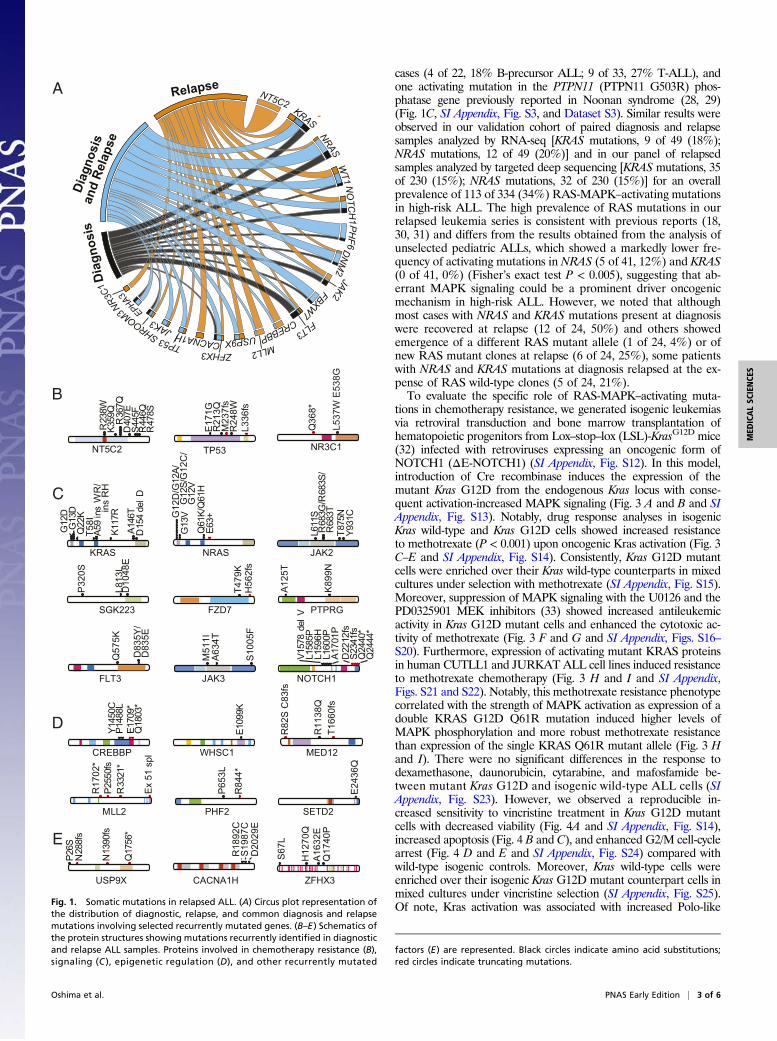
branched pattern of clonal evolution in 41 of 48 (85%) of the casesin which relapsed samples contained only some of the genetic le-sions present in the major clone at diagnosis (Fig. 2 and SI Ap-pendix, Fig. S6). In addition, five relapsed leukemia samples in thisseries (samples 5, 9, 14, 18, and 38) contained most but not all of themutations present at diagnosis. Finally, in the remaining 2 of the 48(4%) cases (samples 21 and 39), the relapsed clones contained allprotein-coding genetic mutations present at diagnosis plus addi-tional secondary relapse-specific lesions. For these and for an ad-ditional case with a pattern at the boundary between linear andbranched evolution (sample 38), we performed whole-genome se-quencing of matched diagnosis, germ line (remission), and relapseDNA samples (SI Appendix, Fig. S7 and Dataset S6). We identified3,868 noncoding mutations including 394 located <5 Kb down-stream, 1,762 intergenic, 1,621 intronic, 81 <5 Kb upstream, 7 UTR3′, 2 UTR 5′, and 1 intragenic variants. Of these, 51 were diagnosis-specific, 1,892 were relapse-specific, and 1,925 were shared betweenboth relapse and diagnosis. These analyses demonstrated clearbranched evolution, with the emergence of relapse clones showingpartial overlap with the mutations present at diagnosis and con-taining additional relapse-specific mutations in all three cases ana-lyzed (SI Appendix, Fig. S7). These results support that linearevolution is rarely involved in tumor progression and that relapsedALLs originate primarily by branched evolution as derivates ofancestral subclones related to but distinct from the main leukemicpopulation present at diagnosis (SI Appendix, Fig. S8).
Several relapse ALL-associated mutant genes were functionallyrelated to the mechanisms of action of chemotherapy. We identi-fied the presence of heterozygous, relapse-specific mutations in theNT5C2 gene, which encodes a cytosolic nucleotidase involved inthe clearance of cytotoxic metabolites of 6-thioguanine and6-mercaptopurine in 10 of 55 (18%) cases [1 of 22 (5%) in B-cellprecursor ALL; 9 of 33 (27%) in T-cell ALL]. These included threepreviously characterized gain-of-function NT5C2 alleles (NT5C2R238W, NT5C2 K359Q, and NT5C2 R367Q) involved in thio-purine resistance (11, 12), two mutations at positions altered inpreviously reported NT5C2 gain-of-function alleles [NT5C2 D407Eand NT5C2 (S445F,R446Q)], and one NT5C2-activating mutation(NT5C2 R478S) (Fig. 1B, SI Appendix, Fig. S9, and Dataset S3).We also identified three T-cell ALLs with mutations in the TP53gene (3 of 33, 9%), one of which was specifically selected at thetime of relapse (Fig. 1 A and B, SI Appendix, Fig. S3, and DatasetS3), and two relapsed-specific mutations in the glucocorticoid re-ceptor gene (NR3C1) (Fig. 1 A and B, SI Appendix, Fig. S3, andDataset S3). Ultra-deep sequencing analysis of NT5C2 (n = 7),TP53 (n = 2), and NR3C1 (n = 2) mutations in the correspondingdiagnostic DNA samples failed to identify these resistance-drivingmutations with 0.5% sensitivity, suggesting that they were present insmall subclones or were acquired during disease progression. Inaddition, we identified truncating mutations and single amino acidsubstitutions disrupting the histone acetyl-transferase domain ofCREBBP in four cases [4 of 55 (7%); 2 of 22 (9%) B-cell precursorALLs; 2 of 33 (6%) T-cell ALLs], including three patients withmutations positively selected at the time of relapse (Fig. 1 A and D,SI Appendix, Fig. S3, and Dataset S3). Further analysis of relapse-associated epigenetic factor mutations in our series revealed 3 of 55(5%) mutations in the lysine methyltransferase 2D (KMT2D) gene,also known as myeloid/lymphoid or mixed-lineage leukemia 2(MLL2), two of which were selected at relapse (Fig. 1 A and D, SIAppendix, Fig. S3, and Dataset S3). However, 23 of 27 (85%) of allrecurrently mutated genes in this series whose mutations werepreferentially selected or retained at the time of relapse (mutationnever lost in the relapse clone) were not previously implicated inrelapse ALL (HTR3A, MED12, USP9X, CACNA1H, TENM3,AACS, SAMD4A, ANO5, PAPPA, NAALADL2, HIST3H2A,FZD7, TBX15, NEB, GREB1L, PLXNA4, SGK223, TSC1,PTPRG, FGF10, SYCP2, TRPM3, and EYS) (Fig. 1 A and C–E,SI Appendix, Fig. S3, and Dataset S4). Orthogonal mutationanalysis of 18 genes harboring recurrent mutations positivelyselected during disease progression in a series of 49 paired di-agnosis and relapse B-cell precursor ALL cases analyzed byRNA-seq (Dataset S7) and in an extended series of 230 relapsedB-cell precursor ALLs evaluated by targeted deep sequencing(Dataset S8) confirmed and extended these results, revealingadditional mutations in NT5C2 (13 of 279, 4.6%), NR3C1 (7 of279, 2.5%), CREBBP (29 of 279, 10%), KMT2D (11 of 279, 4%),JAK2 (17 of 279, 6%), JAK3 (18 of 279, 6.5%), and TP53 (18 of279, 6.5%) (SI Appendix, Fig. S10). In all, 160 of 279 (57%) casesin these validation series showed at least one driver relapse-associated mutation. In addition, analysis of experimentallyestablished protein–protein interactions across the products of153 genes harboring at least one mutation gained at relapse inour series revealed a network structure in which most interac-tions converged on a limited number of highly connected pro-teins (SI Appendix, Fig. S11). Notably, the highest connectednodes in this circuitry encompassed the products of key geneswhose mutations can drive chemotherapy resistance (TP53,CREBBP, and NR3C1) (SI Appendix, Fig. S11).An additional notable finding in our relapsed ALL exome mu-
tation analysis was the presence of highly prevalent mutationsactivating the RAS-MAPK signaling pathway (Fig. 1C and SIAppendix, Fig. S3). These included activating mutations in KRASin 11 of 55 (20%) cases (7 of 22, 32% B-precursor ALL; 4 of 33, 12%T-ALL), gain-of-function mutations in NRAS in 13 of 55 (24%)
2 of 6 | www.pnas.org/cgi/doi/10.1073/pnas.1608420113 Oshima et al.
cases (4 of 22, 18% B-precursor ALL; 9 of 33, 27% T-ALL), andone activating mutation in the PTPN11 (PTPN11 G503R) phos-phatase gene previously reported in Noonan syndrome (28, 29)(Fig. 1C, SI Appendix, Fig. S3, and Dataset S3). Similar results wereobserved in our validation cohort of paired diagnosis and relapsesamples analyzed by RNA-seq [KRAS mutations, 9 of 49 (18%);NRAS mutations, 12 of 49 (20%)] and in our panel of relapsedsamples analyzed by targeted deep sequencing [KRAS mutations, 35of 230 (15%); NRAS mutations, 32 of 230 (15%)] for an overallprevalence of 113 of 334 (34%) RAS-MAPK–activating mutationsin high-risk ALL. The high prevalence of RAS mutations in ourrelapsed leukemia series is consistent with previous reports (18,30, 31) and differs from the results obtained from the analysis ofunselected pediatric ALLs, which showed a markedly lower fre-quency of activating mutations in NRAS (5 of 41, 12%) and KRAS(0 of 41, 0%) (Fisher’s exact test P < 0.005), suggesting that ab-errant MAPK signaling could be a prominent driver oncogenicmechanism in high-risk ALL. However, we noted that althoughmost cases with NRAS and KRAS mutations present at diagnosiswere recovered at relapse (12 of 24, 50%) and others showedemergence of a different RAS mutant allele (1 of 24, 4%) or ofnew RAS mutant clones at relapse (6 of 24, 25%), some patientswith NRAS and KRAS mutations at diagnosis relapsed at the ex-pense of RAS wild-type clones (5 of 24, 21%).To evaluate the specific role of RAS-MAPK–activating muta-
tions in chemotherapy resistance, we generated isogenic leukemiasvia retroviral transduction and bone marrow transplantation ofhematopoietic progenitors from Lox–stop–lox (LSL)-KrasG12D mice(32) infected with retroviruses expressing an oncogenic form ofNOTCH1 (ΔE-NOTCH1) (SI Appendix, Fig. S12). In this model,introduction of Cre recombinase induces the expression of themutant Kras G12D from the endogenous Kras locus with conse-quent activation-increased MAPK signaling (Fig. 3 A and B and SIAppendix, Fig. S13). Notably, drug response analyses in isogenicKras wild-type and Kras G12D cells showed increased resistanceto methotrexate (P < 0.001) upon oncogenic Kras activation (Fig. 3C–E and SI Appendix, Fig. S14). Consistently, Kras G12D mutantcells were enriched over their Kras wild-type counterparts in mixedcultures under selection with methotrexate (SI Appendix, Fig. S15).Moreover, suppression of MAPK signaling with the U0126 and thePD0325901 MEK inhibitors (33) showed increased antileukemicactivity in Kras G12D mutant cells and enhanced the cytotoxic ac-tivity of methotrexate (Fig. 3 F and G and SI Appendix, Figs. S16–S20). Furthermore, expression of activating mutant KRAS proteinsin human CUTLL1 and JURKATALL cell lines induced resistanceto methotrexate chemotherapy (Fig. 3 H and I and SI Appendix,Figs. S21 and S22). Notably, this methotrexate resistance phenotypecorrelated with the strength of MAPK activation as expression of adouble KRAS G12D Q61R mutation induced higher levels ofMAPK phosphorylation and more robust methotrexate resistancethan expression of the single KRAS Q61R mutant allele (Fig. 3 Hand I). There were no significant differences in the response todexamethasone, daunorubicin, cytarabine, and mafosfamide be-tween mutant Kras G12D and isogenic wild-type ALL cells (SIAppendix, Fig. S23). However, we observed a reproducible in-creased sensitivity to vincristine treatment in Kras G12D mutantcells with decreased viability (Fig. 4A and SI Appendix, Fig. S14),increased apoptosis (Fig. 4 B and C), and enhanced G2/M cell-cyclearrest (Fig. 4 D and E and SI Appendix, Fig. S24) compared withwild-type isogenic controls. Moreover, Kras wild-type cells wereenriched over their isogenic Kras G12D mutant counterpart cells inmixed cultures under vincristine selection (SI Appendix, Fig. S25).Of note, Kras activation was associated with increased Polo-like
B
Dia
gnos
isRelapse
NT5C2KRAS
NRASW
T1 NO
TCH
1 PH
F6DN
M2
JAK2FBXW7
FLT3CREBBP
MLL2USP9X
ZFHX3CACNA1H
TP53JAK3
SHROOM3 EPHA3NR
3C1
9
Diag
nosi
san
d Re
laps
eA
C
D
E
NOTCH1
Q24
40*
Q24
44*
S234
1fs
V157
8 de
l V
L160
0PL1
596H
L158
5P
D22
12fs
A17
01P
P26S
N28
8fs
N13
90fs
USP9X
Q17
56*
CACNA1H
S19
87C
R18
92C
D20
29E
MLL2
P255
0fs
R33
21*
Ex
51 s
pl
R17
02*
MED12
R11
38Q
T166
0fs
R82
S C
83fs
WHSC1
E109
9K
SGK223
P32
0S
D10
48E
L813
L
FZD7
T479
KH
562f
s
PTPRG
A12
5T
K89
9N
JAK2
R68
3G/R
683S
/R
683T
L611
S
Y931
CT8
75N
NRAS
G12
D/G
12A/
G
12S/
G12
C/
G
12V
G13
V
Q61
K/Q
61H
E63+
KRAS
A146
T
G12
DG
13D
K117
R
D15
4 de
l D
Q22
K
A59
ins
WR
/
ins
RH
T58I
NT5C2
S445
FR
446Q
R23
8W
D40
7E
R47
8S
K359
QR
367Q
NR3C1
Q36
8*
L537
W E
538G
FLT3
Q57
5K
D83
5Y/
D83
5E
JAK3
S10
05F
M51
1IA
634T
TP53
M23
7fs
R21
3QE
171G
R24
8WL3
36fs
PHF2
R84
4*
P65
3L
SETD2
E24
36Q
ZFHX3
S67
L
A16
32E
H12
70Q
Q17
40P
CREBBP
P148
8LY1
450C
Q18
03*
E170
9*
Fig. 1. Somatic mutations in relapsed ALL. (A) Circus plot representation ofthe distribution of diagnostic, relapse, and common diagnosis and relapsemutations involving selected recurrently mutated genes. (B–E) Schematics ofthe protein structures showing mutations recurrently identified in diagnosticand relapse ALL samples. Proteins involved in chemotherapy resistance (B),signaling (C ), epigenetic regulation (D), and other recurrently mutated
factors (E) are represented. Black circles indicate amino acid substitutions;red circles indicate truncating mutations.
Oshima et al. PNAS Early Edition | 3 of 6
MED
ICALSC
IENCE
S

Kinase 1 activation loop phosphorylation (T210) (Fig. 4F), a post-translational modification implicated in the control of mitotic entry(34) and recovery after checkpoint-dependent G2 arrest (35, 36).Moreover RNA-seq analysis of isogenic Kras G12D and Kras wild-type cells showed down-regulation of mitotic signature genes uponactivation of oncogenic Kras (Fig. 4G), further supporting a role ofmutant Kras in mitotic deregulation. As before, expression of mu-tant KRAS in human ALL cell lines increased sensitivity to vin-cristine (Fig. 4H and SI Appendix, Fig. S26). Finally, gene expressionanalyses of human B-precursor ALLs with or without KRAS mu-tations revealed a significant enrichment of a gene signature asso-ciated with increased sensitivity to vincristine (37) in KRAS mutantsamples (Fig. 4 I and J), an effect confirmed in analogous analysesusing expression signatures associated with KRAS and NRAS mu-tant samples (SI Appendix, Fig. S27).
DiscussionHere we have dissected the mutational landscape of relapsed ALL,analyzed the pattern of clonal evolution associated with relapse in
this disease, and explored the mechanisms underlying the mixedpattern of positive and negative selection of RAS mutations as-sociated with leukemia progression. Consistent with previous ge-nomic studies (26, 38), pediatric ALL leukemia samples in ourseries showed a low burden of exonic mutations and copy numberalterations at diagnosis. Moreover, and with the exception of oneT-ALL tumor, which showed a marked increase in mutation loadat relapse, the mutation load of these leukemias was only modestlyincreased at relapse. Mechanistically, mutation pattern analysessupport that ALL mutations originate by spontaneous deamina-tions during tumor initiation and that this mutation mechanism isalso characteristic at the time of relapse (39). A corollary of thesefindings is that chemical mutagenesis, characteristically associatedwith increased frequency of transversions (40), does not seem torepresent a major driver of tumor initiation or relapse-associatedmutations in ALL. This is in contrast with findings in acute myeloidleukemia, where analysis of relapse genomes has evidenced an
Sample 1 Sample 2 Sample 3 Sample 4
Sample 9 Sample 10 Sample 12 Sample 13
Sample 5 Sample 6 Sample 7 Sample 8
Sample 18 Sample 19 Sample 20 Sample 21
Sample 22 Sample 23 Sample 24 Sample 25
Sample 37 Sample 38 Sample 39 Sample 40
Sample 41 Sample 42 Sample 43 Sample 45
Sample 33 Sample 34 Sample 35 Sample 36
Sample 52 Sample 53 Sample 55 Sample 571020304050
Number of genetic lesions
Diagnosis−specific (%)
Relapse−specific (%)
Sha
red
gene
tic le
sion
s (%
)Shared
genetic lesions
Diagnosisspecific
Relapsespecific
Sample 47 Sample 49 Sample 50 Sample 51
Sample 27 Sample 29 Sample 31 Sample 32
Sample 14 Sample 15 Sample 16 Sample 17
A
C
D
B
Fig. 2. Clonal evolution in relapsed ALL. (A) Graphical representation of theevolutionary history of ALL based on mutation and copy number alterationanalysis. The sizes of the nodes and the lengths of the branches in the evolu-tionary tree graph indicate the percentage of shared, diagnosis-specific, andrelapse-specific genetic alterations in each sample. (B) Evolutionary trees of 48diagnostic remission and relapse paired samples evaluated by whole-exome se-quencing. (C) Projection of the shared, diagnosis-specific, and relapse-specificgenetic alterations (i.e., scaling by the total number of alterations) shows theevolutionary history of each leukemia as a single point. In this graph, the higherthe percentage of relapse-specific mutations in a sample, the closer its corre-sponding point to the right edge of the triangle; the higher the percentage ofdiagnosis-specific mutations in a sample, the closer its corresponding point to theleft edge of the triangle; and the higher the number of shared mutations in asample, the closer its corresponding point to the top corner. (D) Projected evo-lutionary history of 48 analyzed ALLs, in which patients are represented by cir-cles, scaled by their total number of mutations. When two trees have similarevolutionary histories, they will be projected closely, despite possible differencesin their branch lengths and node sizes.
Viab
ility
(%)
P-Erk1/2
Erk1/2
Gapdh
Kras G
12D
Kras w
t
MTX ++Kras wtKras G12D
0 20 40 60 80 100 P <0.001 P <0.001
Control MTX Control MTX
DAP
I
Annexin VD
API
Kras wt Kras G12D
Annexin V
Kraswt/G12D
Kras wt
P <0.05
Control U0126 MTX MTX + U0126
DAP
I
Annexin V
DAP
I
Kras G12D Kras G12D
Annexin V
GA
Via
bilit
y
-10 -9 -8 -7 -6
1.5
1
0.5
0.0
log[MTX] (M)
Kras wtKras G12D
P <0.001AGCTGGTGGCG
AGCTG TGGCG
0 20 40 60 80 100
Viab
ility
(%)
MTX ++U0126 ++
Kras G12D
P <0.001
P <0.005 P <0.001
P <0.05
-10 -8 -6 -4
1.51
0.50.0
log[MTX] (M)
Via
bilit
y
KRAS Q61H+
KRAS Q61H
KRASP-ERK1/2
ERK1/2GAPDH
Dox
Viab
ility
-10 -8 -6 -4
1.51
0.50.0
log[MTX] (M)
KRAS G12D/Q61H+
KRAS G12D/Q61H
KRASP-ERK1/2
ERK1/2GAPDH
DoxP <0.001ControlDox
P <0.001ControlDox
A B C
D E
F G
H I
Fig. 3. Methotrexate resistance induced by Kras G12D expression in ALL.(A) Kras cDNA sequencing results from mouse Kras wild-type (Kras wt/LSL-KrasG12D genotype) and isogenic Kras G12D (Kras wt/Kras G12D genotype) ALL cells.(B) Western blot analysis of Erk activation in mouse Kras wild-type and isogenicKras G12D ALL cells. (C) Cell viability assays in mouse Kras wild-type and isogenicKras G12D-expressing ALL cells treated with methotrexate (MTX). (D) Represen-tative dot plots of flow cytometry analysis of cell viability and apoptosis in mouseKras wild-type and isogenic Kras G12D-expressing ALL cells treated with metho-trexate (25 nM) for 48 h. (E) Quantitative analysis of cell viability in mouse Kraswild-type and isogenic Kras G12D-expressing ALL cells treated with methotrexate(25 nM) for 48 h. (F) Representative dot plots of flow cytometry analysis of cellviability and apoptosis in mouse Kras G12D-expressing ALL cells treated withmethotrexate (30 nM) and U0126 (2 μM) for 48 h. (G) Quantitative analysis of cellviability of mouse Kras G12D-expressing ALL cells treated with methotrexate(30 nM) andU0126 (2 μM) for 48 h. (H)Western blot analysis of RAS expression andErk activation and viability assays in CUTLL1 ALL cells treated with methotrexate inbasal conditions (Vehicle) and upon doxycycline-induced (Dox 100 ng/mL) KRASQ61H expression. (I)Western blot analysis of RAS expression and Erk activation andviability assays in CUTLL1 ALL cells treated with methotrexate in basal con-ditions (Vehicle) and upon doxycycline-induced (Dox 100 ng/mL) KRAS G12D/Q61H double-mutant expression. Quantitative data are shown as means ± SD.
4 of 6 | www.pnas.org/cgi/doi/10.1073/pnas.1608420113 Oshima et al.

increased frequency of transversions probably derived from themutagenic effects of chemotherapy (41). In this context, the cell oforigin of relapse ALL seems to be exposed to limiting amounts ofgenotoxic stress, perhaps reflecting increased detoxifying drug-export or drug-metabolizing mechanisms.Original analysis of clonal evolution in relapsed ALL based on
the study of copy number alteration described different patternsof linear and branched clonal evolution in the context of relapsedALL (42). However, combined analysis of clonal evolution in-tegrating copy number alterations and exonic mutations in ourseries revealed a marked dominance of branched evolution in whichrelapsed ALL populations originate from ancestral clones sharingsome but not all mutations present in the diagnostic sample. This
finding is in agreement with recent genomic studies in ALL (11, 18)and contrasts with clonal evolution studies in acute myeloid leu-kemia, which have documented a more heterogeneous patternof clonal evolution with some relapses emerging as a result ofbranched evolution and others resulting from the linear acquisitionof secondary mutations in the main diagnostic clone (41).Numerous mechanisms probably converge in the selection ofrelapse ALL clones at relapse, particularly considering the com-plexity of multiagent chemotherapy protocols used in the treat-ment of this disease. However, our analysis of protein–proteininteraction networks of relapse-associated mutant factors sup-ports that, at least in part, relapse-associated mutations mayconverge in common nodes related to escape from DNA damageresponse (TP53) and glucocorticoid resistance (CREBBP andNR3C1). The positive selection of resistance-driving genetic al-terations at relapse implies that chemotherapy inflicts a strongDarwinian selection for drug resistance and argues against ge-netic drift of passenger mutations or competition for empty bonemarrow niche space after chemotherapy as drivers of clonalevolution during leukemia progression.RAS-activating mutations are rare in unselected newly diagnosed
ALL, yet they were present in over 40% of ALL matched diagnosis-relapsed samples, supporting an association of these genetic alter-ations with high-risk ALL. However, the pattern of clonal evolutionof RAS mutations is highly heterogeneous, with some leukemiasshowing retention of the diagnostic-associated RAS mutations atrelapse and some others showing gain or loss of RAS mutationsduring disease progression. This phenomenon, first reported inearly mutation analyses over 25 y ago (43) and recently confirmed inthe context of contemporary therapies (18, 31), supports that RASmutations are frequently subclonal and that the evolutionary pres-sure imposed by multiagent chemotherapy can result in positive butalso negative selection of RAS mutant clones at relapse. Functionalanalyses of RAS mutations in mouse primary isogenic leukemialymphoblasts and in human cell lines supports a role of RAS-MAPK signaling in methotrexate resistance but also, and mostunexpectedly, implicates oncogenic RAS in the deregulation of themitotic machinery and in increased sensitivity to vincristine. Thedevelopment of leukemia models with subclonal RAS mutationswill facilitate the analysis of clonal evolution of RAS mutant pop-ulations at different stages of disease progression and in the contextof chemotherapy treatment in vivo. In addition, analysis of serialleukemia clinical samples from ALL patients receiving multiagenttherapy will facilitate better understanding of the dynamics of RASmutant clones in the context of clinically relevant drug exposurein vivo. Finally, it is worth noting that although less frequent, acti-vating mutations in other signaling factors (e.g., JAK2 and FLT3)also showed a mixed pattern of clonal selection at relapse, whichwarrants further studies to evaluate their potential differential re-sponse to cytotoxic drugs in ALL.
Materials and MethodsDNAs from leukemic ALL blasts at diagnosis and relapse andmatched remissionlymphocytes were obtained with informed consent in a multi-institutionalsetting. Informed consent was obtained at study entry, and samples werecollected under the supervision of local Institutional Review Boards for par-ticipating institutions and analyzed under the supervision of the ColumbiaUniversity Medical Center Institutional Review Board. We selected samples forwhole-exome and whole-genome sequencing on the basis of the availability ofsufficient DNA from diagnosis, remission, and relapse samples. Sample size wasdetermined to have 95% power to detect recurrent mutations present in over5% of samples and 78% power to detect these as recurrent in at least twosamples. Animal procedures were performed in accordance and with approvalfrom the Columbia University Institutional Animal Care and Use Committee.
Genomic Analyses. Whole-exome sequencing was performed using the Agi-lent SureSelect Human 51Mb All Exon V4 kit (Agilent Technologies) platformand paired-end sequencing on the Illumina HiSeq2000 System. Somatic se-quence variants were identified using the SAVI algorithm (19). Somatic CNVs
0 20 40 60 80
100
VCR ++Kras wt Kras G12D
Viab
ility
(%)
P <0.001 P <0.001
P <0.001 Control VCR
Control VCR
DAP
I
Annexin V
DAP
I
Kras wt
Kras G12D
Annexin V
Via
bilit
y
-14 -12 -10
1.5
1
0.5
0.0
log[VCR] (M)-16 -8 -4-6
Kras wtKras G12D
P <0.001
Via
bilit
y
-14 -10
1.51
0.50.0
log[VCR] (M)-6
P <0.001
−400
40−0.6−0.4−0.2
0*P<0.0001
t−sc
ore
Enr
ichm
ent
Up in Kras G12D
Down in Kras G12D
Reactome MitoticCell Cycle
Kras G
12D
Kras w
t
Gapdh
phospho-Plk1(T210)
Plk1
Vincristine sensitiveALL DOWN
Vincristine sensitive ALL UP
t−sc
ore
Enr
ichm
ent
Enr
ichm
ent
−0.4−0.2
00.2 *P=0.0313
00.20.40.60.8
t−sc
ore
*P<0.0001
−202
Up in KRAS mutant ALL
Down in KRASmutant ALL
Up in KRASmutant ALL
Down in KRASmutant ALL
−202
0 20 40 60 80
100 G1 S G2/M
VCR ++Kras wt Kras G12D
Cel
ls (%
)Control VCR Control VCRKras wt
G2/M: 41.2%S: 9.64%G1: 37.5%
G2/M: 20.9%S: 14.9%G1: 63.9%
G2/M: 45.4%S: 6.50%G1: 23.8%
G2/M: 76.9%S: 5.41%G1: 10.0%
Cou
nts
Hoechst
Cou
nts
Hoechst
Kras G12D P < 0.001
KRAS Q61HP <0.001
Via
bilit
y
-14 -10
1.51
0.5
log[VCR] (M)-6
KRAS G12D/Q61H
ControlDox
ControlDox
0.0
A B C
D E
F G H
I J
Fig. 4. Vincristine sensitivity induced by Kras G12D expression in ALL. (A) Cellviability assays in mouse Kras wild-type and isogenic Kras G12D-expressing ALLcells treated with vincristine (VCR). (B) Representative dot plots of flow cytometryanalysis of cell viability and apoptosis in mouse Kras wild-type and isogenic KrasG12D-expressing ALL cells treated with vincristine (5 nM) for 24 h. (C) Quanti-tative analysis of cell viability in mouse Kras wild-type and isogenic Kras G12D-expressing ALL cells treated with vincristine (5 nM) for 24 h. (D) Representativehistograms of cell-cycle distribution in mouse Kras wild-type and isogenic KrasG12D-expressing ALL cells treated with vincristine (5 nM) for 24 h. (E) Quanti-tative analysis of cell-cycle distribution in mouse Kraswild-type and isogenic KrasG12D-expressing ALL cells treated with vincristine (5 nM) for 24 h. (F) Westernblot analysis of Polo-like kinase 1 (Plk1) phosphorylation (T210) in mouse Kraswild-type and isogenic Kras G12D ALL cells. (G) Gene set enrichment plots cor-responding to gene set enrichment analysis analysis of mitotic cell-cycle genes inthe transcriptional signature of mouse Kras wild-type versus isogenic Kras G12DALL cells. (H) Viability assays in CUTLL1 ALL cells treated with vincristine in basalconditions (Vehicle) and upon doxycycline-induced (Dox 100 ng/mL) expressionof KRAS Q61H or the double mutant KRAS G12D/Q61H. (I) Gene set enrichmentplot corresponding to GSEA analysis of genes down-regulated in vincristinesensitivity in relapsed B-ALLs with or without mutations in KRAS. (J) Gene setenrichment plot corresponding to GSEA analysis of genes up-regulated invincristine sensitivity in relapsed B-ALLs with or without mutations in KRAS.Quantitative data are shown as means ± SD.
Oshima et al. PNAS Early Edition | 5 of 6
MED
ICALSC
IENCE
S
were identified from the depth of coverage using EXCAVATOR (44). Whole-genome sequencing libraries were prepared using the Illumina TruSeq NanoDNA Sample Prep Kit, and sequencing was performed on Illumina HiSeq XTen instrument (Illumina). Paired-end (2 × 150 bp) reads were aligned to theGRCh37 human reference using the Burrows–Wheeler Aligner (BWA aln)(45). Variant callers muTect v1.1.4 (46) and Strelka v1.0.12 (47) (for both SNVsand indels) were used, and the resulting SNV and indels were annotated viasnpEff (48). For analysis of RNAseq samples, we identified variants in 18selected relapse-associated genes using the SAVI algorithm. We identifiedvariants that differed from the reference genome in targeted resequencingdata on 614 amplicons from 18 genes generated using the Access Arraysystem from Fluidigm and analyzed them by paired-end sequencing (2 × 150 bp)in a NextSeq500 instrument (Illumina) using the SAVI algorithm.
In Vitro Studies. We determined cell viability by measurement of themetabolic reduction of the tetrazolium salt MTT using the Cell ProliferationKit I (Roche) following the manufacturer’s instructions. We analyzedapoptosis by flow cytometry with APC AnnexinV apoptosis Kit I (BD Bio-sciences) and 4’,6-Diamidino-2-phenylindole dihydrochloride. We per-formed cell-cycle analysis by flow cytometry analysis of DNA content usingHoechst 33342 (Sigma Aldrich) staining. All assays were performed intriplicates and reproduced at least twice.
We performed Western blot analysis using antibodies recognizing P-ERK1/2[P-P44/P42 MAPK (T202/Y204)] (1:1,000; 4377, Cell Signaling Technology), ERK1/2(1:250; sc-271270, Santa Cruz Biotechnologies), P-PLK1 [P-T210] (1:1,000; Abcam),PLK [F8] (1:50; sc-17783, Santa Cruz Biotechnologies), and GAPDH (1:7,000; 5174,Cell Signaling Technology), following standard procedures.
Statistical Analyses.Analyses of significance were performed using Student’s ttest assuming equal variance and Fisher’s exact test. Continuous biologicalvariables were assumed to follow a normal distribution. A two-sided P valueof <0.05 was considered to indicate statistical significance.
ACKNOWLEDGMENTS. This work was supported by a Leukemia & LymphomaQuest for Cures award (to A.A.F.); an Innovative Research award (toA.A.F.); a Phillip A. Sharp Innovation in Collaboration award by StandUp to Cancer (to A.A.F.); the St. Baldrick’s Foundation (A.A.F.); the Che-motherapy Foundation (A.A.F.); the Swim Across America Foundation(A.A.F.); NIH Grants R01 CA185486 (to R.R.), U54 CA193313 (to R.R.),and U10 CA98543 (to J.M.G.-F. and M.L.L.); Human Specimen BankingGrant U24 CA114766 (to J.M.G.-F.); Cariparo Foundation and Istitutodi Ricerca Pediatrica-Città della Speranza (IRP) Foundation (G.B.); andthe Stewart Foundation (R.R.). G.T. is a Howard Hughes Medical Insti-tute International Student Research Fellow. M.S.-M. is a Rally Founda-tion fellow.
1. Chan KW (2002) Acute lymphoblastic leukemia. Curr Probl Pediatr Adolesc HealthCare 32(2):40–49.
2. Coebergh JW, et al. (2006) Leukaemia incidence and survival in children and ado-lescents in Europe during 1978-1997. Report from the Automated Childhood CancerInformation System project. Eur J Cancer 42(13):2019–2036.
3. Inaba H, Greaves M, Mullighan CG (2013) Acute lymphoblastic leukaemia. Lancet381(9881):1943–1955.
4. Siegel R, Naishadham D, Jemal A (2013) Cancer statistics, 2013. CA Cancer J Clin 63(1):11–30.
5. Mitchell C, Richards S, Harrison CJ, Eden T (2010) Long-term follow-up of the UnitedKingdom medical research council protocols for childhood acute lymphoblastic leu-kaemia, 1980-2001. Leukemia 24(2):406–418.
6. Pui CH, Evans WE (2006) Treatment of acute lymphoblastic leukemia. N Engl J Med354(2):166–178.
7. Bhojwani D, Pui CH (2013) Relapsed childhood acute lymphoblastic leukaemia. LancetOncol 14(6):e205–e217.
8. Guan Y, Gerhard B, Hogge DE (2003) Detection, isolation, and stimulation of quies-cent primitive leukemic progenitor cells from patients with acute myeloid leukemia(AML). Blood 101(8):3142–3149.
9. Iwamoto S, Mihara K, Downing JR, Pui CH, Campana D (2007) Mesenchymal cellsregulate the response of acute lymphoblastic leukemia cells to asparaginase. J ClinInvest 117(4):1049–1057.
10. Yang Y, et al. (2013) Wnt pathway contributes to the protection by bone marrowstromal cells of acute lymphoblastic leukemia cells and is a potential therapeutictarget. Cancer Lett 333(1):9–17.
11. Tzoneva G, et al. (2013) Activating mutations in the NT5C2 nucleotidase gene drivechemotherapy resistance in relapsed ALL. Nat Med 19(3):368–371.
12. Meyer JA, et al. (2013) Relapse-specific mutations in NT5C2 in childhood acute lym-phoblastic leukemia. Nat Genet 45(3):290–294.
13. Göker E, et al. (1995) Amplification of the dihydrofolate reductase gene is a mech-anism of acquired resistance to methotrexate in patients with acute lymphoblasticleukemia and is correlated with p53 gene mutations. Blood 86(2):677–684.
14. HsiaoMH, Yu AL, Yeargin J, Ku D, Haas M (1994) Nonhereditary p53mutations in T-cell acutelymphoblastic leukemia are associated with the relapse phase. Blood 83(10):2922–2930.
15. Kuster L, et al. (2011) ETV6/RUNX1-positive relapses evolve from an ancestral cloneand frequently acquire deletions of genes implicated in glucocorticoid signaling.Blood 117(9):2658–2667.
16. Mullighan CG, et al. (2011) CREBBP mutations in relapsed acute lymphoblastic leu-kaemia. Nature 471(7337):235–239.
17. Mar BG, et al. (2014) Mutations in epigenetic regulators including SETD2 are gainedduring relapse in paediatric acute lymphoblastic leukaemia. Nat Commun 5:3469.
18. Ma X, et al. (2015) Rise and fall of subclones from diagnosis to relapse in pediatricB-acute lymphoblastic leukaemia. Nat Commun 6:6604.
19. Trifonov V, Pasqualucci L, Tiacci E, Falini B, Rabadan R (2013) SAVI: A statistical al-gorithm for variant frequency identification. BMC Syst Biol 7(Suppl 2):S2.
20. Mullighan CG (2012) Molecular genetics of B-precursor acute lymphoblastic leukemia.J Clin Invest 122(10):3407–3415.
21. Weng AP, et al. (2004) Activating mutations of NOTCH1 in human T cell acute lym-phoblastic leukemia. Science 306(5694):269–271.
22. Thompson BJ, et al. (2007) The SCFFBW7 ubiquitin ligase complex as a tumor sup-pressor in T cell leukemia. J Exp Med 204(8):1825–1835.
23. Van Vlierberghe P, et al. (2010) PHF6 mutations in T-cell acute lymphoblastic leuke-mia. Nat Genet 42(4):338–342.
24. Tosello V, et al. (2009) WT1 mutations in T-ALL. Blood 114(5):1038–1045.
25. Della Gatta G, et al. (2012) Reverse engineering of TLX oncogenic transcriptionalnetworks identifies RUNX1 as tumor suppressor in T-ALL. Nat Med 18(3):436–440.
26. De Keersmaecker K, et al. (2013) Exome sequencing identifies mutation in CNOT3 and ribo-somal genes RPL5 and RPL10 in T-cell acute lymphoblastic leukemia. Nat Genet 45(2):186–190.
27. Zhang J, et al. (2012) The genetic basis of early T-cell precursor acute lymphoblasticleukaemia. Nature 481(7380):157–163.
28. Mathur D, Somashekar S, Navarrete C, Rodriguez MM (2014) Twin infant with lym-phatic dysplasia diagnosed with Noonan syndrome by molecular genetic testing. FetalPediatr Pathol 33(4):253–257.
29. Tartaglia M, et al. (2006) Diversity and functional consequences of germline and so-matic PTPN11 mutations in human disease. Am J Hum Genet 78(2):279–290.
30. Irving J, et al. (2014) Ras pathway mutations are prevalent in relapsed childhoodacute lymphoblastic leukemia and confer sensitivity to MEK inhibition. Blood 124(23):3420–3430.
31. Malinowska-Ozdowy K, et al. (2015) KRAS and CREBBP mutations: A relapse-linkedmalicious liaison in childhood high hyperdiploid acute lymphoblastic leukemia.Leukemia 29(8):1656–1667.
32. Pear WS, et al. (1996) Exclusive development of T cell neoplasms in mice transplantedwith bone marrow expressing activated Notch alleles. J Exp Med 183(5):2283–2291.
33. Caunt CJ, Sale MJ, Smith PD, Cook SJ (2015) MEK1 and MEK2 inhibitors and cancertherapy: The long and winding road. Nat Rev Cancer 15(10):577–592.
34. Jackman M, Lindon C, Nigg EA, Pines J (2003) Active cyclin B1-Cdk1 first appears oncentrosomes in prophase. Nat Cell Biol 5(2):143–148.
35. Mac�urek L, et al. (2008) Polo-like kinase-1 is activated by aurora A to promotecheckpoint recovery. Nature 455(7209):119–123.
36. van Vugt MA, Brás A, Medema RH (2004) Polo-like kinase-1 controls recovery from aG2 DNA damage-induced arrest in mammalian cells. Mol Cell 15(5):799–811.
37. Holleman A, et al. (2004) Gene-expression patterns in drug-resistant acute lympho-blastic leukemia cells and response to treatment. N Engl J Med 351(6):533–542.
38. Papaemmanuil E, et al. (2014) RAG-mediated recombination is the predominantdriver of oncogenic rearrangement in ETV6-RUNX1 acute lymphoblastic leukemia.Nat Genet 46(2):116–125.
39. Nabel CS, Manning SA, Kohli RM (2012) The curious chemical biology of cytosine: De-amination, methylation, and oxidation as modulators of genomic potential. ACS Chem Biol7(1):20–30.
40. Ding L, et al. (2008) Somatic mutations affect key pathways in lung adenocarcinoma.Nature 455(7216):1069–1075.
41. Ding L, et al. (2012) Clonal evolution in relapsed acute myeloid leukaemia revealed bywhole-genome sequencing. Nature 481(7382):506–510.
42. Mullighan CG, et al. (2008) Genomic analysis of the clonal origins of relapsed acutelymphoblastic leukemia. Science 322(5906):1377–1380.
43. Neri A, Knowles DM, Greco A, McCormick F, Dalla-Favera R (1988) Analysis of RASoncogene mutations in human lymphoid malignancies. Proc Natl Acad Sci USA 85(23):9268–9272.
44. Magi A, et al. (2013) EXCAVATOR: Detecting copy number variants from whole-exome sequencing data. Genome Biol 14(10):R120.
45. Li H, Durbin R (2009) Fast and accurate short read alignment with Burrows-Wheelertransform. Bioinformatics 25(14):1754–1760.
46. Cibulskis K, et al. (2013) Sensitive detection of somatic point mutations in impure andheterogeneous cancer samples. Nat Biotechnol 31(3):213–219.
47. Saunders CT, et al. (2012) Strelka: Accurate somatic small-variant calling from se-quenced tumor-normal sample pairs. Bioinformatics 28(14):1811–1817.
48. Cingolani P, et al. (2012) A program for annotating and predicting the effects ofsingle nucleotide polymorphisms, SnpEff: SNPs in the genome of Drosophila mela-nogaster strain w1118; iso-2; iso-3. Fly (Austin) 6(2):80–92.
6 of 6 | www.pnas.org/cgi/doi/10.1073/pnas.1608420113 Oshima et al.