Embed Size (px)
Citation preview

Municipalities in Finland
Ms Hannele HäkkinenDirector, Brussels OfficeEstonian Delegation2.6.2010

2.6.2010
Association of Finnish Local and Regional authorities: Competence to support change
The way services are provided by municipalities will undergo radical changes over the next few years. The service needs of residents will also change.
The Association of Finnish Local and Regional Authorities and its companies support municipalities in their efforts to bring about the change. The objective is a viable municipality that will ensure the wellbeing of its residents and their opportunities for participation also in the future.
All municipalities are members of the Association by their own will.

2.6.2010
Short-term challenges for the Association’s operations
Balance between local government functions and internal financing
• Basic services programme and budget
• Revision of the financing and central government transfer systems
• Secure the bases of tax revenues
Functional local government and service structure
• Functional local government structure
• Effective service structure
• productivity, effectiveness, availability
• methods of provision and financing
• service strategies, information technology
• competitive tendering
• Functional democracy, opportunities for residents to exert influence, and management

2.6.2010
Association of Finnish Local and Regional Authorities and its affiliated companies in 2009
Gustavelund Ltd
Hotel and restaurant business
Suomen Kuntaliitto Finnish Consulting
Group, FCG Ltd58 % Association-owned (other owners:
universities, central government, private comp)
Consulting in:
physical planning and the environment
municipal infrastructure and administration
training for local authorities
share of international business 40 %
turnover over 70 million €,personnel over 600
Audiator Ltd
auditing firm
KL-Publications Ltd
Publications e.g. Associations periodical and municipal trade fair
KL-Hallintopalvelut Ltd
Property investments
Association of Finnish Local and
Regional Authorities

2.6.2010
Central figures
• Number of municipalities (cities, towns and municipalities) 342 on 1.1.2010
• Number of joint municipalities now over 200, diminishing due to new models of co-operation and mergers of municipalities
• Total expenditure 36,5 billion €
• Municipalities share of public expenditure almost 2/3
• Number of employees in municipal sector 424,000(17% of all employees in Finland)

2.6.2010
Municipal revenue and expenditure*• Expenditure (total 36,5 billion €):
• welfare and health care 52%
• education 25%
• infrastructure 19%
• financing and other exp 5%
• Revenues:
• tax income 52% of which
• income tax (varies 16,0–21,0%) 41%
• corporate tax, municipal share 4%
• property tax 2%
• Charges and fees 27%
• State subsidies 19%
• Other (loans and other) 7%
* includes both municipalities and joint municipalities

2.6.2010
Municipal organisation
COUNCILCOUNCIL
MUNICIPAL EXECUTIVE BOARDMUNICIPAL EXECUTIVE BOARD
MUNICIPAL COMMITTEES
Main tasks:Education and culture
Social welfare and health careEnvironment and technical infrastructure
MUNICIPAL COMMITTEES
Main tasks:Education and culture
Social welfare and health careEnvironment and technical infrastructure
AuditorsAuditors

2.6.2010
Municipal elections, 2008Percentage of votes received by each party
Election turnout 61,3 %
0,7
2,4
4,2
4,7
5,4
8,8
8,9
20,1
21,2
23,5
0 5 10 15 20 25
Other parties
Other groups
Christian democrats
Swedish People's Party
True Finns
Left Alliance
Green League
Centre Party
Social Democratic Party
National Coalition Party

2.6.2010
Percentage of women in municipal councils
10,7 14,7 18,1 22,2 25,2 27,2 30,0 31,5 34,4 36,4 36,7
0 %
10 %
20 %
30 %
40 %
50 %
60 %
70 %
80 %
90 %
100 %
1968 1972 1976 1980 1984 1988 1992 1996 2000 2004 2008
women men

2.6.2010
Examples of differences between municipalities
Average Smallest Largest
Population 31.12.2007 5 300 484 (total) 116 568 531Population density inh./km2 17,4 0,2 3 051,0Area (net of water areas) km2 303 901 (total) 6,0 15 052Economic structure
Agriculture and forestry % 3,9 0,1 33,2Manufacturing % 25,1 5,1 48,0Services % 70,1 38,0 86,3
Age structure 0–14 year-olds % 16,9 9,6 34,615–64 year-olds % 66,6 54,2 72,165 and over % 16,5 7,4 35,6
Local tax rate 2009,% of taxable income 18,60 16,50 21,00

2.6.2010
Number of municipalities by size of population
Inhabitants
7
17
31
45
66
134
48
100 000 and over
40 000–99 999
20 000–39 999
10 000–19 999
6 000–9 999
2 001–5 999
< 2 000
(Population 31.12.2007)

2.6.2010
Municipal employees in various branches
Employees in total 424 000 Health care30,9 %Social services26,5 %Education and culture26,1 %Town planning and publicworks 4,2 %Municipal enterprises4,6 %General administration3,6 %Real estate2,2 %Public order and safety1,9 %

2.6.2010
19 regions and Åland
342 municipalities
Finland’s regionsand municipalities

2.6.2010
Lähde: Tilastokeskus29.9.2004/RK
Karttapohja©Genimap Oy
65- vuotta täyttäneet 2003
Koko maa 15,6 %
% väestöstä
6,0 - 9,9 (14)10,0 - 19,9 (221)20,0 - 29,9 (207)30,0 - 32,4 (2)
% of population
The whole country 15 %
Lähde: Tilastokeskuksenväestöennuste 200429.9.2004/RK
Karttapohja©Genimap Oy
65- vuotta täyttäneet 2020
Koko maa 22,8 %
% väestöstä
11,2 - 19,9 (42)20,0 - 29,9 (240)30,0 - 39,9 (161)40,0 - 42,3 (1)
The whole country 22,8 %
% of population
Sources: Statistics Finland, Association of Finnish Local and Regional Authorities.
People over 65 years in 2003 and 2020

2.6.2010
People over 65 years
0
200 000
400 000
600 000
800 000
1 000 000
1 200 000
1 400 000
31
.12
.20
04
20
05
20
10
20
15
20
20
20
25
20
30
20
35
20
40
85 täyttäneet75 - 84 v65 - 74 v
Lähde: Tilastokeskus, väestöennuste 2004
Sources: Statistics Finland, population projecstion 2004, Association of Finnish Local and Regional uthorities.
At least 85 years
75 - 84 years
65 - 74 years

2.6.2010
Lähde: KTM
People at least 65 years to the 15-64 years old
Finland
France
Greece
Belgium
EU-15Denmark
Spain
Netherlands
AustriaUK
Luxembourg
PortugalIreland
Italy
SwedenGermany
all 2010 all 2020
Source: EU commission
Elderly dependency ratio

2.6.2010
Projected population change (% ) 2003-2030
Source: Statistics Finland
2.6.2010
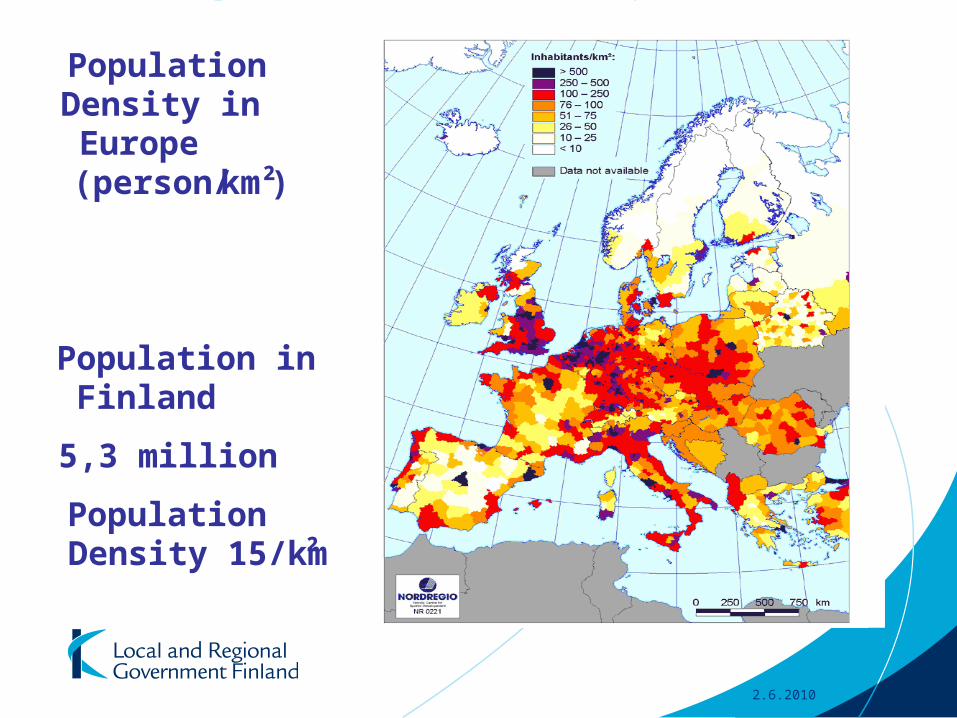
Population Density in Europe (person/km²)
Population in Finland
5,3 million
Population Density 15/km²

2.6.2010
Municipal employees retiring 2006-2020percentage of current employees regionally
Source: Halmeenmäki Tuomo: Kunta-alan eläkepoistuma 2006-2020. Kuntien eläkevakuutus, 2005.
Lapland
Kainuu
Southern Karelia
Southern Savo
Northern Savo
Satakunta
Kymenlaakso
Ostrobothnia
Uusimaa
Eastern Uusimaa
Åland islands
South-West Finland
Central Ostrobothnia
Kanta-Häme
Northern Ostrobothnia
Northern Karelia
Päijät-Häme
Southern Ostrobothnia
Central Finland
Tampere region
2.6.2010
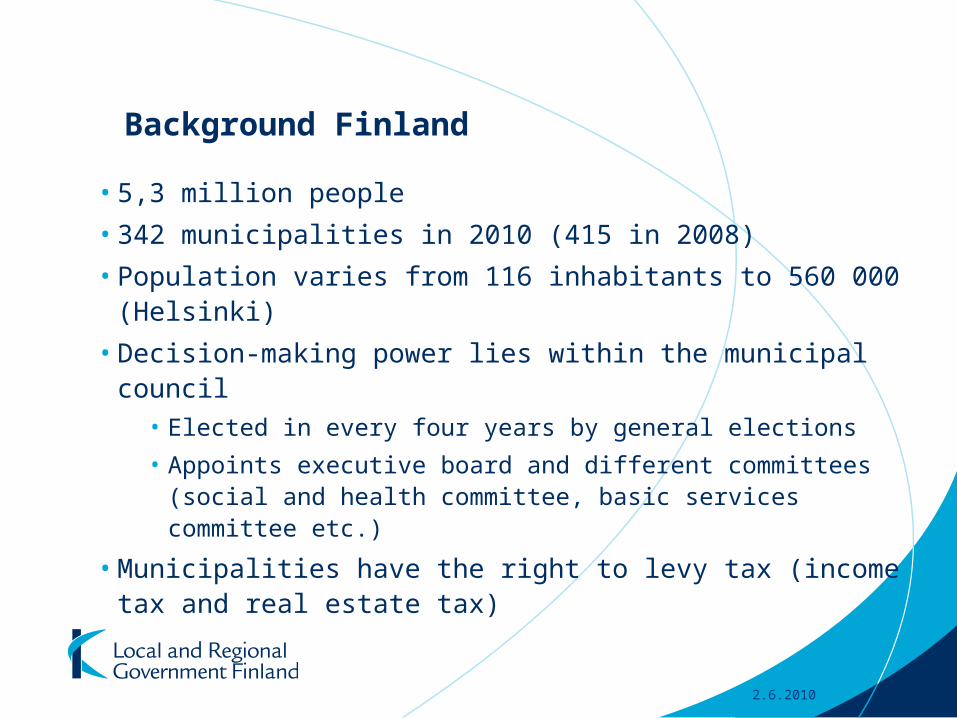
Background Finland
• 5,3 million people
• 342 municipalities in 2010 (415 in 2008)
• Population varies from 116 inhabitants to 560 000 (Helsinki)
• Decision-making power lies within the municipal council• Elected in every four years by general elections
• Appoints executive board and different committees (social and health committee, basic services committee etc.)
• Municipalities have the right to levy tax (income tax and real estate tax)

2.6.2010
Responsibility for basic welfare services
• The municipalities are responsible authorities for arranging of basic welfare services
• The way these services are arranged is decided by the municipality: it can
• produce services self
• have joint service provision with neighbouring municipalities
• buy services from other municipalities, joint councils or private service providers (Local Government Act 1995)
• use service voucher

2.6.2010
Reform to restructuring of municipalities and services 2005-2012
Objectives of the Reform
• A sound structural and financial basis for the services that municipalities are currently responsible for
• In order to secure the organisation and provision of such services in the future
• With due regards to the required standard of quality, effectiveness, availability, efficiency, and technological advancement
• Municipalities themselves lead the process of change within the limits of the framework legislation

2.6.2010
Reform to restructuring of municipalities and services
• Social welfare and health services play a key role in the modernisation of the entire services structure
Results
• Primary health care and social services• 260 municipalities plan to achieve the 20 000
population base by establishing a partnership area (responsible for primary health care and social services) > 66 partnership areas
• 20 would administratively be joint municipal boards, and 35 have chosen “host-municipality-model” (joint municipal organ) > 36 of the areas function already, others will start in 2010-2013

2.6.2010
Reform to restructuring of municipalities and services
Results
• Integration of social and health care • 25 municipalities plan to give all primary health care
and social services to the partnership areas
• 90 plan to give all other above mentioned services excluding children day care
• Rather many (67 municipalities) plan to give only some separate services, 10 none of these services and 68 haven’t made decisions

2.6.2010
Levels of Structural Reform
Administrative Structures
(basic municipality, service districts, regional municipalities)
Service Production
(companies, enterprises,
Inter-communal cooperation, purchasing)
Service processes
(expertise and know-how, technologies, productivity)
Managing
the change
within
Municipalities
(strategy,
management,
expertise,
resources,
evaluations)
State Strategy
and
Guidelines
(legislation,
municipalities policies,
financing,
restructuring state
administration)

2.6.2010
Basic TeamPopulation Responsibility- Basic Services
Basic Team
Basic Team
Regional Cooperation(20 - 30 000 population)
Services with special expertiseas regional services - digital Imaging - Specialists - Special services - Psychiatrics - …… - Qualitative and Cost effectiveServices
Regional Cooperation
Regional Cooperation
Cooperation in Hospital District- Electronic Patient Record- Laboratory- Imaging- Emergency Services (Telemedicine, call centre)- Medicine- Specialized Health Services
Private Producers and Third Sector (NGOs)- Occupational Health- Services for the Elderly- ….
Source: Talja 2003
Basic Team
Basic Team

2.6.2010
Solutions in Finland
• Reform to restructure municipalities and services
• Long-distance consultations, TeleHealth
• Joint emergency services
• Labour division between medical doctor and nurse, between dentist and dental assistant
• Mobile services (medical doctor, specialists, rehabilitation)
• Call Centres
• Health Promotion / Prevention

2.6.2010
Further Challenges in Finland
• Availability of professional labour force
• More input in primary health care

2.6.2010
Summary: Health care reforms
Year Focus Reforms
1972 Structure Primary Health Care Act: Implementation of health care centres
1979 Structure Occupational Health Care Act: prevention
1984 Structure Joint planning for social and health care services
1993 Structure Reform of state subsidies: Local Planning
Specialized Health Care Act
Act on the status und rights of the patients
2002 Structure, Financing Health care reform project 2002-2007
2005 Access to care Treatment guarantee
2007 Restructuring Restructuring of municipalities and services
2009 Structure Partnership areas (20 000 base population)
2010 Structure Reforming the laws of primary and secondary health care into one law
2010 Structure New proposal expected for structuring the primary and secondary health care (more concentration)
2.6.2010
Brussels Office of the Association of Finnish Local and Regional Authorities since 1992
• The Brussels Office of the Association of Finnish Local and Regional Authorities is a centre for lobbying towards the European Union for the Association and the Finnish local and regional authorities
• In March 2007 the office moved to the House of Municipalities, Cities and Regions in Brussels
• In the fourth floor there are 8 national offices: Denmark, Estonia, Finland, Iceland, Latvia, Norway, Scotland and Sweden
• In the house there are about 30 offices of national associations and of cities, and CEMR (Council of European Municipalities and Regions) and EUROCITIES

2.6.2010
Brussels Office
• It acts as a channel of communication towards the EU institutions and other partners and stakeholders in Brussels
• The office maintains contacts with EU institutions, Finnish opinion leaders and representatives of other countries
• It builds co-operational relationships and participates to the work of different networks relevant to the local and regional level
• It keeps the association, Finnish Municipalities and other stakeholders posted on initiatives of EU institutions and the drafting of regulatory acts and makes Finnish regional and local government known to the EU

2.6.2010
• The office arranges training, meetings, and visits in the premises of the House
• The office also serves as a base for the members and experts of the Finnish delegation of the Committee of the Regions
Brussels Office

2.6.2010
Communication
• The office has contact with the specialists of the Association and partners in Finland and in other countries
• The office has contact via e-mail and phone, meetings and conferences in Brussels are important for the dialogue and exchange of views with other European actors
• The office has visiting groups from Finland and other countries
• EU-newsletter (in Finnish)

2.6.2010
Networking
• In Brussels, there are about 300 offices which represent local and regional administration
• Different networks are precondition to have your voice heard
• The office has a close cooperation with other European sister organisations offices in Brussels and with CEMR (Council of European Municipalities and Regions)
• In networks it is possible to change information and experiences and work together for common opinions

2.6.2010
Influencing • Influencing through
• the Association of Finnish Local and Regional Authorities in Finland and in Brussels
• the networks: shared interests, common opinions
• the Committee of the Regions: the Association holds the technical secretary for the Finnish delegation
• The office has contacts with officials and politicians in EU and with experts of the Finnish permanent representation to EU
• The office works in different networks and mediates through them the views of Finnish regional and local government
• The office is a link between Helsinki and networks in Brussels

2.6.2010
Thank you for listening!
Further information: [email protected] Hannele HäkkinenDirector, Brussels OfficeThe Association of Finnish Local and Regional AuthoritiesSquare de Meeûs 11000 Brussels, BelgiumPhone: +32 478 338 322