Embed Size (px)
Citation preview
HELSINKI UNIVERSITY OF TECHNOLOGYDepartment of Electrical and Communications Engineering
Jarno Tanskanen
Multiuser CDMA Power Control Simulator — Effects of SimplePrediction
This Licentiate Thesis has been submitted for official examination for the degree of Licentiateof Technology in Espoo, Finland.
Supervisor of the Thesis Iiro Hartimo
HELSINKI UNIVERSITY OF TECHNOLOGY ABSTRACT OF THELICENTIATE THESIS
Author: Jarno Tanskanen
Name of the Thesis:Multiuser CDMA Power Control Simulator — Effects of Simple Prediction
Date: Jan. 19, 1998 Number of pages: 50 + 28
Faculty: Electrical and Communications EngineeringProfessorship: S-88, Signal Processing and Computer Technology
Supervisor: Professor Iiro Hartimo
In this work, reported in the Publications, predictivity of Rayleigh fading signals is investigated, andmultiuser CDMA communications simulators are developed for uplink closed loop power controlstudies. With the simulator, effects of applying predictive filtering within the closed power controlloop are studied. In the simulator, the prediction is applied to radio channel power responses whichare modeled by Rayleigh fading signals.
Motivation of the work arises from the power control needs of CDMA systems. The system user ca-pacity greatly depends on the power control system operation quality. In this work, power controlsystem aims to maintain the received power levels of all the mobile users at an equal and constantlevel at the base station receiver which is one of the possible basis for the practical power control. Asthe closed power control loop naturally includes signal processing and radio propagation delays, anintuitive approach for achieving power control system improvements is to apply predictive filtering.The user capacities are not directly observed but the results are given in the form of bit-error-rate im-provements, and as reductions in the mobile transmitter power consumption and received power levelvariance, the latter of which is now the actual control variable.
The simulator consists of fairly simple mobile transmitter, radio channel, base station receiver, andpower controller models, and is implemented in COSSAP (Communications Simulation and SystemAnalysis Program) environment. For predictive closed power control loop simulations, a single user, 5user, and 10 user simulators are constructed along with a simulator employing an AWGN multiuserinterference model. Naturally, also a non-predictive reference controller is used in the same simula-tors. Predictive filtering is performed by application of Heinonen-Neuvo polynomial FIR predictors,and optimum predictive power estimators developed by A. Huang. Also, linear AR predictors are de-signed for the task but they are found inadequate.
The simulators model the Qualcomm CDMA closed loop power control system which is found veryrestrictive by itself, not leaving much room for improvements by the predictive filtering. It is con-cluded that in this system, fine tuning the closed control loop is possible with proper predictive fil-tering.
Keywords: closed loop power control, mobile power control, code-division multiple-access, CDMA,predictive filtering, optimum power estimation, Heinonen-Neuvo polynomial predictor, multiusercommunications system simulation
Jarno Tanskanen, Multiuser CDMA Power Control Simulator — Effects of Simple Prediction
III
Preface
This work has been a most rewarding task, allowing me to reach into the world of mobilecommunications. This, along with learning concepts and tools of signal processing, has givenme much valuable insight that I now can apply not only in the field of telecommunications butin most areas of engineering.
First and foremost, my thanks go to Prof. Iiro Hartimo, Lab. of Signal Processing andComputer Tech., HUT, for his great patience with my work, and most profoundly, for makingthe work possible altogether. He could be described as the Father behind me, and also, let memention that he has had a very flexible mind in the matters like my conference travel plans. Iwould like to express my most sincere gratitude to Prof. Seppo Ovaska, Lab. of ElectricDrives and Power Electronics, HUT, for his ever ready and remarkably profound coachingduring these first steps on my path towards a scientific career. His work I have found mostvaluable; with his guidance, he has set me a standard for creating quality publications, andalso for scientific work in general. These standards let me not ever forget. A glimpsingthought goes through my mind that this Thesis is probably written somewhat too fast toescape his red pen (but I’m not going to show this to him until after binding). Also, thanks aredue to Prof. Timo Laakso, Lab. of Telecommunications Tech., HUT, for cooperation andguidance during the yearly stages of my work. Prof. Sven-Gustav Häggman, CommunicationsLab., HUT, is acknowledged for most kindly reading and commenting the Thesis. My manythanks extend to a coworker Lic.Tech. Aiping Huang, Lab. of Signal Processing andComputer Tech., HUT, for her guidance in many theoretical matters, and for her tirelesslyever friendly cooperation also otherwise. She never stopped smiling no matter how close ourpublication deadlines were. Research for this Thesis was carried out in parallel with hers,presented in her Licentiate Thesis [Hua97]. She has provided part of the predictors employedin the simulations presented here. For help in simulation matters, I am in debt to M.Sc. JariMattila, and thanks also go to M.Sc. Timo Korhonen and Lic.Tech. Michael Hall for manytheoretical discussions in which they were always ready to take the time to make meunderstand several difficult things. All three are with Communications Lab. of HUT. Last butnot least, I would like to thank the whole personnel of Laboratory of Signal Processing andComputer Technology for being a lively, very refreshing, and most friendly group in which Ihave found it fabulous to do scientific work. Let the spirit of Café Signal never fade, and let itinspire many generations of signal processing researchers to come.
Also, I would like to thank my parents, Sirkka and Raimo, for actively making sure that I hadfood and money during my studies and research, and for their support in general.
This work was funded by the Technology Development Centre of Finland, Nokia Corporation,Telecom Finland, and Helsinki Telephone Company, Finland. I was also supported throughpersonal grants from the Päijät-Häme Fund under the Auspices of the Finnish CulturalFoundation, and from Foundation of Technology, Finland.
In Otaniemi, January 19, 1998
Jarno Tanskanen
Jarno Tanskanen, Multiuser CDMA Power Control Simulator — Effects of Simple Prediction
IV
List of Publications
All the Publications [P1], [P2], [P3], [P4] and [P5], are jointly referred to as the Publications.
[P1] J. M. A. Tanskanen, A. Huang, T. I. Laakso, and S. J. Ovaska, “Polynomial predictionof noise shaping Rayleigh fading,” in Proc. 1995 Finnish Signal ProcessingSymposium, Espoo, Finland, June 1995, pp. 26–29.
[P2] J. M. A. Tanskanen, A. Huang, T. I. Laakso, and S. J. Ovaska, “Prediction of receivedsignal power in CDMA cellular systems,” in Proc. 45th IEEE Vehicular TechnologyConference, Chicago, IL, July 1995, pp. 922–926.
[P3] J. M. A. Tanskanen, J. Mattila, M. Hall, T. O. Korhonen, and S. J. Ovaska, “Predictiveclosed loop transmitter power control,” in Proc. 1996 IEEE Nordic Signal ProcessingSymposium, Espoo, Finland, Sept. 1996, pp. 5-8.
[P4] J. M. A. Tanskanen, J. Mattila, M. Hall, T. Korhonen, and S. J. Ovaska “Predictiveclosed loop power control for mobile CDMA systems,” in Proc. 47th IEEE VehicularTechnology Conference, Phoenix, Arizona, USA, May 1997, pp. 934-938.
[P5] J. M. A. Tanskanen, A. Huang, and I. O. Hartimo “Predictive power estimators inCDMA closed loop power control,” in Proc. 48th IEEE Vehicular TechnologyConference, Ottawa, Ontario, Canada, May 1998, in press.
Jarno Tanskanen, Multiuser CDMA Power Control Simulator — Effects of Simple Prediction
V
Contents
ABSTRACT .......................................................................................................................................................... II
PREFACE............................................................................................................................................................III
LIST OF PUBLICATIONS ................................................................................................................................ IV
CONTENTS...........................................................................................................................................................V
1. INTRODUCTION............................................................................................................................................. 1
2. LITERATURE OVERVIEW ........................................................................................................................... 3
2.1 RELATED PAPERS BY THE AUTHOR ............................................................................................................... 4
3. PREDICTION & POWER ESTIMATION .................................................................................................... 5
3.1 PREDICTIVE FILTERS & POWER ESTIMATION................................................................................................. 53.1.1 Predictor Selection Criteria.................................................................................................................. 53.1.2 Heinonen-Neuvo Polynomial Predictors .............................................................................................. 63.1.3 Optimal Power Estimators.................................................................................................................... 93.1.4 Linear Predictors................................................................................................................................ 123.1.5 LS Optimal Predictors ........................................................................................................................ 13
4. CLOSED LOOP POWER CONTROL SIMULATOR................................................................................ 14
4.1 UPLINK WAVEFORM..................................................................................................................................... 154.2 TRANSMITTER MODEL................................................................................................................................. 164.3 RADIO CHANNEL MODEL ............................................................................................................................ 17
4.3.1 Jakes’ Rayleigh Fader ........................................................................................................................ 214.3.2 Noise Shaping Rayleigh Fader ........................................................................................................... 21
4.4 RECEIVER MODEL....................................................................................................................................... 244.5 POWER CONTROLLER MODEL ..................................................................................................................... 25
4.5.1 The Qualcomm System Downlink Power Control...............................................................................254.5.2 Power Control in the Simulator.......................................................................................................... 26
5. NEURAL NETWORKS IN MOBILE POWER CONTROL...................................................................... 28
5.1 INTRODUCTION TO NEURAL NETWORKS...................................................................................................... 285.2 EXAMPLES OF NEURAL NETWORKS IN MOBILE POWER CONTROL............................................................... 29
6. CONCLUSIONS AND DISCUSSIONS......................................................................................................... 32
7. SUMMARY OF THE PUBLICATIONS ...................................................................................................... 33
8. ERRATA OF THE PUBLICATIONS........................................................................................................... 36
9. REFERENCES ................................................................................................................................................ 37
PUBLICATION P1
PUBLICATION P2
PUBLICATION P3
PUBLICATION P4
PUBLICATION P5
Jarno Tanskanen, Multiuser CDMA Power Control Simulator — Effects of Simple Prediction
VI
List of Abbreviations
Abbreviations are listed here as used in the introductory part of this Thesis. The abbreviationsused in the Publications may be Publication specific, and are defined within each Publication.
AR AutoRegressiveAWGN Additive White Gaussian NoiseBER Bit-Error-RateBPSK Binary Phase Shift KeyingCDMA Code-Division Multiple-AccessCIR Carrier-to-Interference RatioCOSSAP Communications Simulation and System Analysis ProgramDS Direct SequenceFFT Fast Fourier TransformFH Frequency HoppingFIR Finite Impulse ResponseGSM Global System for Mobile CommunicationsHM Hammerstein ModelH-N Heinonen-NeuvoIEEE Institute of Electrical and Electronics Engineers, Inc.IIR Infinite Impulse ResponseLOS Line of SightLS Least SquaresMDL Minimum Description LengthMENN Modified Elman Neural NetworkMSE Mean Squared ErrorMUD MultiUser DetectionNN Neural NetworkNSF Noise Shaping FilterPMDL Predictive Minimum Description LengthPN Pseudo NoiseQF Quadratic FilteringRF Radio FrequencySIR Signal-to-Interference RatioSNR Signal-to-Noise RatioSS Spread SpectrumWGN White Gaussian NoiseWM Wiener Model
Jarno Tanskanen, Multiuser CDMA Power Control Simulator — Effects of Simple Prediction
VII
List of Symbols
Symbols are listed here as used in the introductory part of this Thesis. The symbols used in thePublications may be Publication specific, and are defined within each Publication.
�� estimate of a quantity or signal' � shift or interval
c� quantity with a different value
�c quantity referring to carrier, or to
control command period
�D referring to Doppler
�i in-phase component of a signal, or
referring to ith propagation path ,
or ith neuron input
�q quadrature component of a signal
�N quantity referring to filter of
length, or order N
�q quadrature component of a signal
�r quantity referring to a received
signal
�t quantity referring to a transmitted
signal
�long long-term quantity
�max maximum of a quantity
�short short-term quantity
D angle between the mobile speedand transmitted radio wave
T phase angleV square root of mean squared error,
or square root of varianceW time intervalO wavelength
a filter denominator coefficientA short term signal amplitudeb filter numerator coefficientC number of context layer neuronsc transmitter power level setting, or
speed of lightd control loop delay in chip
durations, or physical distanceE envelope of the received fading
signal, or field strength
f frequency, or activation functionfD Doppler shiftG antenna gainh FIR coefficienti propagation path indexK number of neural network inputsk summation indexL polynomial degree, or number of
neural network outputsl summation index, or propagation
path lengthM number of filter denominator
coefficients, or number of bits percontrol interval, or number ofneuron inputs
m summation indexn discrete time sample index, or
summation indexN number of FIR, or filter numerator,
coefficientsO neuron outputP powerp probability density functionR number of propagation pathsS sequence length in sampless weighted sum of neuron inputst propagation delay, or continuous
time indexU number of mobile users in a systemv mobile speed&v mobile speed and directionw neuron connection weightx noiseless signal (the noisy
counterpart is y)X processing block input signal
sample valueXCorr cross-correlationy noisy signal (the noiseless counter
part is x)Y processing block output signal
sample value, or radio channeloutput
Jarno Tanskanen, Multiuser CDMA Power Control Simulator — Effects of Simple Prediction
1
1. Introduction
Always has communications played an important role in the history of mankind. Besidesdevelopment of means of traveling, which actually can be considered to have been also theonly means of data transport, it can be considered the single most efficient agent that haschanged the views of vast numbers of people with methods ranging from continent-widepropaganda to very personal communications [Li95]. In the sense of reaching everybody onthe globe, the modern communications is still far from being truly global but the growingcommercialism requires more efficient communications technologies to keep on growing, andalso the wireless communications technology itself is making itself affordable, desirable, andfinally, indispensable. This technological evolution is investigated in [Sha97] and [Vit94b].
Increasing density of active cellular telephone users is a well-known problem in the field ofmobile communications. With the existing systems, this has to be taken care of by networkplanning, and reorganizing the existing networks, for example, by reducing cell sizes in densemobile user environments. It is well understood that a future mobile communication systemshould possess profoundly more user capacity in order to be successful. Direct-sequencespread-spectrum code-division multiple-access (DS/SS/CDMA) system technology is one ofsuch new technologies which is already trying to penetrate the markets [Sch90], [Mag94].Several differing analyses on the user capacities of CDMA systems have been conducted[Gil91], [Vit93b], [JaM94], [Lee97], [Ada96]. Although there are many opinions on theachievable user capacity increase, the importance of power control system in CDMA systemshas been well established [Gil91], [Vit93a], [Sim93], [Vit95], [Vit94a], [Cam96]. It isgenerally accepted that the user capacity of a CDMA system is crucially interference limited,and thus the mobile power control function plays a major role in maximizing the capacity. Theeffects of imperfect power control are studied in [Pra92], [Kim97], and [Pri96].
The motivation for the work presented in this Thesis arises from these power control needs ofmobile CDMA communications systems. In this Thesis, the power control system aims tomaintain the received power levels from all the mobile users at equal and constant level at thebase station receiver. This is one of the actual possible basis for the power control [Qua92].The power control is to minimize the near-far effect [Lin92], i.e., the phenomenon thatwithout proper power control mobiles close to the base station cause overly large interferencelevels to the reception of the users further away. Also, the power control systems should beable to counteract fast Rayleigh fading at least to the extend that the bit errors caused by theRayleigh fading are randomized [Qua92], i.e., there are not many errors caused by the samelong lasting and deep fade. This error randomization occurs when the mobile speed issufficiently high, and the fades correspondingly of sufficiently short duration. Below thatmobile speed, the power control systems should must be able to compensate for the fading inorder to ensure sufficient transmission quality. In [Qua92], the field trials had shown that thepower control, described in [Qua92], is able to compensate for fading at mobile speeds of 0miles/h, …, 10 miles/h. At the speeds over 20 miles/h, the fades were short enough for theinterleaver [Sim93] to make it possible for the Viterbi decoder [Vit95] to function properly.Within the mobile speed range from 10 miles/h to 20 miles/h, the power control system wasnot able to compensate for fading, nor was the errors sufficiently randomized in order toprovide for good error correction performance.
Now, the aim of applying predictive lowpass filtering in a closed power control loop starts tounfold. First, the lowpass filtering itself is necessary in a systems which measures the received
Jarno Tanskanen, Multiuser CDMA Power Control Simulator — Effects of Simple Prediction
2
power level, as otherwise also much of the noise power would be accounted into the receivedpower level estimate causing severe received power level estimation errors. Secondly, closedcontrol loop response is always delay limited. In the loop there are several sources of signalprocessing delays, as well as the radio propagation delays (estimation of propagation delays,[Str96]) both ways. Thus, it would be intuitively desirable to be able to predict radio channelbehavior in advance so that the control action could be taken at a correct time despite of thecontrol loop delays. Next, as mentioned, it is not helpful to try to maintain perfect powercontrol above a certain mobile speed. Thus, the lowpass filtering could be designed so that thepower controller would actually never need to see the fading which is too fast, andunnecessary for it to compensate anyway. In the Publications [P1], [P2], [P3], [P4], [P5],included into this Thesis, predictive filtering methods for improving received power levelestimates are proposed and simulated. The received power level estimate is a naturallyessential input to any transmitter power control system, and it is expected that anyimprovement in the quality of the received power level estimate directly contributes to theuser capacity. The methods take advantage of any polynomial-like behavior, or of statisticalproperties in general, of the power response of a fading transmission path. Employingpredictive polynomial estimation [Hei88] or optimum power estimation by A. Huang[Hua95], [Hua96], [Hua97], [Hua98], it is possible to reduce the effects of propagation andprocessing delays within a closed power control loop, and at the same time delaylessly reduceboth interference and noise present in the received power level estimates.
In the first publications [P1], [P2], the predictability of radio channel power responses isinvestigated by applying predictive filters to noisy delayed Rayleigh fading signals. The noisydelayed Rayleigh fading signals are found well predictable, and criteria for selecting the rightpolynomial predictors for difference environments, i.e., for different noise levels and mobilespeeds, are found. Next, predictors are employed into a closed power control loop of a singleuser CDMA communications systems [P3]. The results from the single user system arenaturally not of great practical interest but they very clearly state the definite need for filteringin general within an interference, or noise, limited power control system. Finally, the systemevolves into a full multiuser simulator [P4], [P5], with 5 or 10 users. In this context, alsoadditive whiter Gaussian noise (AWGN) multiuser interference model simulations areperformed. It is seen that with the selected Qualcomm’s power control system parameters[Qua92], the power control system is inherently very restrictive and does not leave much roomfor improvements from simple predictive filtering. Anyway, the results state that the closedpower control loop can be fine tuned with proper predictive filtering.
r Note: The terms white Gaussian noise (WGN), and additive white Gaussian noise (AWGN), used in the Thesis and in the Publications,refer to Gaussian noise whose spectrum is flat within a limited frequency band determined by the sampling frequency, and zero outside thisfrequency band. Thus, WGN, and AWGN, can be associated with a finite variance.
Jarno Tanskanen, Multiuser CDMA Power Control Simulator — Effects of Simple Prediction
3
2. Literature Overview
Calhoun [Cal88] gives a good, easy-to-read introduction to the field of cellular systems andafter that Lee [Lee86] provides a somewhat more mathematical basic reading on mobilecommunication. [Eur93] is the GSM (Groupe Spécial Mobile, i.e., Global System for MobileCommunications) standard, and [Bai94] outlines third-generation mobile radio design issues.GSM is classified as a second-generation system. [Has93] is a tutorial-survey paper to indoorradio propagation issues. Among many other things, the classical Jakes’ Rayleigh fadingchannel model is presented in [Jak74], and a comprehensive study of propagation models withrecommendations is given in [IEE88]. [Par92] can be recommended for reading on mobileradio propagation channels. Propagation power-spectral theory is discussed in [Gan72] where,for example, typical power spectra for some antenna geometries are derived. A channelsimulators are described in [Has79]. In the last of which, Jakes’ Rayleigh fader [Jak74] isimplemented using a microprocessor. Computer models for some fading channels aredescribed in [Loo91].
In [Mag94], several concepts of spread spectrum (SS) systems are clearly stated. [Sim85]along with [Pic91] serve as more mathematical basic references to SS systems, and [Car86] isa course book on communication systems. [Sch90] is a plain English introduction to bothdirect-sequence (DS) and frequency-hopping (FH) SS systems. A code-division multiple-access (CDMA) system overview with power control analysis is given in [Lee91]. Definitelyone of the main issues in CDMA systems is the system capacity which is also discussed in[Gil91] with reference to interference suppression. A feed back power control model forCDMA systems is presented in [Ari93] and signal-to-interference (SIR) based capacityanalysis is continued in [Ari94]. [Åst87] serves as a general reference to adaptive feedbackcontrol. A SIR based power control algorithm for mobile-to-base station transmissions in atime-division multiple-access (TDMA) system is analyzed in [Cha94]. In [Gej92], the basestation-to-mobile link power control in CDMA systems is discussed on the basis of carrier-to-interference ratio (CIR). CIR based optimum power control is analyzed in [Zan92], and CIRbased analyses of centralized and distributed power control schemes are given in [Gra93] and[Gra94], respectively. Effects of imperfection in CDMA power control systems are discussedin [Pra92], [Kud93], [Pri96], and [Kim97]. Call blocking probability in terms of averagenumber of users requesting service, i.e., Erlang capacity, in a power controlled CDMA systemis analyzed in [Vit93b]. Other references on the effects of power control on CDMA systemperformance and capacity include [Mil92], [Kud92], [Kim93], [Vit93a], [Ton94] and[Vit94a]. Also, a variety of neural network based solutions to the problems ofcommunications technology have been proposed in the literature. For example, multiuserdetection (MUD) performance of neural networks in CDMA systems is compared toperformances of conventional techniques in [Miy93]. Channel equalization using neuralnetworks is proposed by Kechriotis [Kec94]. Channel equalization schemes are used at thereceiver to decrease the effects of channel distortions, e.g. power signal fading and interusercrosstalk interference, and to recover the transmitted symbols. [Fre91] is a basic course bookon neural networks.
[Par87], [Orf90], and [The92] serve as the starting points to digital signal processing methods.Heinonen-Neuvo (H-N) polynomial predictors, used in this work, are introduced in [Hei88].The method for implementing the first or the second degree H-N predictors of any length witha fixed number of arithmetic operations is given in [Cam91]. A signal processing orientedview to Newton-type predictors is presented in [Ova91b]. Optimization of polynomial
Jarno Tanskanen, Multiuser CDMA Power Control Simulator — Effects of Simple Prediction
4
predictors for any application specific prefilter is derived in [Laa93]. Extensions of theNewton’s backward prediction algorithm to linear smoothed Newton and to median smoothedNewton predictors are introduced in [Ova91a]. The linear smoothed Newton predictors arefurther extended to recursive ones in [Ova92]. Cellular mobile system concepts are broughttogether with predictive filtering by application of polynomial predictors to predictiveestimation of received signal power in mobile CDMA communications systems. Thisapplication is discussed in the Publications with illustrative simulations. Detailed statisticalanalysis on power prediction is carried out by A. Huang in [Hua95], [Hua98] and [P5].
2.1 Related Papers by the Author
In addition to the Publications, the author has been a minor co-author in a few papers relatedto the field of predictive power control. The research results presented in these papers arereviewed in the Thesis.
In [Gao96], Gao introduces a hybrid neural network (NN) approach to the received powerlevel prediction problematics. In that paper, predictive minimum description length (PMDL)principle is employed in NN structure optimization. In [Gao97a], the predictive NN conceptsare develop in to a NN structure with a context memory component, i.e., the NN is given anability to remember the aspects of the inputs not only through the change of weights but alsoexplicitly using non-processing memory neurons that feed information from upper layers backto the lower layers. The concepts of [Gao97a] are illustratively elaborated in [Gao97c], whereGao also gives the tedious derivations of the PMDL principle and its usage to NN structureoptimization.
General NN theory still has many unknown components. In [Var97], Varone fills one of these.In this paper, frequency responses of some NNs, originally designed for prediction ofRayleigh fading, are estimated and analyzed. Even though the NNs as non-linear systems donot possess frequency responses in the common sense, it is possible to estimate input-dependent frequency responses for them. This work gives new tools for NN designers tounderstand the fundamental properties of NNs.
In [Hua98], Huang gives demanding derivations for the optimum power estimator based onthe Wiener model with a complex-valued input. Also, simulation results applying theoptimum power estimators in a single user mobile transmitter closed loop power controlsystem are given.
Jarno Tanskanen, Multiuser CDMA Power Control Simulator — Effects of Simple Prediction
5
3. Prediction & Power Estimation
3.1 Predictive Filters & Power Estimation
Generally, a prediction based on N past signal samples and M past predictor outputs is given[Orf90] by
� � � ��( ) ( ) �( )y n b l y n l a m y n ml
N
m
M
� � � �
�
�
¦ ¦10
1
0
1
(3.1)
where n is a discrete time sample index, b(l) and a(m) are predictor coefficients, y(n) is a noisypredictor input signal sample, i.e., in this work, a received power level measurement orcomponent of the received complex-valued baseband equivalent signal, and �( )y n is thecorresponding predictor output. The noiseless counterpart of the signal y(n) is denoted later byx(n).
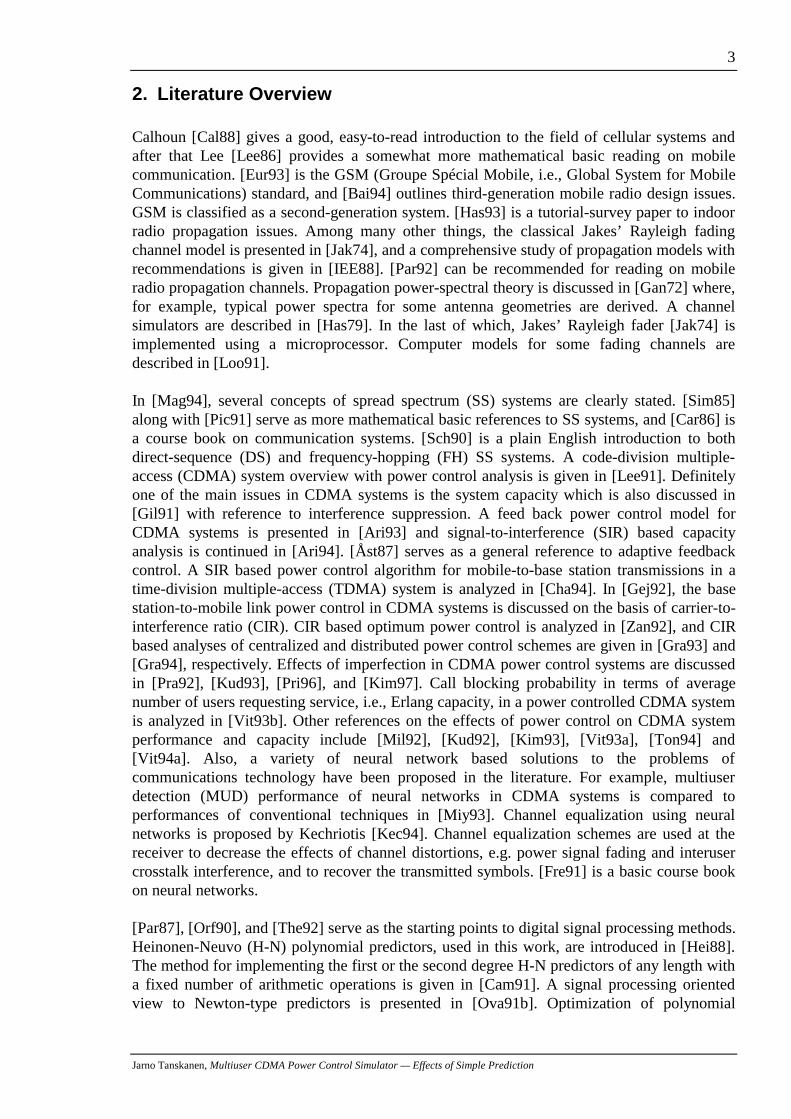
As the baseband equivalent signal concerned is complex-valued, there are three possibilitiesfor predictive power estimation. The predictive filtering can be done using real-coefficientpredictors either to predict the components independently with two predictors Fig. 3.1(b), orto predict the signal power as such with a single predictor, Fig. 3.1(a) [Hua95]. It is alsopossible to use complex-coefficient predictors to predict the complex-valued baseband signal[Har95]. From the analysis point of view, it is sufficient to consider here only the real-coefficient cases. The extension to the complex-coefficient predictors can be done if desired.
y(n)
yq(n)
yi(n)
yi(n)
yq(n+1)^
yi(n+1)^
Prediction
Prediction
Prediction
Squaring andsummation
Squaring andsummation
(a)
(b)
y(n+1)^
y(n+1)^
yq(n)
Fig. 3.1. Power prediction schemes for complex-valued signals. y n y ni q( ) ( )and are the noisy in-phase and
quadrature components, respectively, � ( ) � ( )y n y ni qand are the corresponding predictions, and �( )y n is the
prediction of the signal power.
3.1.1 Predictor Selection Criteria
In [P1] and [P2], the predictor selection criteria is the SNR gain achieved using H-Npolynomial predictors with noisy, one-step-delayed Rayleigh distributed signals as inputs. Theresults are then used as reasonable choices for the predictors to be applied in the simulationsetups in [P3] and [P4]. In this section, optimum H-N, and optimum power predictors for eachmobile speed are found in a more consistent and unified manner. Two criteria, minimummean squared error (MSE), and Minimum Description Length (MDL) criteria [Ris84],[The92], [Gao96], [Gao97] given by
Jarno Tanskanen, Multiuser CDMA Power Control Simulator — Effects of Simple Prediction
6
� � � �� �V2 1 2
1
�
¦Sn
S
y n x n (3.2)
and� �MDL N S N SN �ln lnV
2 , (3.3)
respectively, are used for filter design parameter selection. In (3.2) and (3.3),S �2 9600s samples / s is the number of samples used in evaluating the criteria, x(n) is theideal predictor output signal sample, y(n) the actual predictor output sample, and N the lengthor order of the predictor. The subscript N denotes that the quantity is calculated for thepredictor of length or order N. MDL is actually a criteria used for finding the order of anautoregressive (AR) process [The92], and can also be used in determining the topology ofneural networks [Gao96], [Gao97c]. As our Rayleigh fading process is not an AR process (cf.Section 4.3, Radio Channel Model), the MDL, or any other AR process order selectingcriteria, cannot be expected to give exact results, and therefore it is always compared with themean squared error criterion. The criteria are always evaluated using a different butstatistically equivalent set of fading signal samples from that used in designing the predictors.Both criteria are evaluated over two seconds of Rayleigh fading channel power response foreach noise level and mobile speed applied in the COSSAP simulations. The predictor designparameters over which the optimization is performed using MSE is given in [P5], except forthe linear AR predictors which are shortly discussed in Section 3.1.4 below. The treatments in[P5] and in Section 3.1.4 are exactly analogous.
The Heinonen-Neuvo (H-N) and optimum predictors, reviewed below, are designed for thesingle user simulations for Rayleigh fading signal components with AWGN variances 0.1, 0.2,…, 0.9 for mobile speeds 10 km/h and 30 km/h, for 5 and 10 user simulations also forRayleigh fading signal components but with AWGN variance 0.05, modeling receiver noise(and adjacent cell interference) and for mobile speeds 5 km/h, 10 km/h, …, 45 km/h, andfinally, for the AWGN multiuser interference model simulations for fading signal componentswith AWGN variances of 1 and 5 for mobile speeds of 10 km/h and 30 km/h.
3.1.2 Heinonen-Neuvo Polynomial Predictors
As a class of finite impulse response (FIR) type predictors is considered in this work, theprediction (3.1) reduces to [Orf90]
� ��( ) ( )y n b l y n ll
N
� �
�
¦10
1
. (3.4)
A filter of the form given in (3.4) is naturally inherently stable when b(l) and y(n) arebounded. With general infinite impulse response (IIR) predictors, given by (3.1), the stabilitywould have to be separately proved in order to safely employ them in the closed power controlloop. This is a natural requirement for the closed control loop to remain stable. To estimate aRayleigh distributed signal by polynomials, the coefficients b(l) are chosen to minimize noisegain when the predictor input signal is a low-degree polynomial corrupted by Gaussian noise.These predictors are generally know as Heinonen-Neuvo (H-N) polynomial predictors[Hei88], and have closed form predictor coefficients for given low degree of polynomial inputsignals. The coefficients b(l) for the first and second degree predictors are given by
Jarno Tanskanen, Multiuser CDMA Power Control Simulator — Effects of Simple Prediction
7
b lN l
N N1
4 6 2
1( )
( )
� �
�(3.7)
b lN l N l l
N N N2
2 2
3 2
9 9 36 30 18 63 2
( )( )
� � � � �
� �(3.6)
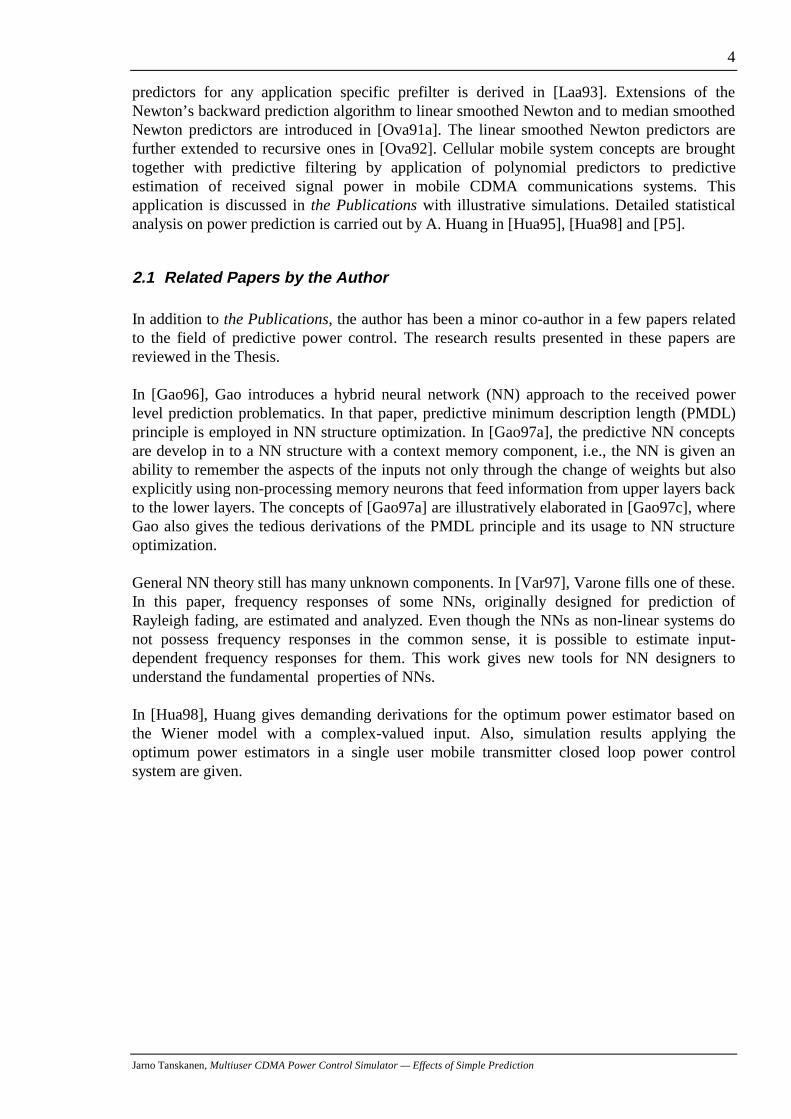
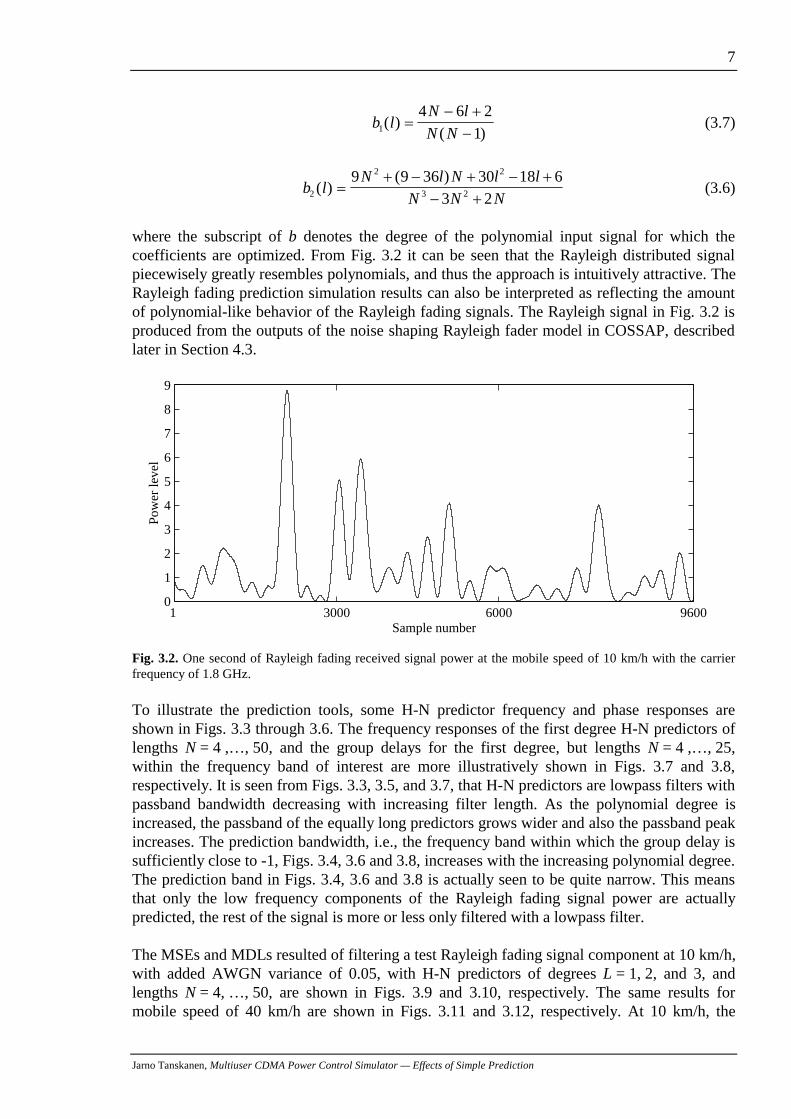
where the subscript of b denotes the degree of the polynomial input signal for which thecoefficients are optimized. From Fig. 3.2 it can be seen that the Rayleigh distributed signalpiecewisely greatly resembles polynomials, and thus the approach is intuitively attractive. TheRayleigh fading prediction simulation results can also be interpreted as reflecting the amountof polynomial-like behavior of the Rayleigh fading signals. The Rayleigh signal in Fig. 3.2 isproduced from the outputs of the noise shaping Rayleigh fader model in COSSAP, describedlater in Section 4.3.
1 3000 6000 96000
1
2
3
4
5
6
7
8
9
Sample number
Pow
er le
vel
Fig. 3.2. One second of Rayleigh fading received signal power at the mobile speed of 10 km/h with the carrierfrequency of 1.8 GHz.
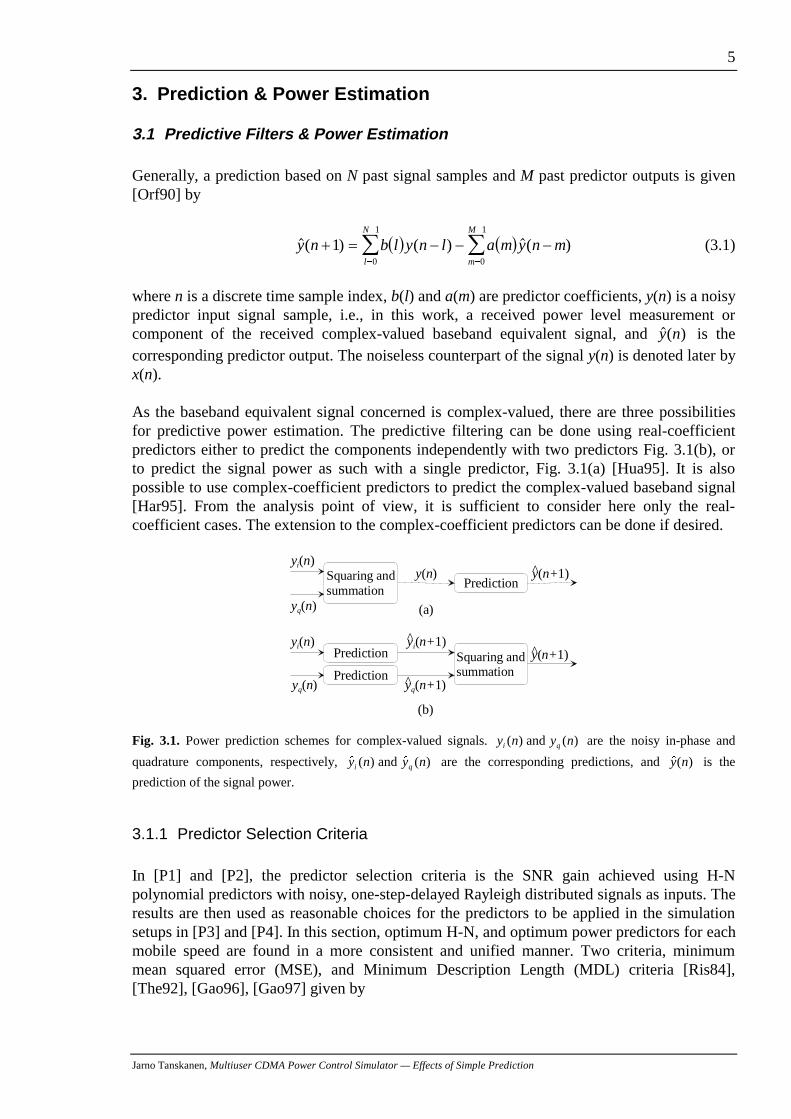
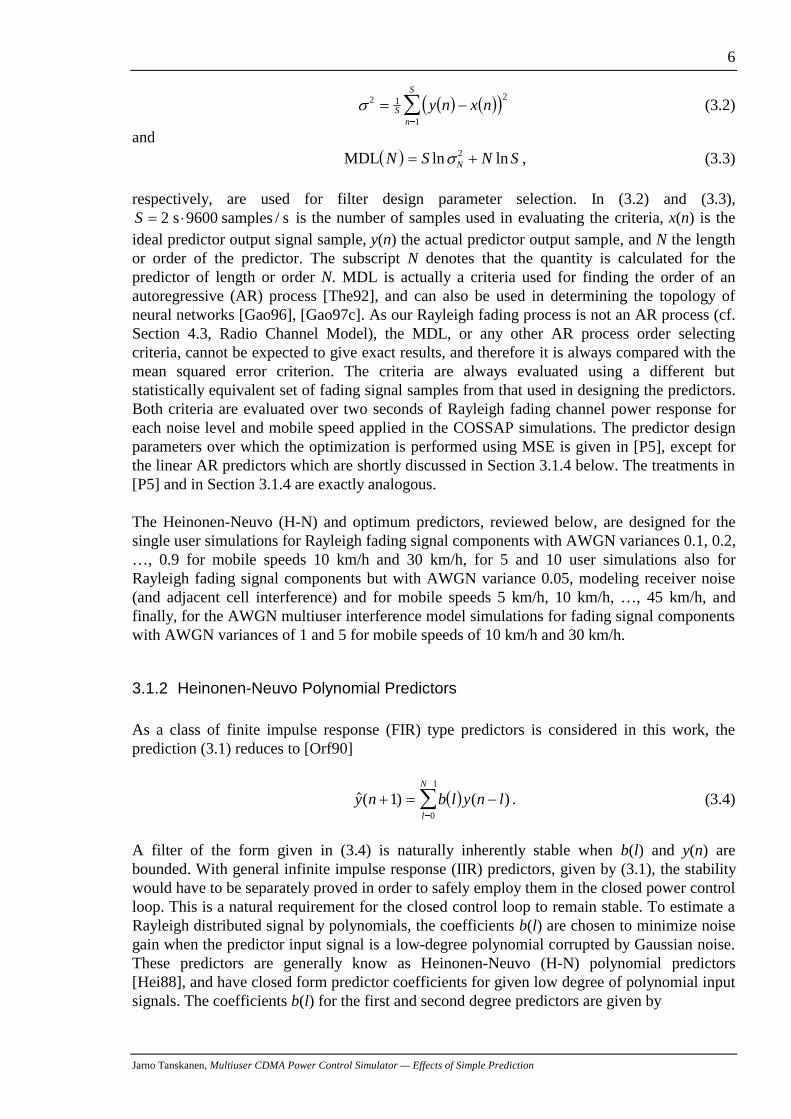
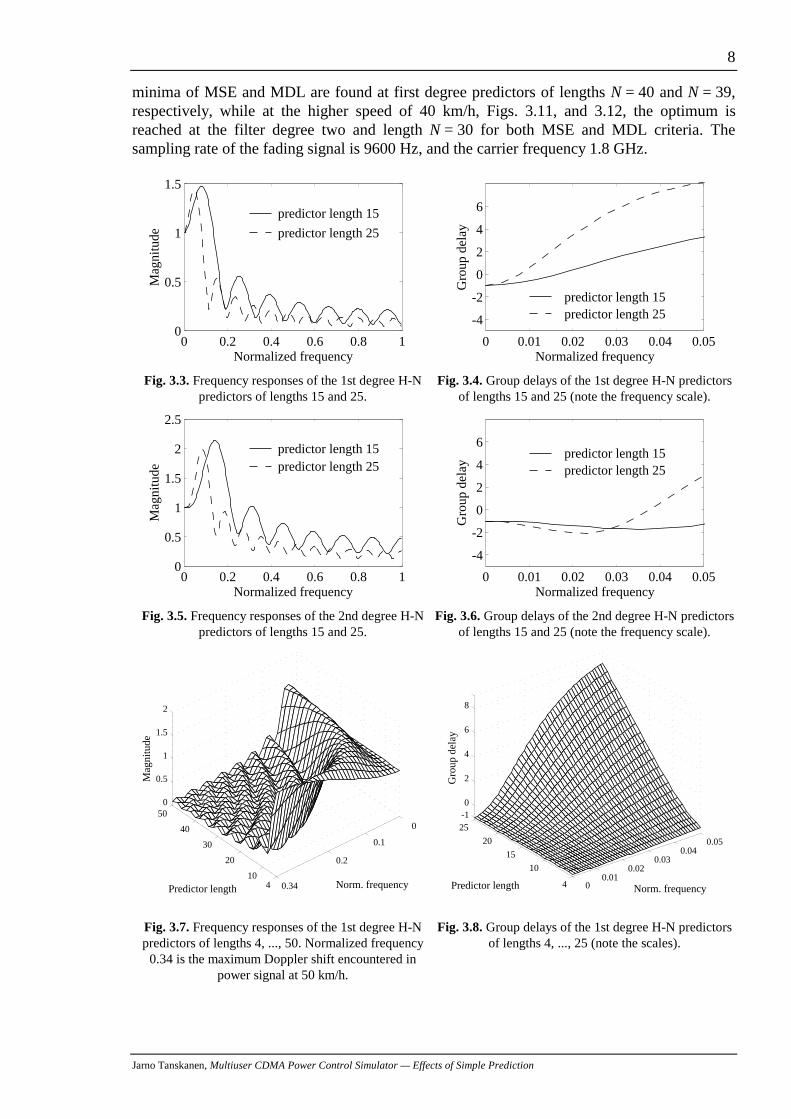
To illustrate the prediction tools, some H-N predictor frequency and phase responses areshown in Figs. 3.3 through 3.6. The frequency responses of the first degree H-N predictors oflengths N = 4 ,…, 50, and the group delays for the first degree, but lengths N = 4 ,…, 25,within the frequency band of interest are more illustratively shown in Figs. 3.7 and 3.8,respectively. It is seen from Figs. 3.3, 3.5, and 3.7, that H-N predictors are lowpass filters withpassband bandwidth decreasing with increasing filter length. As the polynomial degree isincreased, the passband of the equally long predictors grows wider and also the passband peakincreases. The prediction bandwidth, i.e., the frequency band within which the group delay issufficiently close to -1, Figs. 3.4, 3.6 and 3.8, increases with the increasing polynomial degree.The prediction band in Figs. 3.4, 3.6 and 3.8 is actually seen to be quite narrow. This meansthat only the low frequency components of the Rayleigh fading signal power are actuallypredicted, the rest of the signal is more or less only filtered with a lowpass filter.
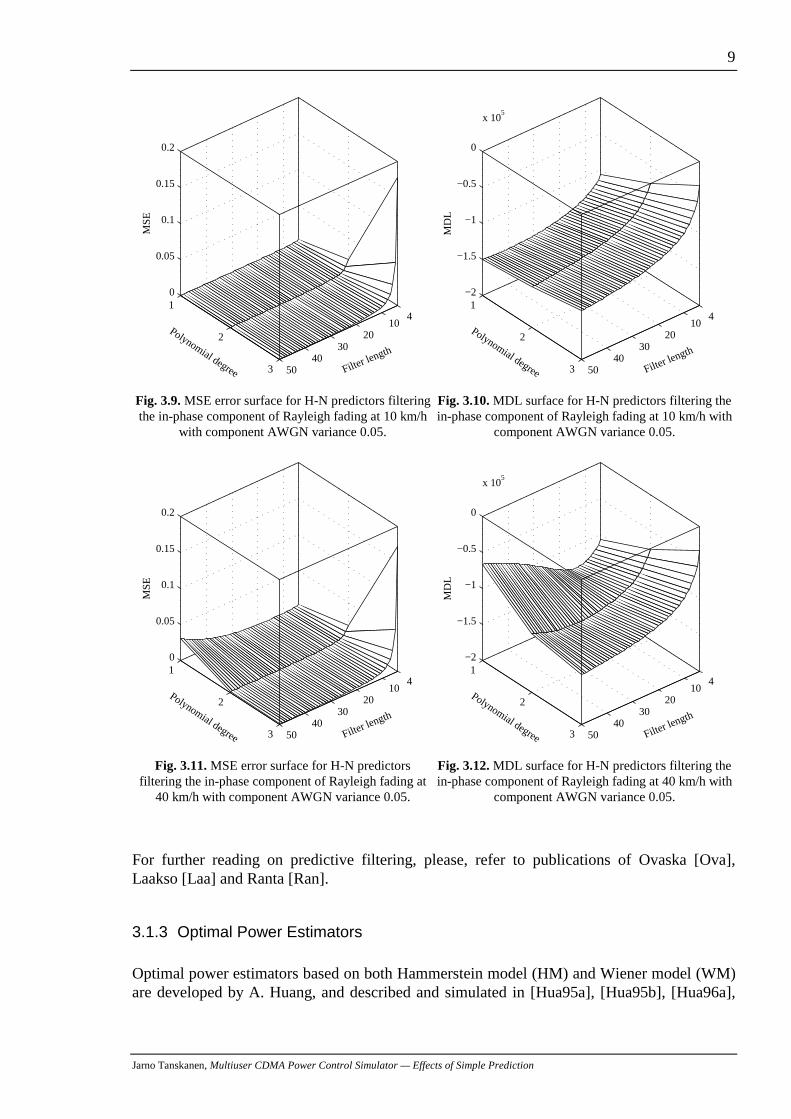
The MSEs and MDLs resulted of filtering a test Rayleigh fading signal component at 10 km/h,with added AWGN variance of 0.05, with H-N predictors of degrees L = 1, 2, and 3, andlengths N = 4, …, 50, are shown in Figs. 3.9 and 3.10, respectively. The same results formobile speed of 40 km/h are shown in Figs. 3.11 and 3.12, respectively. At 10 km/h, the
Jarno Tanskanen, Multiuser CDMA Power Control Simulator — Effects of Simple Prediction
8
minima of MSE and MDL are found at first degree predictors of lengths N = 40 and N = 39,respectively, while at the higher speed of 40 km/h, Figs. 3.11, and 3.12, the optimum isreached at the filter degree two and length N = 30 for both MSE and MDL criteria. Thesampling rate of the fading signal is 9600 Hz, and the carrier frequency 1.8 GHz.
0 0.2 0.4 0.6 0.8 10
0.5
1
1.5
Normalized frequency
Mag
nitu
de
predictor length 15
predictor length 25
Fig. 3.3. Frequency responses of the 1st degree H-Npredictors of lengths 15 and 25.
0 0.01 0.02 0.03 0.04 0.05
-4
-2
0
2
4
6
Normalized frequency
Gro
up d
elay
predictor length 15predictor length 25
Fig. 3.4. Group delays of the 1st degree H-N predictorsof lengths 15 and 25 (note the frequency scale).
0 0.2 0.4 0.6 0.8 10
0.5
1
1.5
2
2.5
Normalized frequency
Mag
nitu
de
predictor length 15predictor length 25
Fig. 3.5. Frequency responses of the 2nd degree H-Npredictors of lengths 15 and 25.
0 0.01 0.02 0.03 0.04 0.05
-4
-2
0
2
4
6
Normalized frequency
Gro
up d
elay
predictor length 15predictor length 25
Fig. 3.6. Group delays of the 2nd degree H-N predictorsof lengths 15 and 25 (note the frequency scale).
0
0.1
0.2
0.34 410
20
30
40
500
0.5
1
1.5
2
Norm. frequencyPredictor length
Mag
nitu
de
Fig. 3.7. Frequency responses of the 1st degree H-Npredictors of lengths 4, ..., 50. Normalized frequency0.34 is the maximum Doppler shift encountered in
power signal at 50 km/h.
00.01
0.020.03
0.040.05
4
10
15
20
25-1 0
2
4
6
8
Norm. frequencyPredictor length
Gro
up d
elay
Fig. 3.8. Group delays of the 1st degree H-N predictorsof lengths 4, ..., 25 (note the scales).
Jarno Tanskanen, Multiuser CDMA Power Control Simulator — Effects of Simple Prediction
9
410
2030
4050
1
2
3
0
0.05
0.1
0.15
0.2
Filter length
Polynomial degree
MS
E
Fig. 3.9. MSE error surface for H-N predictors filteringthe in-phase component of Rayleigh fading at 10 km/h
with component AWGN variance 0.05.
410
2030
4050
1
2
3
−2
−1.5
−1
−0.5
0
x 105
Filter length
Polynomial degree
MD
L
Fig. 3.10. MDL surface for H-N predictors filtering thein-phase component of Rayleigh fading at 10 km/h with
component AWGN variance 0.05.
410
2030
4050
1
2
3
0
0.05
0.1
0.15
0.2
Filter length
Polynomial degree
MS
E
Fig. 3.11. MSE error surface for H-N predictorsfiltering the in-phase component of Rayleigh fading at
40 km/h with component AWGN variance 0.05.
410
2030
4050
1
2
3
−2
−1.5
−1
−0.5
0
x 105
Filter length
Polynomial degree
MD
L
Fig. 3.12. MDL surface for H-N predictors filtering thein-phase component of Rayleigh fading at 40 km/h with
component AWGN variance 0.05.
For further reading on predictive filtering, please, refer to publications of Ovaska [Ova],Laakso [Laa] and Ranta [Ran].
3.1.3 Optimal Power Estimators
Optimal power estimators based on both Hammerstein model (HM) and Wiener model (WM)are developed by A. Huang, and described and simulated in [Hua95a], [Hua95b], [Hua96a],
Jarno Tanskanen, Multiuser CDMA Power Control Simulator — Effects of Simple Prediction
10
[Hua96b], [Hua96c], [Hua97] which is her Licentiate Thesis and a counterpart to this Thesis,[Hua98], and [P5].
General quadratic filtering (QF) [Pic82], [Sic92], [Fan95] is not well suited for practical realtime application because of massive computations needed. Two simple structures [Fan95] ofQF, HM and WM, with low computational requirements are of interests, though. Huang (seereferences above) has analyzed these models for complex-valued signals. A power estimatorfor complex-valued signals based on HM is illustrated in Fig. 3.1(a), and a WM basedestimator in Fig. 3.1(b).
In WM based estimators, a global optimization yields a solution which is only applicable asnumerical solutions for filter coefficients though iterative calculations. On the other hand, theestimator, Fig. 3.1(b) can be partially-optimized in closed form by solving for optimalestimation at the output of the filters, i.e., the overall power estimator is partially-optimized.For the results and derivations on optimum power estimators based on WM, please refer to[P5], or to [Hua98] in which the filter design more elaborately presented. Results in [P5] areachieved employing partially-optimized power estimators based on WM. HM based powerestimator were not employed in the simulations presented in the Publications.
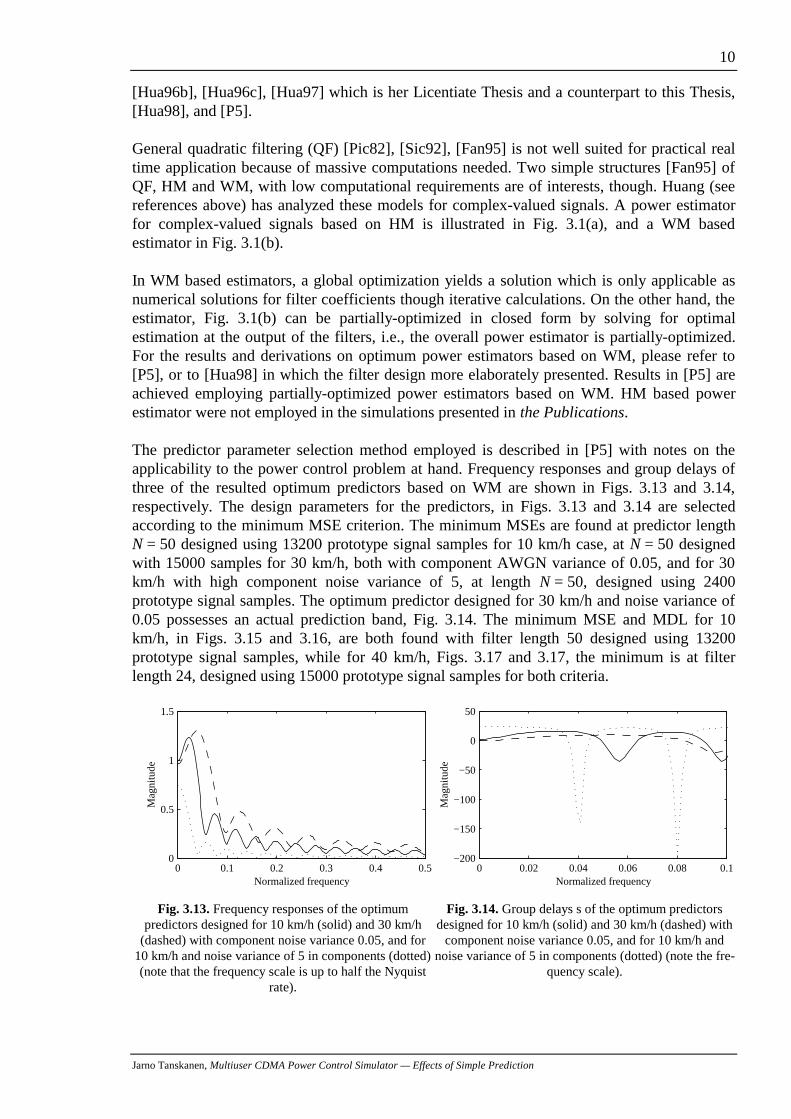
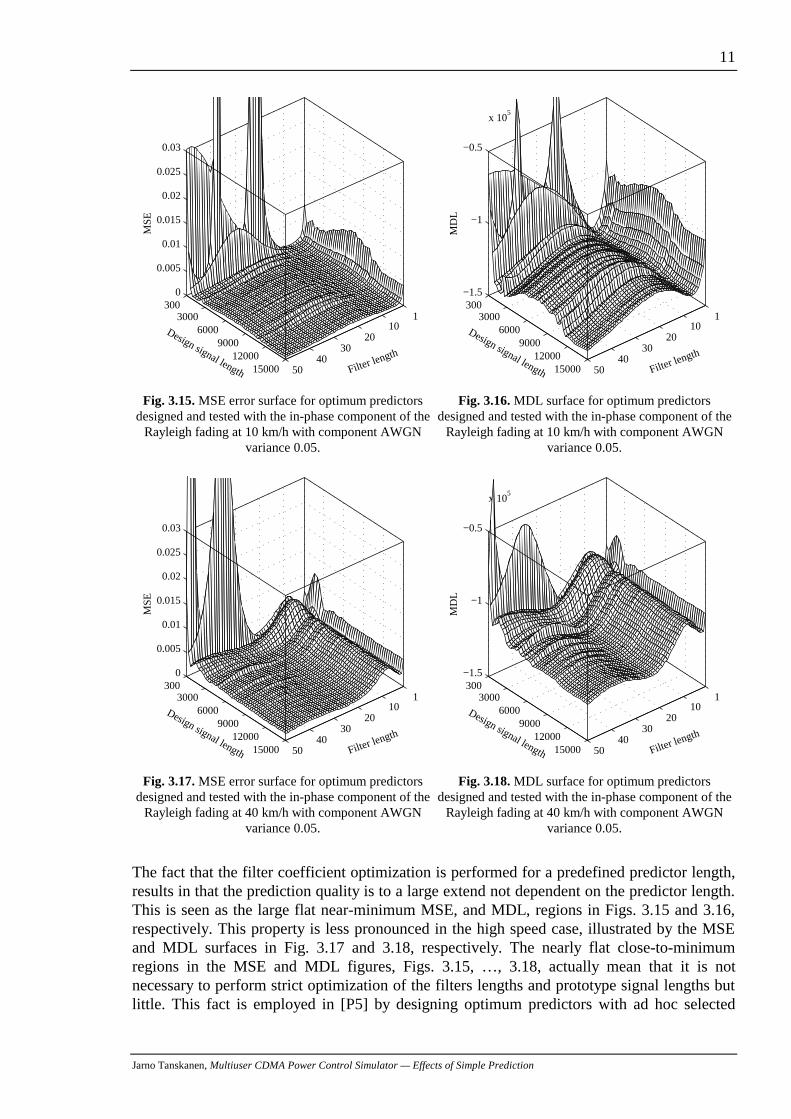
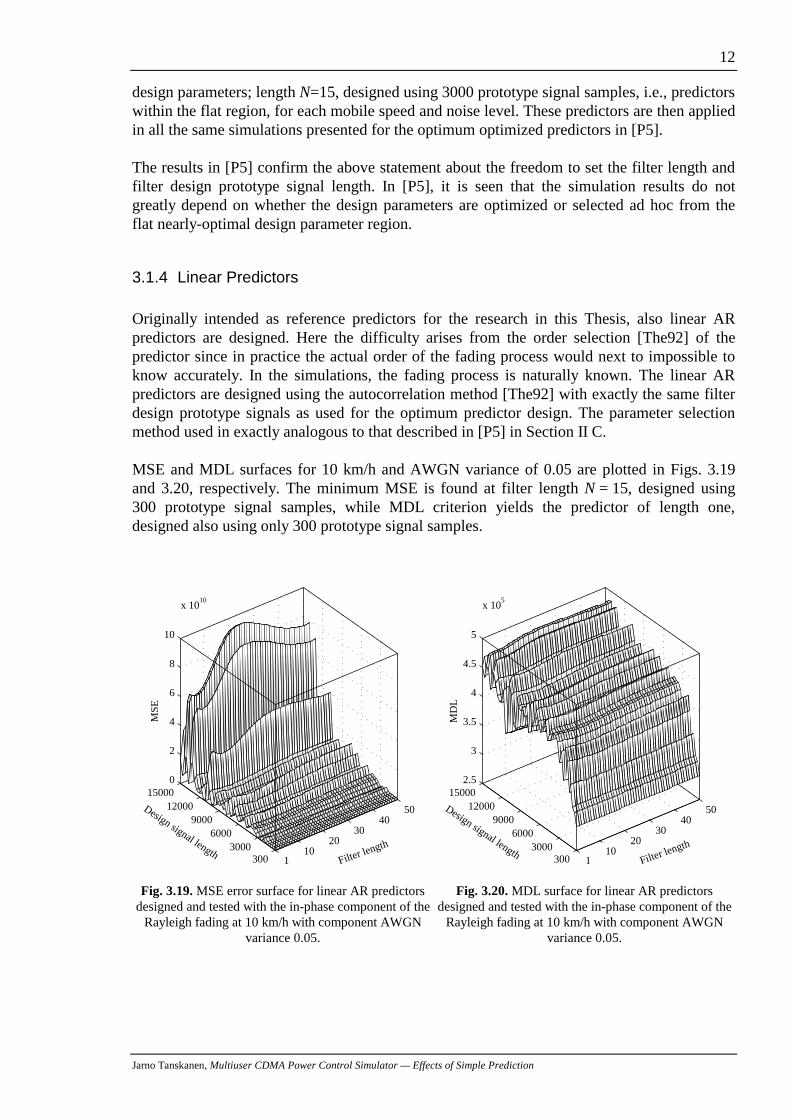
The predictor parameter selection method employed is described in [P5] with notes on theapplicability to the power control problem at hand. Frequency responses and group delays ofthree of the resulted optimum predictors based on WM are shown in Figs. 3.13 and 3.14,respectively. The design parameters for the predictors, in Figs. 3.13 and 3.14 are selectedaccording to the minimum MSE criterion. The minimum MSEs are found at predictor lengthN = 50 designed using 13200 prototype signal samples for 10 km/h case, at N = 50 designedwith 15000 samples for 30 km/h, both with component AWGN variance of 0.05, and for 30km/h with high component noise variance of 5, at length N = 50, designed using 2400prototype signal samples. The optimum predictor designed for 30 km/h and noise variance of0.05 possesses an actual prediction band, Fig. 3.14. The minimum MSE and MDL for 10km/h, in Figs. 3.15 and 3.16, are both found with filter length 50 designed using 13200prototype signal samples, while for 40 km/h, Figs. 3.17 and 3.17, the minimum is at filterlength 24, designed using 15000 prototype signal samples for both criteria.
0 0.1 0.2 0.3 0.4 0.50
0.5
1
1.5
Normalized frequency
Mag
nitu
de
Fig. 3.13. Frequency responses of the optimumpredictors designed for 10 km/h (solid) and 30 km/h
(dashed) with component noise variance 0.05, and for10 km/h and noise variance of 5 in components (dotted)(note that the frequency scale is up to half the Nyquist
rate).
0 0.02 0.04 0.06 0.08 0.1−200
−150
−100
−50
0
50
Normalized frequency
Mag
nitu
de
Fig. 3.14. Group delays s of the optimum predictorsdesigned for 10 km/h (solid) and 30 km/h (dashed) with
component noise variance 0.05, and for 10 km/h andnoise variance of 5 in components (dotted) (note the fre-
quency scale).
Jarno Tanskanen, Multiuser CDMA Power Control Simulator — Effects of Simple Prediction
11
110
2030
4050
300 3000
6000 9000
1200015000
0
0.005
0.01
0.015
0.02
0.025
0.03
Filter length
Design signal length
MS
E
Fig. 3.15. MSE error surface for optimum predictorsdesigned and tested with the in-phase component of the
Rayleigh fading at 10 km/h with component AWGNvariance 0.05.
110
2030
4050
300 3000
6000 9000
1200015000
−1.5
−1
−0.5
x 105
Filter length
Design signal length
MD
L
Fig. 3.16. MDL surface for optimum predictorsdesigned and tested with the in-phase component of the
Rayleigh fading at 10 km/h with component AWGNvariance 0.05.
110
2030
4050
300 3000
6000 9000
1200015000
0
0.005
0.01
0.015
0.02
0.025
0.03
Filter length
Design signal length
MS
E
Fig. 3.17. MSE error surface for optimum predictorsdesigned and tested with the in-phase component of the
Rayleigh fading at 40 km/h with component AWGNvariance 0.05.
110
2030
4050
300 3000
6000 9000
1200015000
−1.5
−1
−0.5
x 105
Filter length
Design signal length
MD
L
Fig. 3.18. MDL surface for optimum predictorsdesigned and tested with the in-phase component of the
Rayleigh fading at 40 km/h with component AWGNvariance 0.05.
The fact that the filter coefficient optimization is performed for a predefined predictor length,results in that the prediction quality is to a large extend not dependent on the predictor length.This is seen as the large flat near-minimum MSE, and MDL, regions in Figs. 3.15 and 3.16,respectively. This property is less pronounced in the high speed case, illustrated by the MSEand MDL surfaces in Fig. 3.17 and 3.18, respectively. The nearly flat close-to-minimumregions in the MSE and MDL figures, Figs. 3.15, …, 3.18, actually mean that it is notnecessary to perform strict optimization of the filters lengths and prototype signal lengths butlittle. This fact is employed in [P5] by designing optimum predictors with ad hoc selected
Jarno Tanskanen, Multiuser CDMA Power Control Simulator — Effects of Simple Prediction
12
design parameters; length N=15, designed using 3000 prototype signal samples, i.e., predictorswithin the flat region, for each mobile speed and noise level. These predictors are then appliedin all the same simulations presented for the optimum optimized predictors in [P5].
The results in [P5] confirm the above statement about the freedom to set the filter length andfilter design prototype signal length. In [P5], it is seen that the simulation results do notgreatly depend on whether the design parameters are optimized or selected ad hoc from theflat nearly-optimal design parameter region.
3.1.4 Linear Predictors
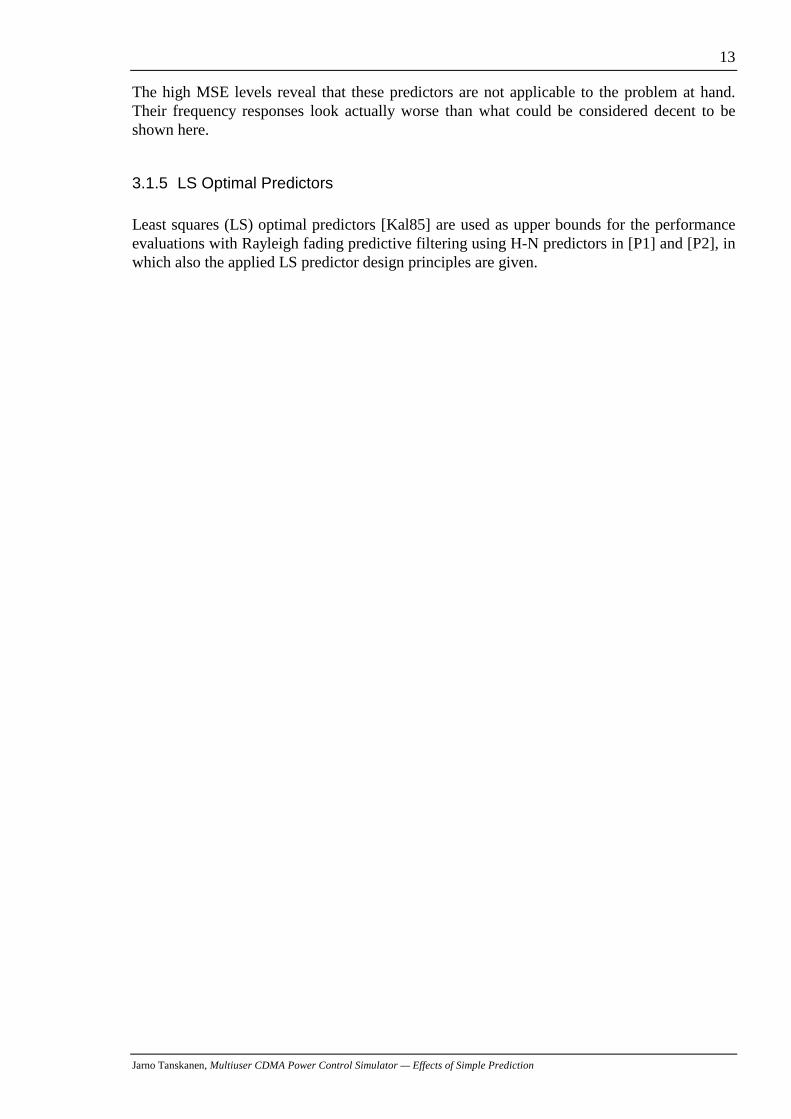
Originally intended as reference predictors for the research in this Thesis, also linear ARpredictors are designed. Here the difficulty arises from the order selection [The92] of thepredictor since in practice the actual order of the fading process would next to impossible toknow accurately. In the simulations, the fading process is naturally known. The linear ARpredictors are designed using the autocorrelation method [The92] with exactly the same filterdesign prototype signals as used for the optimum predictor design. The parameter selectionmethod used in exactly analogous to that described in [P5] in Section II C.
MSE and MDL surfaces for 10 km/h and AWGN variance of 0.05 are plotted in Figs. 3.19and 3.20, respectively. The minimum MSE is found at filter length N = 15, designed using300 prototype signal samples, while MDL criterion yields the predictor of length one,designed also using only 300 prototype signal samples.
110
2030
4050
300 3000
6000 9000
1200015000
0
2
4
6
8
10
x 1010
Filter length
Design signal length
MS
E
Fig. 3.19. MSE error surface for linear AR predictorsdesigned and tested with the in-phase component of the
Rayleigh fading at 10 km/h with component AWGNvariance 0.05.
110
2030
4050
300 3000
6000 9000
1200015000
2.5
3
3.5
4
4.5
5
x 105
Filter length
Design signal length
MD
L
Fig. 3.20. MDL surface for linear AR predictorsdesigned and tested with the in-phase component of the
Rayleigh fading at 10 km/h with component AWGNvariance 0.05.
Jarno Tanskanen, Multiuser CDMA Power Control Simulator — Effects of Simple Prediction
13
The high MSE levels reveal that these predictors are not applicable to the problem at hand.Their frequency responses look actually worse than what could be considered decent to beshown here.
3.1.5 LS Optimal Predictors
Least squares (LS) optimal predictors [Kal85] are used as upper bounds for the performanceevaluations with Rayleigh fading predictive filtering using H-N predictors in [P1] and [P2], inwhich also the applied LS predictor design principles are given.
Jarno Tanskanen, Multiuser CDMA Power Control Simulator — Effects of Simple Prediction
14
4. Closed Loop Power Control Simulator
This chapter describes the latest and final version of the multiuser communications simulatorsconstructed in COSSAP environment, and used to calculate the results in [P5]. In this chapter,mobile transmitter, radio channel, base station receiver, and power controller models, andtheir COSSAP implementations, are described in depth, also commenting on someimplementation aspects arousing from COSSAP itselfr. Partially similar system modelconcepts than simulated in this Thesis, are also described in [Cav97].
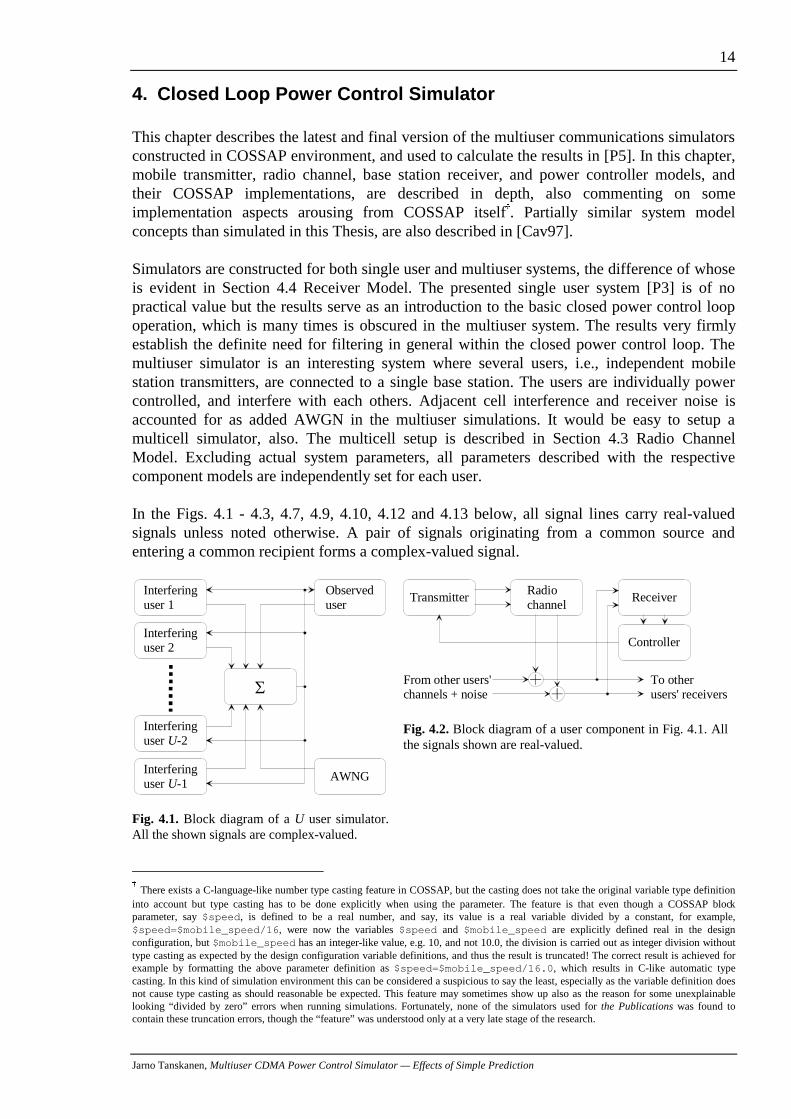
Simulators are constructed for both single user and multiuser systems, the difference of whoseis evident in Section 4.4 Receiver Model. The presented single user system [P3] is of nopractical value but the results serve as an introduction to the basic closed power control loopoperation, which is many times is obscured in the multiuser system. The results very firmlyestablish the definite need for filtering in general within the closed power control loop. Themultiuser simulator is an interesting system where several users, i.e., independent mobilestation transmitters, are connected to a single base station. The users are individually powercontrolled, and interfere with each others. Adjacent cell interference and receiver noise isaccounted for as added AWGN in the multiuser simulations. It would be easy to setup amulticell simulator, also. The multicell setup is described in Section 4.3 Radio ChannelModel. Excluding actual system parameters, all parameters described with the respectivecomponent models are independently set for each user.
In the Figs. 4.1 - 4.3, 4.7, 4.9, 4.10, 4.12 and 4.13 below, all signal lines carry real-valuedsignals unless noted otherwise. A pair of signals originating from a common source andentering a common recipient forms a complex-valued signal.
Interferinguser 1
6
AWNG
Observeduser
Interferinguser U-1
Interferinguser U-2
Interferinguser 2
Fig. 4.1. Block diagram of a U user simulator.All the shown signals are complex-valued.
Transmitter ReceiverRadiochannel
From other users'channels + noise
To otherusers' receivers
Controller
Fig. 4.2. Block diagram of a user component in Fig. 4.1. Allthe signals shown are real-valued.
r There exists a C-language-like number type casting feature in COSSAP, but the casting does not take the original variable type definitioninto account but type casting has to be done explicitly when using the parameter. The feature is that even though a COSSAP blockparameter, say $speed , is defined to be a real number, and say, its value is a real variable divided by a constant, for example,$speed=$mobile_speed/16 , were now the variables $speed and $mobile_speed are explicitly defined real in the designconfiguration, but $mobile_speed has an integer-like value, e.g. 10, and not 10.0, the division is carried out as integer division withouttype casting as expected by the design configuration variable definitions, and thus the result is truncated! The correct result is achieved forexample by formatting the above parameter definition as $speed=$mobile_speed/16.0 , which results in C-like automatic typecasting. In this kind of simulation environment this can be considered a suspicious to say the least, especially as the variable definition doesnot cause type casting as should reasonable be expected. This feature may sometimes show up also as the reason for some unexplainablelooking “divided by zero” errors when running simulations. Fortunately, none of the simulators used for the Publications was found tocontain these truncation errors, though the “feature” was understood only at a very late stage of the research.
Jarno Tanskanen, Multiuser CDMA Power Control Simulator — Effects of Simple Prediction
15
The overall picture of the multiuser simulator is shown in Fig. 4.1. Each user, Fig. 4.2, has itsown independent transmitter, radio channel, receiver and controller components. A usertransmits through his own radio channel to a common base station whose antenna sums thetransmissions arriving from all the users along with some receiver noise and adjacent cellinterference (the additive white Gaussian noise (AWGN) block in Fig. 4.1). The total noisyreceived signal is fed to each receiver, Fig. 4.2. In the multiuser simulators, after userdetection, the receiver outputs the signal to the controller which makes power controldecisions and sends power control command bits to the mobile transmitter accordingly.
In [P4] the chip rate is the same as in the Qualcomm system [Qua92] even though the numberof chips per bit used is 127 while Qualcomm uses 128 bits per chip, whereas in [P5], the bitrate is set to 9600 bits/s, as with the Qualcomm system, resulting in a lower chip rate, whilestill using 127 chips per bit. Also, different seeds used in the random number generators forRayleigh fading and AWGN generator have a little effect on the results, and thus the actualmultiuser simulations give better results concerning H-N predictors in [P4] as compared to thecorresponding results in [P5].
4.1 Uplink waveform
The CDMA link waveform actually used in the Qualcomm CDMA system [Qua92] isnaturally somewhat more complicated than that employed in the simulations presented in thisThesis. Let us here shortly review the uplink waveform presented in [Qua92]. In that system,spreading is achieved using short pseudo noise (PN) codes of length 32768, generated withlinear shift registers. The spreading code chip rate 1.2288 MHz provides for the chip rate of128 chips per bit with data rate 9600 bits/s. Different mobile users are in turn distinguished atthe base station receivers by the timing offset of a long PN sequence of length 242-1. Still, thedata to be transmitted determines one of the 64 orthogonal Walsh functions which istransmitted combined with the short and long PN codes. In a multiuser CDMA systemsimulated in [P3], [P4] and [P5], users are detected according to the spreading codes which inthe simulators are PN sequences of length 127 produced by linear shift registers. With the bitrate of 9600 bits/s, this results in the spreading rate of 1.2192 MHz employed in [P5]. In [P3]and [P4], the employed chip rate is 1.2288 MHz, and thus the bit rate is approximately 9675bits/s.
Basis of the user detection in the presented simulators is the orthogonality of the codes, i.e.,the crosscorrelations of different users’ PN code sequences should be equal to zero. In thesimulators described in this Thesis, interuser interference is introduced by generating the PNspreading codes of lengths 127 with shift registers with user specific initializations, since thischoice for the spreading codes does not yield orthogonal codes but the correlation matrix, withthe autocorrelations on the diagonal, is given by
XCorr
� �
�
�
� �
ª
¬
««««
º
¼
»»»»
127 1 1
1 127
1
1 1 127
�
� �
� � �
�
. (4.1)
Jarno Tanskanen, Multiuser CDMA Power Control Simulator — Effects of Simple Prediction
16
In the literature, several different spreading code schemes are proposed for CDMA multipleaccess communications, for example [Vaj95], [Ban96], and [Lin97].
4.2 Transmitter Model
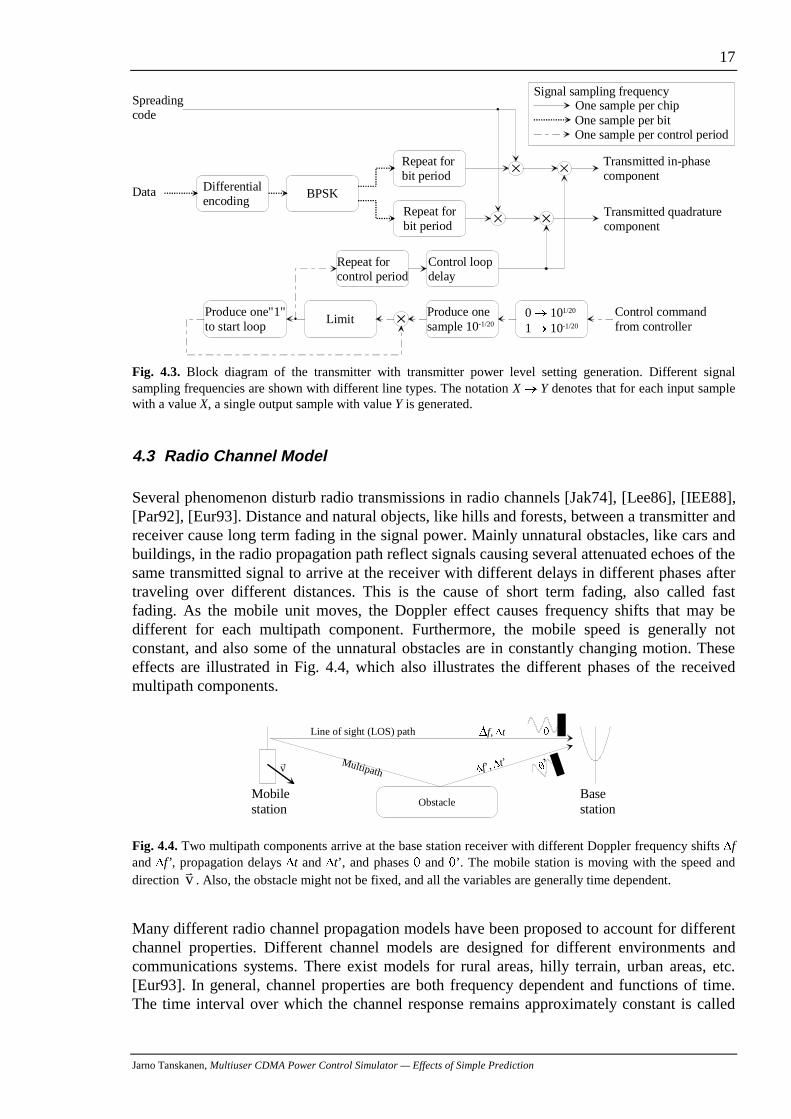
Block diagram of the mobile transmitter module, including also the transmission level settinglogic, is shown in Fig. 4.3. The data to be transmitted is differentially encoded, and binaryphase shift keying (BPSK) is applied [Jak74], [Car86]. Somewhat similar transmitter andreceiver constructions as used in this Thesis are presented in [Cav97]. After BPSK, eachBPSK block output sample is repeated for the number of chips per bit times. The samplingrate after the “Repeat for bit period” block is thus equal to chip rate. Next, the signal is spreadby multiplying it with a user specific spreading code consisting of “-1”s and “1”s. Finally,transmission level is set by multiplying the signal by a power control multiplier. In thebeginning of the simulation, the block “Control loop delay” produces d samples with the value10-1/20, corresponding to the smallest possible transmission level. Subsequent transmissionlevel settings are thus delayed by d chip periods. The total control loop delay d is realized herein order for it to effectively by the delay of the application of the power control action withrespect to the channel fading. The delay d is set individually for each user, and accounts for allthe loop delays, i.e., mobile and base station processing delays, and both uplink and downlinkpropagation delays. Also, in the beginning, a single sample with the value 10-1/20 is producedin the block “Produce on sample 10-1/20“ which is multiplied by one generated by the “Produceone “1” to start loop” block, thus generating the first transmission level setting to be used inthe transmission, which is repeated the number of chips per control period times to generateone sample for each transmitted chip. The transmission is thus always started using the lowesttransmission power level. The production of the single samples in the beginning is necessaryas COSSAP is a stream driven simulator, i.e., processing is done when all the necessary inputsamples are available. This means that getting the multiplicative transmission power levelsetting generation loop running, and also to start the overall closed power control loop, thedescribed producing of the single samples within the loop is necessary. This also sets specificrequirements for the placement of the control loop delay block. As it is the control actiondelay that is to be investigated, the delay has to be placed respective to the faded signalreceived at the base station. A COSSAP delay block generally operates so that N samples witha given value are generated before the input signal is passed through. These N samples aregenerated regardless of whether there are samples available in the input or not; this samplegeneration function is the property that actually makes it possible to get a simulator with aclosed loop to run at all in a stream driven simulator like COSSAP. Placing the total loopdelay block as shown in Fig. 4.3, when the simulation is started there is no power controlaction for the first d chip durations, and the control actions taken later are actually done basedon the channel fading characteristics d chip durations in the past as desired. After the first dchip durations, for the first actual control period the transmitter power is kept at the minimum,and thereafter altered r1 dB [Qua92] according to power control command bits received forthe controller in the base station. The r1 dB transmission level change step implies that thenext transmission level setting is always generated from the last one by multiplying that with101/20 or 10-1/20, respectively. A single power control bit is received in the beginning of everypower control period. The “Limit” block sets the dynamic range of the power control to r15dB from the nominal 0 dB. For the equations concerning the transmitter setup, please, cf. [P3],[P4]. In Fig. 4.3, also the different signal sampling frequencies are shown with different linetypes. Having three different sampling frequencies within the simulator also requires extracare for correct signal timings within the stream driven simulator.
Jarno Tanskanen, Multiuser CDMA Power Control Simulator — Effects of Simple Prediction
17
One sample per chipOne sample per bitOne sample per control period
Signal sampling frequency
BPSK
Repeat for bit period
Repeat forbit period
Spreadingcode
0 o 101/20
1 o 10-1/20
Differentialencoding
Data
Control commandfrom controller
Produce onesample 10-1/20Limit
Produce one"1"to start loop
Control loop delay
Repeat forcontrol period
Transmitted quadrature component
Transmitted in-phase component
Fig. 4.3. Block diagram of the transmitter with transmitter power level setting generation. Different signalsampling frequencies are shown with different line types. The notation X o Y denotes that for each input samplewith a value X, a single output sample with value Y is generated.
4.3 Radio Channel Model
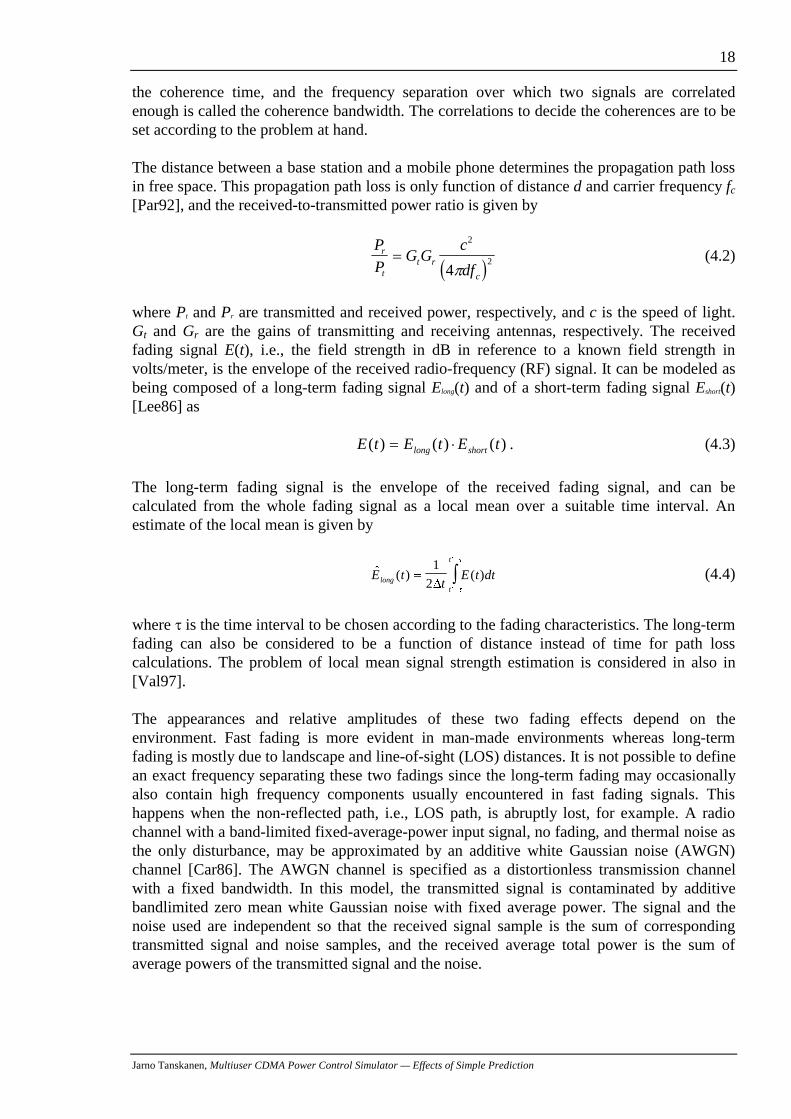
Several phenomenon disturb radio transmissions in radio channels [Jak74], [Lee86], [IEE88],[Par92], [Eur93]. Distance and natural objects, like hills and forests, between a transmitter andreceiver cause long term fading in the signal power. Mainly unnatural obstacles, like cars andbuildings, in the radio propagation path reflect signals causing several attenuated echoes of thesame transmitted signal to arrive at the receiver with different delays in different phases aftertraveling over different distances. This is the cause of short term fading, also called fastfading. As the mobile unit moves, the Doppler effect causes frequency shifts that may bedifferent for each multipath component. Furthermore, the mobile speed is generally notconstant, and also some of the unnatural obstacles are in constantly changing motion. Theseeffects are illustrated in Fig. 4.4, which also illustrates the different phases of the receivedmultipath components.
Mobilestation
Base station
Line of sight (LOS) path
v
Obstacle
'f, 't
Multipath 'f’, 't’ T’
T
Fig. 4.4. Two multipath components arrive at the base station receiver with different Doppler frequency shifts 'fand 'f’ , propagation delays 't and 't’, and phases T and T’. The mobile station is moving with the speed anddirection
&v . Also, the obstacle might not be fixed, and all the variables are generally time dependent.
Many different radio channel propagation models have been proposed to account for differentchannel properties. Different channel models are designed for different environments andcommunications systems. There exist models for rural areas, hilly terrain, urban areas, etc.[Eur93]. In general, channel properties are both frequency dependent and functions of time.The time interval over which the channel response remains approximately constant is called
Jarno Tanskanen, Multiuser CDMA Power Control Simulator — Effects of Simple Prediction
18
the coherence time, and the frequency separation over which two signals are correlatedenough is called the coherence bandwidth. The correlations to decide the coherences are to beset according to the problem at hand.
The distance between a base station and a mobile phone determines the propagation path lossin free space. This propagation path loss is only function of distance d and carrier frequency fc[Par92], and the received-to-transmitted power ratio is given by
� �P
PG G
c
dfr
tt r
c
2
24S
(4.2)
where Pt and Pr are transmitted and received power, respectively, and c is the speed of light.Gt and Gr are the gains of transmitting and receiving antennas, respectively. The receivedfading signal E(t), i.e., the field strength in dB in reference to a known field strength involts/meter, is the envelope of the received radio-frequency (RF) signal. It can be modeled asbeing composed of a long-term fading signal Elong(t) and of a short-term fading signal Eshort(t)[Lee86] as
E t E t E tlong short( ) ( ) ( ) � . (4.3)
The long-term fading signal is the envelope of the received fading signal, and can becalculated from the whole fading signal as a local mean over a suitable time interval. Anestimate of the local mean is given by
� ( ) ( )E tt
E t dtlongt
t
c�
c�
³1
2'W
W
(4.4)
where W is the time interval to be chosen according to the fading characteristics. The long-termfading can also be considered to be a function of distance instead of time for path losscalculations. The problem of local mean signal strength estimation is considered in also in[Val97].
The appearances and relative amplitudes of these two fading effects depend on theenvironment. Fast fading is more evident in man-made environments whereas long-termfading is mostly due to landscape and line-of-sight (LOS) distances. It is not possible to definean exact frequency separating these two fadings since the long-term fading may occasionallyalso contain high frequency components usually encountered in fast fading signals. Thishappens when the non-reflected path, i.e., LOS path, is abruptly lost, for example. A radiochannel with a band-limited fixed-average-power input signal, no fading, and thermal noise asthe only disturbance, may be approximated by an additive white Gaussian noise (AWGN)channel [Car86]. The AWGN channel is specified as a distortionless transmission channelwith a fixed bandwidth. In this model, the transmitted signal is contaminated by additivebandlimited zero mean white Gaussian noise with fixed average power. The signal and thenoise used are independent so that the received signal sample is the sum of correspondingtransmitted signal and noise samples, and the received average total power is the sum ofaverage powers of the transmitted signal and the noise.
Jarno Tanskanen, Multiuser CDMA Power Control Simulator — Effects of Simple Prediction
19
In most real environments a radio signal propagates from transmitter to receiver via manydifferent paths, as mentioned earlier. Naturally, situations with one dominating path arepossible. Different paths are caused by environmental reflectors, for example by buildings andvehicles. This multipath phenomenon causes a variety of difficulties: different paths exhibitdifferent attenuation, the length of each path is different causing several copies of thetransmitted signal to be received after different time delays with different phases and thevelocity of the mobile unit to the direction of different paths is different causing eachmultipath component to experience different Doppler shift. When the receiving antenna sumsthese dispersed copies of the signal, the signal is understandably severely mutilated. Ingeneral, all these effects are time and frequency dependent, i.e., time- and frequency-selective,respectively.
Multipath propagation causes fast fading, which is also called Rayleigh fading. Assuming thatthe received signal consists of a large number of components with random phases, theprobability density function of the signal envelope follows Rayleigh distribution that is givenby
� �p AA
e x
xi
i Ai
t
�
®°
°̄
�
V
V
222 2
0
0 0
,
,(4.5)
with the mean power V 2 and short-term signal power Ai2 2 . Considering the signal
wavelength of, for example, about 30 cm at 1 GHz, and comparing that with changes in pathlengths when the transmitter is in a moving car, it can clearly be understood that the phases ofthe copies of the signal arriving through different paths are rapidly changing and can thus beconsidered random with even distribution.
In a stationary transmission setup, i.e., when neither the receiver nor the transmitter is movingand their environment is constant, the received signal is a sum of delayed copies of thetransmitted signal, with a different attenuation associated with each path, given by
� � � �8 t A y t ti ii
R
�
�
¦ '0
1
(4.6)
where 8(t) is the output of the whole channel at time t, � �y t ti� ' is the copy of the signal
arriving through the ith path with delay 'ti , Ai is the attenuation associated with the ith pathand R is the total number of paths. If the system is not stationary, amplitude coefficients,delays and the number of paths may be time varying. Even if the system is completelystationary the copies of the signal reach the receiver in different phases according to thelengths of the paths. Given the length difference of two paths as � �'l t , the phase difference isgiven by
� � � �' 'T S Ot l t 2 (4.7)
where O is the wavelength. In addition, if the mobile unit is in motion the transmittedfrequency suffers from a Doppler shift
� �'f t v t( ) cos D O (4.8)
Jarno Tanskanen, Multiuser CDMA Power Control Simulator — Effects of Simple Prediction
20
where v is the speed of the mobile unit and � �D t is the angle between the direction of themobile speed and the transmitted wave. From (4.8) it can be seen that the maximum increasein frequency is encountered while the mobile is moving directly towards the base station andthe maximum decrease while moving straight away from the base station. In (4.7) and (4.8)the original transmitted frequency and the speed of the mobile are considered constant, but inpractice they may be time dependent as well.
Including all these effects and considering R resolvable multipath components, eachcomposed of M waves with possibly different delays 'tnm arriving at the receiver with equalDoppler shifts fDn , the received signal can be modeled as [Jak74]
� � � �E t E A f t f t f tnm c Dn c nmm
M
n
R
Z , cos � �
¦¦011
' . (4.9)
Differing delays cause phase distortion f tc nm' of the signal. The original transmittedfrequency is fc, and E0 is the amplitude of the transmitted signal. Coefficients Anm reflectdifferent signal power attenuation associated with each wave. In all practical cases eachparameter in (4.9) is, at least in principle, time dependent. Effects of multipath on CDMAcellular communications are analyzed in [JaH94] and [Cha94], and estimation of propagationdelays 't is considered in [Str96].
Naturally, the channel simulator should produce as realistic power responses as possible.Minimum model input parameters are the mobile speed and carrier frequency, or the inputsignal envelope, or the actual transmitted waveform. It would also be of interest that themodel could produce different channel responses according to the environment type, likeurban area, given as an input. Predictors could also be designed using real measurement databut the resulting predictor would probably be too environment specific with no capabilities tofunction under a wider range of conditions but only in the conditions close to those of themeasurements used.
In this work, the channel model employed is a single Rayleigh fading propagation pathcontaminated by additive white Gaussian noise (AWGN), and it is presented in the base-band.Now in (4.9) R = 1, and A0 is Rayleigh distributed with AWGN added independently to thequadrature components. The AWGN presents receiver noise. The assumption on Rayleighdistributed received signal power is valid on a narrow-band communications systems, but notgenerally in CDMA systems. A CDMA the radio channel model consisting of a singleRayleigh fader would be overly pessimistic since because of the wide transmission band thefading cannot be considered frequency flat, i.e., the fading is frequency depended. Thus, somepower is always available at some portion of the wide transmission band. A RAKE receiver[Pri58] is capable of distinguishing between different paths with sufficient delay separation.Implicitly including a good enough RAKE receiver within the radio channel model results in asingle Rayleigh fader channel model to be seen through a single RAKE finger. Within thework presented here, RAKEs are not explicitly employed because the intention is to clearlysee the effects of applied predictive filtering, and multipath combining, even though it wouldgive better BER results in the simulation, would very probably obscure the results at least tosome extent. Also, employing RAKEs would also mean employing actual multipath radiochannel models into the simulations. But, as mentioned, the single Rayleigh fader channelmodel assumption can be considered to implicitly include a RAKE receiver. Performance of
Jarno Tanskanen, Multiuser CDMA Power Control Simulator — Effects of Simple Prediction
21
RAKE receivers with random spreading sequences is analyzed by Cheun in [Che97], and adecision-directed SS RAKE is presented in [Pov96].
4.3.1 Jakes’ Rayleigh Fader
In [P2] the Jakes’ Rayleigh approximation [Jak74] is employed. In the Jakes’ Rayleigh faderthe Rayleigh distributed signal is approximated by sums of appropriately chosen sinusoidswhose frequencies correspond to the Doppler shift frequencies [Jak74]. Jakes’ Rayleighfading model is further improved in [Den93].
4.3.2 Noise Shaping Rayleigh Fader
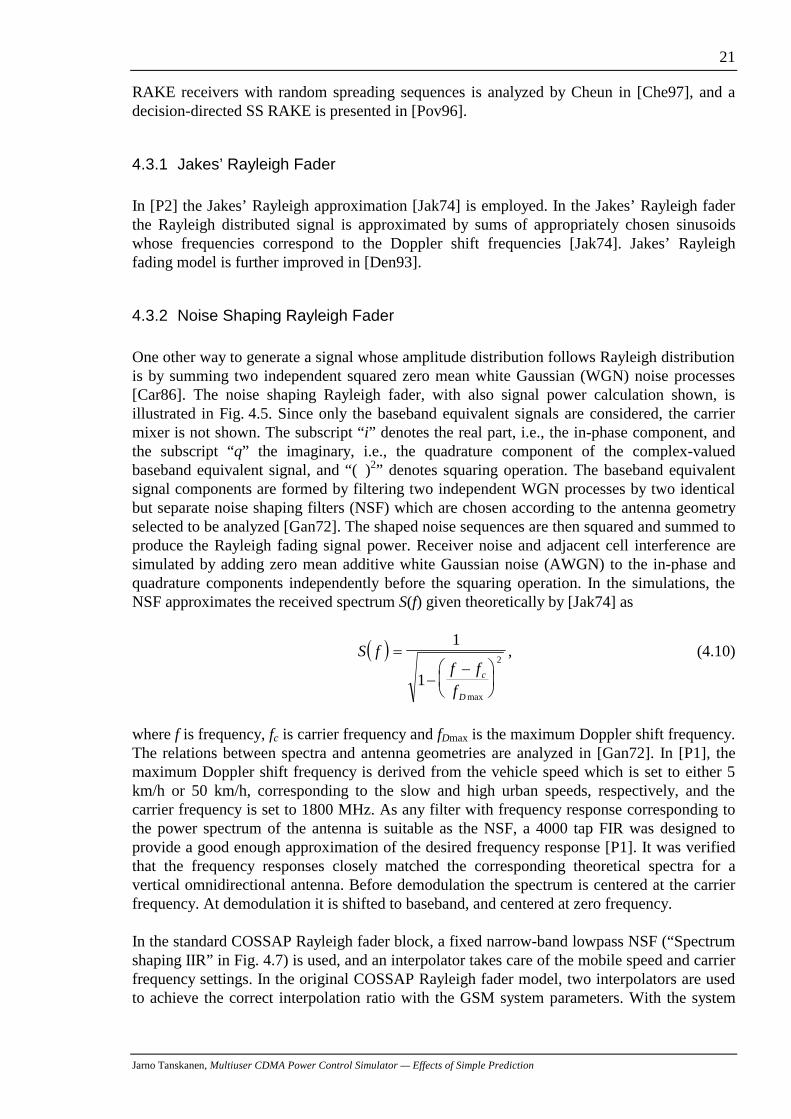
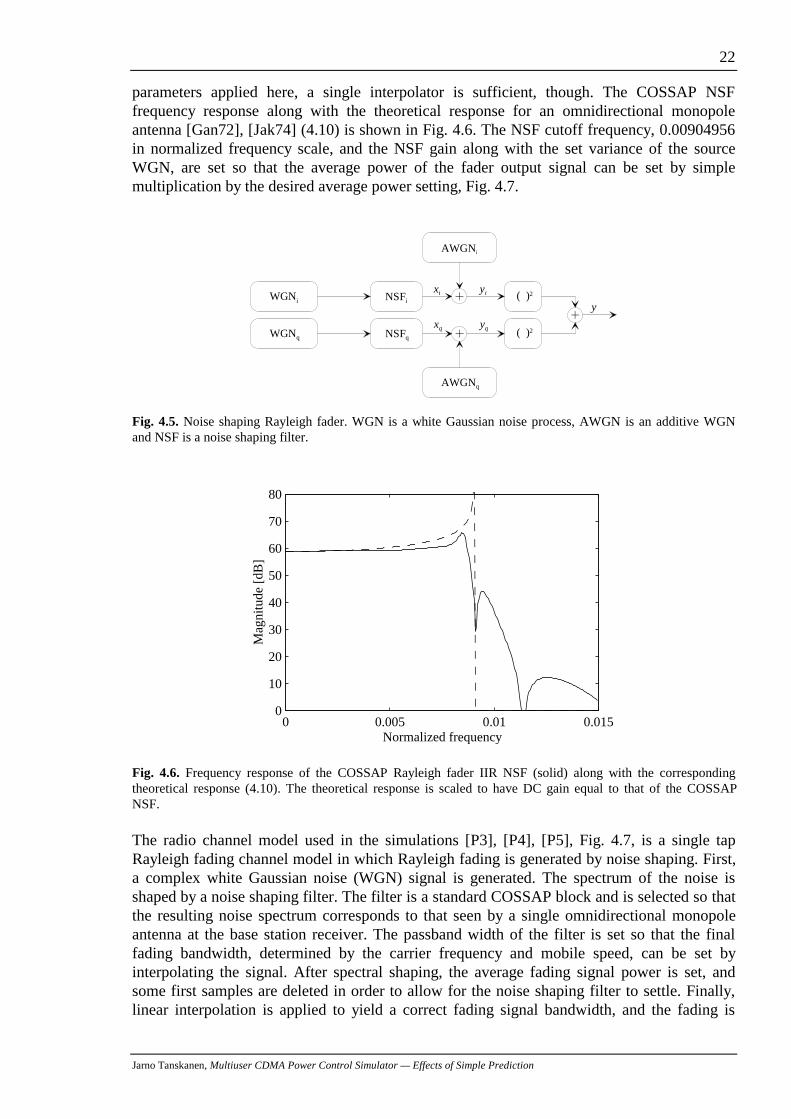
One other way to generate a signal whose amplitude distribution follows Rayleigh distributionis by summing two independent squared zero mean white Gaussian (WGN) noise processes[Car86]. The noise shaping Rayleigh fader, with also signal power calculation shown, isillustrated in Fig. 4.5. Since only the baseband equivalent signals are considered, the carriermixer is not shown. The subscript “i” denotes the real part, i.e., the in-phase component, andthe subscript “q” the imaginary, i.e., the quadrature component of the complex-valuedbaseband equivalent signal, and “( )2” denotes squaring operation. The baseband equivalentsignal components are formed by filtering two independent WGN processes by two identicalbut separate noise shaping filters (NSF) which are chosen according to the antenna geometryselected to be analyzed [Gan72]. The shaped noise sequences are then squared and summed toproduce the Rayleigh fading signal power. Receiver noise and adjacent cell interference aresimulated by adding zero mean additive white Gaussian noise (AWGN) to the in-phase andquadrature components independently before the squaring operation. In the simulations, theNSF approximates the received spectrum S(f) given theoretically by [Jak74] as
� �S ff f
fc
D
��§
©¨
·
¹¸
1
1
2
max
, (4.10)
where f is frequency, fc is carrier frequency and fDmax is the maximum Doppler shift frequency.The relations between spectra and antenna geometries are analyzed in [Gan72]. In [P1], themaximum Doppler shift frequency is derived from the vehicle speed which is set to either 5km/h or 50 km/h, corresponding to the slow and high urban speeds, respectively, and thecarrier frequency is set to 1800 MHz. As any filter with frequency response corresponding tothe power spectrum of the antenna is suitable as the NSF, a 4000 tap FIR was designed toprovide a good enough approximation of the desired frequency response [P1]. It was verifiedthat the frequency responses closely matched the corresponding theoretical spectra for avertical omnidirectional antenna. Before demodulation the spectrum is centered at the carrierfrequency. At demodulation it is shifted to baseband, and centered at zero frequency.
In the standard COSSAP Rayleigh fader block, a fixed narrow-band lowpass NSF (“Spectrumshaping IIR” in Fig. 4.7) is used, and an interpolator takes care of the mobile speed and carrierfrequency settings. In the original COSSAP Rayleigh fader model, two interpolators are usedto achieve the correct interpolation ratio with the GSM system parameters. With the system
Jarno Tanskanen, Multiuser CDMA Power Control Simulator — Effects of Simple Prediction
22
parameters applied here, a single interpolator is sufficient, though. The COSSAP NSFfrequency response along with the theoretical response for an omnidirectional monopoleantenna [Gan72], [Jak74] (4.10) is shown in Fig. 4.6. The NSF cutoff frequency, 0.00904956in normalized frequency scale, and the NSF gain along with the set variance of the sourceWGN, are set so that the average power of the fader output signal can be set by simplemultiplication by the desired average power setting, Fig. 4.7.
WGNi
WGNq
AWGNq
AWGNi
NSFq
NSFi
( )2
( )2y
yq
yixi
xq
Fig. 4.5. Noise shaping Rayleigh fader. WGN is a white Gaussian noise process, AWGN is an additive WGNand NSF is a noise shaping filter.
0 0.005 0.01 0.0150
10
20
30
40
50
60
70
80
Normalized frequency
Mag
nitu
de [d
B]
Fig. 4.6. Frequency response of the COSSAP Rayleigh fader IIR NSF (solid) along with the correspondingtheoretical response (4.10). The theoretical response is scaled to have DC gain equal to that of the COSSAPNSF.
The radio channel model used in the simulations [P3], [P4], [P5], Fig. 4.7, is a single tapRayleigh fading channel model in which Rayleigh fading is generated by noise shaping. First,a complex white Gaussian noise (WGN) signal is generated. The spectrum of the noise isshaped by a noise shaping filter. The filter is a standard COSSAP block and is selected so thatthe resulting noise spectrum corresponds to that seen by a single omnidirectional monopoleantenna at the base station receiver. The passband width of the filter is set so that the finalfading bandwidth, determined by the carrier frequency and mobile speed, can be set byinterpolating the signal. After spectral shaping, the average fading signal power is set, andsome first samples are deleted in order to allow for the noise shaping filter to settle. Finally,linear interpolation is applied to yield a correct fading signal bandwidth, and the fading is
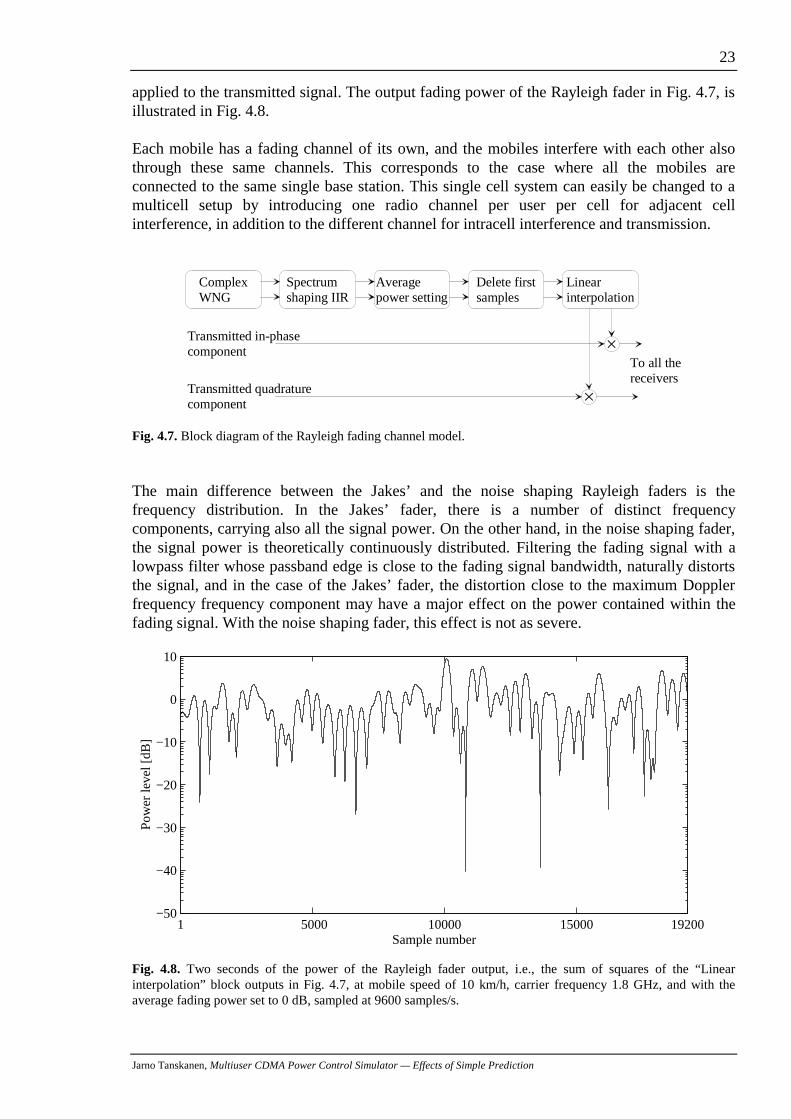
Jarno Tanskanen, Multiuser CDMA Power Control Simulator — Effects of Simple Prediction
23
applied to the transmitted signal. The output fading power of the Rayleigh fader in Fig. 4.7, isillustrated in Fig. 4.8.
Each mobile has a fading channel of its own, and the mobiles interfere with each other alsothrough these same channels. This corresponds to the case where all the mobiles areconnected to the same single base station. This single cell system can easily be changed to amulticell setup by introducing one radio channel per user per cell for adjacent cellinterference, in addition to the different channel for intracell interference and transmission.
Transmitted quadraturecomponent
ComplexWNG
Spectrumshaping IIR
Averagepower setting
Transmitted in-phasecomponent
Delete firstsamples
Linearinterpolation
To all thereceivers
Fig. 4.7. Block diagram of the Rayleigh fading channel model.
The main difference between the Jakes’ and the noise shaping Rayleigh faders is thefrequency distribution. In the Jakes’ fader, there is a number of distinct frequencycomponents, carrying also all the signal power. On the other hand, in the noise shaping fader,the signal power is theoretically continuously distributed. Filtering the fading signal with alowpass filter whose passband edge is close to the fading signal bandwidth, naturally distortsthe signal, and in the case of the Jakes’ fader, the distortion close to the maximum Dopplerfrequency frequency component may have a major effect on the power contained within thefading signal. With the noise shaping fader, this effect is not as severe.
1 5000 10000 15000 19200−50
−40
−30
−20
−10
0
10
Sample number
Pow
er le
vel [
dB]
Fig. 4.8. Two seconds of the power of the Rayleigh fader output, i.e., the sum of squares of the “Linearinterpolation” block outputs in Fig. 4.7, at mobile speed of 10 km/h, carrier frequency 1.8 GHz, and with theaverage fading power set to 0 dB, sampled at 9600 samples/s.
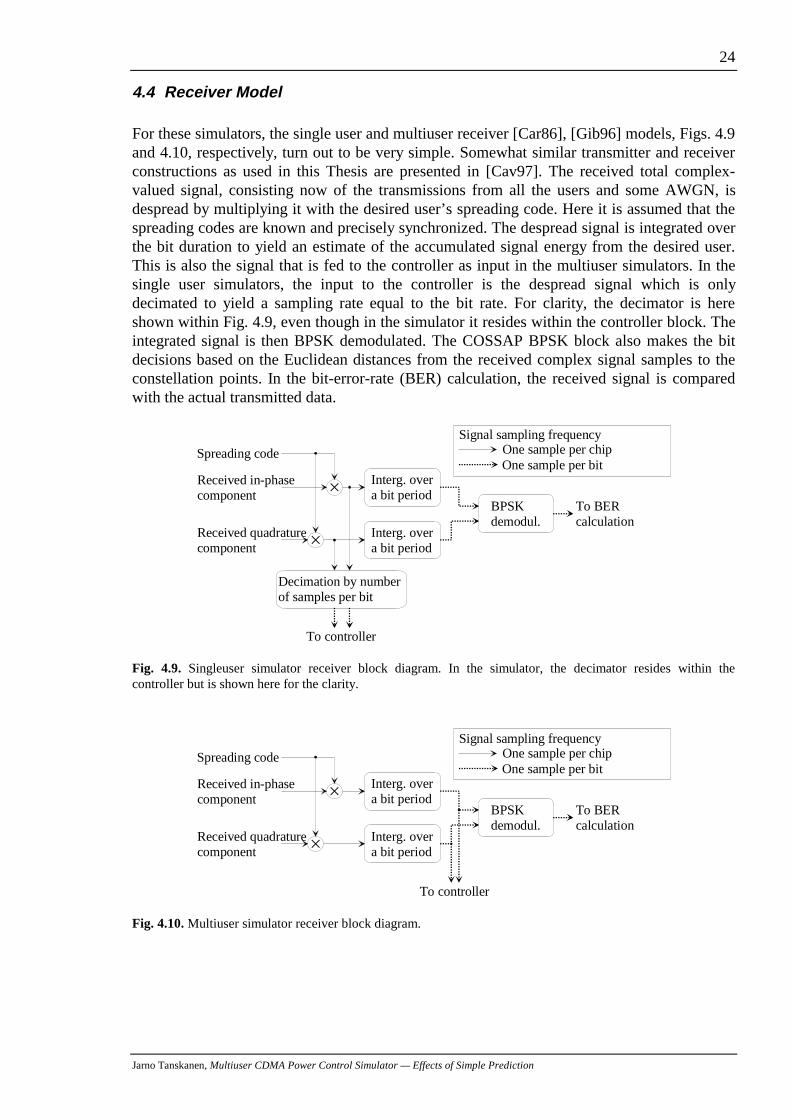
Jarno Tanskanen, Multiuser CDMA Power Control Simulator — Effects of Simple Prediction
24
4.4 Receiver Model
For these simulators, the single user and multiuser receiver [Car86], [Gib96] models, Figs. 4.9and 4.10, respectively, turn out to be very simple. Somewhat similar transmitter and receiverconstructions as used in this Thesis are presented in [Cav97]. The received total complex-valued signal, consisting now of the transmissions from all the users and some AWGN, isdespread by multiplying it with the desired user’s spreading code. Here it is assumed that thespreading codes are known and precisely synchronized. The despread signal is integrated overthe bit duration to yield an estimate of the accumulated signal energy from the desired user.This is also the signal that is fed to the controller as input in the multiuser simulators. In thesingle user simulators, the input to the controller is the despread signal which is onlydecimated to yield a sampling rate equal to the bit rate. For clarity, the decimator is hereshown within Fig. 4.9, even though in the simulator it resides within the controller block. Theintegrated signal is then BPSK demodulated. The COSSAP BPSK block also makes the bitdecisions based on the Euclidean distances from the received complex signal samples to theconstellation points. In the bit-error-rate (BER) calculation, the received signal is comparedwith the actual transmitted data.
BPSKdemodul.
Interg. overa bit period
Interg. overa bit period
Spreading code
Received quadraturecomponent
Received in-phasecomponent
To controller
To BER calculation
One sample per chipOne sample per bit
Signal sampling frequency
Decimation by number of samples per bit
Fig. 4.9. Singleuser simulator receiver block diagram. In the simulator, the decimator resides within thecontroller but is shown here for the clarity.
BPSKdemodul.
Interg. overa bit period
Interg. overa bit period
Spreading code
Received quadraturecomponent
Received in-phasecomponent
To controller
To BER calculation
One sample per chipOne sample per bit
Signal sampling frequency
Fig. 4.10. Multiuser simulator receiver block diagram.
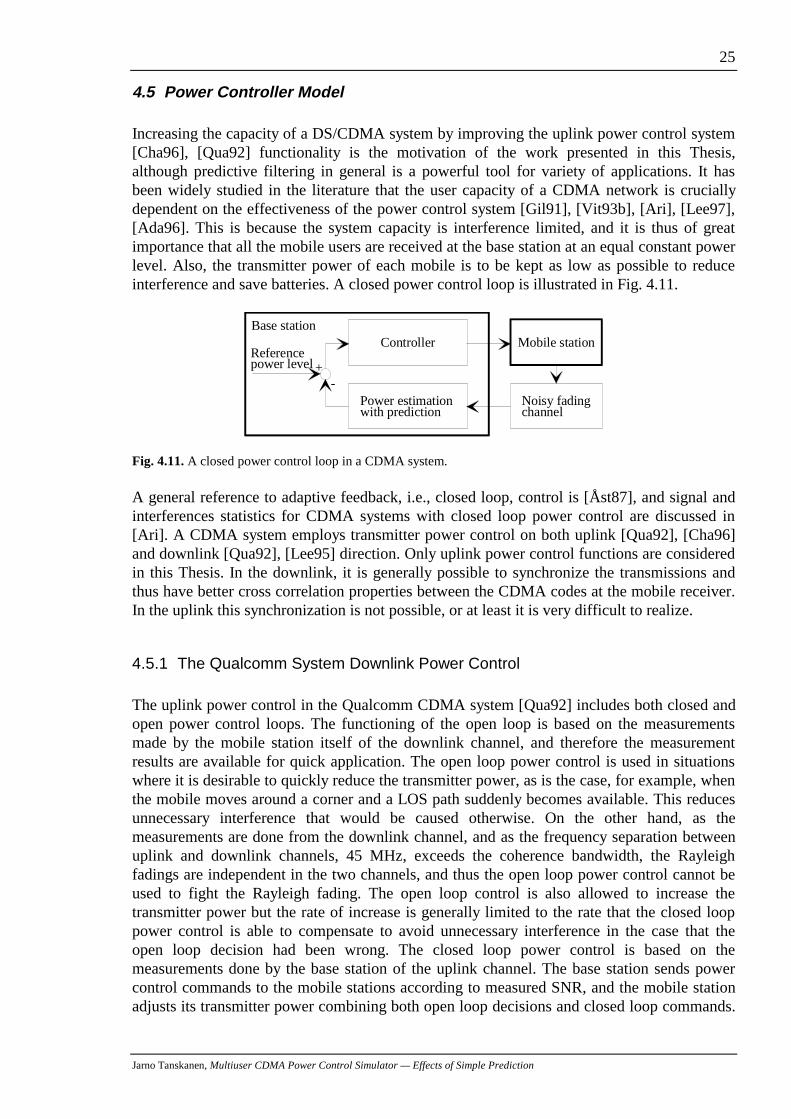
Jarno Tanskanen, Multiuser CDMA Power Control Simulator — Effects of Simple Prediction
25
4.5 Power Controller Model
Increasing the capacity of a DS/CDMA system by improving the uplink power control system[Cha96], [Qua92] functionality is the motivation of the work presented in this Thesis,although predictive filtering in general is a powerful tool for variety of applications. It hasbeen widely studied in the literature that the user capacity of a CDMA network is cruciallydependent on the effectiveness of the power control system [Gil91], [Vit93b], [Ari], [Lee97],[Ada96]. This is because the system capacity is interference limited, and it is thus of greatimportance that all the mobile users are received at the base station at an equal constant powerlevel. Also, the transmitter power of each mobile is to be kept as low as possible to reduceinterference and save batteries. A closed power control loop is illustrated in Fig. 4.11.
Power estimation with prediction
Referencepower level
-+
Controller
Noisy fadingchannel
Mobile stationBase station
Fig. 4.11. A closed power control loop in a CDMA system.
A general reference to adaptive feedback, i.e., closed loop, control is [Åst87], and signal andinterferences statistics for CDMA systems with closed loop power control are discussed in[Ari]. A CDMA system employs transmitter power control on both uplink [Qua92], [Cha96]and downlink [Qua92], [Lee95] direction. Only uplink power control functions are consideredin this Thesis. In the downlink, it is generally possible to synchronize the transmissions andthus have better cross correlation properties between the CDMA codes at the mobile receiver.In the uplink this synchronization is not possible, or at least it is very difficult to realize.
4.5.1 The Qualcomm System Downlink Power Control
The uplink power control in the Qualcomm CDMA system [Qua92] includes both closed andopen power control loops. The functioning of the open loop is based on the measurementsmade by the mobile station itself of the downlink channel, and therefore the measurementresults are available for quick application. The open loop power control is used in situationswhere it is desirable to quickly reduce the transmitter power, as is the case, for example, whenthe mobile moves around a corner and a LOS path suddenly becomes available. This reducesunnecessary interference that would be caused otherwise. On the other hand, as themeasurements are done from the downlink channel, and as the frequency separation betweenuplink and downlink channels, 45 MHz, exceeds the coherence bandwidth, the Rayleighfadings are independent in the two channels, and thus the open loop power control cannot beused to fight the Rayleigh fading. The open loop control is also allowed to increase thetransmitter power but the rate of increase is generally limited to the rate that the closed looppower control is able to compensate to avoid unnecessary interference in the case that theopen loop decision had been wrong. The closed loop power control is based on themeasurements done by the base station of the uplink channel. The base station sends powercontrol commands to the mobile stations according to measured SNR, and the mobile stationadjusts its transmitter power combining both open loop decisions and closed loop commands.
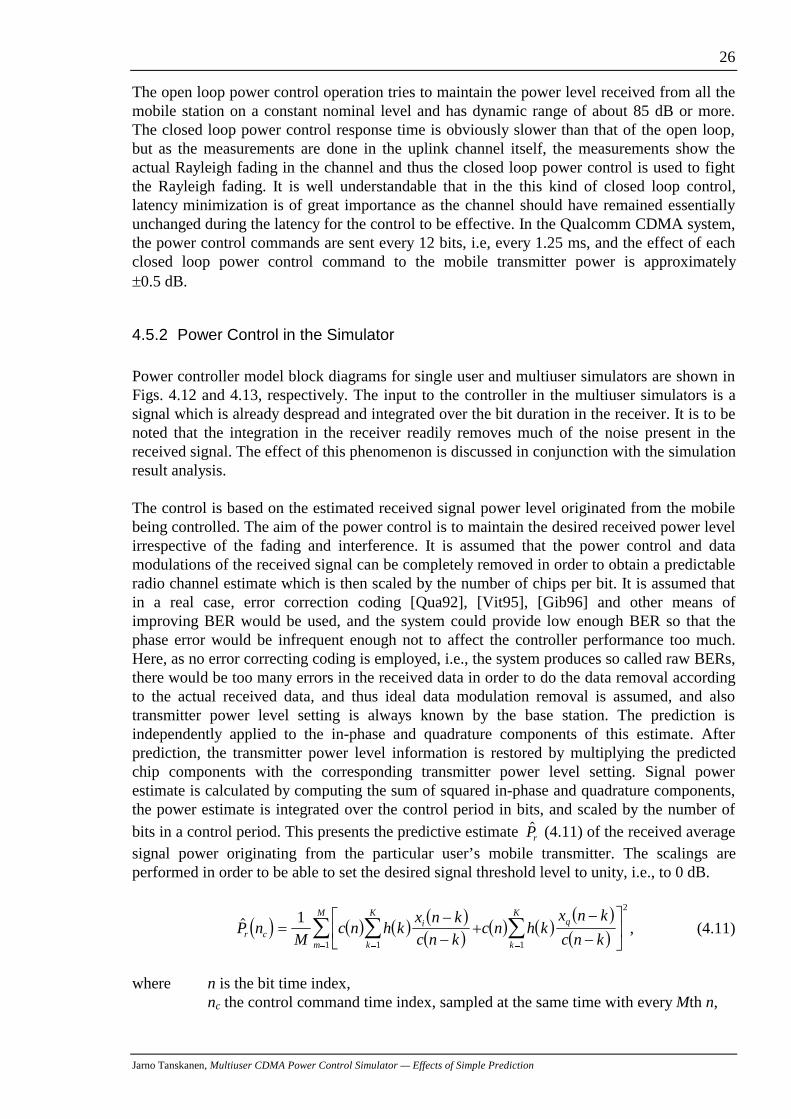
Jarno Tanskanen, Multiuser CDMA Power Control Simulator — Effects of Simple Prediction
26
The open loop power control operation tries to maintain the power level received from all themobile station on a constant nominal level and has dynamic range of about 85 dB or more.The closed loop power control response time is obviously slower than that of the open loop,but as the measurements are done in the uplink channel itself, the measurements show theactual Rayleigh fading in the channel and thus the closed loop power control is used to fightthe Rayleigh fading. It is well understandable that in the this kind of closed loop control,latency minimization is of great importance as the channel should have remained essentiallyunchanged during the latency for the control to be effective. In the Qualcomm CDMA system,the power control commands are sent every 12 bits, i.e, every 1.25 ms, and the effect of eachclosed loop power control command to the mobile transmitter power is approximatelyr0.5 dB.
4.5.2 Power Control in the Simulator
Power controller model block diagrams for single user and multiuser simulators are shown inFigs. 4.12 and 4.13, respectively. The input to the controller in the multiuser simulators is asignal which is already despread and integrated over the bit duration in the receiver. It is to benoted that the integration in the receiver readily removes much of the noise present in thereceived signal. The effect of this phenomenon is discussed in conjunction with the simulationresult analysis.
The control is based on the estimated received signal power level originated from the mobilebeing controlled. The aim of the power control is to maintain the desired received power levelirrespective of the fading and interference. It is assumed that the power control and datamodulations of the received signal can be completely removed in order to obtain a predictableradio channel estimate which is then scaled by the number of chips per bit. It is assumed thatin a real case, error correction coding [Qua92], [Vit95], [Gib96] and other means ofimproving BER would be used, and the system could provide low enough BER so that thephase error would be infrequent enough not to affect the controller performance too much.Here, as no error correcting coding is employed, i.e., the system produces so called raw BERs,there would be too many errors in the received data in order to do the data removal accordingto the actual received data, and thus ideal data modulation removal is assumed, and alsotransmitter power level setting is always known by the base station. The prediction isindependently applied to the in-phase and quadrature components of this estimate. Afterprediction, the transmitter power level information is restored by multiplying the predictedchip components with the corresponding transmitter power level setting. Signal powerestimate is calculated by computing the sum of squared in-phase and quadrature components,the power estimate is integrated over the control period in bits, and scaled by the number of
bits in a control period. This presents the predictive estimate �Pr (4.11) of the received averagesignal power originating from the particular user’s mobile transmitter. The scalings areperformed in order to be able to set the desired signal threshold level to unity, i.e., to 0 dB.
� � � � � �� �
� �� � � �
� �
� ��P n
Mc n h k
x n k
c n kc n h k
x n k
c n kr ci
k
K
m
Mq
k
K
�
��
ª
¬«
�
�
º
¼»
¦¦ ¦1
11 1
2
, (4.11)
where n is the bit time index,nc the control command time index, sampled at the same time with every Mth n,
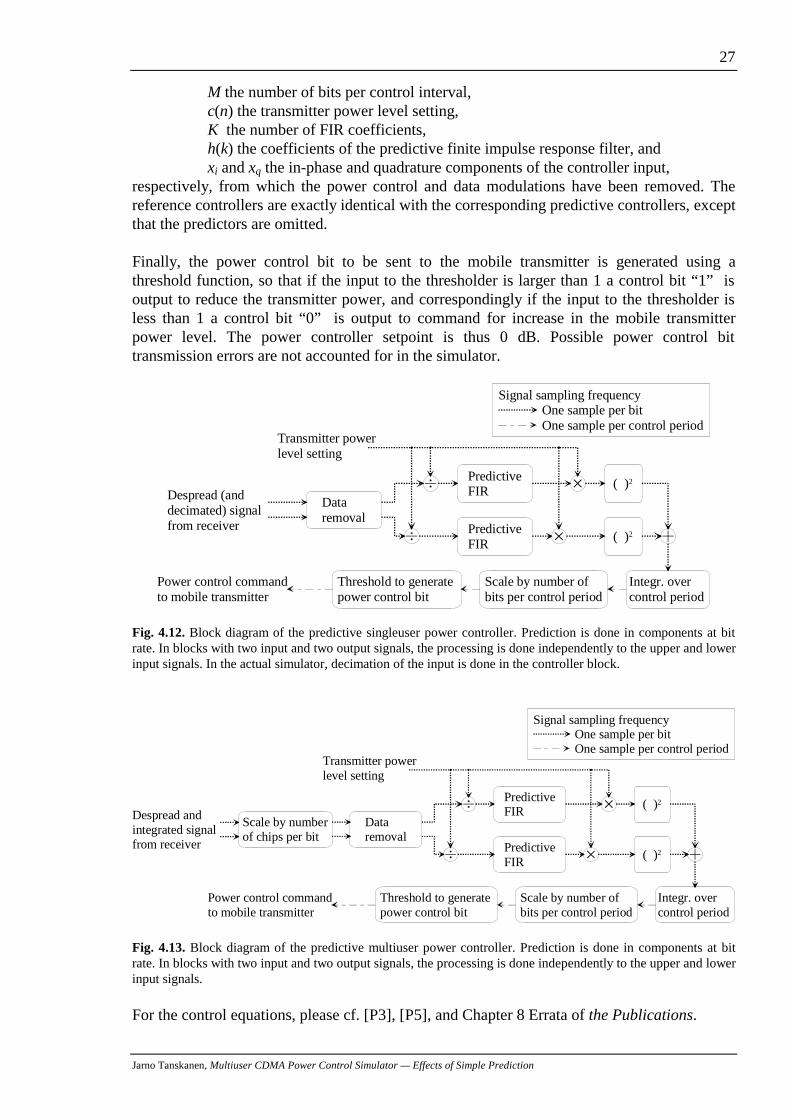
Jarno Tanskanen, Multiuser CDMA Power Control Simulator — Effects of Simple Prediction
27
M the number of bits per control interval,c(n) the transmitter power level setting,K the number of FIR coefficients,h(k) the coefficients of the predictive finite impulse response filter, andxi and xq the in-phase and quadrature components of the controller input,
respectively, from which the power control and data modulations have been removed. Thereference controllers are exactly identical with the corresponding predictive controllers, exceptthat the predictors are omitted.
Finally, the power control bit to be sent to the mobile transmitter is generated using athreshold function, so that if the input to the thresholder is larger than 1 a control bit “1” isoutput to reduce the transmitter power, and correspondingly if the input to the thresholder isless than 1 a control bit “0” is output to command for increase in the mobile transmitterpower level. The power controller setpoint is thus 0 dB. Possible power control bittransmission errors are not accounted for in the simulator.
Data removal
PredictiveFIR
PredictiveFIR
( )2
( )2
Integr. over control period
Transmitter powerlevel setting
Scale by number of bits per control period
Threshold to generate power control bit
Power control command to mobile transmitter
Despread (and decimated) signal from receiver
One sample per bitOne sample per control period
Signal sampling frequency
Fig. 4.12. Block diagram of the predictive singleuser power controller. Prediction is done in components at bitrate. In blocks with two input and two output signals, the processing is done independently to the upper and lowerinput signals. In the actual simulator, decimation of the input is done in the controller block.
Data removal
PredictiveFIR
PredictiveFIR
Scale by numberof chips per bit
( )2
( )2
Integr. over control period
Transmitter powerlevel setting
Scale by number of bits per control period
Threshold to generate power control bit
Power control command to mobile transmitter
Despread and integrated signal from receiver
One sample per bitOne sample per control period
Signal sampling frequency
Fig. 4.13. Block diagram of the predictive multiuser power controller. Prediction is done in components at bitrate. In blocks with two input and two output signals, the processing is done independently to the upper and lowerinput signals.
For the control equations, please cf. [P3], [P5], and Chapter 8 Errata of the Publications.
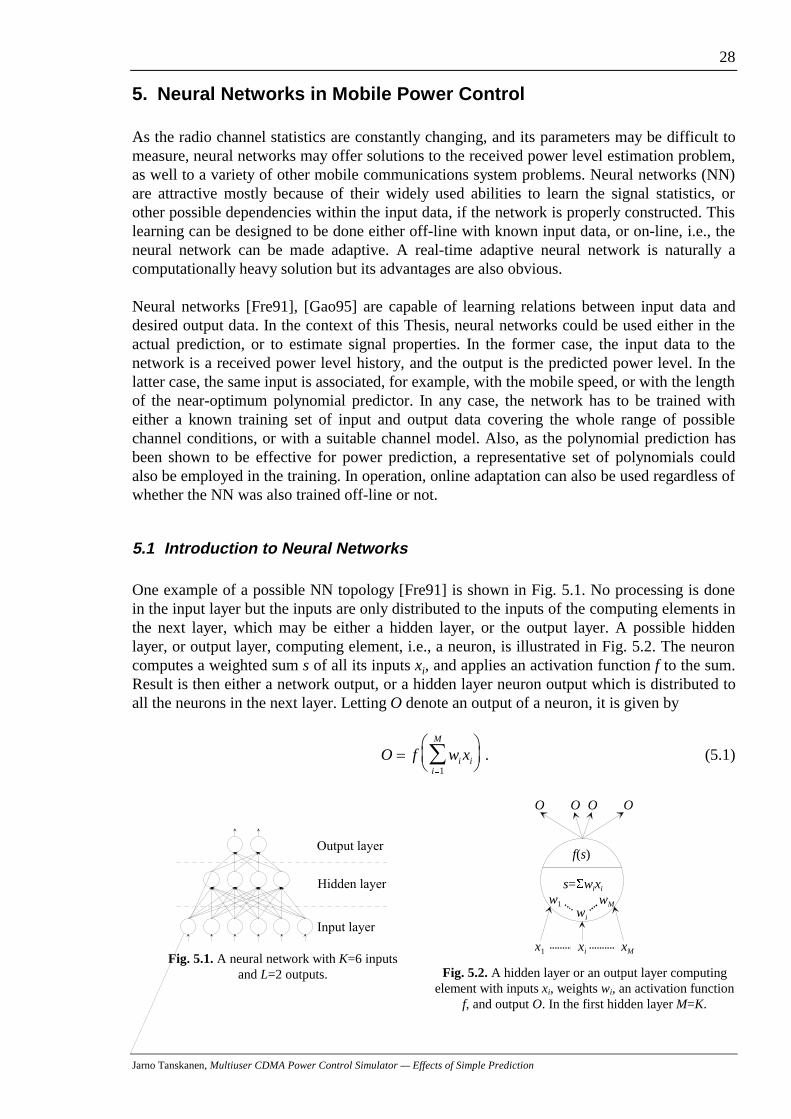
Jarno Tanskanen, Multiuser CDMA Power Control Simulator — Effects of Simple Prediction
28
5. Neural Networks in Mobile Power Control
As the radio channel statistics are constantly changing, and its parameters may be difficult tomeasure, neural networks may offer solutions to the received power level estimation problem,as well to a variety of other mobile communications system problems. Neural networks (NN)are attractive mostly because of their widely used abilities to learn the signal statistics, orother possible dependencies within the input data, if the network is properly constructed. Thislearning can be designed to be done either off-line with known input data, or on-line, i.e., theneural network can be made adaptive. A real-time adaptive neural network is naturally acomputationally heavy solution but its advantages are also obvious.
Neural networks [Fre91], [Gao95] are capable of learning relations between input data anddesired output data. In the context of this Thesis, neural networks could be used either in theactual prediction, or to estimate signal properties. In the former case, the input data to thenetwork is a received power level history, and the output is the predicted power level. In thelatter case, the same input is associated, for example, with the mobile speed, or with the lengthof the near-optimum polynomial predictor. In any case, the network has to be trained witheither a known training set of input and output data covering the whole range of possiblechannel conditions, or with a suitable channel model. Also, as the polynomial prediction hasbeen shown to be effective for power prediction, a representative set of polynomials couldalso be employed in the training. In operation, online adaptation can also be used regardless ofwhether the NN was also trained off-line or not.
5.1 Introduction to Neural Networks
One example of a possible NN topology [Fre91] is shown in Fig. 5.1. No processing is donein the input layer but the inputs are only distributed to the inputs of the computing elements inthe next layer, which may be either a hidden layer, or the output layer. A possible hiddenlayer, or output layer, computing element, i.e., a neuron, is illustrated in Fig. 5.2. The neuroncomputes a weighted sum s of all its inputs xi, and applies an activation function f to the sum.Result is then either a network output, or a hidden layer neuron output which is distributed toall the neurons in the next layer. Letting O denote an output of a neuron, it is given by
O f w xi ii
M
§
©¨
·
¹¸
¦1
. (5.1)
Output layer
Hidden layer
Input layer
Fig. 5.1. A neural network with K=6 inputsand L=2 outputs.
f(s)
wi
wMw1
xMxix1
O OOO
s=6wixi
Fig. 5.2. A hidden layer or an output layer computingelement with inputs xi, weights wi, an activation function
f, and output O. In the first hidden layer M=K.
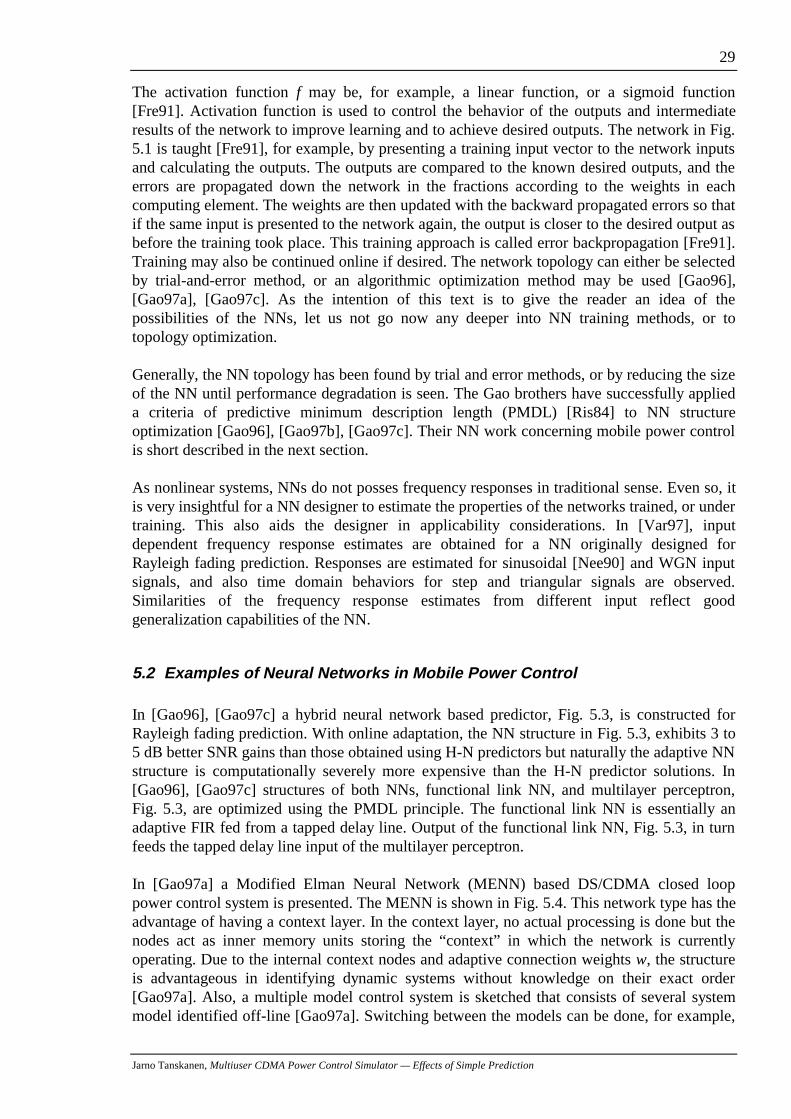
Jarno Tanskanen, Multiuser CDMA Power Control Simulator — Effects of Simple Prediction
29
The activation function f may be, for example, a linear function, or a sigmoid function[Fre91]. Activation function is used to control the behavior of the outputs and intermediateresults of the network to improve learning and to achieve desired outputs. The network in Fig.5.1 is taught [Fre91], for example, by presenting a training input vector to the network inputsand calculating the outputs. The outputs are compared to the known desired outputs, and theerrors are propagated down the network in the fractions according to the weights in eachcomputing element. The weights are then updated with the backward propagated errors so thatif the same input is presented to the network again, the output is closer to the desired output asbefore the training took place. This training approach is called error backpropagation [Fre91].Training may also be continued online if desired. The network topology can either be selectedby trial-and-error method, or an algorithmic optimization method may be used [Gao96],[Gao97a], [Gao97c]. As the intention of this text is to give the reader an idea of thepossibilities of the NNs, let us not go now any deeper into NN training methods, or totopology optimization.
Generally, the NN topology has been found by trial and error methods, or by reducing the sizeof the NN until performance degradation is seen. The Gao brothers have successfully applieda criteria of predictive minimum description length (PMDL) [Ris84] to NN structureoptimization [Gao96], [Gao97b], [Gao97c]. Their NN work concerning mobile power controlis short described in the next section.
As nonlinear systems, NNs do not posses frequency responses in traditional sense. Even so, itis very insightful for a NN designer to estimate the properties of the networks trained, or undertraining. This also aids the designer in applicability considerations. In [Var97], inputdependent frequency response estimates are obtained for a NN originally designed forRayleigh fading prediction. Responses are estimated for sinusoidal [Nee90] and WGN inputsignals, and also time domain behaviors for step and triangular signals are observed.Similarities of the frequency response estimates from different input reflect goodgeneralization capabilities of the NN.
5.2 Examples of Neural Networks in Mobile Power Control
In [Gao96], [Gao97c] a hybrid neural network based predictor, Fig. 5.3, is constructed forRayleigh fading prediction. With online adaptation, the NN structure in Fig. 5.3, exhibits 3 to5 dB better SNR gains than those obtained using H-N predictors but naturally the adaptive NNstructure is computationally severely more expensive than the H-N predictor solutions. In[Gao96], [Gao97c] structures of both NNs, functional link NN, and multilayer perceptron,Fig. 5.3, are optimized using the PMDL principle. The functional link NN is essentially anadaptive FIR fed from a tapped delay line. Output of the functional link NN, Fig. 5.3, in turnfeeds the tapped delay line input of the multilayer perceptron.
In [Gao97a] a Modified Elman Neural Network (MENN) based DS/CDMA closed looppower control system is presented. The MENN is shown in Fig. 5.4. This network type has theadvantage of having a context layer. In the context layer, no actual processing is done but thenodes act as inner memory units storing the “context” in which the network is currentlyoperating. Due to the internal context nodes and adaptive connection weights w, the structureis advantageous in identifying dynamic systems without knowledge on their exact order[Gao97a]. Also, a multiple model control system is sketched that consists of several systemmodel identified off-line [Gao97a]. Switching between the models can be done, for example,
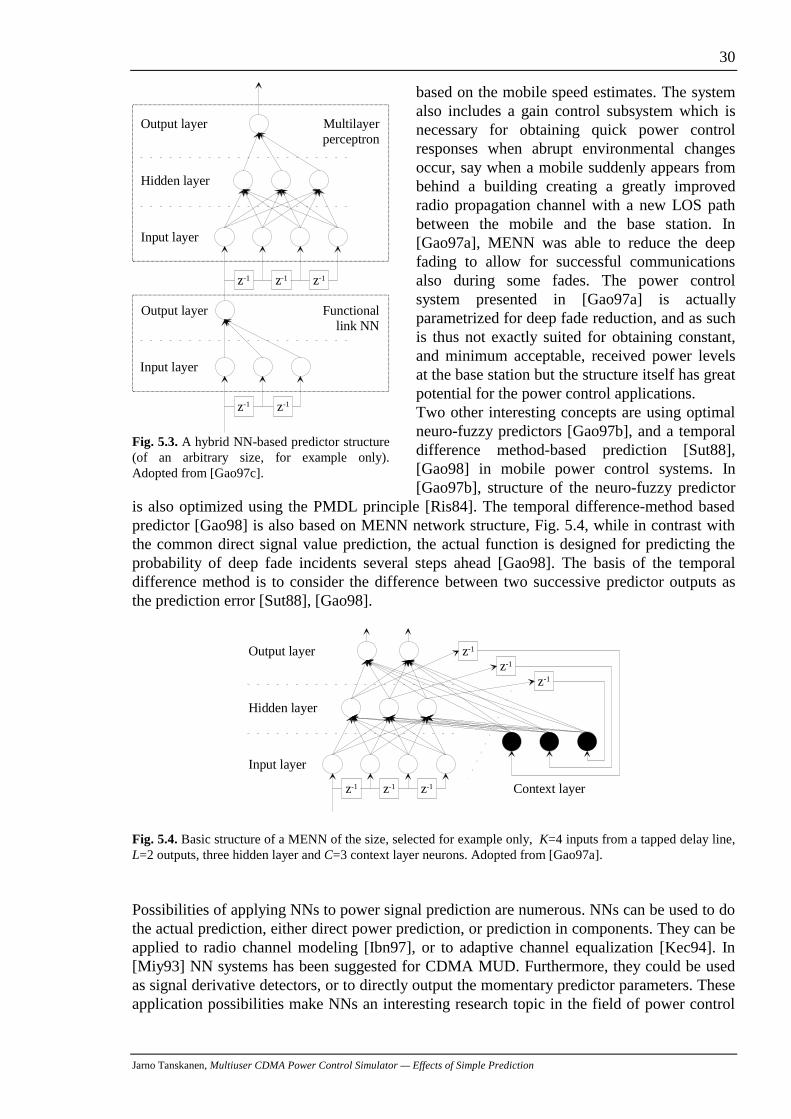
Jarno Tanskanen, Multiuser CDMA Power Control Simulator — Effects of Simple Prediction
30
based on the mobile speed estimates. The systemalso includes a gain control subsystem which isnecessary for obtaining quick power controlresponses when abrupt environmental changesoccur, say when a mobile suddenly appears frombehind a building creating a greatly improvedradio propagation channel with a new LOS pathbetween the mobile and the base station. In[Gao97a], MENN was able to reduce the deepfading to allow for successful communicationsalso during some fades. The power controlsystem presented in [Gao97a] is actuallyparametrized for deep fade reduction, and as suchis thus not exactly suited for obtaining constant,and minimum acceptable, received power levelsat the base station but the structure itself has greatpotential for the power control applications.Two other interesting concepts are using optimalneuro-fuzzy predictors [Gao97b], and a temporaldifference method-based prediction [Sut88],[Gao98] in mobile power control systems. In[Gao97b], structure of the neuro-fuzzy predictor
is also optimized using the PMDL principle [Ris84]. The temporal difference-method basedpredictor [Gao98] is also based on MENN network structure, Fig. 5.4, while in contrast withthe common direct signal value prediction, the actual function is designed for predicting theprobability of deep fade incidents several steps ahead [Gao98]. The basis of the temporaldifference method is to consider the difference between two successive predictor outputs asthe prediction error [Sut88], [Gao98].
Input layer
Hidden layer
Output layer
z-1
z-1
z-1
z-1z-1z-1 Context layer
Fig. 5.4. Basic structure of a MENN of the size, selected for example only, K=4 inputs from a tapped delay line,L=2 outputs, three hidden layer and C=3 context layer neurons. Adopted from [Gao97a].
Possibilities of applying NNs to power signal prediction are numerous. NNs can be used to dothe actual prediction, either direct power prediction, or prediction in components. They can beapplied to radio channel modeling [Ibn97], or to adaptive channel equalization [Kec94]. In[Miy93] NN systems has been suggested for CDMA MUD. Furthermore, they could be usedas signal derivative detectors, or to directly output the momentary predictor parameters. Theseapplication possibilities make NNs an interesting research topic in the field of power control
Input layer
Hidden layer
Output layer
z-1z-1z-1
z-1z-1
Output layer
Input layer
Multilayerperceptron
Functionallink NN
Fig. 5.3. A hybrid NN-based predictor structure(of an arbitrary size, for example only).Adopted from [Gao97c].
Jarno Tanskanen, Multiuser CDMA Power Control Simulator — Effects of Simple Prediction
31
systems. One could even think of a pure neural network power controller that would directlygenerate the power control command to be sent to the mobile unit [Gao97a].
Jarno Tanskanen, Multiuser CDMA Power Control Simulator — Effects of Simple Prediction
32
6. Conclusions and Discussions
In the beginning, this research concentrated on the possibilities of predicting Rayleigh fading[P1], [P2] with the mobile speeds were within urban speed range 5 km/h, …, 50 km/h, as inall the cases presented in the Publications. It was clearly seen that a Rayleigh fading signal,typically encountered in mobile communications, is very well predictable by the means of, forexample, Heinonen-Neuvo polynomial predictors. In [P1] and [P2] H-N polynomial predictorperformances are evaluated, and predictor selection criteria are given for two differentRayleigh fading models. It is also found that mainly due to the differing frequencydistribution, more attention should be paid on the method for generating Rayleigh fading inmobile communications simulations than what is generally considered. Though, in thepolynomial prediction study, these differences have only marginal effects. These results,stating the predictability of the Rayleigh fading, set forward the work to find out the effects ofprediction in an actual closed loop power controller. In [P3], obvious results of applyinglowpass predictors in a closed control loop whose actions are dictated by the excess noisepower are very clearly shown. Results in [P3] apply to the case where only a single user canexist at any time within a given carrier frequency band, and the power controller input is thetotal received signal after despreading. In this case, the excess noise power reduction is ofcrucial importance for the closed control loop operation, and the need for filtering isillustratively shown. In [P4], an actual multiuser simulator is presented, and the resultsachieved by applying H-N predictors are given. The results indicate that marginal transmitterpower savings and a little improved power control functionality may be achieved by applyingH-N predictors. In [P5], results of applying both H-N polynomial predictors and optimumpower estimators by A. Huang are presented for singleuser, 5- and 10-user, and AWGNmultiuser interference model simulations, with the same main conclusions as in [P4].
The simulator construction work was naturally found to be full of compromises. In a way, itwould have been of more practical interest to create a simulator with more realisticallyimplemented radio channel and base station receiver models. The channel model could havebeen a complete multipath channel model with different fading distributions available, and thebase station receiver could have consisted of an actual RAKE receiver, or some MUDschemes could have been applied. This would have made the work more interesting readingfor practical radio engineers. From the signal processing point of view, these additions wouldhave obscured the effects of predictive filtering to a very large extend. Even in the multiusersimulator presented here, the multiuser interference makes it somewhat more difficult to beable to clearly see and analyze the effects of individual system component improvements.Therefore, the research direction with very simple, yet scientifically justifiable, system modelswas adopted.
The simulated power control system was found to be very restrictive by itself, not leavingmuch room for improvements, i.e., the power control period is fairly long and fixed, and thepower control step size and the overall power control system dynamics are naturally alsolimited. Anyway, the final conclusion is that a closed power control loop can be fine tunedwith application of proper predictive filtering, which enhances the noise content of thereceived power level measurement data, and possibly slightly adjusts power control timing.
Jarno Tanskanen, Multiuser CDMA Power Control Simulator — Effects of Simple Prediction
33
7. Summary of the Publications
P1 J. M. A. Tanskanen, A. Huang, T. I. Laakso, and S. J. Ovaska, “Polynomial prediction ofnoise shaping Rayleigh fading,” in Proc. 1995 Finnish Signal Processing Symposium,Espoo, Finland, June 1995, pp. 26–29.
In [P1], predictivity of delayed and noisy Rayleigh fading signals with Heinonen-Neuvopolynomial predictors of several lengths and degrees is presented in the sense ofachievable SNR gains. Rayleigh fading signal generation from WGN by noise shaping,and the applied predictors, are reviewed in the paper. Two prediction schemes forcomplex-valued signals are presented and an appropriate complex signal SNR definitionis developed. The Rayleigh fading process parameters are derived partially from a CDMAcommunications system point of view, and the prediction is found to be a potential toolfor received fading power level estimation in CDMA power control systems. The resultsare shortly compared with those employing prediction of Rayleigh fading generated byJakes’ fader. Also, the prediction of low frequency parts of the fading signals with regardto utilizing ‘slow’ fading information is considered, i.e., the signal used as the referencein SNR calculations can be band-limited. Anyway, the main emphasis in the paper is onthe total fading signal prediction.
The main results of the paper are the polynomial predictor performance evaluation andH-N length and degree selection criteria for Rayleigh fading signals used at urban mobilespeeds.
P2 J. M. A. Tanskanen, A. Huang, T. I. Laakso, and S. J. Ovaska, “Prediction of receivedsignal power in CDMA cellular systems,” in Proc. 45th IEEE Vehicular TechnologyConference, Chicago, IL, July 1995, pp. 922–926.
In [P2], the predictivity of delayed and noisy Rayleigh fading signals with Heinonen-Neuvo polynomial predictors of several lengths and degrees is presented in the sense ofachievable SNR gains. Jakes’ Rayleigh fader and the applied predictors are reviewed inthe paper. As compared to [P1], [P2] addresses the prediction of low frequency parts ofthe fading signals, whereas the emphasis of [P1] is in the complete signal prediction. [P2]thus emphasizes prediction of the frequency components of the Rayleigh fading receivedpower level that is actually relevant to the CDMA power control function. For this, anappropriate complex signal SNR employing lowpass filtered reference signals isdeveloped with special attention is paid to the reference signal generation. The applied H-N predictors and the complex-valued signal prediction schemes are reviewed.
The main results of the paper are the polynomial predictor performance evaluation andlength and degree selection criteria for Rayleigh fading signals used. The differencesbetween the noise shaping Rayleigh fader [P1] and the Jakes’ fader [P2] affecting theprediction are analyzed in the introductory part of this Thesis.
Jarno Tanskanen, Multiuser CDMA Power Control Simulator — Effects of Simple Prediction
34
P3 J. M. A. Tanskanen, J. Mattila, M. Hall, T. O. Korhonen, and S. J. Ovaska, “Predictiveclosed loop transmitter power control,” in Proc. 1996 IEEE Nordic Signal ProcessingSymposium, Espoo, Finland, Sept. 1996, pp. 5-8.
In [P3], a single user CDMA closed loop power control simulator is constructed and H-Npredictive control is compared with the corresponding non-filtered reference control. Thesystem parameters are derived from Qualcomm CDMA system parameters with somemodifications to speedup and simplify simulations. In the simulator, the input to thecontroller is the total unprocessed complex-valued received baseband signal. The resultsclearly demonstrate the effect of excess noise to the operation of the closed power controlloop, with the main emphasis on the noise reduction capabilities of the filter used withinthe closed power control loop. The prediction mechanism of the H-N predictors is presentbut negligible with regard to the results shown.
In [P3], the selected total closed power control loop delay, 1 chip duration, is too short tobe reality. This delay as a propagation delay would mean that the cell radius would beapproximately only 122 m. Still, part of the delay consist of signal processing delays.
The main result is that this kind of closed loop power control, and thus also the datatransmission, fails completely under too noisy conditions unless filtering is applied. Theresults illustratively show the definitive deed for filtering within the closed control loopbased on the total received power estimation.
P4 J. M. A. Tanskanen, J. Mattila, M. Hall, T. Korhonen, and S. J. Ovaska “Predictive closedloop power control for mobile CDMA systems,” in Proc. 47th IEEE VehicularTechnology Conference, Phoenix, Arizona, USA, May 1997, pp. 934-938.
In [P4], complete multiuser CDMA closed loop power control simulators are constructedwith 5 or 10 users, one of which is the user under observation. The users are connected toa single base station, and interfere with each others. Also, a WGN multiuser interferencemodel is simulated. In this simulator, the input to the controller is the complex-valuedreceived signal after despreading and integration over the bit duration. This is the maindifference with the controller employed in [P3]. As the result of the integration, noisepower at the controller input has already been reduced, and the predictive function of theapplied H-N lowpass predictors is more pronounced. The multiuser interference is clearlyapparent in the control action results shown in the paper. It is shown, that the predictivecontroller is capable of commanding to reduce transmitter power earlier than the non-predictive controller. BER comparisons between the predictive and non-predictivecontrollers give no consistent results as the mobile speed and the number of users isvaried. Though, as the BERs given in the paper, are raw BERs, i.e., e.g., no errorcorrection coding is applied, the BER difference to one direction or to the other may nothave any effect on the BER performance of an actual communications system. Thepredictive control results in consistent reduction in transmitter power consumption,though the achieved savings are very low, actually marginal, and statistically not verymeaningful. However, the control objective, minimizing the variance of the receivedpower level is consistently a little better achieved with the predictive controller than withthe non-predictive reference controller. The WGN interference model results agree withthe actual multiuser interference results in most of the cases.
Jarno Tanskanen, Multiuser CDMA Power Control Simulator — Effects of Simple Prediction
35
The main result is that the closed power control loop can be fine tuned by application ofproper predictive filtering, and H-N prediction is seen to be able to slightly adjust controltiming.
P5 J. M. A. Tanskanen, A. Huang, and I. O. Hartimo “Predictive power estimators in CDMAclosed loop power control,” in Proc. 48th IEEE Vehicular Technology Conference,Ottawa, Ontario, Canada, May 1998, in press.
In [P5] two optimum predictor design methods based on the Wiener model are presentedby A. Huang, and they are applied in single user, 5-user, 10-user, and AWGN interuserinterference model closed power control loop simulators. Thus [P5] also offers a quicklook at the actual multiuser simulator vs. the commonly used AWGN interuserinterference model, as does [P4], too. Also, H-N polynomial predictors are employed aswell as non-predictive power measurement based systems. The latter of which is used asthe reference case. The simulation results are given in the form of achieved BERs, mobiletransmitter power savings, and received power level variance reductions. The reduction ofthe received power level variance, or the variance of the user’s channel output power, isthe actual control variable whose quality is the main motivation behind the wholeresearch work presented since the CDMA communications system capacity is greatlydependent on the power control system’s capability of providing for equal and constantpower levels at the base station receivers from all individual mobile users.
The single user results very clearly show the need for (predictive) filtering in this type ofpower controllers, as also concluded in [P3]. The multiuser simulation results show thateven though the simulated power control system is inherently very restrictive, it ispossible to fine tune the closed power control loop by application of proper predictors.
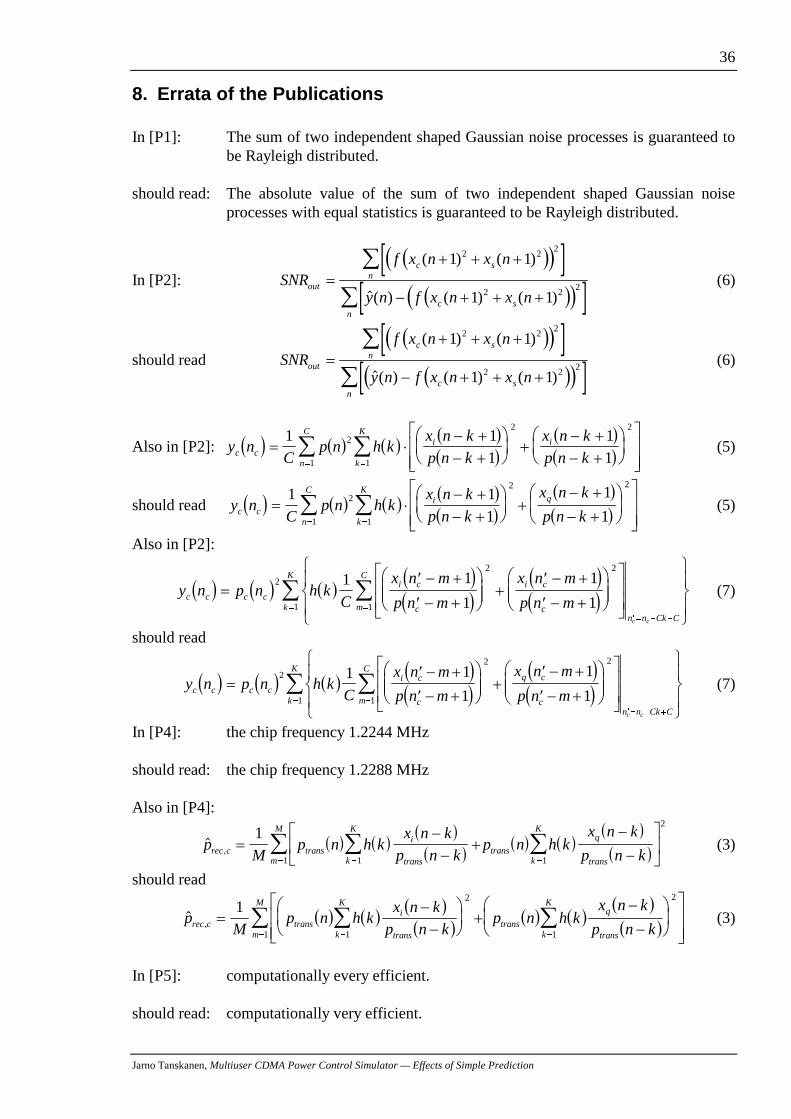
Jarno Tanskanen, Multiuser CDMA Power Control Simulator — Effects of Simple Prediction
36
8. Errata of the Publications
In [P1]: The sum of two independent shaped Gaussian noise processes is guaranteed tobe Rayleigh distributed.
should read: The absolute value of the sum of two independent shaped Gaussian noiseprocesses with equal statistics is guaranteed to be Rayleigh distributed.
In [P2]:� �� �> @� �� �> @
SNRf x n x n
y n f x n x nout
c sn
c sn
� � �
� � � �
¦
¦
( ) ( )
�( ) ( ) ( )
1 1
1 1
2 2 2
2 2 2 (6)
should read� �� �> @� �� �> @
SNRf x n x n
y n f x n x nout
c sn
c sn
� � �
� � � �
¦
¦
( ) ( )
�( ) ( ) ( )
1 1
1 1
2 2 2
2 2 2 (6)
Also in [P2]: � � � � � �� �
� �
� �
� �y n
Cp n h k
x n k
p n k
x n k
p n kc ci i
k
K
n
C
�� �
� �
§
©¨
·
¹¸ �
� �
� �
§
©¨
·
¹¸
ª
¬««
º
¼»»
¦¦1 1
111
2
2 2
11
(5)
should read � � � � � �� �
� �
� �
� �y n
Cp n h k
x n k
p n k
x n k
p n kc ci q
k
K
n
C
�� �
� �
§
©¨
·
¹¸ �
� �
� �
§
©¨
·
¹¸
ª
¬
««
º
¼
»»
¦¦1 1
1
1
12
2 2
11
(5)
Also in [P2]:
� � � � � �� �� �
� �� �
y n p n h kC
x n m
p n m
x n m
p n mc c c ci c
c
i c
cn n Ck C
m
C
k
K
c c
c � �
c � �
§
©¨̈
·
¹¸̧ �
c � �
c � �
§
©¨̈
·
¹¸̧
ª
¬
««
º
¼
»»
®°
¯°
½
¾°
¿°
c � �
¦¦2
2 2
11
1 1
1
1
1(7)
should read
� � � � � �� �� �
� �� �
y n p n h kC
x n m
p n m
x n m
p n mc c c ci c
c
q c
cn n Ck C
m
C
k
K
c c
c � �
c � �
§
©¨̈
·
¹¸̧ �
c � �
c � �
§
©¨̈
·
¹¸̧
ª
¬
««
º
¼
»»
®°
¯°
½
¾°
¿°
c � �
¦¦2
2 2
11
1 1
1
1
1(7)
In [P4]: the chip frequency 1.2244 MHz
should read: the chip frequency 1.2288 MHz
Also in [P4]:
� � � �� �
� �� � � �
� �
� �� ,p
Mp n h k
x n k
p n kp n h k
x n k
p n krec c transi
transk
K
m
M
trans
q
transk
K
�
��
ª
¬«
�
�
º
¼»
¦¦ ¦1
11 1
2
(3)
should read
� � � �� �
� �� � � �
� �
� �� ,p
Mp n h k
x n k
p n kp n h k
x n k
p n krec c transi
transk
K
m
M
trans
q
transk
K
�
�
§
©¨
·
¹¸ �
ª
¬««
�
�
§
©¨
·
¹¸º
¼
»»
¦¦ ¦1
1
2
1 1
2
(3)
In [P5]: computationally every efficient.
should read: computationally very efficient.
Jarno Tanskanen, Multiuser CDMA Power Control Simulator — Effects of Simple Prediction
37
9. References r
[Ada96] F. Adachi, “Theoretical analysis of DS-CDMA reverse link capacity with SIR-based transmit power control,” IEICE Trans. Fundamentals, vol. E79-A, pp.2028–2034, Dec. 1996.
[Ari93] S. Ariyavisitakul and L. F. Chang, “Signal and interference statistics of a CDMAsystem with feedback power control,” IEEE Trans. Commun., vol. 41, pp. 1626–1634, Nov. 1993.
[Ari94] S. Ariyavisitakul, “Signal and interference statistics of a CDMA system withfeedback power control - Part II,” IEEE Trans. Commun., vol. 42, pp. 597–605,Feb./Mar./Apr. 1994.
[Bai94] A. Baier, U.-C. Fiebig, W. Granzow, W. Koch, P. Teder, and J. Thielecke,“Design study for a CDMA-based third-generation mobile radio system,” IEEE J.Selected Areas Commun., vol. 12, pp. 733–743, May 1994.
[Ban96] Y. J. Bang and S. W. Kim, “A new spreading scheme for convolutional codedCDMA communication in a Rayleigh-fading channel,” IEEE Trans. Commun.,vol. 44, pp. 1537–1542, Nov. 1996.
[Cal88] G. Calhoun, Digital Cellular Radio. Norwood, MA, USA: Artech House, Inc.,1988.
[Cam91] T. G. Campbell and Y. Neuvo, “Predictive FIR filters with low computationalcomplexity,” IEEE Trans. Circuits and Systems, vol. 38, pp. 1067–1071, Sept.1991.
[Cam96] R. Cameron and B. Woerner, “Performance analysis of CDMA with imperfectpower control,” IEEE Trans. Commun., vol. 44, pp. 777–781, July 1996.
[Car86] A. B. Carlson, Communication Systems, An Introduction to Signals and Noise inElectrical Communications. New York, NY, USA: McGraw-Hill Book Company,1986.
[Cav97] A. Cavallini, F. Gianetti, M. Luise, and R. Regiannini, “Chip-level differentialencoding/detection of spread-spectrum signals for CDMA radio transmission overfading channels,” IEEE Trans. Commun., vol. 45, pp. 456–463, Apr. 1997.
[Cha94] N. L. B. Chan, “Multipath propagation effects on a CDMA cellular system,” IEEETrans. Vehicular Tech., vol. 43, pp. 848–855, Nov. 1994.
[Cha96] C.-J. Chang, J.-H. Lee, and F.-C. Ren, “Design of power control mechanisms withPCM realization for the uplink of DS-CDMA cellular mobile radio system,” IEEETrans. Vehicular Tech., vol. 45, pp. 522–530, Aug. 1996.
[Che97] K. Cheun, “Performance of direct-sequence spread-spectrum RAKE receiverswith random spreading sequences,” IEEE Trans. Commun., vol. 45, pp. 1130–1143, Sept. 1997.
[Den93] P. Dent, G. E. Bottomley, and T. Croft, “Jakes fading model revisited,”Electronics Letters, vol. 29, pp. 1162–1163, June 1993.
r Note on the nomenclature: In the case of several publications from an author on a given year being referenced all at once, references arejointly denoted by omitting the letter following the year. Similarly, all the publications listed from a given author are jointly referenced byomitting also the publication year.
Jarno Tanskanen, Multiuser CDMA Power Control Simulator — Effects of Simple Prediction
38
[Eur93] European Telecommunications Standards Institute, European Digital CellularTelecommunication System (Phase 2); Radio Transmission and Reception, GSM05.05, vers. 4.6.0. Sophia Antipolis Cedex, France, July 1993.
[Fan95] J. Fang and L. E. Atlas, “Quadratic detectors for energy estimation,” IEEE Trans.Signal Processing, vol. 43, pp. 2582–2594, Nov. 1995.
[Fre91] A. Freeman and D. M. Skapura, Neural Networks: Algorithms, Applications, andProgramming Techniques. New York, NY, USA: Addison-Wesley PublishingCompany, Inc., 1991.
[Gan72] M. J. Gans, “A power-spectral theory of propagation in the mobile-radio envi-ronment,” IEEE Trans. Vehicular Tech., vol. 21, pp. 27–38, Feb. 1972.
[Gao96] X. M. Gao, J. M. A. Tanskanen, and S. J. Ovaska, “Comparison of linear andneural network-based power prediction schemes for mobile DS/CDMA systems,”in Proc. 1996 Vehicular Technology Conference, Apr. 1996, Atlanta, GE, USA,pp. 61-65.
[Gao97a] X. M. Gao, X. Z. Gao, J. M. A. Tanskanen, and S. J. Ovaska, “Power control formobile DS/CDMA systems using a modified Elman neural network controller,” inProc. 47th IEEE Vehicular Technology Conference, Phoenix, AZ, USA, May1997, pp. 750–754.
[Gao97b] X. M. Gao, X. Z. Gao, and S. J. Ovaska, “Power prediction using an optimalneuro-fuzzy predictor,” in Proc. IEEE Instrumentation and MeasurementTechnology Conference, Ottawa, Canada, May 1997, pp. 1225–1230.
[Gao97c] X. M. Gao, X. Z. Gao, J. M. A. Tanskanen, and S. J. Ovaska, “Power prediction inmobile communication system using an optimal neural-network structure,” IEEETrans. Neural Networks, vol. 8, pp. 1446–1455, Nov. 1997.
[Gao98] X. Z. Gao and S. J. Ovaska, “A temporal difference method-based predictionscheme applied to fading power signals,” accepted for publication in Proc. 1998IEEE International Conference on Neural Networks, Anchorage, AK, USA, May1998.
[Gej92] R. R. Gejji, “Forward-link-power control in CDMA cellular systems,” IEEETrans. Vehicular Tech., vol. 41, pp. 532–536, Nov. 1992.
[Gib96] J. D. Gibson (ed.), The Mobile Communications Handbook. Boca Raton, FL,USA: CRC Press, Inc., and IEEE Press, 1996.
[Gil91] K. S. Gilhousen, I. M. Jacobs, R. Padovani, A. J. Viterbi, L. A. Weaver, Jr., andC. E. Wheatly III, “On the capacity of a cellular CDMA system,” IEEE Trans.Vehicular Tech., vol. 40, pp. 303–312, May 1991.
[Gra93] S. A. Grandhi, R. Vijayan, D. J. Goodman, and J. Zander, “Centralized powercontrol in cellular radio systems,” IEEE Trans. Vehicular Tech., vol. 42, pp. 466–468, Nov. 1993.
[Gra94] S. A. Grandhi, R. Vijayan, and D. J. Goodman, “Distributed power control incellular radio systems,” IEEE Trans. Commun., vol. 42, pp. 226–228,Feb./Mar./Apr. 1994.
[Har95] T. Harju and T. I. Laakso, “Polynomial predictors for complex-valued vectorsignals,” Electronics Letters, vol. 31, pp. 1650–1652, Sept. 1995.
Jarno Tanskanen, Multiuser CDMA Power Control Simulator — Effects of Simple Prediction
39
[Has79] H. Hasemi, “Simulation of the urban radio propagation channel,” IEEE Trans.Vehicular Tech., vol. 28, pp. 213–225, Aug. 1979.
[Has93] H. Hasemi, “The indoor radio propagation channel,” Proc. IEEE, vol. 81, pp.943–968, July 1993.
[Hei88] P. Heinonen and Y. Neuvo, “FIR-median hybrid filters with predictive FIRsubstructures,” IEEE Trans. Acoustics, Speech, and Signal Processing, vol. 36,pp. 892–899, June 1988.
[Hua95a] A. Huang, T. I. Laakso, S. J. Ovaska, and I. Hartimo, “Predictive powerestimation of complex-valued signals,” in Proc. 38th Midwest Symp. Circuits andSystems, Rio de Janeiro, Brazil, Aug. 1995, pp. 953–956.
[Hua95b] A. Huang, T. I. Laakso, S. J. Ovaska, and I. O. Hartimo, “On schemes for powerprediction of complex-valued signals,” in Proc. 1995 Finnish Signal ProcessingSymposium, Espoo, Finland, June 1995, pp. 55–58.
[Hua96a] A. Huang and T. I. Laakso, “Power estimation approaches for complex-valuedsignals based on Hammerstein model and Wiener model,” in Proc. Nordic SignalProcessing Symposium, Sept. 1996, Espoo, Finland, pp. 191–194.
[Hua96b] A. Huang, T. I. Laakso, S. J. Ovaska, and I. Hartimo “Optimal linear powerestimator for slowly-varying complex-valued signals,” in Proc. The ThirdInternational Conference on Signal Processing, Oct. 1996, Beijing, China, pp.76–79.
[Hua96c] A. Huang and T. I. Laakso, “Optimal design and adaptive implementation ofpower estimation using Hammerstein model,” in Proc. IEEE 39th MidwestSymposium on Circuits and Systems, Aug. 1996, Ames, Iowa, USA, pp. 18–21.
[Hua97] A. Huang, Efficient Methods for Power Estimation—Optimization andImplementation. Licentiate Thesis, Helsinki University of Technology, Espoo,Finland, May 1997.
[Hua98] A. Huang, J. M. A. Tanskanen, and I. O. Hartimo, “Design and Application ofEfficient Optimum Power Estimator Based on Wiener Model for Complex-ValuedSignals,” accepted for publication in Proc. of 1998 IEEE International Symposiumon Circuits and Systems, May 1998, Monterey, CA, USA.
[Ibn97] M. Ibnkahla, J. Sombrin, F. Castanie, and N. J. Bershad, “Neural networks formodeling nonlinear memoryless communication channels,” IEEE Trans.Commun., vol. 45, pp. 768–771, July 1997.
[IEE88] IEEE Vehicular Technology Society Committee on Radio Propagation, N. H.Shepherd (Chairman), “Coverage prediction for mobile radio systems operating inthe 800/900 MHz frequency range,” IEEE Trans. Vehicular Tech., vol. 37, pp. 3–72, Feb. 1988.
[Jak74] W. C. Jakes (ed.), Microwave Mobile Communications. New York, NY, USA:John Wiley & Sons, Inc., 1974.
[JaH94] L. M. A. Jalloul and J. M. Holtzman, “Multipath fading effects on wide-bandDS/CDMA signals: analysis, simulation, and measurements,” IEEE Trans.Vehicular Tech., vol. 43, pp. 801–807, Aug. 1994.
[JaM94] A. Jalali and P. Mermelstein, “Effects of diversity, power control, and bandwidthon the capacity of microcellular CDMA systems,” IEEE J. Sel. Areas Commun.,vol. 12, pp. 952–961, June. 1994.
Jarno Tanskanen, Multiuser CDMA Power Control Simulator — Effects of Simple Prediction
40
[Kal85] N. Kalouptsides, G. Carayannis, D. Manolakis, and E. Koukoutsis, “Efficientrecursive in order least squares FIR filtering and prediction,” IEEE Trans.Acoustics, Speech, and Signal Processing, vol. 33, pp. 1175–1187, Oct. 1985.
[Kec94] G. Kechriotis, E. Zervas, and E. S. Manolakos, “Using recurrent neural networksfor adaptive communication channel equalization,” IEEE Trans. Neural Networks,vol. 5, pp. 267–278, Mar. 1994.
[Kim93] K. I. Kim, “CDMA cellular engineering issues,” IEEE Trans. Vehicular Tech.,vol. 42, pp. 345–350, Aug. 1993.
[Kim97] J. Y. Kim and J. H. Lee, “Effect of imperfect power control on acquisitionperformance in a DS/CDMA system,” Electronics Letters, vol. 32, pp. 1255–1256, July 1996.
[Kud92] E. Kudoh and T. Matsumoto, “Effects of power control error on the system usercapacity of DS/CDMA cellular mobile radios,” IEICE Trans. Commun., vol. E75-B, pp. 524–529, June 1992.
[Kud93] E. Kudoh, “On the capacity of DS/CDMA cellular mobile radios under imperfecttransmitter power control,” IEICE Trans. Commun., vol. E76-B, pp. 886–893,Aug. 1993.
[Laa93] T. I. Laakso and S. Ovaska, “Optimal polynomial predictors with applicationspecific fixed prefilters,” in Proc. IEEE Int. Symp. Circuits and Systems, Chicago,IL, May 1993, pp. 351–354.
[Lee86] W. C. Y. Lee, Mobile Communications Design Fundamentals. Indianapolis, IN,USA: Sams, 1986.
[Lee91] W. C. Y. Lee, “Overview of Cellular CDMA,” IEEE Trans. Vehicular Tech., vol.40, pp. 291–302, May 1991.
[Lee95] T.-H. Lee, J.-C. Lin, and Y. T. Su, “Downlink power control algorithms forcellular radio systems,” IEEE Trans. Vehicular Tech., vol. 44, pp. 89–94, Feb.1995.
[Lee97] J. Lee, R. Tafazolli, and B. G. Evans, “Erlang capacity of OC-CDMA withimperfect power control,” Electronics Letters, vol. 33, pp. 295–261, Feb. 1997.
[Li95] V. O. K. Li and X. Qui, “Personal communication systems (PCS),” Proc. ofIEEE, vol. 83, pp. 1210–1243, Sept. 1995.
[Lin92] J.-P. M. G. Linnartz, R. Hekmat, and R.-J. Venema, “Near-far effects in landmobile random access networks with narrow-band Rayleigh fading channels,”IEEE Trans. Vehicular Tech., vol. 41, pp. 77–90, Feb. 1992.
[Lin97] X. D. Lin and K. H. Chang, “Optimal PC sequence design for quasisynchronousCDMA communication systems,” IEEE Trans. Commun., vol. 45, pp. 221–226,Feb. 1997.
[Loo91] C. Loo and N. Secord, “Computer models for fading channels with applications todigital transmission,” IEEE Trans. Vehicular Tech., vol. 40, pp. 700–707, Nov.1991.
[Mag94] D. T. Magill, F. D. Natali, and G. P. Edwards, “Spread-spectrum technology forcommercial applications,” Proc. IEEE, vol. 82, pp. 572–584, Apr. 1994.
Jarno Tanskanen, Multiuser CDMA Power Control Simulator — Effects of Simple Prediction
41
[Mil92] L. B. Milstein, T. S. Rappaport, and R. Barghouti, “Performance evaluation forcellular CDMA,” IEEE J. Selected Areas Commun., vol. 10, pp. 680–689, May1992.
[Miy93] T. Miyajima, T. Hasegawa, and M. Haneishi, “On the multiuser detection using aneural network in code-division multiple-access communications,” IEICE Trans.Commun., vol. E76-B, pp. 961–968, Aug. 1993.
[Nee90] J. Neejärvi and Y. Neuvo, “Sinusoidal and pulse responses of FIR-median hybridfilters,” IEEE Trans. Circuits and Systems, vol. 37, pp. 1552–1556, Dec. 1990.
[Orf90] S. J. Orfanidis, Optimum Signal Processing: An Introduction (2nd ed.). NewYork, NY, USA: McGraw-Hill Book Company, 1990.
[Ova91a] S. J. Ovaska, “FIR prediction using Newton’s backward interpolation algorithmwith soothed successive differences,” IEEE Trans. Instrumentation andMeasurement, vol. 40, pp. 811–815, Oct. 1991.
[Ova91b] S. J. Ovaska, “Newton-type predictors – A signal processing oriented viewpoint,”Signal Processing, vol. 25, pp. 251–257, Nov. 1991.
[Ova92] S. J. Ovaska and O. Vainio, “Recursive linear smoothed Newton predictors forpolynomial extrapolation,” IEEE Trans. Instrumentation and Measurement, vol.41, pp. 510–516, Aug. 1992.
[Par87] W. Parks and C. S. Burrus, Digital Filter Design. New York, NY, USA: JohnWiley Sons, Inc., 1987.
[Par92] D. Parsons, The Mobile Radio Propagation Channel. London, England: PentechPress limited, 1992.
[Pic82] B. Picinbono, “Quadratic filters,” in Proc. Int. Conf. Acoustics, Speech, andSignal Processing, Paris, France, May 1982, pp. 298–301.
[Pic91] R. L. Pickholtz, L. B. Milstein, and D. L. Schilling, “Spread Spectrum for MobileCommunications,” IEEE Trans. Vehicular Tech., vol. 40, pp. 313–322, May 1991.
[Pov96] G. J. R. Povey, P. M. Grant, and R. D. Pringle, “A decision-directed spread-spectrum RAKE receiver for fast-fading mobile channels,” IEEE Trans. VehicularTech., vol. 45, pp. 491–502, Aug. 1996.
[Pra92] R. Prasad, A. Kegel, and M. G. Jansen, “Effect of imperfect power control oncellular code division multiple access system,” Electronics Letters, vol. 28, pp.849–848, Apr. 1992.
[Pri58] R. Price and P. E. Green, “A communication technique for multipath channels,”Proc. of IRE, pp. 555–570, Mar. 1958.
[Pri96] F. D. Priscoli and F. Sestini, “Effects of imperfect power control and user mobilityon a CDMA cellular network,” IEEE J. Sel. Areas Commun., vol. 14, pp. 1809–1817, Dec. 1996.
[Pro92] J. G. Proakis and D. G. Manolakis, Digital Signal Processing: Principles,Algorithms, and Applications. New York, NY, USA: Macmillan PublishingCompany, 1992.
[Qua92] QUALCOMM Incorporation, An Overview of the Application of Code DivisionMultiple Access (CDMA) to Digital Cellular Systems and Personal CellularNetworks. (Document no. EX60-10010), 1992.
Jarno Tanskanen, Multiuser CDMA Power Control Simulator — Effects of Simple Prediction
42
[Ran92] J. P. Ranta, S. J. Ovaska, and T. I. Laakso, “Adaptive polynomial predictor forfeedback velocity prefiltering in elevator control,” in Proc. Int. Conf. SignalProcessing Applications and Technology, Cambridge, MA, Nov. 1992, pp. 583–592.
[Ris84] J. Rissanen, “Universal coding, information, prediction, and estimation usingpredictive MDL principle,” IEEE Trans. Information Theory, vol. 30, pp. 629–636, July 1984.
[Sch90] D. L. Schilling, R. L. Pickholtz, and L. B. Milstein, “Spread spectrum goescommercial,” IEEE Spectrum, pp. 40–45, Aug. 1990.
[Sha97] M. Shafi, A. Hashimoto, M. Umehira, S. Ogose, and T. Murase, “Wirelesscommunications in the twenty-first century: a perspective,” Proc. of IEEE, vol. 85,pp. 1622–1638, Oct. 1997.
[Sic92] G. Sicuranza, “Quadratic filters for signal processing,” Proc. of IEEE, vol. 80, pp.1263–1285, Aug. 1992.
[Sim85] M. K. Simon, J. K. Omura, R. A. Scholtz, and B. K. Levitt, Spread SpectrumCommunications, Vol. 1, Vol. 2. Rockville, MD, USA: Computer Science Press,1985.
[Sim93] F. Simpsom and J. M. Holtzman, “Direct sequence CDMA power control,interleaving, and coding,” IEEE J. Sel. Areas Commun., vol. 11, pp. 1085–1095,Sept. 1993.
[Str96] E. G. Ström, S. Parkvall, S. L. Miller, and B. E. Ottersten, “Propagation delayestimation in asynchronous direct-sequence code-division multiple accesssystems,” IEEE Trans. Commun., vol. 44, pp. 84–93, Jan. 1996
[Sut88] R. S. Sutton, “Learning to predict by the methods of temporal differences,”Machine Learning, vol. 3, pp. 9–44, 1988.
[The92] C. W. Therrien, Discrete Random Signals and Statistical Signal Processing.London, UK: Prentice-Hall International, Inc., 1992.
[Ton94] O. K. Tonguz and M. M. Wang, “Cellular CDMA networks impaired by Rayleighfading: System performance with power control,” IEEE Trans. Vehicular Tech.,vol. 43, pp. 515–527, Aug. 1994.
[Vaj95] I. Vajda, “Code sequences for frequency-hopping multiple-access systems,” IEEETrans. Commun., vol. 43, pp. 2553–2554, Oct. 1995.
[Val97] R. A. Valenzuela, O. Landron, and D. L. Jacobs, “Estimating local mean signalstrength of indoor multipath propagation,” IEEE Trans. Vehicular Tech., vol. 46,pp. 203–212, Feb. 1997.
[Wan93] M. M. Wang and O. K. Tonguz, “Forward link power control for cellular CDMAnetworks,” Electronics Letters, vol. 29, pp. 1195–1197, June 1993.
[Var97] B. Varone, J. M. A. Tanskanen, and S. J. Ovaska, “Response analysis of a feed-forward neural network,” in Proc. 1997 International Conference on Acoustics,Speech, and Signal Processing, Munich, Germany, Apr. 1997, pp. 3309-3312.
[Vit93a] A. J. Viterbi, A. M. Viterbi, and E. Zehavi, “Performance of power-controlledwideband terrestrial digital communication,” IEEE Trans. Commun., vol. 41, pp.559–569, Apr. 1993.
Jarno Tanskanen, Multiuser CDMA Power Control Simulator — Effects of Simple Prediction
43
[Vit93b] A. M. Viterbi and A. J. Viterbi, “Erlang capacity of a power controlled CDMAsystem,” IEEE J. Selected Areas Commun., vol. 11, pp. 892–900, Aug. 1993.
[Vit94a] A. J. Viterbi, A. M. Viterbi, and E. Zehavi, “Other-cell interference in cellularpower-controlled CDMA,” IEEE Trans. Commun., vol. 42, pp. 1501–1504,Feb./Mar./Apr. 1994.
[Vit94b] A. J. Viterbi, “The evolution of digital wireless technology from space explorationto personal communication services,” IEEE Trans. Vehicular Tech., vol. 43, pp.638–644, Aug. 1994.
[Vit95] A. J. Viterbi, CDMA Principles of Spread Spectrum Communication. Reading,MA, USA: Addison-Wesley Publishing Company, 1995.
[Zan92] J. Zander, “Performance of optimum transfer power control in cellular radiosystems,” IEEE Trans. Vehicular Tech., vol. 41, pp. 57–62, Feb. 1992.
[Åst87] K. J. Åström, “Adaptive feedback control,” Proc. of IEEE, vol. 75, pp. 185–217,Feb. 1987.
P1
PUBLICATION P1
J. M. A. Tanskanen, A. Huang, T. I. Laakso, and S. J. Ovaska“Polynomial prediction of noise shaping Rayleigh fading”
inProc. 1995 Finnish Signal Processing Symposium
Espoo, Finland, June 1995, pp. 26–29.
P2
PUBLICATION P2
J. M. A. Tanskanen, A. Huang, T. I. Laakso, and S. J. Ovaska“Prediction of received signal power in CDMA cellular systems”
inProc. 45th IEEE Vehicular Technology Conference
Chicago, IL, July 1995, pp. 922–926.
P3
PUBLICATION P3
J. M. A. Tanskanen, J. Mattila, M. Hall, T. O. Korhonen, and S. J. Ovaska“Predictive closed loop transmitter power control”
inProc. 1996 IEEE Nordic Signal Processing Symposium
Espoo, Finland, Sept. 1996, pp. 5-8.
P4
PUBLICATION P4
J. M. A. Tanskanen, J. Mattila, M. Hall, T. Korhonen, and S. J. Ovaska“Predictive closed loop power control for mobile CDMA systems”
inProc. 47th IEEE Vehicular Technology ConferencePhoenix, Arizona, USA, May 1997, pp. 934-938.
P5
PUBLICATION P5
J. M. A. Tanskanen, A. Huang, and I. O. Hartimo“Predictive power estimators in CDMA closed loop power control”
inProc. 48th IEEE Vehicular Technology Conference
Ottawa, Ontario, Canada, May 1998, in press.