Embed Size (px)
Citation preview
TECHNICAL ARTICLE—PEER-REVIEWED
Multiple Sinusoidal Vibration Test Development for EngineMounted Components
Liang Wang • Yung-Li Lee • Robert Burger •
Keyu Li
Submitted: 20 October 2012 / Published online: 5 February 2013
� ASM International 2013
Abstract Durability testing is required before vehicle
launching to prevent failure before designed life. Limited
publications were found on specifying vibration testing to
validate durability and reliability of engine mounted com-
ponents. These published test methods did not consider
engine firing order effects and oversimplified the vibration
profiles. In this paper, a new ordered multiple sinusoidal
vibration test method is proposed to improve the existing
procedures. The test method is designed to fulfill an infinite
life durability requirement for engine mounted components
subjected to a four-stroke internal combustion engine vibra-
tion. An innovative test development procedure, based on
engine vibration field data, is illustrated in details in this
paper. The ordered multiple sinusoidal vibration test method
covers the choice of sweep type, sweep time, frequency range,
vibration magnitude and profile, and test duration. Instead of
obtaining the vibration magnitude directly from order anal-
ysis results, vibration magnitudes are determined by fully
analyzing the vibration data in both time domain and
frequency domain. Test profiles designed by enveloping
method are proposed for a better represent of the engine
excitations.
Keywords Durability analysis � Failure prevention �Sinusoidal vibration test � Engine excitation � Development
Introduction
Before been launched to the market, a new vehicle model is
required for passing all reliability and durability testing to
prevent failure before designed life. The testing is usually
conducted in three level sequences such as component
level, system level, and whole vehicle level.
A vibration test such as a sinusoidal sweep test or a
random vibration test is considered the most effective test
to validate durability of a component with the concern of
resonant fatigue. Compared with the random vibration test,
the sinusoidal sweep test is preferable for use in a product
subjected to periodic loading. Also, higher excitation lev-
els, as well as convenience of test setup and monitoring
make the sinusoidal vibration test to be the most popular
laboratory durability test [1–3].
Sinusoidal vibration test has been proposed for studying the
durability and reliability for several components [4–10], how-
ever rarely for engine mounted components. The International
Organization for Standardization (ISO) [11] introduces two
general sinusoidal vibration test profiles for studying the reli-
ability and durability of electrical and electric equipments
which experiences engine excitations. Unfortunately, the
standard fails to explain the procedures and criteria for devel-
oping the vibration profiles and other test parameters.
Moreover, engine mounted components will experience varied
engine excitations depends on the engine type and mounting
location. The presented vibration profiles in the standard may
L. Wang (&) � K. Li
Department of Mechanical Engineering, Oakland University,
Rochester, MI 48309, USA
e-mail: [email protected]
K. Li
e-mail: [email protected]
Y.-L. Lee � R. Burger
Stress Laboratory & Durability Development, Chrysler Group
LLC, Auburn Hills, MI 48326, USA
Y.-L. Lee
e-mail: [email protected]
R. Burger
e-mail: [email protected]
123
J Fail. Anal. and Preven. (2013) 13:227–240
DOI 10.1007/s11668-013-9661-x
not be representative for the actual vibration of the component.
Therefore, documentation with more detailed procedures and
explanations are needed for test engineers to produce their own
vibration profiles based on their test objectives’ field vibration
input. In this paper, a test method with detail procedures for
designing the sinusoidal vibration test is presented. The test
method is designed to fulfill an infinite life durability require-
ment for engine mounted components due to a four-stroke
internal combustion engine excitation. Besides the vibration
magnitudes and profiles, test parameters such as the choice of
sweep type, sweep time, frequency range, and test duration are
also discussed in the test method.
Besides the ISO standard, all proposed sinusoidal vibration
profiles for engine mounted components are single curve
where vibration amplitude sweeps from low frequency to high
frequency. Only one literature is found specifying a multiple
frequency sweep sinusoidal test for engine mounted compo-
nents [12]. However, the multiple sine vibration profiles are
specified by dividing the traditional single sine vibration
profile into several frequency intervals, and then run these
intervals simultaneously to reduce the test duration. This
algorithm mainly relies on the single sine vibration profile and
shaker controls for running the multiple intervals. In addition,
all proposed methodologies did not consider the engine firing
order effect. The order effect is the most distinguished char-
acter for vibrations in rotating machines such as engine. In this
paper, a new ordered multiple sinusoidal vibration test method
is proposed. The test method includes multiple sine vibration
profiles, and each sine vibration profile is determined corre-
sponding to one order of engine vibration. Instead of running
single sine vibration profile used in literatures [4–12], the
multiple sine vibration profiles representing dominant engine
vibration orders run simultaneously during the durability test.
In addition, the acceleration or displacement in the pre-
sented vibration profiles in literatures [4–12] was determined
by enveloping or averaging the frequency spectrum of the
vibration field data. This potentially leads to a non-conser-
vative test because it inherently underestimates the
magnitudes due to fast Fourier transform (FFT). In this paper,
the vibration magnitudes are determined from the time series
field data. The detailed methodology which analyzes the
vibration data in both time domain and the frequency domain
is presented. Finally, innovative vibration profiles based on
the time series vibration magnitudes are proposed for each
engine vibration order following detail procedures.
Multiple Sinusoidal Test Design Procedures
Engine Excitation and Data Processing
Engine mounted components experience mainly the engine
excitations, which are periodic in nature. Considering the
resonant fatigue, sinusoidal vibration test is designed for
studying the durability and reliability of the components.
This paper demonstrates the procedures of an improved test
method, which is designed to fulfill an infinite life durability
requirement for engine mounted components subjected to a
four-stroke internal combustion engine excitation.
To collect the field engine excitations experienced by
the engine mounted components, an engine dynamometer
test was conducted running from idle speed to the maxi-
mum engine speed on the four-stroke four-cylinder engine.
Engine block and cylinder head are the general two places
where accelerometers are installed during the dynamome-
ter test. The vibration measured at engine block indicates
the generic engine excitations. However, for some engine
mounted components, such as throttle body and exhaust
gas recirculation valves which are often cantilevered, the
engine excitations are usually measured at cylinder head.
In addition, installing of the accelerometer is critical when
engine excitation for specific engine mounted component is
required. The Z-axis of the accelerometer should be
installed parallel to the dominant vibration direction of the
component. For demonstrating purpose, an engine excita-
tion measured at engine block is used in this paper. The
engine speed and engine excitations in vertical, lateral and
longitudinal directions versus time are shown in Fig. 1.
Similar to other rotating machines, engine vibration data
shown in Fig. 1 includes higher order frequency contents.
These high-order frequency contents contribute little to
components’ fatigue damage because of the tiny vibration
magnitude. A Butterworth low pass filter is used to remove
them. Different criteria could be used for deciding the fil-
tering frequency. It could be selected as the high end of
components’ vibration frequency range. For example,
automotive vibrations are general low frequency vibra-
tions, whose frequency range is much lower than 500 Hz.
Thus a filtering frequency of 500 Hz is commonly used.
However, considering the fatigue damage due to the
vibration, an empirical criterion is utilized in this paper,
which assumes negligible fatigue damage would be
induced when the peak-to-peak displacement is lower than
0.005 inch.
For a sinusoidal vibration, the filtering frequency (f) is
correlated with the peak-to-peak displacement (Dp–p) and
the peak acceleration (Amax) as shown in Eq 1 considering
the units (peak acceleration in g and peak-to-peak dis-
placement in inch),
Dp�pðinÞ ¼AMax ðgÞ � 32:174 ft=s2 � 12
2p2f 2¼ AMax ðgÞ
0:0511f 2
ðEq 1Þ
As shown in Fig. 1, the peak accelerations (absolute
value) are 23.13, 18.94, and 15.48 g in the vertical, lateral
228 J Fail. Anal. and Preven. (2013) 13:227–240
123
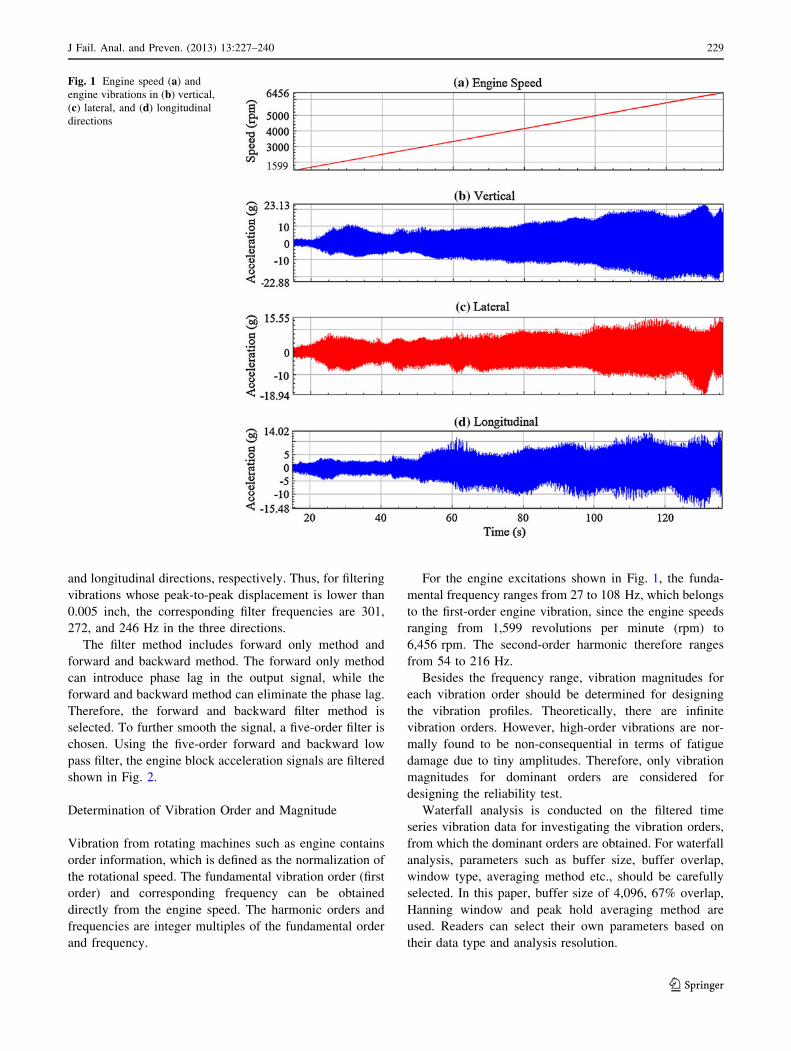
and longitudinal directions, respectively. Thus, for filtering
vibrations whose peak-to-peak displacement is lower than
0.005 inch, the corresponding filter frequencies are 301,
272, and 246 Hz in the three directions.
The filter method includes forward only method and
forward and backward method. The forward only method
can introduce phase lag in the output signal, while the
forward and backward method can eliminate the phase lag.
Therefore, the forward and backward filter method is
selected. To further smooth the signal, a five-order filter is
chosen. Using the five-order forward and backward low
pass filter, the engine block acceleration signals are filtered
shown in Fig. 2.
Determination of Vibration Order and Magnitude
Vibration from rotating machines such as engine contains
order information, which is defined as the normalization of
the rotational speed. The fundamental vibration order (first
order) and corresponding frequency can be obtained
directly from the engine speed. The harmonic orders and
frequencies are integer multiples of the fundamental order
and frequency.
For the engine excitations shown in Fig. 1, the funda-
mental frequency ranges from 27 to 108 Hz, which belongs
to the first-order engine vibration, since the engine speeds
ranging from 1,599 revolutions per minute (rpm) to
6,456 rpm. The second-order harmonic therefore ranges
from 54 to 216 Hz.
Besides the frequency range, vibration magnitudes for
each vibration order should be determined for designing
the vibration profiles. Theoretically, there are infinite
vibration orders. However, high-order vibrations are nor-
mally found to be non-consequential in terms of fatigue
damage due to tiny amplitudes. Therefore, only vibration
magnitudes for dominant orders are considered for
designing the reliability test.
Waterfall analysis is conducted on the filtered time
series vibration data for investigating the vibration orders,
from which the dominant orders are obtained. For waterfall
analysis, parameters such as buffer size, buffer overlap,
window type, averaging method etc., should be carefully
selected. In this paper, buffer size of 4,096, 67% overlap,
Hanning window and peak hold averaging method are
used. Readers can select their own parameters based on
their data type and analysis resolution.
Fig. 1 Engine speed (a) and
engine vibrations in (b) vertical,
(c) lateral, and (d) longitudinal
directions
J Fail. Anal. and Preven. (2013) 13:227–240 229
123
The waterfall analysis results in the vertical, lateral and
longitudinal directions are shown in Fig. 3a–c, respectively.
As shown, the second-order vibration is the most dominant
vibration. In the vertical direction, the dominant vibration
occurs at the high speed portion. While the dominant
vibrations in the lateral and longitudinal directions happen at
the lower and middle speed region. For the four-cylinder,
four-stroke engine, each cylinder is fired once for every two
revolutions of the crankshaft. Therefore, there will be two
firing pulses per engine rotation, which cause the dominant
vibration to occur at the second-order frequency range. The
gas pressure, which is the main engine excitation source, acts
in the vertical direction. Thus, vibrations in the vertical
direction are much higher than the other two directions. The
faster of the engine speed leads to more firing, which induces
higher vibrations. Therefore, dominant vibration is occurred
at the high speed region in the vertical direction as shown in
Fig. 3a. In the other two directions, since they do not directly
experience the firing pressure, vibrations measured in these
two directions do not increase as the engine speed is
Fig. 2 Low pass filtered
accelerations: (a) vertical
(b) lateral (c) longitudinal
230 J Fail. Anal. and Preven. (2013) 13:227–240
123
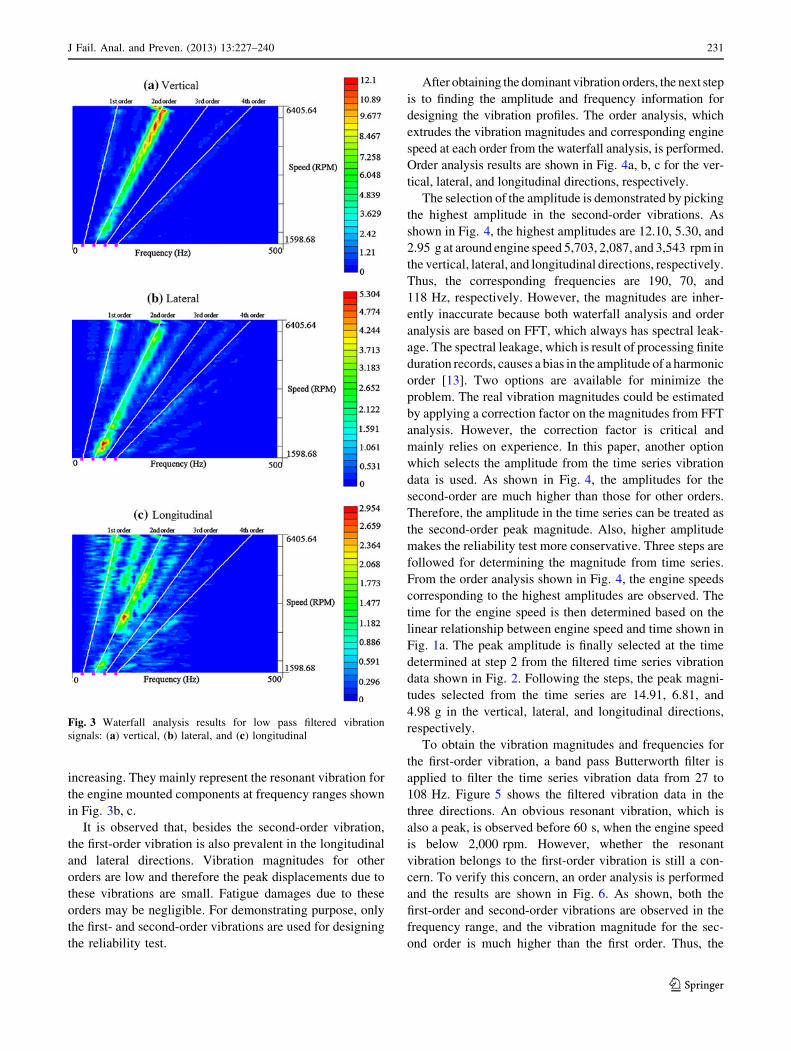
increasing. They mainly represent the resonant vibration for
the engine mounted components at frequency ranges shown
in Fig. 3b, c.
It is observed that, besides the second-order vibration,
the first-order vibration is also prevalent in the longitudinal
and lateral directions. Vibration magnitudes for other
orders are low and therefore the peak displacements due to
these vibrations are small. Fatigue damages due to these
orders may be negligible. For demonstrating purpose, only
the first- and second-order vibrations are used for designing
the reliability test.
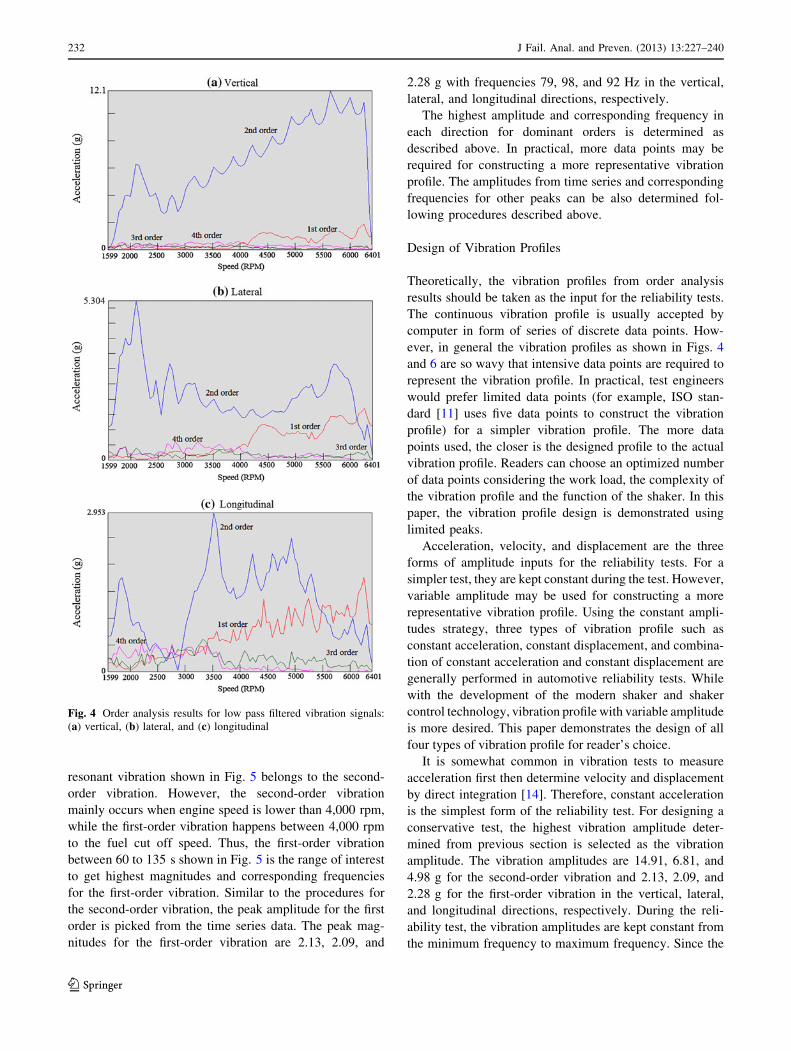
After obtaining the dominant vibration orders, the next step
is to finding the amplitude and frequency information for
designing the vibration profiles. The order analysis, which
extrudes the vibration magnitudes and corresponding engine
speed at each order from the waterfall analysis, is performed.
Order analysis results are shown in Fig. 4a, b, c for the ver-
tical, lateral, and longitudinal directions, respectively.
The selection of the amplitude is demonstrated by picking
the highest amplitude in the second-order vibrations. As
shown in Fig. 4, the highest amplitudes are 12.10, 5.30, and
2.95 g at around engine speed 5,703, 2,087, and 3,543 rpm in
the vertical, lateral, and longitudinal directions, respectively.
Thus, the corresponding frequencies are 190, 70, and
118 Hz, respectively. However, the magnitudes are inher-
ently inaccurate because both waterfall analysis and order
analysis are based on FFT, which always has spectral leak-
age. The spectral leakage, which is result of processing finite
duration records, causes a bias in the amplitude of a harmonic
order [13]. Two options are available for minimize the
problem. The real vibration magnitudes could be estimated
by applying a correction factor on the magnitudes from FFT
analysis. However, the correction factor is critical and
mainly relies on experience. In this paper, another option
which selects the amplitude from the time series vibration
data is used. As shown in Fig. 4, the amplitudes for the
second-order are much higher than those for other orders.
Therefore, the amplitude in the time series can be treated as
the second-order peak magnitude. Also, higher amplitude
makes the reliability test more conservative. Three steps are
followed for determining the magnitude from time series.
From the order analysis shown in Fig. 4, the engine speeds
corresponding to the highest amplitudes are observed. The
time for the engine speed is then determined based on the
linear relationship between engine speed and time shown in
Fig. 1a. The peak amplitude is finally selected at the time
determined at step 2 from the filtered time series vibration
data shown in Fig. 2. Following the steps, the peak magni-
tudes selected from the time series are 14.91, 6.81, and
4.98 g in the vertical, lateral, and longitudinal directions,
respectively.
To obtain the vibration magnitudes and frequencies for
the first-order vibration, a band pass Butterworth filter is
applied to filter the time series vibration data from 27 to
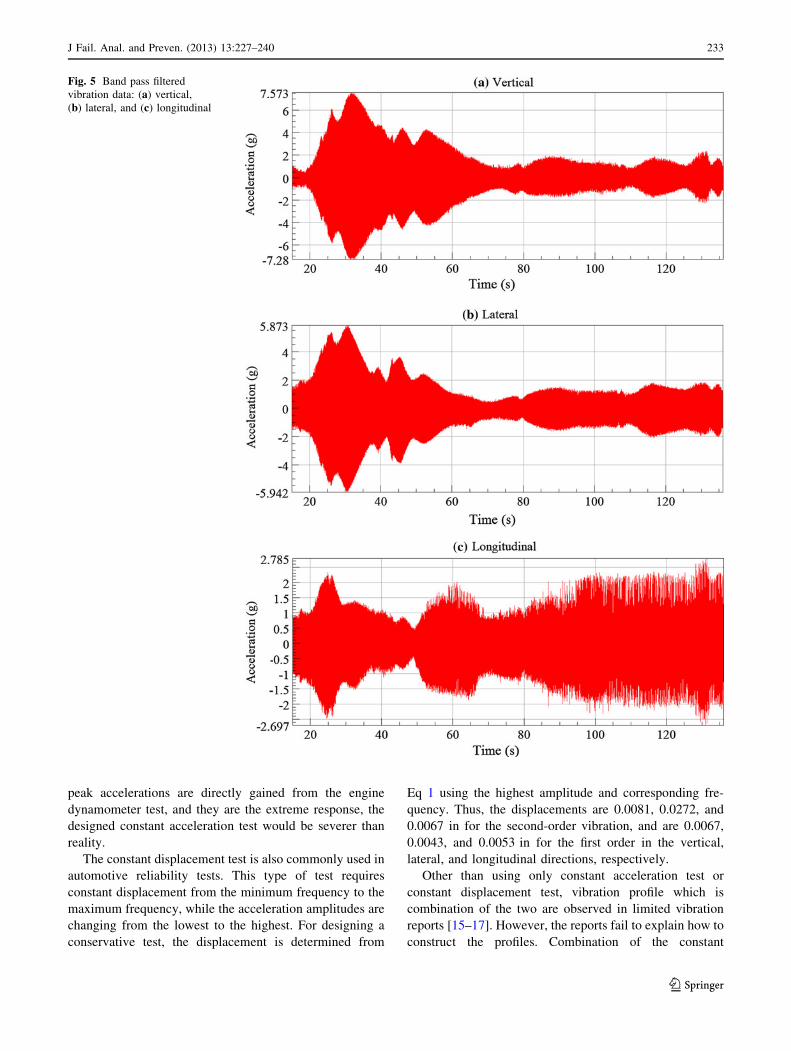
108 Hz. Figure 5 shows the filtered vibration data in the
three directions. An obvious resonant vibration, which is
also a peak, is observed before 60 s, when the engine speed
is below 2,000 rpm. However, whether the resonant
vibration belongs to the first-order vibration is still a con-
cern. To verify this concern, an order analysis is performed
and the results are shown in Fig. 6. As shown, both the
first-order and second-order vibrations are observed in the
frequency range, and the vibration magnitude for the sec-
ond order is much higher than the first order. Thus, the
Fig. 3 Waterfall analysis results for low pass filtered vibration
signals: (a) vertical, (b) lateral, and (c) longitudinal
J Fail. Anal. and Preven. (2013) 13:227–240 231
123
resonant vibration shown in Fig. 5 belongs to the second-
order vibration. However, the second-order vibration
mainly occurs when engine speed is lower than 4,000 rpm,
while the first-order vibration happens between 4,000 rpm
to the fuel cut off speed. Thus, the first-order vibration
between 60 to 135 s shown in Fig. 5 is the range of interest
to get highest magnitudes and corresponding frequencies
for the first-order vibration. Similar to the procedures for
the second-order vibration, the peak amplitude for the first
order is picked from the time series data. The peak mag-
nitudes for the first-order vibration are 2.13, 2.09, and
2.28 g with frequencies 79, 98, and 92 Hz in the vertical,
lateral, and longitudinal directions, respectively.
The highest amplitude and corresponding frequency in
each direction for dominant orders is determined as
described above. In practical, more data points may be
required for constructing a more representative vibration
profile. The amplitudes from time series and corresponding
frequencies for other peaks can be also determined fol-
lowing procedures described above.
Design of Vibration Profiles
Theoretically, the vibration profiles from order analysis
results should be taken as the input for the reliability tests.
The continuous vibration profile is usually accepted by
computer in form of series of discrete data points. How-
ever, in general the vibration profiles as shown in Figs. 4
and 6 are so wavy that intensive data points are required to
represent the vibration profile. In practical, test engineers
would prefer limited data points (for example, ISO stan-
dard [11] uses five data points to construct the vibration
profile) for a simpler vibration profile. The more data
points used, the closer is the designed profile to the actual
vibration profile. Readers can choose an optimized number
of data points considering the work load, the complexity of
the vibration profile and the function of the shaker. In this
paper, the vibration profile design is demonstrated using
limited peaks.
Acceleration, velocity, and displacement are the three
forms of amplitude inputs for the reliability tests. For a
simpler test, they are kept constant during the test. However,
variable amplitude may be used for constructing a more
representative vibration profile. Using the constant ampli-
tudes strategy, three types of vibration profile such as
constant acceleration, constant displacement, and combina-
tion of constant acceleration and constant displacement are
generally performed in automotive reliability tests. While
with the development of the modern shaker and shaker
control technology, vibration profile with variable amplitude
is more desired. This paper demonstrates the design of all
four types of vibration profile for reader’s choice.
It is somewhat common in vibration tests to measure
acceleration first then determine velocity and displacement
by direct integration [14]. Therefore, constant acceleration
is the simplest form of the reliability test. For designing a
conservative test, the highest vibration amplitude deter-
mined from previous section is selected as the vibration
amplitude. The vibration amplitudes are 14.91, 6.81, and
4.98 g for the second-order vibration and 2.13, 2.09, and
2.28 g for the first-order vibration in the vertical, lateral,
and longitudinal directions, respectively. During the reli-
ability test, the vibration amplitudes are kept constant from
the minimum frequency to maximum frequency. Since the
Fig. 4 Order analysis results for low pass filtered vibration signals:
(a) vertical, (b) lateral, and (c) longitudinal
232 J Fail. Anal. and Preven. (2013) 13:227–240
123
peak accelerations are directly gained from the engine
dynamometer test, and they are the extreme response, the
designed constant acceleration test would be severer than
reality.
The constant displacement test is also commonly used in
automotive reliability tests. This type of test requires
constant displacement from the minimum frequency to the
maximum frequency, while the acceleration amplitudes are
changing from the lowest to the highest. For designing a
conservative test, the displacement is determined from
Eq 1 using the highest amplitude and corresponding fre-
quency. Thus, the displacements are 0.0081, 0.0272, and
0.0067 in for the second-order vibration, and are 0.0067,
0.0043, and 0.0053 in for the first order in the vertical,
lateral, and longitudinal directions, respectively.
Other than using only constant acceleration test or
constant displacement test, vibration profile which is
combination of the two are observed in limited vibration
reports [15–17]. However, the reports fail to explain how to
construct the profiles. Combination of the constant
Fig. 5 Band pass filtered
vibration data: (a) vertical,
(b) lateral, and (c) longitudinal
J Fail. Anal. and Preven. (2013) 13:227–240 233
123
acceleration and constant displacement helps constructing
a vibration profile which is close to the actual vibration
profile. Therefore, in this section, design of vibration pro-
files which are schedule of constant acceleration and
constant displacement are demonstrated.
The strategy for designing a profile which is combina-
tion of constant acceleration and constant displacement is
explained as follows. For vibration acceleration signal
which is relatively flat and stable, a constant acceleration
test is desired. For acceleration signal which increases with
time or frequency, the constant displacement is more
desirable. For example, for vibration profile shown in
Fig. 4a, a constant displacement test is desired since
vibration acceleration increases with frequency. For the
first-order vibration in vertical and lateral directions as
shown in the right portion of Fig. 7a, b, a constant accel-
eration test is desired because the vibration acceleration is
stable.
Different from constant acceleration test and constant
displacement test, determination of the cross frequency
(amplitude) at which the profile changes from one type to
another is required for the combined constant displacement
and constant acceleration vibration profile. To determine
the cross frequency, the field vibration profile shown in
Figs. 4 and 7 are divided into several sections, each of
which will be constructed using either constant displace-
ment or constant acceleration. Determination of the cross
frequencies for vibration profile at each direction is dem-
onstrated using limited peaks from the field profile.
Readers can design their own vibration profiles for their
vibration field data using optimal data points following
same procedures described herein. As shown in Fig. 4a, for
the second-order vibration in the vertical direction, vibra-
tion amplitude increases at one rate from idle speed to
around 2,137 rpm. While another rate is observed from
2,500 rpm to the fuel cut off engine speed. Since vibration
amplitude increases with engine speed in both sections, two
constant displacement tests with varied displacement
amplitudes are designed to represent this vibration profile.
The frequency at engine speed 2,137 rpm is selected as the
cross frequency, which is 71 Hz. The section where
vibration drops from 2,137 to 2,500 rpm is simplified by
applying a constant displacement which is back extended
from the second portion of constant displacement. The
cross amplitude is determined from time series field data
following the three steps described previously. The peak
Fig. 6 Order analysis results for band pass filtered vibration signals:
(a) vertical, (b) lateral, and (c) longitudinal
Fig. 7 The designed second-order vibration profile in the vertical
direction using schedule of constant acceleration and constant
displacement
234 J Fail. Anal. and Preven. (2013) 13:227–240
123
acceleration is determined from Fig. 2a by finding the time
corresponding to engine speed at 2,137 rpm. Result shows
that the peak acceleration is 6.368 g. The peak-to-peak
displacement is then calculated from Eq 1 as 0.0323 in,
which is the constant displacement from 54 to 71 Hz. The
constant displacement from 71 to 216 Hz is same as the
displacement corresponding to the highest amplitude,
which is 0.0081 in. The second-order vibration profile in
the vertical direction is shown in Fig. 7. For comparison
purpose, vibration profile developed by using amplitudes
directly from order analysis result is also shown in Fig. 7 in
dash. It is clearly observed that vibration profile by using
time series amplitude is more conservative.
For the second-order vibration in the lateral direction,
the amplitude increases with engine speed until 2,087 rpm,
and tends to stabilize up to 6,400 rpm. Therefore, a con-
stant displacement test is designed for engine speed lower
than 2,087 rpm. The cross frequency is also the frequency
for the highest amplitude as shown in Fig. 4b, which is
70 Hz. The corresponding displacement, which is
0.0243 in, is therefore the constant displacement from 54
to 70 Hz. For frequency range from 70 to 216 Hz, a con-
stant acceleration test is designed since the vibration profile
is somewhat stable. The amplitude at engine speed
2,739 rpm is selected as the constant acceleration, which is
the peak amplitude between engine speed 2,087 to
6,400 rpm. From time series, the constant acceleration is
5.42 g. The second-order vibration profile in the lateral
direction is shown in Fig. 8.
For the second-order vibration in the longitudinal
direction, two constant displacement sections (1,599–
1,836 rpm and 2,740–3,543 rpm) are designed to represent
the two increase trend shown in Fig. 4c, and two constant
acceleration tests (3,543 to 5,301 rpm and 5,301 to
6,400 rpm) are used for the stable trend. The cross fre-
quencies for vibration profile in the longitudinal directions
are 61, 118, and 177 Hz. The peak accelerations picked
from time series corresponding to these cross frequencies
are 3.46, 4.98, and 2.82 g, respectively. Thus, the constant
displacement for the first portion is 0.0181 in, and
0.0070 in for the second portion of constant displacement.
The constant acceleration for the third portion is 3.33 g,
which is the peak between 3,543 and 5,301 rpm. For the
last portion, the peak acceleration is 2.82 g, which is the
peak time series vibration amplitude between 5,301 and
6,400 rpm. Figure 9 shows the designed second-order
vibration profile in the longitudinal direction.
For the first-order vibration, constant acceleration tests
are designed in the vertical and lateral directions. A con-
stant displacement test is designed in the longitudinal
direction. The constant accelerations in the vertical and
lateral directions are 2.13 and 2.09 g. The constant dis-
placement in the longitudinal direction is 0.0053 in from 27
to 108 Hz.
With the development of the shaker and modern shaker
control technologies, reliability tests with variable ampli-
tudes can be accomplished. Compared with the other three
types, vibration profile with variable amplitudes can be
closer to the actual vibration profile. Therefore, it is more
desirable for situation when field vibration profile is so
wavy that it cannot be constructed by constant amplitudes.
For example, none of the three types can represent the
profile that vibration amplitude decreases with increase of
frequency (speed) shown in Fig. 4.
The strategy for designing the variable amplitude
vibration profile is demonstrated as follows. The actual
vibration profile from order analysis is first divided into
several sections, which are differentiated by the vibration
trend such as increase, decrease or stable. In each section, a
line which connects two peaks is made to envelop the
vibration profile. Then, following the same steps described
previously, the amplitudes and frequencies at these two
Fig. 8 The designed second order vibration profile in the lateral
direction using schedule of constant acceleration and constant
displacement
Fig. 9 The designed second order vibration profile in the longitudinal
direction using schedule of constant acceleration and constant
displacement
J Fail. Anal. and Preven. (2013) 13:227–240 235
123

peaks are selected, and the equation of this linear curve is
performed for determining the amplitudes at the start and
end points of this section. For the stable vibration profile,
only peak amplitude in this section is needed and a constant
acceleration profile is constructed. Caution is needed for
determining the cross amplitude (frequency), because the
designed adjacent profiles may not have same amplitude at
the intersection. Process of this situation is demonstrated in
the following profile designs in the three directions.
In the vertical direction, the second-order vibration
profile shown in Fig. 4 has three obvious sections
(1,599–2,137, 2,137–2,639, 2,639–6,400 rpm) which are
differentiated as increase, decrease, and increase trend. In
the first section, two peaks at speed 2,086 and 2,137 rpm is
selected to build the envelop line. In the second section, the
two peaks are at speeds 2,137 and 2,486 rpm. And the
peaks are at speeds 3,092 and 5,703 rpm for the last sec-
tion. Following the three steps described previously, the
amplitudes picked from the filtered time series field data
are 8.10, 8.32, 5.33, 6.83, and 14.91 g at these speeds.
Therefore, the linear equation for each section can be
conducted, and amplitude at the start and end points of the
sections are calculated. Using the linear equation of the
first section, the amplitude at 54 Hz is calculated as 4.84 g.
However, at the intersection of section two and three (at
speed 2639 rpm), two amplitude values of 4.08 and 5.43 g
are calculated using the second and third linear equations
of the envelop curves. To make the two lines end at one
point, the line for the decrease section is lifted up so that it
still envelops the section. And the new line is connecting
(2,137 rpm, 8.32 g) with (2,639 rpm, 5.43 g). Therefore,
the vibration profile is designed connecting these points
and shown in Fig. 10. Also, for comparison purpose,
vibration profile developed by using amplitudes directly
from order analysis result is shown in Fig. 10 in dash.
Clearly, enveloping using time series amplitude is more
conservative.
In the lateral direction, the vibration profile is divided
into six sections (1,599–2,087, 2,087–2580, 2,739–3,644,
3,644–4,798, 4,698–5,703, and 5,703–6400 rpm). To avoid
the situation that the amplitudes at intersection are not
same, several simplifications are conducted. In the second
section from 2,087 to 2,580 rpm, instead of a long decrease
line enveloping this section, a shorter portion of decrease
line with same slope is used together with a constant
acceleration section, which has same amplitude as at speed
2,739 rpm. To keep the constant acceleration profile in the
fourth section from 3,644 to 4,698 rpm, the envelop curves
for the third and fifth section are made by connecting the
starting and ending points of each section. However, the
amplitudes for the end point of the third section and the
start point of the fifth section are selected as same as the
amplitude in the fourth section, which is 3.35 g. By doing
this, the problem that varied amplitudes are calculated at
the intersections is solved. Using the amplitudes taken from
the filtered time series data, the vibration profile for sec-
ond-order vibration in the lateral direction is shown in
Fig. 11.
In the longitudinal direction, same strategy is applied for
determine the sections and cross frequencies. However,
different from the other two directions, the second-order
vibration is in same level of magnitude as the first order at
the high frequency portion. Therefore, amplitudes picked
directly from time series are not dominant in second order
and cannot simply treat them as the second-order vibration
amplitudes. In this paper, we assume that the vibration
contents of the orders are same in both time series and FFT
results. For example, if there are only two orders and the
amplitudes of the orders are same in the FFT results, we
assume that the amplitude for each order is half of the
amplitude in the time series field vibration data. Thus, for
the second-order vibration, the amplitude at speed
2,740 rpm is quarter of 3.115 g picked from time series,
and the amplitude at speed 4,950 rpm is two thirds of
4.992 g selected from time series. The vibration profile for
the second-order vibration in the longitudinal direction is
shown in Fig. 12.
Determination of Test Time Duration
After defining the vibration profiles, determination of how
long the reliability tests should be run is demonstrated.
Factors affecting test time duration for sinusoidal vibration
reliability test are frequency range, test bogey, sweep time,
and sweep type.
The frequency range is defined as the range which
includes all possible resonant frequencies for initiating the
resonant fatigue of the reliability test components.Fig. 10 The designed second-order vibration profile in the vertical
direction using variable amplitudes
236 J Fail. Anal. and Preven. (2013) 13:227–240
123
Difference is observed for defining the frequency range in
traditional single curve and ordered multiple sinusoidal
vibration tests. The frequency range is defined as the
minimum frequency to the maximum frequency for tradi-
tional single curve vibration profile. For multiple orders
sinusoidal vibration tests, all the vibration orders run
simultaneously. Thus, the frequency range can be either 27
to 108 Hz or 54 to 216 Hz in this case.
Test bogey is defined as the number of cycles that the
objective component should be run during a reliability test.
In this paper, an infinite life test bogey is designed for the
engine mounted components. The number of cycles rep-
resenting infinite life, which corresponds to the fatigue
limit, depends on test objective’s material and manufac-
turing process. For example, one million cycles test usually
represent the infinite life for steel components, while ten
million cycles are needed for products made from alumi-
num material. For welded joint, five million cycles
represent the infinite life. For demonstrating purpose, a two
million cycles’ reliability test is designed in this paper.
Sweep time per sweep is a critical parameter for the
reliability test. It should not be so long that the physical
effects of the sequence between the larger amplitude and
the small amplitude are not produced. Also, it should not be
so short that the structure cannot reach the steady state
response [18]. The determination of the sweep time is
detailed explained in [18]. In this paper, a 30-min sweep
time is used for an example.
There are general two types of sweep method, the log-
arithmic sweep and the linear sweep. For the logarithmic
sweep, the number of cycles for each frequency interval is:
ni ¼Df
AðEq 2Þ
While for the linear sweep, the number of cycles for
each frequency interval is:
ni ¼Df
A0f ðEq 3Þ
where A ¼ ln fMaxð Þ � ln fMinð Þð Þ=T , A0 ¼ ðfMax � fMinÞ=T ,
Df is the frequency resolution, and T is the duration for
each sweep.
According to Eqs (2) and (3), there are same number of
cycles for given frequency increment using logarithmic
sweep, while more number of cycles are expected at higher
frequency using linear sweep.
Considering logarithmic sweep, the correlations among
the four factors affecting test duration are quantified as
shown in Eq 4:
TD ¼ ST� TBln fMaxð Þ � ln fMinð Þ
Df � T; ðEq 4Þ
Where TD is the test duration, ST is the sweep time, and
TB is the test bogey.
Knowing the frequency resolution Df in Eq 4, the test
duration is determined. For exciting all potential resonant
vibration, the frequency resolution for the sinusoidal
vibration is selected as the half power bandwidth of the
resonance, which is defined as the ratio of resonance fre-
quency and dynamic amplification factor. And the dynamic
amplification factor can be determined by the damping
coefficient. Selection of the damping coefficient is critical
and it depends on the application and experience. For
a system which is consisted of structural components,
a 2–3% damping coefficient value could be used. While for
a system with electronic devices such as the engine
mounted components, a value of 5% is commonly accep-
ted. For demonstrating purpose, the damping coefficient
value of 5% is used. Thus, a value of 10 is used for the
dynamic amplification factor.
The component’s resonant frequency is unknown, thus
the half power bandwidth can range from fMin=10 to
fMax=10. To make sure that the structure is excited, the
Fig. 11 The designed second-order vibration profile in the lateral
direction using variable amplitudes
Fig. 12 The designed second-order vibration profile in the longitu-
dinal direction using variable amplitudes
J Fail. Anal. and Preven. (2013) 13:227–240 237
123
minimum half power bandwidth is used. It is should be
mentioned that a different number of cycles would be
obtained if the first-order frequency range is input in Eq 4.
Since all vibration orders run simultaneously in the ordered
multiple sinusoidal test, only the frequency range for the
dominant vibration order is used to determine the number
of sweeps. Taking the parameters into (4), test duration for
the reliability test in each direction is 174 h.
Design of Accelerated Test
The test duration determined directly from previous section
in generally is so long that it is not economic. In practice,
accelerated vibration tests are designed and conducted. The
principle for accelerating the vibration test is the fatigue
damage equivalence technique which assumes same fati-
gue damage induced for originally designed test and
accelerated test. Factors for designing the accelerated test
are discussed in this section.
Assuming fatigue of the component follows the S–N
curve which relates stress magnitude with number of cycle
to failure. Thus, a scale factor defined as the ratio of the
stress magnitudes between the original designed test and
the accelerated test can be expressed in terms of the fatigue
strength exponent, b, as
Scale ¼ Saccelerated
Soriginal
¼ Naccelerated
Noriginal
� �b
ðEq 5Þ
Therefore, as shown in Eq 5, the reliability test can be
accelerated by scaling the load. At the same time, the
fatigue strength exponent will also contribute to the
acceleration of the test duration.
Assuming a single degree system, the fatigue damage is
proportional to number of cycles and stress amplitude [19].
Thus, stress magnitude should be exaggerated to reduce the
test time duration. However, the load scale should be
carefully selected for various reasons. First, the failure
mode change due to the exaggerated stress magnitude
should be avoided [20, 21]. For a specimen designed for
infinite life, the load in most of the service life is relatively
low. The accelerated test, however, increases these loads to
higher levels, which would cause failure differently from
real applications. Also, the vibration amplitudes such as the
peak-to-peak displacement and peak acceleration for the
accelerated test should not be scaled high enough to go
beyond the shaker limit. Thus, load scaling is generally
determined from experiences. For engine mounted com-
ponents, some companies recommend 94 h test time
duration for determining the scale.
The fatigue strength exponent is a fatigue property of a
material. Instead of a specific value, the exponent for a
material can be a range due to different manufacturing
processes. For example, fatigue strength exponent b ranges
from �0.195 to �0.043 for steel products from different
manufacturing processes [22]. On the other hand, the fatigue
strength exponent is failure mode dependent. For example, a
�0.17 to �0.2 value of fatigue strength exponent is usually
referred to metal fatigue failure. While a �0.33 value of
fatigue strength exponent indicates that the crack growth
behavior is dominant and the typical examples are fatigue of
welded joints, spot weld joints, and soldier joints.
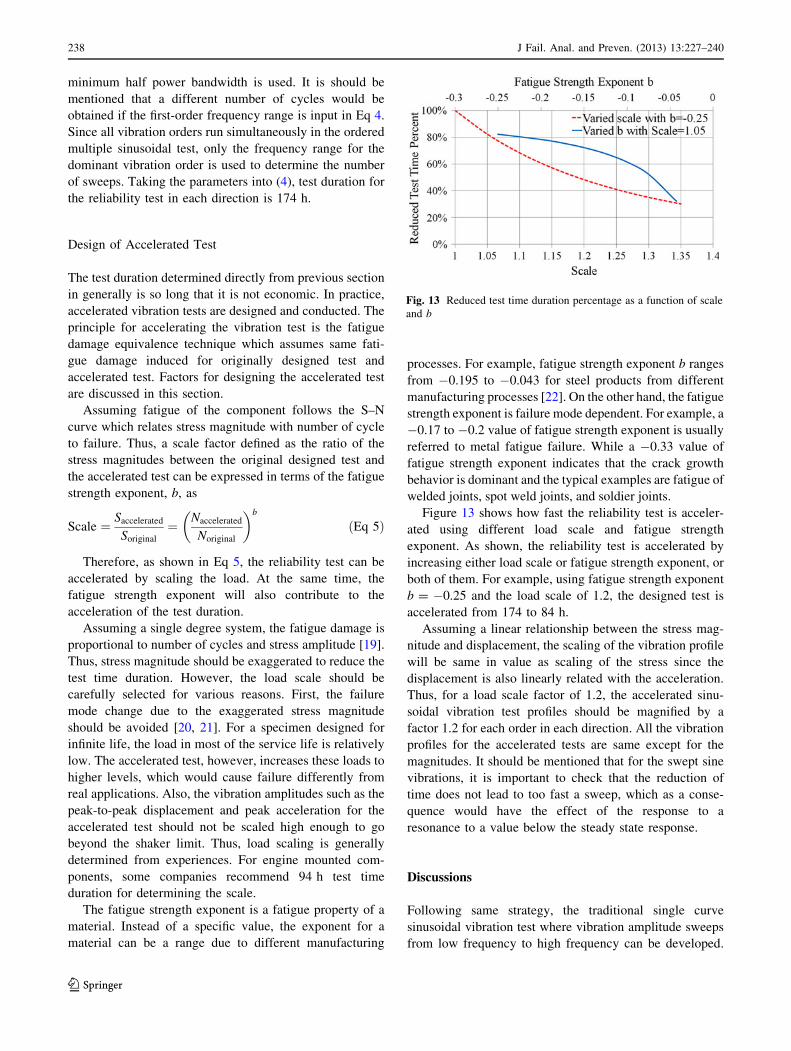
Figure 13 shows how fast the reliability test is acceler-
ated using different load scale and fatigue strength
exponent. As shown, the reliability test is accelerated by
increasing either load scale or fatigue strength exponent, or
both of them. For example, using fatigue strength exponent
b = �0.25 and the load scale of 1.2, the designed test is
accelerated from 174 to 84 h.
Assuming a linear relationship between the stress mag-
nitude and displacement, the scaling of the vibration profile
will be same in value as scaling of the stress since the
displacement is also linearly related with the acceleration.
Thus, for a load scale factor of 1.2, the accelerated sinu-
soidal vibration test profiles should be magnified by a
factor 1.2 for each order in each direction. All the vibration
profiles for the accelerated tests are same except for the
magnitudes. It should be mentioned that for the swept sine
vibrations, it is important to check that the reduction of
time does not lead to too fast a sweep, which as a conse-
quence would have the effect of the response to a
resonance to a value below the steady state response.
Discussions
Following same strategy, the traditional single curve
sinusoidal vibration test where vibration amplitude sweeps
from low frequency to high frequency can be developed.
Fig. 13 Reduced test time duration percentage as a function of scale
and b
238 J Fail. Anal. and Preven. (2013) 13:227–240
123
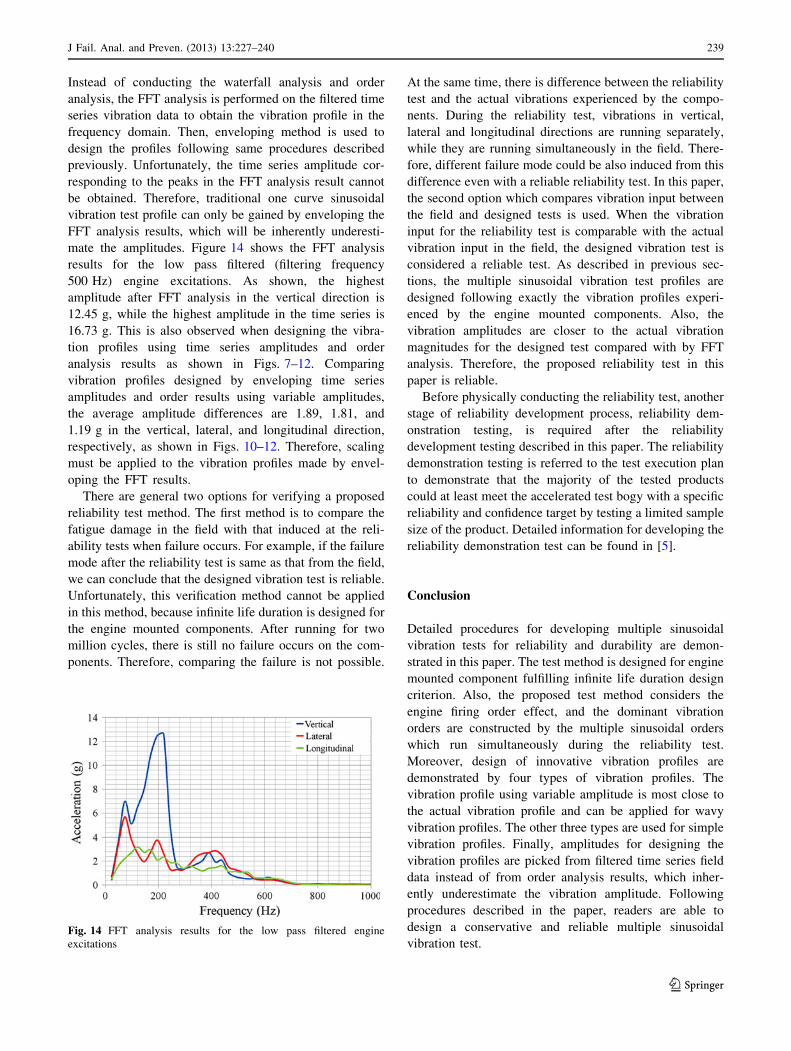
Instead of conducting the waterfall analysis and order
analysis, the FFT analysis is performed on the filtered time
series vibration data to obtain the vibration profile in the
frequency domain. Then, enveloping method is used to
design the profiles following same procedures described
previously. Unfortunately, the time series amplitude cor-
responding to the peaks in the FFT analysis result cannot
be obtained. Therefore, traditional one curve sinusoidal
vibration test profile can only be gained by enveloping the
FFT analysis results, which will be inherently underesti-
mate the amplitudes. Figure 14 shows the FFT analysis
results for the low pass filtered (filtering frequency
500 Hz) engine excitations. As shown, the highest
amplitude after FFT analysis in the vertical direction is
12.45 g, while the highest amplitude in the time series is
16.73 g. This is also observed when designing the vibra-
tion profiles using time series amplitudes and order
analysis results as shown in Figs. 7–12. Comparing
vibration profiles designed by enveloping time series
amplitudes and order results using variable amplitudes,
the average amplitude differences are 1.89, 1.81, and
1.19 g in the vertical, lateral, and longitudinal direction,
respectively, as shown in Figs. 10–12. Therefore, scaling
must be applied to the vibration profiles made by envel-
oping the FFT results.
There are general two options for verifying a proposed
reliability test method. The first method is to compare the
fatigue damage in the field with that induced at the reli-
ability tests when failure occurs. For example, if the failure
mode after the reliability test is same as that from the field,
we can conclude that the designed vibration test is reliable.
Unfortunately, this verification method cannot be applied
in this method, because infinite life duration is designed for
the engine mounted components. After running for two
million cycles, there is still no failure occurs on the com-
ponents. Therefore, comparing the failure is not possible.
At the same time, there is difference between the reliability
test and the actual vibrations experienced by the compo-
nents. During the reliability test, vibrations in vertical,
lateral and longitudinal directions are running separately,
while they are running simultaneously in the field. There-
fore, different failure mode could be also induced from this
difference even with a reliable reliability test. In this paper,
the second option which compares vibration input between
the field and designed tests is used. When the vibration
input for the reliability test is comparable with the actual
vibration input in the field, the designed vibration test is
considered a reliable test. As described in previous sec-
tions, the multiple sinusoidal vibration test profiles are
designed following exactly the vibration profiles experi-
enced by the engine mounted components. Also, the
vibration amplitudes are closer to the actual vibration
magnitudes for the designed test compared with by FFT
analysis. Therefore, the proposed reliability test in this
paper is reliable.
Before physically conducting the reliability test, another
stage of reliability development process, reliability dem-
onstration testing, is required after the reliability
development testing described in this paper. The reliability
demonstration testing is referred to the test execution plan
to demonstrate that the majority of the tested products
could at least meet the accelerated test bogy with a specific
reliability and confidence target by testing a limited sample
size of the product. Detailed information for developing the
reliability demonstration test can be found in [5].
Conclusion
Detailed procedures for developing multiple sinusoidal
vibration tests for reliability and durability are demon-
strated in this paper. The test method is designed for engine
mounted component fulfilling infinite life duration design
criterion. Also, the proposed test method considers the
engine firing order effect, and the dominant vibration
orders are constructed by the multiple sinusoidal orders
which run simultaneously during the reliability test.
Moreover, design of innovative vibration profiles are
demonstrated by four types of vibration profiles. The
vibration profile using variable amplitude is most close to
the actual vibration profile and can be applied for wavy
vibration profiles. The other three types are used for simple
vibration profiles. Finally, amplitudes for designing the
vibration profiles are picked from filtered time series field
data instead of from order analysis results, which inher-
ently underestimate the vibration amplitude. Following
procedures described in the paper, readers are able to
design a conservative and reliable multiple sinusoidal
vibration test.Fig. 14 FFT analysis results for the low pass filtered engine
excitations
J Fail. Anal. and Preven. (2013) 13:227–240 239
123

Acknowledgments The authors acknowledge the product and
technical support from HBM-nCode’s. L. Wang acknowledges the
scholarship from China Scholarship Council.
References
1. Jayahari, L., Praveen, G.: Correlation of sinusoidal sweep test to
field random vibrations. Master thesis, Blekinge Institute of
Technology, Karlskrona, Sweden (2005)
2. Hu, J.M.: Method to specify sinusoidal vibration tests for product
durability validation. U. S. Patent 5565618 (1996)
3. Hu, J.M.: Computer program, system and method to specify
sinusoidal vibration tests for product durability validation. U. S.
Patent 5847259 (1998)
4. Lee, Y.L., Polehna, D., Kang, H.T.: Fatigue damage severity cal-
culation for vibration tests. J. Test. Eval. 38(6), 707–716 (2010)
5. Lee Y.L., Pan Y.L., Hathaway, R., Barkey, M.: Fatigue Testing
and Analysis: Theory and Practice, Chap. 10. Elsevier Butter-
worth-Heinemann, London (2005)
6. Lee, Y.L., Barkey, M.E., Kang, H.: Metal Fatigue Analysis
Handbook: Practical Problem-Solving Techniques for Computer-
Aided Engineering, Chap. 9. Elsevier, Oxford (2011)
7. Fibre Optic Interconnecting Devices and Passive Components-
Basic Test and Measurement Procedures—Part 2-1: Tests
Vibration (Sinusoidal). IEC Standard 61300-2-1, International
Electrotechnical Commission (2004)
8. Napolitano, K., Linehan, D.: Multiple sine sweep excitation for
ground vibration tests. In: Proceedings of the 27th Conference
and Exposition on Structural Dynamics, Orlando, Florida, 2009
9. A New MIMO Sine Testing Technique for Accelerated, High
Quality FRF Measurements. LMS International, Leuven (2006)
10. Sinusoidal vibration. NASA Practice PT-TE-1406, NASA (1999)
11. Road Vehicles-Environmental Conditions And Testing For
Electrical And Electronic Equipment—Part 3: Mechanical loads.
ISO Standard 16750-3. International Organization for Standard-
ization (2007)
12. Reilly, T.J.: Multi Frequency Swept Sine Testing for Automotive
Durability Testing of Engine Mounted Components. SAE Tech-
nical Paper 2011-01-1658
13. Harris, C.M., Piersol, A.G.: Harris’ Shock and Vibration Hand-
book, Chap. 20. McGraw-Hill, New York (2002)
14. De Silva, C.W.: Vibration: Fundamentals and Practice, Chap. 8.
CRC Press, New York (1999)
15. Automotive Vehicles Recording Equipment in Road Vehicles
(tachograph). AIS Standard 059. The Automotive Research
Association of India, Pune (2005)
16. Test on the ‘‘or Gate’’-Cern-NP Type N4132. Technical Report
No. 11. European Organization for Nuclear Research, Meyrin
(1967)
17. Curtis, A.J., Tlnllng, N.G., Abstein, H.T.: Selection and perfor-
mance of vibration tests. Hughes Aircraft Company, Fullerton
(1971)
18. Cronin, D.L.: Response Spectra for Sweeping Sinusoidal Exci-
tations. Shock Vib. Bull. 38(1), 133–139 (1968)
19. Lalanne, C.: Mechanical Vibration and Shock Analysis: Sinu-
soidal Vibration, Chap. 4. ISTE Ltd., London (2009)
20. HalfPenny, A., Walton, T.C.: New techniques for vibration
qualification of vibrating equipment on aircraft. In: Proceedings
Aircraft Airworthiness & Sustainment 2010, Austin, Texas
21. Piersol, A.G.: Accelerated vibration testing-proceed with caution.
Tustin Training News (1993)
22. Technical Report on Low Cycle Fatigue Properties Ferrous and
Non-Ferrous of Materials. SAE Standard J1099. SAE Interna-
tional, Seoul (2002)
240 J Fail. Anal. and Preven. (2013) 13:227–240
123


![NASA Standards Mechanical tests – Strength – Sinusoidal sweep vibration (5 to 50 hertz [Hz]) ELV and STS payloads – Random vibration and acoustics – Shock](https://img.dokumen.tips/doc/110x75/56649cff5503460f949cfe0b/nasa-standards-mechanical-tests-strength-sinusoidal-sweep-vibration.jpg)