Embed Size (px)
Citation preview
U.S. International Trade CommissionPublication 4746 December 2017
Washington, DC 20436
Multilayered Wood Flooring from China
Investigation Nos. 701-TA-476 and 731-TA-1179 (Review)
U.S. International Trade Commission
COMMISSIONERS
Rhonda K. Schmidtlein, Chairman David S. Johanson, Vice Chairman
Irving A. Williamson Meredith M. Broadbent
Catherine DeFilippo
Staff assigned
Address all communications to Secretary to the Commission
United States International Trade Commission Washington, DC 20436
Director of Operations
Drew Dushkes, Investigator Joanna Lo, Investigator
Sarah Scott, Industry Analyst Craig Thomsen, Economist David Boyland, Accountant Mara Alexander, Statistician
Courtney McNamara, Attorney Douglas Corkran, Supervisory Investigator
U.S. International Trade CommissionWashington, DC 20436
www.usitc.gov
Publication 4746 December 2017
Multilayered Wood Flooring from China
Investigation Nos. 701-TA-476 and 731-TA-1179 (Review)

CONTENTS Page
i
Determinations ..................................................................................................................... 1
Views of the Commission ....................................................................................................... 3
Part I: Introduction .............................................................................................................. I-1
Background ................................................................................................................................ I-1
The original investigations ..................................................................................................... I-2
Subsequent proceedings ....................................................................................................... I-3
Related investigations ............................................................................................................... I-4
Summary data ........................................................................................................................... I-5
Statutory criteria and organization of the report ..................................................................... I-8
Statutory criteria ................................................................................................................... I-8
Organization of report ........................................................................................................... I-9
Commerce’s reviews ............................................................................................................... I-10
Administrative reviews ........................................................................................................ I-10
Changed circumstances reviews ......................................................................................... I-13
Five-year reviews ................................................................................................................. I-13
The subject merchandise ........................................................................................................ I-15
Commerce’s scope .............................................................................................................. I-15
Tariff treatment ................................................................................................................... I-17
The product ............................................................................................................................. I-18
Description and applications ............................................................................................... I-18
Manufacturing processes .................................................................................................... I-20
Domestic like product issues ................................................................................................... I-22
U.S. market participants .......................................................................................................... I-23
U.S. producers ..................................................................................................................... I-23
U.S. importers ...................................................................................................................... I-25
U.S. purchasers .................................................................................................................... I-27
CONTENTS Page
ii
Apparent U.S. consumption .................................................................................................... I-28
U.S. market shares .................................................................................................................. I-29
U.S. shipments by product type .............................................................................................. I-30
Part II: Conditions of competition in the U.S. market........................................................... II-1
U.S. market characteristics....................................................................................................... II-1
Channels of distribution ........................................................................................................... II-1
Geographic distribution ........................................................................................................... II-2
Supply and demand considerations ......................................................................................... II-3
U.S. supply ............................................................................................................................ II-3
U.S. demand ......................................................................................................................... II-7
Substitutability issues ............................................................................................................. II-15
Lead times .......................................................................................................................... II-15
Knowledge of country sources ........................................................................................... II-15
Factors affecting purchasing decisions............................................................................... II-16
Comparisons of domestic products, subject imports, and nonsubject imports ................ II-22
Comparison of U.S.-produced and imported MLWF .......................................................... II-24
Elasticity estimates ................................................................................................................. II-26
U.S. supply elasticity ........................................................................................................... II-26
U.S. demand elasticity ........................................................................................................ II-27
Substitution elasticity ......................................................................................................... II-27
Part III: Condition of the U.S. industry ................................................................................ III-1
Overview ................................................................................................................................. III-1
Changes experienced by the industry ................................................................................. III-3
Anticipated changes in operations ...................................................................................... III-4
U.S. production, capacity, and capacity utilization ................................................................. III-5
Constraints on capacity ....................................................................................................... III-7
U.S. producers’ U.S. shipments and exports ........................................................................... III-7
U.S. producers’ inventories ..................................................................................................... III-9
U.S. producers’ imports and purchases .................................................................................. III-9
CONTENTS Page
iii
U.S. employment, wages, and productivity .......................................................................... III-10
Financial experience of U.S. producers ................................................................................. III-12
Background ........................................................................................................................ III-12
Operations on MLWF ........................................................................................................ III-12
Capital expenditures and research and development expenses ...................................... III-17
Assets and return on investment ...................................................................................... III-18
Part IV: U.S. imports and the foreign industries .................................................................. IV-1
U.S. imports ............................................................................................................................. IV-1
Overview .............................................................................................................................. IV-1
Imports from subject and nonsubject countries ................................................................. IV-2
U.S. importers’ imports subsequent to June 30, 2017 ........................................................... IV-4
U.S. importers’ inventories ..................................................................................................... IV-5
The industry in China ............................................................................................................... IV-7
Overview .............................................................................................................................. IV-7
Operations on MLWF .......................................................................................................... IV-8
Exports ............................................................................................................................... IV-12
Antidumping or countervailing duty orders in third-country markets ................................. IV-13
Global market ........................................................................................................................ IV-13
Consumption ..................................................................................................................... IV-17
Prices ................................................................................................................................. IV-18
Part V: Pricing data ............................................................................................................. V-1
Factors affecting prices ............................................................................................................ V-1
Raw material costs ............................................................................................................... V-1
Transportation costs to the U.S. market .............................................................................. V-2
U.S. inland transportation costs ........................................................................................... V-2
Pricing practices ....................................................................................................................... V-2
Pricing methods .................................................................................................................... V-2
Sales terms and discounts .................................................................................................... V-4
Price leadership .................................................................................................................... V-5
CONTENTS Page
iv
Price data .................................................................................................................................. V-6
Price trends ......................................................................................................................... V-16
Price comparisons .............................................................................................................. V-17
Purchasers’ perceptions of relative price trends ............................................................... V-19
Foreign producers’ perceptions of home market and relative prices ............................... V-19
Appendixes
A. Federal Register notices ................................................................................................. A-1
B. List of hearing witnesses ................................................................................................ B-1
C. Summary data ................................................................................................................ C-1
D. Comments on the effects of the orders and the likely effects of revocation ................ D-1
E. Purchasers’ comments regarding changes in the U.S. industry since January 1, 2011 and anticipated changes ................................................................................................. E-1
F. Data concerning U.S. producers’ U.S. imports ............................................................... F-1
Note.—Information that would reveal confidential operations of individual concerns may not be published and therefore has been deleted. Such deletions are indicated by asterisks.
1
UNITED STATES INTERNATIONAL TRADE COMMISSION
Investigation Nos. 701-TA-476 and 731-TA-1179 (Review) Multilayered Wood Flooring from China
DETERMINATIONS
On the basis of the record1 developed in the subject five-year reviews, the United States International Trade Commission (“Commission”) determines, pursuant to the Tariff Act of 1930 (“the Act”), that revocation of the antidumping and countervailing duty orders on multilayered wood flooring from China would be likely to lead to continuation or recurrence of material injury to an industry in the United States within a reasonably foreseeable time.
BACKGROUND
The Commission, pursuant to section 751(c) of the Act (19 U.S.C. 1675(c)), instituted these reviews on November 1, 2016 (81 F.R. 75854) and determined on February 6, 2017 that it would conduct full reviews (82 F.R. 10588, February 14, 2017). Notice of the scheduling of the Commission’s reviews and of a public hearing to be held in connection therewith was given by posting copies of the notice in the Office of the Secretary, U.S. International Trade Commission, Washington, DC, and by publishing the notice in the Federal Register on June 16, 2017 (82 F.R. 27722). The hearing was held in Washington, DC, on October 12, 2017, and all persons who requested the opportunity were permitted to appear in person or by counsel.
1 The record is defined in sec. 207.2(f) of the Commission’s Rules of Practice and Procedure
(19 CFR 207.2(f)).

3
Views of the Commission
Based on the record in these five-year reviews, we determine under section 751(c) of the Tariff Act of 1930, as amended (“the Tariff Act”), that revocation of the antidumping duty and countervailing duty orders on multilayered wood flooring (“MLWF”) from China would be likely to lead to continuation or recurrence of material injury to an industry in the United States within a reasonably foreseeable time.
Background I.
In response to the antidumping duty and countervailing duty petitions filed by the Coalition for American Hardwood Parity (“CAHP”) and its members on October 21, 2010,1 the Commission determined in November 2011 that an industry in the United States was materially injured by reason of imports of MLWF from China that the U.S. Department of Commerce (“Commerce”) had determined were sold in the United States at less than fair value and subsidized by the government of China.2 Commerce issued antidumping duty and countervailing duty orders on December 8, 2011.3
1 In the original investigations, CAHP’s members included Anderson Hardwood Floors, LLC, Award Hardwood Floors, From the Forest, Howell Hardwood Flooring, Mannington, Nydree Flooring, and Shaw. Confidential Report (“CR”) and Public Report (“PR”) at I-2 n.6.
2 Multilayered Wood Flooring from China, Inv. Nos. 701-TA-476 and 731-TA-1179 (Final), USITC Pub. 4278 (Nov. 2011) (“Original Determinations”).
3 76 Fed. Reg. 76693 (countervailing duty order); 76 Fed. Reg. 76690 (antidumping duty order). Commerce subsequently published an amended countervailing duty order which removed two firms from the non-cooperative firms list. Multilayered Wood Flooring from the People’s Republic of China: Notice of Court Decision Not in Harmony with Final Determination of Countervailing Duty Investigation and Notice of Amended Countervailing Duty Order, 77 Fed. Reg. 71167 (Dep’t of Commerce Nov. 29, 2012). In addition, following litigation, Commerce amended the final determination and antidumping duty order and revised the mandatory respondents’ dumping margins, finding all three to be zero or de minimis, and revised the China-wide dumping margin. The two mandatory respondents that received de minimis margins were Zhejiang Layo Wood Industry Co., Ltd. (“Layo”) and the Samling Group. Multilayered Wood Flooring from the People’s Republic of China: Notice of Court Decision Not in Harmony with the Final Determination and Notice of Amended Final Determination of the Antidumping Duty Investigation, 79 Fed. Reg. 25109 (Dep’t of Commerce May 2, 2014); Multilayered Wood Flooring From the People's Republic of China: Notice of Court Decision Not in Harmony With the Final Determination and Amended Final Determination of the Antidumping Duty Investigation, 80 Fed. Reg. 44029 (Dep’t of Commerce July 24, 2015). Two firms, Layo and Yuhua Timber Co., Ltd (“Yuhua”), received de minimis final antidumping and countervailing duty margins, thereby excluding their imports of MLWF from both the antidumping and countervailing duty orders. Yuhua received de minimis final margins in the original orders, while Layo received a de minimis final countervailing duty margin in the original countervailing duty order, but received a de minimis final antidumping duty margin in the amended antidumping duty order. 76 Fed. Reg. 76693; 76 Fed. Reg. 76690; 79 Fed. Reg. 25109.
4
Six U.S. importers subsequently challenged the Commission’s affirmative determinations before the U.S. Court of International Trade (“CIT”). The CIT remanded four issues and affirmed the Commission’s determinations in all other respects.4 On remand, the Commission again determined that an industry in the United States was materially injured by reason of subject imports of MLWF from China.5 The Commission’s remand determinations were subsequently affirmed by the CIT and the U.S. Court of Appeals for the Federal Circuit.6
On November 1, 2016, the Commission instituted these reviews pursuant to section 751(c) of the Tariff Act.7 The Commission received a response to the notice of institution from CAHP. The Commission also received three responses to the notice of institution from respondent interested parties. One was a joint response to the notice of institution from 17 producers and exporters of MLWF from China.8 A second was filed by Lumber Liquidators, LLC (“Lumber Liquidators”), an importer of MLWF. The third was a joint response filed by nine importers of subject merchandise.9 On February 6, 2017, the Commission found that both the domestic interested party and respondent interested party group responses to the notice of
4 Swiff-Train Co. v. United States, 904 F. Supp. 2d 1336 (Ct. Int’l Trade 2013). Specifically, the CIT’s remand order required the Commission to (1) analyze and reconsider “its decision not to investigate domestic producers of hardwood plywood used for flooring;” (2) “make findings on the issue of price suppression/depression;” (3) “re-evaluate whether the subject imports were the ‘but-for’ cause of material injury to the domestic industry;” and (4) explain “the impact of subject imports had on the domestic industry in light of the {the} collapse of the housing market during the period of investigation.” Id.
5 Multilayered Wood Flooring from China, Inv. Nos. 701-TA-476 and 731-TA-1179 (Remand), USITC Pub. 4430 (Oct. 2013) (“Remand Determinations”).
6 Swiff-Train Co. v. United States, 999 F. Supp. 2d 1334 (Ct. Int’l Trade 2014), aff’d, 793 F.3d 1355 (Fed. Cir. 2015).
7 Multilayered Wood Flooring from China: Institution of Five-Year Reviews, 81 Fed. Reg. 75854 (Nov. 2, 2016).
8 The 17 producers and exporters are Dalian Kemian Wood Industry Co., Ltd.; Fujian Wuyishan Werner Green Industry Co., Ltd.; Fusong Jinlong Group Co., Ltd.; Hangzhou Dasuo Technology Co., Ltd.; Jesonwood Forest; Products (ZJ) Co., Ltd.; Jiangsu Senmao Bamboo and Woods Industry Co., Ltd.; Jilin Forest Industry Jinqiao Flooring Group Co., Ltd.; Kemian Wood Industry (Kunshan) Co., Ltd.; Linyi Youyou Wood Inc.; Metropolitian Hardwood Floors, Inc.; Mudanjiang Bosen Wood Industry Co., Ltd.; Nakahiro Jyou Sei Furniture (Dalian) Co., Ltd.; Qingdao Barry; Shanghai Lairunde Wood Co., Ltd.; Shenyang Haobainian Wooden Co., Ltd.; Shenzhenshi Huanwei Woods Co., Ltd.; and Zhejiang Dadongwu GreenHome Wood, Co., Ltd.
9 The nine importers are Creative At Home, Inc. & Creative At Home USA, Inc.; Crescent Hardwood Supply; CLBY Inc. (d/b/a D&M Flooring); Floor and Décor Outlets of America, Inc.; Johnson’s Premium Hardwood Flooring; Metropolitan Hardwood Floors (US) Inc.; Real Wood Floors; Regal Hardwoods, Inc.; and V.A.L. Floors, Inc.
5
institution were adequate. Accordingly, the Commission determined to conduct to full reviews of the orders on MLWF from China.10
The Commission received prehearing and posthearing submissions from CAHP on behalf of its members, which are domestic producers of MLWF.11 The Commission also received prehearing and posthearing submissions from the Alliance for Free Choice and Jobs In Flooring (“the Alliance”), an ad hoc group of importers, exporters, and purchasers of MLWF, and Lumber Liquidators. Representatives of CAHP and the Alliance appeared at the Commission’s hearing accompanied by counsel.
U.S. industry data are based on the questionnaire responses of 11 U.S. producers of MLWF that are believed to account for the vast majority of domestic production of MLWF in 2016.12 U.S. import data and related information are based on official import statistics and the questionnaire responses of 48 U.S. importers of MLWF that accounted for the majority of subject imports during 2016.13 Foreign industry data and related information are based on the questionnaire responses of 11 producers and exporters of MLWF in China, whose reported exports to the United States were equivalent to 9.6 percent of reported subject imports in 2016.14
Domestic Like Product and Industry II.
A. Domestic Like Product
In making its determination under section 751(c) of the Tariff Act, the Commission defines the “domestic like product” and the “industry.”15 The Tariff Act defines “domestic like product” as “a product which is like, or in the absence of like, most similar in characteristics and uses with, the article subject to an investigation under this subtitle.”16 The Commission’s practice in five-year reviews is to examine the domestic like product definition from the original
10 Multilayered Wood Flooring from China; Notice of Commission Determination to Conduct Full Five-Year Reviews, 82 Fed. Reg. 10588 (Feb. 14, 2017). See also Explanation of Commission Determination on Adequacy, EDIS Doc. 603409.
11 CAHP’s members include Cumberland Products Group, LLC d/b/a American OEM Wood Floors (“American OEM”); Mannington Mills, Inc. (“Mannington”); Mohawk Industries, Inc. (“Mohawk”); and Shaw Industries Group, Inc. (“Shaw”). CAHP’s Prehearing Br. at 1 n.3.
12 CR at I-29; PR at I-23. 13 CR/PR at IV-1. 14 CR at IV-8; PR at IV-7. 15 19 U.S.C. § 1677(4)(A). 16 19 U.S.C. § 1677(10); see, e.g., Cleo Inc. v. United States, 501 F.3d 1291, 1299 (Fed. Cir. 2007);
NEC Corp. v. Department of Commerce, 36 F. Supp. 2d 380, 383 (Ct. Int’l Trade 1998); Nippon Steel Corp. v. United States, 19 CIT 450, 455 (1995); Timken Co. v. United States, 913 F. Supp. 580, 584 (Ct. Int’l Trade 1996); Torrington Co. v. United States, 747 F. Supp. 744, 748-49 (Ct. Int’l Trade 1990), aff’d, 938 F.2d 1278 (Fed. Cir. 1991); see also S. Rep. No. 249, 96th Cong., 1st Sess. 90-91 (1979).
6
investigation and consider whether the record indicates any reason to revisit the prior findings.17
Commerce has defined the imported merchandise within the scope of the orders under review as follows:
{M}ultilayered wood flooring is composed of an assembly of two or more layers or plies of wood veneer(s) in combination with a core. The several layers, along with the core, are glued or otherwise bonded together to form a final assembled product. Multilayered wood flooring is often referred to by other terms, e.g., ‘‘engineered wood flooring’’ or ‘‘plywood flooring.’’ Regardless of the particular terminology, all products that meet the description set forth herein are intended for inclusion within the definition of subject merchandise. All multilayered wood flooring is included within the definition of subject merchandise, without regard to: Dimension (overall thickness, thickness of face ply, thickness of back ply, thickness of core, and thickness of inner plies; width; and length); wood species used for the face, back and inner veneers; core composition; and face grade. Multilayered wood flooring included within the definition of subject merchandise may be unfinished (i.e., without a finally finished surface to protect the face veneer from wear and tear) or ‘‘prefinished’’ (i.e., a coating applied to the face veneer, including, but not exclusively, oil or oil-modified or water-based polyurethanes, ultraviolet light cured polyurethanes, wax, epoxy-ester finishes, moisture-cured urethanes and acid-curing formaldehyde finishes). The veneers may be also soaked in an acrylic-impregnated finish. All multilayered wood flooring is included within the definition of subject merchandise regardless of whether the face (or back) of the product is smooth, wire brushed, distressed by any method or multiple methods, or hand-scraped. In addition, all multilayered wood flooring is included within the definition of subject merchandise regardless of whether or not it is manufactured with any interlocking or connecting mechanism (for example, tongue-and-groove construction or locking joints). All multilayered wood flooring is
17 See, e.g., Internal Combustion Industrial Forklift Trucks from Japan, Inv. No. 731-TA-377 (Second Review), USITC Pub. 3831 at 8-9 (Dec. 2005); Crawfish Tail Meat from China, Inv. No. 731-TA-752 (Review), USITC Pub. 3614 at 4 (July 2003); Steel Concrete Reinforcing Bar from Turkey, Inv. No. 731-TA-745 (Review), USITC Pub. 3577 at 4 (Feb. 2003).
7
included within the definition of the subject merchandise regardless of whether the product meets a particular industry or similar standard. The core of multilayered wood flooring may be composed of a range of materials, including but not limited to hardwood or softwood veneer, particleboard, medium-density fiberboard, high-density fiberboard (‘‘HDF’’), stone and/or plastic composite, or strips of lumber placed edge-to-edge. Multilayered wood flooring products generally, but not exclusively, may be in the form of a strip, plank, or other geometrical patterns (e.g., circular, hexagonal). All multilayered wood flooring products are included within this definition regardless of the actual or nominal dimensions or form of the product. Specifically excluded from the scope are cork flooring and bamboo flooring, regardless of whether any of the sub-surface layers of either flooring are made from wood. Also excluded is laminate flooring. Laminate flooring consists of a top wear layer sheet not made of wood, a decorative paper layer, a core-layer of HDF, and a stabilizing bottom layer.18
MLWF is a type of wood flooring product fabricated by using multiple layers of wood
veneer and other kinds of wood materials. It can be composed of three to ten laminated wood layers or plies that include a core sandwiched between a back or bottom veneer layer and a face veneer surface of a desired wood species and finish. While the core is typically composed of wood veneers, it may also be made of solid wood pieces or a composite wood such as medium- or high-density fiberboard (“MDF” or “HDF”). Thicknesses of MLWF typically range from ¼ inch to ¾ inch with the most common thicknesses being ⅜ inch and ½ inch.19
In the original investigations, the Commission defined a single domestic like product as MLWF, coextensive with Commerce’s scope. In doing so, the Commission rejected the respondents’ argument that the Commission should define the domestic like product to include solid-wood flooring, vinyl, and laminate wood-look flooring products as well as MLWF. The Commission found that clear dividing lines separated MLWF from out-of-scope solid-wood flooring and from vinyl and laminate wood-look flooring products.20
18 Multilayered Wood Flooring from the People’s Republic of China: Final Clarification of the Scope of the Antidumping and Countervailing Duty Orders, 82 Fed. Reg. 27799 (Dep’t of Commerce June 19, 2017) (footnotes omitted).
19 CR at I-20; PR at 18. 20 Original Determinations, USITC Pub. 4278 at 6-7.
8
In these reviews, CAHP argues that the Commission should continue to define a single domestic like product, coextensive with the scope definition.21 No party argues to the contrary.
The record in these reviews indicates no material changes in the pertinent product characteristics since the original investigations.22 Additionally, no party argues that the Commission should adopt a different domestic like product definition. Consequently, for the reasons articulated in the original determinations, we define the domestic like product as MLWF, coextensive with the scope.
B. Domestic Industry
Section 771(4)(A) of the Tariff Act defines the relevant industry as the domestic “producers as a whole of a domestic like product, or those producers whose collective output of a domestic like product constitutes a major proportion of the total domestic production of the product.”23 In defining the domestic industry, the Commission’s general practice has been to include in the industry producers of all domestic production of the like product, whether toll-produced, captively consumed, or sold in the domestic merchant market.
These reviews raise the issue of whether appropriate circumstances exist to exclude any producer from the domestic industry pursuant to the related parties provision of the statute.24 This provision allows the Commission, if appropriate circumstances exist, to exclude from the domestic industry producers that are related to an exporter or importer of subject merchandise, or are themselves importers.25
In the original investigations, the Commission did not exclude any related parties under 19 U.S.C. § 1677(4)(B). It observed that eight domestic producers were subject to exclusion under the related parties provision because each imported subject merchandise during the period of investigation. The Commission concluded that appropriate circumstances did not exist to exclude any U.S. producer from the domestic industry primarily because the reported subject imports of these firms declined on an absolute basis from 2008 to 2010 and had ratios of subject imports to domestic production that ranged from low to, at most, moderate levels,
21 CAHP Prehearing Br. at 8-10. 22 See generally CR at I-20 – I-27; PR at I-18 – I-22. 23 19 U.S.C. § 1677(4)(A). The definitions in 19 U.S.C. § 1677 are applicable to the entire subtitle
containing the antidumping and countervailing duty laws, including 19 U.S.C. §§ 1675 and 1675a. See 19 U.S.C. § 1677.
24 In the original investigations, the Commission also addressed whether firms that merely conduct finishing operations on MWLF engage in sufficient production-related activities to be considered domestic producers. Original Investigations, USITC Pub. at 4278 at 8-10. One firm, U.S. Floors, was identified as engaging only in finishing operations on MLWF. Id. at 9. After analyzing the nature of U.S. Floors’ operations, the Commission determined not to include U.S. Floors in the domestic industry. Id. at 10. In these reviews, ***. CR/PR at Table III-1 n. 10. Because no other U.S. producer has been identified as engaging in finishing only operations in these reviews, there is no need to revisit this issue in these reviews.
25 19 U.S.C. § 1677(4)(B).
9
which fell from 2008 to 2010. Accordingly, the Commission defined the domestic industry as all U.S. producers of MLWF, although it did not include one finisher that it found did not engage in sufficient production-related activities to be a domestic producer, as discussed above.26
In these reviews, five domestic producers, ***, are related parties because each imported subject merchandise during the period of review.27 In addition, *** are related parties because they are related to importers of subject MLWF, and *** was related to a foreign producer of subject merchandise.28 No party has argued for the exclusion of any U.S. producer from the domestic industry.29 We examine below whether appropriate circumstances exist to exclude from the domestic industry any of the related party producers.
*** imported subject merchandise during each year and interim period of the January 2011-June 2017 period of review. On an annual basis, its subject imports ranged from *** square feet. Its subject imports ranged from *** percent of its domestic production on an annual basis.30 *** reports that during the period of review it imported ***.31 *** accounted for *** percent of reported MLWF production in the United States in 2016 and *** the orders in these reviews.32
We find that appropriate circumstances do not exist to exclude *** from the domestic industry as a related party. Although the absolute volume of *** imports of subject MLWF *** overall from 2011 to 2016, it *** from 2015 to 2016 and was *** in interim 2017 than in interim 2016. Its ratio of subject imports to domestic production also *** overall from 2011 to 2016 and was *** in interim 2017 than in interim 2016, but remained at low levels throughout the period of review.33 This indicates that *** principal interest is in domestic production.
*** imported subject merchandise each year from 2011 to 2016. On an annual basis, its subject imports ranged from *** square feet. Its subject imports ranged from *** percent of
26 Original Investigations, USITC Pub. at 4278 at 11-12. Pursuant to the CIT’s order on remand, the Commission reopened the record to consider whether domestic hardwood plywood manufacturers made product that was used for flooring, and it found that the record did not show that any U.S. hardwood plywood producer manufactured MLWF. Accordingly, the Commission again defined the domestic industry to be U.S. MLWF producers. Remand Determinations, USITC Pub. 4430 at 5-13.
27 CR/PR at Table III-8. 28 CR/PR at Table I-5; CR at IV-8; PR at IV-7. ***. CR/PR at Table IV-5. Both *** and ***
reported the imports of their affiliated importers with their own direct imports. CR/PR at Table I-6. *** is related to *** and *** is related to ***, which it acquired in ***; these importers’ imports are reported separately from their related U.S. producer. CR/PR at Tables I-5, III-1 n.10.
29 CAHP Prehearing Br. at 10-17. 30 CR/PR at Table III-8. *** ratio of imports to domestic production was *** percent in 2011;
*** percent in 2012; *** percent in 2013; *** percent in 2014; *** percent in 2015; and *** percent in 2016. It was *** percent in January-June (“interim”) 2016 and *** percent in interim 2017. Id.
31 CR at III-16 – III-17; PR at III-9; CR/PR at Table III-8. 32 CR/PR at Table I-4. 33 CR/PR at Table III-8.
10
its domestic production on an annual basis.34 *** reports that during the period of review it imported subject MLWF *** because ***. It further reported that ***.35 *** accounted for *** percent of reported MLWF production in the United States in 2016 and *** continuation of the orders.36
We find that appropriate circumstances do not exist to exclude *** from the domestic industry as a related party. The absolute volume of *** imports of subject MLWF *** from 2011 to 2016 and it reported *** imports of subject MLWF in interim 2017. Its ratio of imports to domestic production also ***.37 This, along with the fact that *** the orders in these reviews, suggests that *** principal interest is in domestic production.
*** imported subject merchandise during each year and interim period from 2012. On an annual basis, its subject imports ranged from *** square feet. Its subject imports on an annual basis ranged from *** percent of its production in 2011 to *** percent in 2016, and were *** percent in interim 2016.38 *** reports that ***.39 It further reported that ***.40 *** accounted for *** percent of reported MLWF production in the United States in 2016 and *** continuation of the orders.41
We find that appropriate circumstances do not exist to exclude *** from the domestic industry as a related party. Although the absolute volume of *** imports of subject MLWF ***, it was *** in interim 2017 than in interim 2016.42 Similarly, although its ratio of subject imports of MLWF to domestic production *** overall from 2012 to 2016, and was *** in interim 2016, it was *** in interim 2017 than in interim 2016.43 Given that *** continuation of the orders, reported ***, and no party seeks its exclusion from the domestic industry, we find that appropriate circumstances do not exist for its exclusion.
*** imported subject merchandise in 2011, 2012, and 2013. During these years, its subject imports ranged from *** square feet. The firm did not engage in domestic production in 2011; its subject imports were *** percent of its domestic production in 2012 and ***
34 CR/PR at Table III-8. *** ratio of imports to domestic production was *** percent in 2011; *** percent in 2012; *** percent in 2013; *** percent in 2014; *** percent in 2015; and *** percent in 2016. Id.
35 CR at III-17 – III-18; PR at III-10; CR/PR at Table III-8. 36 CR/PR at Table I-4. 37 CR/PR at Table III-8. 38 CR/PR at Table III-8. *** ratio of subject imports to domestic production was *** percent in
2012; *** percent in 2013; *** percent in 2014; *** percent in 2015; and *** percent in 2016. It was *** percent in interim 2016 and *** percent in interim 2017. Id.
39 CR at III-18; PR at III-10. 40 CR at III-18; PR at III-10. 41 CR/PR at Table I-4. 42 CR/PR at Table III-8. 43 CR/PR at Table III-8.
11
percent in 2013.44 *** accounted for *** percent of reported MLWF production in the United States in 2016 and *** the orders.45
We find that appropriate circumstances do not exist to exclude *** from the domestic industry as a related party. The absolute volume of *** imports *** and ultimately ***. This suggests that *** principal interest is in domestic production.
*** imported subject merchandise during each year and interim period from 2014. On an annual basis, its subject imports ranged from *** square feet. During this period, its subject imports ranged from *** percent of its domestic production on an annual basis.46 *** reported that ***.47 *** stated that its imports of subject MLWF increased from *** for two reasons.48 *** accounted for *** percent of reported MLWF production in the United States in 2016 and *** continuation of the orders.49
We find that appropriate circumstances do not exist to exclude *** from the domestic industry as a related party. Although the absolute volume of *** imports of subject MLWF and its ratio of subject imports to domestic production ***, both were *** in interim 2017 than in interim 2016, which is consistent with its explanation that it ***.50 This, along with the facts that *** the orders and reported ***, suggests that *** principal interest is in domestic production.51
Accordingly, given our definition of the domestic like product, we define the domestic industry as all domestic producers of MLWF.
Revocation of the Antidumping Duty and Countervailing Duty Orders III.
Would Likely Lead to Continuation or Recurrence of Material Injury Within a Reasonably Foreseeable Time
A. Legal Standards
In a five-year review conducted under section 751(c) of the Tariff Act, Commerce will revoke an antidumping or countervailing duty order unless: (1) it makes a determination that dumping or subsidization is likely to continue or recur and (2) the Commission makes a determination that revocation of the antidumping or countervailing duty order “would be likely
44 CR/PR at Table III-8. 45 CR/PR at Table I-4. 46 CR/PR at Table III-8. 47 CR at III-19; PR at III-10. 48 First, it imported ***. It further reported that ***. Second, ***. CR at III-19 – III-20; PR at III-
10. 49 CR/PR at Table I-4. 50 CR at III-18; PR at III-10; CR/PR at Table III-8. 51 We acknowledge that the volume of *** imports of nonsubject MLWF from China and the
ratio of those imports to its domestic production were both *** in interim 2017 than interim 2016, but observe that the total volume of its imports were *** in interim 2017 than in interim 2016. CR/PR at Table III-8.
12
to lead to continuation or recurrence of material injury within a reasonably foreseeable time.”52 The Uruguay Round Agreements Act (“URAA”) Statement of Administrative Action (“SAA”) states that “under the likelihood standard, the Commission will engage in a counterfactual analysis; it must decide the likely impact in the reasonably foreseeable future of an important change in the status quo – the revocation or termination of a proceeding and the elimination of its restraining effects on volumes and prices of imports.”53 Thus, the likelihood standard is prospective in nature.54 The U.S. Court of International Trade has found that “likely,” as used in the five-year review provisions of the Act, means “probable,” and the Commission applies that standard in five-year reviews.55
The statute states that “the Commission shall consider that the effects of revocation or termination may not be imminent, but may manifest themselves only over a longer period of time.”56 According to the SAA, a “‘reasonably foreseeable time’ will vary from case-to-case, but normally will exceed the ‘imminent’ timeframe applicable in a threat of injury analysis in original investigations.”57
Although the standard in a five-year review is not the same as the standard applied in an original investigation, it contains some of the same fundamental elements. The statute provides that the Commission is to “consider the likely volume, price effect, and impact of
52 19 U.S.C. § 1675a(a). 53 SAA, H.R. Rep. No. 103-316, vol. I at 883-84 (1994). The SAA states that “{t}he likelihood of
injury standard applies regardless of the nature of the Commission’s original determination (material injury, threat of material injury, or material retardation of an industry). Likewise, the standard applies to suspended investigations that were never completed.” Id. at 883.
54 While the SAA states that “a separate determination regarding current material injury is not necessary,” it indicates that “the Commission may consider relevant factors such as current and likely continued depressed shipment levels and current and likely continued {sic} prices for the domestic like product in the U.S. market in making its determination of the likelihood of continuation or recurrence of material injury if the order is revoked.” SAA at 884.
55 See NMB Singapore Ltd. v. United States, 288 F. Supp. 2d 1306, 1352 (Ct. Int’l Trade 2003) (“‘likely’ means probable within the context of 19 U.S.C. § 1675(c) and 19 U.S.C. § 1675a(a)”), aff’d mem., 140 Fed. Appx. 268 (Fed. Cir. 2005); Nippon Steel Corp. v. United States, 26 CIT 1416, 1419 (2002) (same); Usinor Industeel, S.A. v. United States, 26 CIT 1402, 1404 nn.3, 6 (2002) (“more likely than not” standard is “consistent with the court’s opinion;” “the court has not interpreted ‘likely’ to imply any particular degree of ‘certainty’”); Indorama Chemicals (Thailand) Ltd. v. United States, 26 CIT 1059, 1070 (2002) (“standard is based on a likelihood of continuation or recurrence of injury, not a certainty”); Usinor v. United States, 26 CIT 767, 794 (2002) (“‘likely’ is tantamount to ‘probable,’ not merely ‘possible’”).
56 19 U.S.C. § 1675a(a)(5). 57 SAA at 887. Among the factors that the Commission should consider in this regard are “the
fungibility or differentiation within the product in question, the level of substitutability between the imported and domestic products, the channels of distribution used, the methods of contracting (such as spot sales or long-term contracts), and lead times for delivery of goods, as well as other factors that may only manifest themselves in the longer term, such as planned investment and the shifting of production facilities.” Id.
13
imports of the subject merchandise on the industry if the orders are revoked or the suspended investigation is terminated.”58 It directs the Commission to take into account its prior injury determination, whether any improvement in the state of the industry is related to the order or the suspension agreement under review, whether the industry is vulnerable to material injury if an order is revoked or a suspension agreement is terminated, and any findings by Commerce regarding duty absorption pursuant to 19 U.S.C. § 1675(a)(4).59 The statute further provides that the presence or absence of any factor that the Commission is required to consider shall not necessarily give decisive guidance with respect to the Commission’s determination.60
In evaluating the likely volume of imports of subject merchandise if an order under review is revoked and/or a suspended investigation is terminated, the Commission is directed to consider whether the likely volume of imports would be significant either in absolute terms or relative to production or consumption in the United States.61 In doing so, the Commission must consider “all relevant economic factors,” including four enumerated factors: (1) any likely increase in production capacity or existing unused production capacity in the exporting country; (2) existing inventories of the subject merchandise, or likely increases in inventories; (3) the existence of barriers to the importation of the subject merchandise into countries other than the United States; and (4) the potential for product shifting if production facilities in the foreign country, which can be used to produce the subject merchandise, are currently being used to produce other products.62
In evaluating the likely price effects of subject imports if an order under review is revoked and/or a suspended investigation is terminated, the Commission is directed to consider whether there is likely to be significant underselling by the subject imports as compared to the domestic like product and whether the subject imports are likely to enter the United States at prices that otherwise would have a significant depressing or suppressing effect on the price of the domestic like product.63
In evaluating the likely impact of imports of subject merchandise if an order under review is revoked and/or a suspended investigation is terminated, the Commission is directed to consider all relevant economic factors that are likely to have a bearing on the state of the industry in the United States, including but not limited to the following: (1) likely declines in output, sales, market share, profits, productivity, return on investments, and utilization of capacity; (2) likely negative effects on cash flow, inventories, employment, wages, growth,
58 19 U.S.C. § 1675a(a)(1). 59 19 U.S.C. § 1675a(a)(1). Commerce has not made any duty absorption findings. CR at I-12; PR
at I-10. 60 19 U.S.C. § 1675a(a)(5). Although the Commission must consider all factors, no one factor is
necessarily dispositive. SAA at 886. 61 19 U.S.C. § 1675a(a)(2). 62 19 U.S.C. § 1675a(a)(2)(A-D). 63 See 19 U.S.C. § 1675a(a)(3). The SAA states that “{c}onsistent with its practice in
investigations, in considering the likely price effects of imports in the event of revocation and termination, the Commission may rely on circumstantial, as well as direct, evidence of the adverse effects of unfairly traded imports on domestic prices.” SAA at 886.
14
ability to raise capital, and investment; and (3) likely negative effects on the existing development and production efforts of the industry, including efforts to develop a derivative or more advanced version of the domestic like product.64 All relevant economic factors are to be considered within the context of the business cycle and the conditions of competition that are distinctive to the industry. As instructed by the statute, we have considered the extent to which any improvement in the state of the domestic industry is related to the orders under review and whether the industry is vulnerable to material injury upon revocation.65
B. Conditions of Competition and the Business Cycle
In evaluating the likely impact of the subject imports on the domestic industry if an order is revoked, the statute directs the Commission to consider all relevant economic factors “within the context of the business cycle and conditions of competition that are distinctive to the affected industry.”66 The following conditions of competition inform our determinations.
1. Demand Conditions
In the original investigations, the Commission found that demand for MLWF encompassed demand by builders for new home construction and residential remodeling and replacement projects, which accounted for the vast majority of sales, as well as a modest amount of demand for non-residential construction. It observed that the record reflected a severe downturn in macroeconomic conditions in the U.S. residential housing market. Consistent with these trends, apparent U.S. consumption of MLWF declined overall during the January 2008 – June 2011 period of investigation, although it increased somewhat toward the end of the period. The Commission further observed that the parties disagreed about the extent to which demand for substitute products such as laminate vinyl tile, bamboo, or cork flooring, carpet, and other flooring products affected demand for MLWF in the U.S. market. The Commission, however, found no evidence that substitute flooring products took sales away from MLWF during the period of investigation; rather, MLWF accounted for a steady share of sales of all flooring products during the period.67
In these reviews, demand for MLWF remains dependent on the demand for U.S.-produced downstream products. The main use is construction, including both new construction and remodeling.68 Most U.S. producers, importers, and purchasers reported that
64 19 U.S.C. § 1675a(a)(4). 65 The SAA states that in assessing whether the domestic industry is vulnerable to injury if the
order is revoked, the Commission “considers, in addition to imports, other factors that may be contributing to overall injury. While these factors, in some cases, may account for the injury to the domestic industry, they may also demonstrate that an industry is facing difficulties from a variety of sources and is vulnerable to dumped or subsidized imports.” SAA at 885.
66 19 U.S.C. § 1675a(a)(4). 67 Original Determinations, USITC Pub. 4278 at 17-19. 68 CR/PR at II-1.
15
U.S. demand for MLWF has increased since January 1, 2011, and that it was expected to increase over the next two years.69 Apparent U.S. consumption of MLWF increased during the period of review. It was 296.1 million square feet in 2011, 309.6 million square feet in 2012, 377.6 million square feet in 2013, 422.7 million square feet in 2014, 466.5 million square feet in 2015, and 467.5 million square feet in 2016; it was 222.8 million square feet in interim 2016 and 224.9 million square feet in interim 2017.70
2. Supply Conditions
During the original period of investigation, the domestic industry accounted for the largest share of the U.S. market followed by imports of MLWF from subject producers and imports of MLWF from nonsubject sources.71
In these reviews, the U.S. MLWF industry continues to be supplied by domestic producers, imports of MLWF from subject producers, and imports of MLWF from nonsubject sources. Nonsubject sources of MLWF include imports of MLWF from those Chinese producers for which Commerce has revoked the orders.
During the period of review, the domestic industry accounted for the largest share of the U.S. MLWF market. Its share of apparent U.S. consumption fluctuated but fell overall during the period of review. The domestic industry’s market share was 47.8 percent in 2011, 51.1 percent in 2012, 49.2 percent in 2013, 47.0 percent in 2014, 43.4 percent in 2015, and 44.8 percent in 2016; it was 45.3 percent in interim 2016 and 41.1 percent in interim 2017.72 Since the original investigations, the domestic industry has experienced considerable growth. Since 2010, there have been several new entrants into the domestic industry, including American OEM, Appalachian, Crossville Hardwoods, LLC, and Mullican.73 In addition, several U.S. producers have expanded their production in the United States, including ***.74
Imports of MLWF from subject sources in China accounted for the next largest share of the U.S. market. Subject imports of MLWF accounted for 32.8 percent of the U.S. market in 2011, 36.6 percent in 2012, 37.3 percent in 2013, 37.1 percent in 2014, 36.0 percent in 2015, and 31.9 percent in 2016; subject imports’ market share was 33.9 percent in interim 2016 and
69 CR at II-12; PR at II-8; CR/PR at Table II-3. Foreign producers’ responses differed from those of other types of market participants. Id.
70 The Alliance argues that we should supplement the questionnaire data with *** for purposes of calculating apparent consumption. Alliance Prehearing Br. at 28 & Exhibit CT5. We decline to do so due to a lack of comparability between the two data sources and find that questionnaire data represents most probative source in the record to calculate apparent consumption. CR at IV-2 n.3; PR at IV-1 n.3.
71 Original Determinations, USITC Pub. 4278 at 19. 72 CR/PR at Table C-1. 73 CR at III-2; PR at III-1; CR/PR at Table III-2. 74 In addition to ***, ***, ***, ***, and *** reported expanding production in the United States.
CR/PR at Table III-2. *** and *** also reported plant closings. Id.
16
29.9 percent in interim 2017.75 During the period of review, U.S. producers that did not produce certain MLWF products domestically imported appreciable quantities of subject MLWF to increase their product lines.76 Two of those producers, which were the second and third largest importers of subject merchandise in 2016,77 have indicated that they anticipate reducing or eliminating the importation of certain MLWF products in the near future now that they are able to produce some of these products domestically.78
Imports of MLWF from nonsubject sources accounted for the smallest share of the U.S. market. The market share of nonsubject imports was 19.4 percent in 2011, 12.4 percent in 2012, 13.4 percent in 2013, 15.9 percent in 2014, 20.7 percent in 2015, and 23.3 percent in 2016; it was 20.8 percent in interim 2016 and 29.0 percent in interim 2017.79 Major nonsubject import sources include nonsubject Chinese suppliers, Canada, Indonesia, Brazil, Chile, and Russia.80 Nonsubject Chinese suppliers accounted for the majority of all nonsubject imports in 2016.81 Imports of MLWF from nonsubject Chinese suppliers accounted for 6.4 percent of the U.S. MLWF market in 2011, 5.1 percent in 2012, 6.4 percent in 2013, 9.4 percent in 2014, 12.0 percent in 2015, and 13.0 percent in 2016; their market share was 11.1 percent in interim 2016 and 14.7 percent in interim 2017.82
3. Substitutability
In the original determinations, the Commission observed that, even though entities such as flooring distributors, builders, and retailers purchased MLWF from manufacturers, the parties agreed that substitutability among different MLWF products was largely determined by the tastes and preferences of retail customers who purchased the flooring for their homes. The Commission rejected respondents’ arguments that competition between the domestic like product and subject imports was attenuated because subject imports differed from domestically produced MLWF in terms of species, plies, widths, interlocking technology, and hand-scraping features and that MLWF from China competed in different channels of distribution than MLWF produced in the United States. Instead, the Commission found that there was a moderate-to-high degree of substitutability between subject imports and the domestic like product and that, given that domestic producers and subject producers offered a full range of products in the United States, competition in the U.S. market depended primarily on price.83
75 CR/PR at Table C-1. 76 CR at III-16 – III-20; PR at III-9 – III-10. 77 *** accounted for *** percent of imports of subject MLWF in 2016, and *** accounted for
*** percent. CR/PR at Table I-6. 78 CR at III-18 – III-20; PR at III-10. 79 CR/PR at Table C-1. 80 CR at II-9; PR at II-6. 81 CR/PR at Table I-8. 82 CR/PR at Table C-1. 83 Original Determinations, USITC Pub. 4278 at 20-24.
17
In these reviews, we find that there is at least a moderate degree of substitutability between domestically produced MLWF and subject merchandise.84 All responding U.S. producers and a large majority of both U.S. importers and purchasers reported that MLWF produced in the United States and MLWF from subject suppliers were always, frequently, or sometimes interchangeable.85 In addition, a majority of purchasers reported that domestically produced MLWF and MLWF from subject suppliers were comparable in 18 out of 24 factors.86
We further find that price continues to be an important factor in purchasing decisions. Twenty-three purchasers listed price as an important factor in purchasing decisions, with 20 of those listing it as one of their top three factors.87 We recognize that almost all market participants reported that differences other than price were always, frequently, or sometimes significant in comparing MLWF produced in the United States with MLWF produced by subject producers; however, as described above, the majority of purchasers consider MLWF from these two sources to be comparable in most factors, including the six factors most frequently named as very important to purchasing decisions.88 Accordingly, we find that there continues to be at least a moderate degree of substitutability between the domestic like product and subject imports and that price continues to be an important factor in purchasing decisions.
We do not agree with respondents’ argument that competition is attenuated between domestically produced MLWF and MLWF from subject suppliers.89 The record indicates that
84 CR at II-21; PR at II-15. 85 CR/PR at Table II-9. 86 CR/PR at Table II-8. The record further indicates that MLWF from all sources is moderately
substitutable. All responding U.S. producers and a large majority of both U.S. importers and purchasers reported that MLWF from all sources were always, frequently, or sometimes interchangeable. CR/PR at Table II-8. In addition, a majority of purchasers reported that domestically produced MLWF and MLWF from subject suppliers and nonsubject sources other than China were comparable in 18 out of 24 factors, while majority of purchasers reported that domestically produced MLWF and MLWF from nonsubject suppliers in China were comparable in 19 out of 24 factors. A majority of purchasers reported that MLWF from subject suppliers, nonsubject suppliers in China, and sources other than China were comparable in all 24 factors. CR/PR at Table II-8.
87 CR at II-23; PR at II-16; CR/PR at Table II-5. Quality and consistency was the only factor that was listed more frequently as one of the top three factors that purchasers consider, with 26 purchasers identifying it as such. Id.
88 CR/PR at Tables II-8 & II-11. These are ability to meet regulations, product consistency, availability, finish quality, reliability of supply, and quality meets industry standards CR/PR at Tables II-6, II-8.
89 Alliance Posthearing Br. at 4-7 & Responses to Commission Question Concerning White Oak and Red Oak, Customer Preferences, Petitioners’ Use of Prison Labor, Attenuated Competition, Channels of Distribution and Market Segmentation; Alliance Prehearing Br. at 23-28. Specifically, it argues that there are significant differences between the two in terms of species, veneer thickness, width, finish, and core type, as well as other factors such as rotary, sliced, and sawn facing, staining method, and style/design innovations. In particular, it asserts that red oak, which the Alliance claims is the main species offered by the domestic industry, is falling out of popularity. It also asserts that hand finishing is desirable, but that most U.S. produced MLWF is done by machine or prison labor. In addition, the (Continued…)
18
there are some differences in the composition of the products the domestic industry and subject producers in China supplied the U.S. market during the period of review.90 We find, however, that any such differences are outweighed by the substantial overlap between the domestic industry and subject suppliers in product types, end uses, and customers. In particular, we observe that domestic producers as well as subject suppliers each supplied MLWF in the many of the same species, widths, and face thicknesses.91 In addition, the record indicates that, contrary to respondents’ assertions, the domestic industry and subject suppliers supply MLWF with sliced or sawn facing,92 hand scraping,93 and comparable staining methods.94 We acknowledge that half of purchasers found the domestic like product to be inferior to the subject imports with respect to product range, face thickness, finish availability, and board width availability. Nevertheless, nearly the same number of purchasers reported domestically produced MLWF to be comparable for each of these factors.95 Consequently, we do not consider that these distinctions substantially attenuate competition between the subject imports and the domestic like product in light of other information in the record indicating
(…Continued) Alliance claims that most domestic MLWF is made with a rotary peeled veneer, while most subject MLWF is made with sawed or sliced veneer. Id.
90 CR/PR at Table I-9 & Figures I-2 – I-4. For example, domestically produced U.S. shipments of MLWF consisted primarily of red oak followed by hickory, maple or walnut, other species, and white oak, while subject imports consisted primarily of other species followed by hickory, maple, or walnut, white oak, and red oak. Most of the domestically produced U.S. shipments of MLWF were smooth finished, while more subject imports were distressed. Id.
91 CR/PR at Table I-9. In particular, with respect to species, we observe that the domestic industry and subject suppliers each supplied MLWF in several particular species, including red oak, white oak, and hickory, maple, or walnut. CR/PR at Table I-9. We further observe that the record in these reviews indicates that there is some cross-species competition, which is consistent with the Commission’s findings in its original determinations. Hearing Transcript (“Tr.”) at 26 (Finkell), 98 (Ward); see also Original Determinations, USITC Pub. 4278 at 20-21.
92 Tr. at 25 (Finkell); CAHP’s Posthearing Br. at Exhibit 5. 93 Tr. at 25 (Finkell). We further observe that, even assuming for the sake of argument that
subject imports are primarily hand scraped while domestically produced MLWF are both hand and machine scraped, the record in these reviews indicates that nearly the same number of purchasers view the finishes, including distressed finishes, offered by the domestic industry to be comparable as opposed to inferior to subject imports. CR/PR at Table II-8. This is consistent with the Commission’s findings in the original determinations that hand and machine scraped MLWF compete in the market. Original Determinations, USITC Pub. 4278 at 22 n.141.
94 CAHP’s Posthearing Br. at Exhibit 5. 95 CR/PR at Table II-9. Specifically, a majority of purchasers (12) rated subject MLWF to be
superior in terms of board width availability, face thickness, finish availability, and product range, while 11 purchasers reported domestically produced MLWF to be comparable and one reported it to be superior in each of these factors. Id.
19
product overlap and purchaser perceptions that the domestic and subject products are comparable with respect to purchasing factors of greater perceived importance.96
Moreover, contrary to respondents’ assertions,97 the domestic like product is not sold primarily to the builders’ market, but rather supplies the same customers and end uses as subject imports.98 Furthermore, the existing competition between domestically produced MLWF and subject imports is likely to increase even further in the reasonably foreseeable future as certain domestic producers expand their range of domestically produced MLWF products instead of importing subject merchandise.99 On balance, we find that, due to the significant overlap in products, customers, and end uses of the domestic like product and subject imports, domestically produced MLWF and subject imports competed meaningfully against each other during the period of review and such competition is likely to increase further in the imminent future.100
4. Other Conditions
Substitute Products. A large majority of U.S. producers, importers, purchasers, and foreign producers reported the existence of substitutes for MLWF. These include other wood and wood-look substitutes like laminate, wood plastic composite (“WPC”), luxury vinyl tile (“LVT”), solid hardwood flooring, HDF core engineered flooring, 2-ply multilayered wood flooring, bamboo, and wood-look ceramics, as well as non-wood look flooring, including carpet, ceramic tile, and stone. Many of these are described as less costly than MLWF, with the exception of solid hardwood flooring.101 A majority of questionnaire respondents reported that the number of substitutes and their respective acceptance in the U.S. market has increased since January 1, 2011, and some report that these substitutes affect demand for and the prices of MLWF.102 Notwithstanding this, the record indicates that demand for hard flooring surfaces
96 We observe that, in the number of purchaser responses as to whether the factor was very important to purchasing decisions, finish availability ranked eighth, board width availability ranked tenth, and product range ranked eleventh. Fewer than one-third of purchasers reported that face thickness was very important. CR/PR at Table II-6.
97 Lumber Liquidators Prehearing Br. at 4-6; Alliance Posthearing Br. at 6 & Responses to Commission Question Concerning Channels of Distribution and Market Segmentation.
98 CR/PR at Table II-1. We further observe that the domestic industry reported selling MLWF to all regions of the contiguous United States, rebutting respondents’ assertion that the domestic industry is not interested in serving certain regional markets. CR/PR at Table II-2.
99 See, e.g., Tr. at 76-77 (Ward). 100 We also do not find that the record in these reviews supports respondents’ argument that
the domestic industry’s brand recognition insulates it from competition from subject imports. Alliance Prehearing Br. at 9-10. Only one purchaser identified brand as an important factor in purchasing decisions. CR/PR at Table II-5 n.2; see also *** purchaser questionnaire response at question III-24.
101 CR at II-16; PR at II-11. 102 CR at II-17 – II-18; PR at II-12.
20
in general has grown at the expense of soft flooring surfaces, such as carpet,103 and that hardwood flooring in particular, which includes MLWF, increased in volume and value from 2012 to 2016.104 Moreover, much of these gains are attributed to growth in demand for MLWF, as the market shifted from solid hardwood flooring to the more economical MLWF.105 Accordingly, demand for MLWF increased during the period of review and is expected to increase further in the imminent future,106 particularly as it features in new commercial applications such as hotels.107 This is consistent with the domestic industry’s characterization of wood flooring, including MLWF, as an “aspirational” product, notwithstanding the availability of substitute products.108
Supplier Certification and Regulatory Compliance. The majority of purchasers and importers reported requiring suppliers to become certified or qualified to sell MLWF to their firms. The reported time required to become certified varied, but typically spanned one to six months.109 Questionnaire respondents reported requiring that the supplier be able to prove compliance with regulations governing the MLWF industry and achieve air quality, chain of custody, or forestry certifications. The regulations include the Lacey Act of 1900 (“Lacey Act”)110 and the California Air Resources Board Air Toxic Control Measure 93120 (“CARB”) “Phase 2” formaldehyde emissions standards.111 Industry certifications include Floorscore,112 Forestry Stewardship Council (“FSC”) certifications,113 and Greenguard Gold.114
103 Tr. at 64-65, 99 (Ward), 65 (Finkell); Alliance Posthearing Br. at Exhibits CT7. 104 CR/PR at Figure II-4. 105 CR at II-16 – II-21; PR at II-14; Tr. at 64 (Levin), 65-67 (Ward); Alliance’s Posthearing Br. at
Exhibits CT7. 106 CR at II-12; PR at II-8; CR/PR at Table II-3; Tr. at 64-65, 99 (Ward), 65 (Finkell); Alliance
Posthearing Br. at Exhibits KR5, CT7, CT11. 107 Tr. 99-100 (Ward). 108 Tr. at 65 (Ward), 68 (Levin), Alliance Posthearing Br. at Exhibits KR6, CT6. 109 CR at II-26, PR at II-19 – II-20. Respondents contend that it can take a year or more to qualify
a supplier. Hearing Tr. at 120, 123 (Cobb); Alliance Posthearing Br. at Exhibits 2, 5. 110 CR at II-27; PR at II-19. The Lacey Act (16 U.S.C. §§ 3371–3378) combats trafficking in illegally
sourced wildlife, fish and plants. It was amended in 2008 to include plants and plant products such as timber and wood products, and it includes a ban on trading plant products harvested in violation of the law. The law requires the U.S. importer of record to exercise “due care” and take legal responsibility for the shipment, contents, and paperwork, and the importer must accurately declare the scientific name, value, quantity, and country of harvest origin. Id.
111 CR at II-27; PR at II-19. In addition, the Environmental Protection Agency finalized a rule that is closely aligned with the CARB “Phase 2” formaldehyde emission standards. Specifically, the Toxic Substance Control Act (“TSCA”) Title VII limits harmful exposure to formaldehyde and sets up a third-party certification program for testing and oversight of these emissions from certain wood products. Id.
112 CR at II-28; PR at II-19. Floorscore is an indoor air quality standard certification for hard flooring surfaces, underlayments, and adhesives. Id.
113 CR at II-28; PR at II-19. FSC certification is granted to products to ensure that wood is sourced from responsibly managed forests. There are two types of FSC certifications: forest management and chain of custody. Id.
21
Raw materials. Sawtimber is the principal raw material used to produce MLWF. The average Timber Mart-South prices for hardwood sawtimber generally increased since the first quarter of 2011 to the second quarter of 2017. Raw material costs as a share of cost of goods sold (“COGS”) increased from 56.9 percent in 2011 to 59.1 percent in 2013 before decreasing to 56.4 percent in 2016. Some U.S. producers, most importers, and most foreign producers reported that raw material prices had increased since January 1, 2011, and that they expected this trend to continue in the future.115
C. Likely Volume of Subject Imports
In the original investigations, the Commission found that the volume of subject imports was significant both in absolute terms and relative to consumption and production in the United States and that the increase in subject import volume relative to domestic production and apparent consumption was also significant. In particular, the Commission observed that in 2010, when the volume of domestically produced MLWF and imports from nonsubject sources remained substantially below their respective 2008 levels, the volume of subject imports had almost completely recovered to its 2008 level. It further observed that, as demand declined overall during the period of the investigation, subject imports from China increased their market share, mostly at the expense of the domestic industry.116
In the current reviews, subject imports continue to be present in the U.S. MLWF market and increased in volume overall from 2011 to 2016, although subject imports were lower in interim 2017 than in interim 2016. Subject imports were 97.2 million square feet in 2011, 113.2 million square feet in 2012, 141.0 million square feet in 2013, 156.8 million square feet in 2014, (…Continued)
114 CR at II-28; PR at II-19. Greenguard certification is administered by the Underwriters’ Labratories Environment program and intended to help manufacturers create and buyers identify interior products and materials that have low chemical emissions. Id.
115 CR at V-1; PR at V-1. 116 Original Determinations, USITC Pub. 4278 at 24-25. The Alliance argues that in these reviews
the Commission should not presume that the volume trends observed in the original investigations would recur upon revocation. Specifically, it asserts that the data in the original investigations included imports from Layo, Yuhua, and Samling, which accounted for *** percent of total MLWF imports from China in 2010 and are no longer covered by the antidumping duty order, with Samling only currently subject to the countervailing duty order. Alliance Prehearing Br. at 3, 7, 33-35. Data from Yuhua, however, appears not to have been included in the original investigations. Original Determinations, USITC Pub. 4278 at IV-1 n.2. In addition, Samling continues to be covered by the countervailing duty order and, therefore, continues to be subject merchandise. As a result, the data in the original investigations contain import data from a single firm, Layo, that has since been excluded from the orders in these reviews. Layo’s exports were equivalent to approximately *** percent of reported imports from China in 2008, *** percent in 2009, and *** percent in 2010. See Layo Wood’s foreign producer questionnaire response at question II-11 in the original investigations, reproduced as EDIS document 622614; Original Determinations, USITC Pub. 4278 at Table C-1. We therefore find that the Commission’s findings in the original determinations have significant probative value in these reviews, notwithstanding the fact that they included data regarding Layo.
22
167.7 million square feet in 2015, and 149.1 million square feet in 2016; they were 75.5 million square feet in interim 2016 and 67.3 million square feet in interim 2017.117 Notwithstanding this, the record indicates that the orders have had some disciplining effect on the volume of subject imports. Twenty out of 30 responding purchasers reported that they had changed suppliers since January 1, 2011, and some specifically identified uncompetitive prices of Chinese imports and uncertainty regarding antidumping and countervailing duties as the reasons why they decreased purchases from subject suppliers and increased purchases from U.S. suppliers and suppliers from nonsubject sources, including nonsubject suppliers in China.118
During the period of review, the reported capacity of subject suppliers increased from 2011 to 2013 before declining from 2014 to 2016, which coincides with ***.119 Capacity increased from 83.4 million square feet in 2011 to 94.0 million square feet in 2012 and 107.3 million square feet in 2013, then fell to 103.7 million square feet in 2014 and *** square feet in 2015 before increasing again to *** square feet in 2016; it was *** square feet in interim 2016 and *** square feet in interim 2017.120 Reported production of subject MLWF increased overall from 2011 to 2016. Production was 45.4 million square feet in 2011, 59.8 million square feet in 2012, 66.9 million square feet in 2013, 68.4 million square feet in 2014, *** square feet in 2015, and *** square feet in 2016; it was *** square feet in interim 2016 and *** square feet in interim 2017.121 As a result, capacity utilization was 54.4 percent in 2011, 63.7 percent in 2012, 62.4 percent in 2013, 66.0 percent in 2014, *** percent in 2015, and *** percent in 2016; it was *** percent in interim 2016 and *** percent in interim 2017.122 Moreover, several firms reported the ability to produce products other MLWF using the same equipment.123 Overall capacity utilization on the same equipment that could be used to produce MLWF fell sharply overall during the period of review. It was *** percent in 2011, *** percent in 2012, *** percent in 2013, *** percent in 2014, *** percent in 2015, *** percent in 2016; it was *** percent in interim 2016 and *** percent in interim 2017.124 Thus, we find that reported subject producers have significant excess capacity available to increase MLWF production.125 We further observe that the questionnaire data likely vastly understate the available MLWF capacity in China because responding foreign producers are believed to account for less than
117 CR/PR at Table C-1. 118 CR at II-30; PR at II-20. 119 CR at IV-11; PR at IV-8; CR/PR at Table IV-6. 120 CR/PR at Table IV-6. 121 CR/PR at Table IV-6. 122 CR/PR at Table IV-6. 123 CR at IV-14; PR at IV-11. 124 CR/PR at Table IV-7. 125 We have also examined the end-of-period inventories of subject producers. They were ***
square feet in 2011, *** square feet in 2012, *** square feet in 2013, *** square feet in 2014, *** square feet in 2015, and *** square feet in 2016; they were *** square feet in interim 2016 and *** square feet in interim 2017. CR/PR at Table IV-6.
We further note that MLWF is not subject to antidumping or countervailing duty orders in any country other than the United States. CR at IV-16; PR at IV-13.
23
12.2 percent of total MLWF production in China, and their exports to the United States were equivalent to only 9.6 percent of total reported subject imports in 2016.126
We also observe that responding foreign producers are highly export oriented, and some producers reported that they could easily switch exports between different markets.127 We further observe that the available information indicates that the wood flooring industry in China in general is highly export oriented and the leading exporter of plywood and wood flooring products in the world. China was the largest source of exported plywood and wood flooring products from 2011 to 2016.128 Notably, the United States was the leading export market for plywood and wood flooring products during that time.129
Accordingly, based on subject producers’ significant production capacity, excess capacity, product-shifting abilities, export activities, and continued interest in the U.S. market, we find that the volume of subject imports, in absolute terms and relative to both U.S. production and consumption, would likely be significant in the event of revocation.
We acknowledge that in interim 2017, while under the discipline of the order, subject imports from China were lower than they were in interim 2016, reflecting in large part decreased imports by U.S. producers that replaced subject imports with domestic production.130 We do not believe that this trend will persist in the reasonably foreseeable future if the orders are revoked. We observe that, with the exception of ***, no U.S. producer is affiliated with a foreign producer.131 Consequently, there is no impediment to foreign producers that formerly supplied U.S. producers attempting to reenter the U.S. market by seeking other customers for their products. Indeed, we believe such behavior is likely given the excess capacity of subject producers, their export orientation, and the importance of the U.S market.
We are not persuaded by respondents’ arguments that regulatory barriers in United States make it unlikely that the volume of subject imports would increase if the orders were revoked. Alliance claims that compliance with these restrictions on formaldehyde emissions is too burdensome to smaller Chinese companies and U.S. importers. It also asserts that environmental regulations in China are also making it more difficult to produce MLWF in China.132 The record in these reviews, however, indicates that the various regulations in the United States have not deterred producers in China as well as nonsubject suppliers in other
126 CR at IV-8; PR at IV-7. 127 CR at II-7; PR at II-6; CR/PR at Table IV-6. 128 CR/PR at Table IV-9. 129 CR/PR at Table IV-7. 130 See CR at III-16-20, PR at III-; CR/PR at Tables III-8, IV-1. 131 See CR/PR at Table IV-5. 132 Alliance Posthearing Br. at 8-9 & Responses to Questions on Regulatory Barriers and
Concerning Production in Guangdong Province; Alliance Prehearing Br. at 35-44. The regulatory barriers identified by the Alliance include the Lacey Act, the California Air Resources Board Air Toxic Control Measure 93120 (“CARB”), and the Environmental Protection Agency’s Title VI addition to the Toxic Substance Control Act (“TOSCA”). Id.
24
countries from increasing their participation in the U.S. MLWF market.133 We observe that the increased imports of MLWF from subject and nonsubject sources in China through most of the period of review also refutes respondents’ arguments that subject imports are not likely to increase significantly to the U.S. MLWF market upon revocation due to comparatively lower prices in the United States.134 The available information also indicates that regulations in China did not curtail significantly the substantial export activities of plywood and wood flooring producers in China in the global or U.S. markets.135
We also are not persuaded that subject imports are unlikely to increase upon revocation because some subject producers relocated production to nonsubject countries. Even assuming that these producers do not move production back to China upon revocation, there is significant excess capacity in China to supply the U.S. market, as discussed above, and the
133 Subject imports from China were 97.2 million square feet in 2011, 113.2 million square feet in 2012, 141.0 million square feet in 2013, 156.8 million square feet in 2014, 167.7 million square feet in 2015, and 149.1 million square feet in 2016; they were 75.5 million square feet in interim 2016 and 67.3 million square feet in interim 2017. CR/PR at Table C-1. Nonsubject imports from China were 18.8 million square feet in 2011, 15.8 million square feet in 2012, 24.3 million square feet in 2013, 39.7 million square feet in 2014, 56.1 million square feet in 2015, and 60.7 million square feet in 2016; they were 24.6 million square feet in interim 2016 and 33.1 million square feet in interim 2017. Id. Nonsubject imports from other sources were 38.6 million square feet in 2011, 22.5 million square feet in 2012, 26.5 million square feet in 2013, 27.6 million square feet in 2014, 40.4 million square feet in 2015, and 48.0 million square feet in 2016; they were 21.8 million square feet in interim 2016 and 32.1 million square feet in interim 2017. Id. We are not persuaded by the Alliance’s argument that it would be cost prohibitive to switch from nonsubject suppliers to subject suppliers due to compliance certification requirements. Alliance Posthearing Br. at 9-10; Alliance Prehearing Br. at 45-50. The majority of purchasers reported that MLWF from all sources was comparable in terms of regulatory compliance. CR/PR at Table II-8. In addition, a majority of purchasers reported that new suppliers entered the U.S. market since January 1, 2011, and anticipated additional entrants, noting that there were a large number of entrants or that the entry or exit of suppliers in the U.S. market occurs frequently. CR at II-10; PR at II-7. This suggests that regulatory compliance is not a barrier to entry to the U.S. MLWF market. We further observe that the record indicates that a significant portion of subject imports are from wood imported to China from the United States, Tr. at 21 (Howett), which presumably would satisfy Lacey Act requirements.
134 Alliance Posthearing Br., Response to Question on China Export Price Comparisons. 135 Exports of plywood and wood flooring products from China by value were $4.3 billion in
2011, $4.8 billion in 2012, $5.0 billion in 2013, $5.8 billion in 2014, $5.5 billion in 2015, and $5.2 billion in 2016. CR/PR at Table IV-9. China’s exports to the United States by value were $830.1 million in 2011, $1.0 billion in 2012 and 2013, $1.3 billion in 2014, $1.4 billion in 2015 and 2016. CR/PR at Table IV-8. We also observe that an industry report indicated that, given that overall output is still rising in China, news of major cuts in capacity related to government closure of high-polluting industries can be “misleading.” See Alliance Posthearing Br. at Exhibit KR16 at 16; see also Alliance Prehearing Br. at Exhibits KR15 (suggesting that orders closing factories for environmental compliance will be temporary) & KR17 (indicating that, while there has been a decline in output from certain companies, others have increased output).
25
Chinese producers remain export oriented, with much larger quantities of plywood and wood flooring exports than those from other sources, including Cambodia and Vietnam.136 Finally, we are not persuaded that the availability of lower price nonsubject imports in the U.S. market would substantially inhibit further subject imports upon revocation.137 As discussed below, subject imports are likely to lower their prices and undersell the domestic like product to gain market share.
D. Likely Price Effects
In the original investigations, the Commission found that, given the moderate-to-high degree of substitutability between the subject imports in China and the domestic like product, competition in the U.S. market was based primarily on price. It further found that subject imports undersold the domestic like product in 60 out of 110 quarterly comparisons, or 54 percent of the time, at margins ranging from 1.5 to 36.4 percent. The Commission rejected petitioners’ argument that it should discard import prices where importers reported prices for products that were a different species than that identified in the pricing product, observing that the questionnaires indicated that firms could report data that were not identical to the pricing product but believed to compete with those products. The Commission also rejected respondents’ argument that the pricing comparisons did not show significant underselling because subject imports oversold the domestic like product in red oak pricing products that involved the majority of the domestic industry’s shipments. The Commission observed that these pricing products accounted for a relatively insignificant share of total imports of subject merchandise. It further observed that there was widespread underselling in non-red oak products, where there were higher volumes of subject imports and lower volumes of domestic shipments, emphasizing that underselling was particularly widespread for the high-value hand-scraped MLWF product for which demand was increasing.138
The Commission also found that the traditional quarterly pricing data were limited because they corresponded to very detailed product specifications, including species of the product’s face. Given the record evidence of cross-species competition, the Commission concluded that the pricing product data did not present a full picture of competition, underselling, or other price effects in the U.S. market. Accordingly, the Commission considered other data. It declined to rely on aggregate average unit value (“AUV”) data due to product mix concerns, but found other, more narrowly defined, AUV data to be more probative. These supplemental data showed nearly universal underselling. Other record data also indicated that subject imports gained sales due to lower prices. Based on all this evidence, the Commission concluded that there had been significant underselling.139
136 CR/PR at Table IV-9. See also Tr. at 94 (Ward). 137 Alliance Prehearing Br. at 62-63. 138 Original Determinations, USITC Pub. 4278 at 26-28. 139 Original Determinations, USITC Pub. 4278 at 28-30.
26
The Commission also found evidence that low-priced subject imports depressed prices of the domestic like product in the U.S. market. In particular, it found that domestic producers lowered their prices for hand-scraped MLWF products and that, because demand was growing for those products, price declines were not related to lower demand or the economic downturn. The Commission also observed that confirmed lost revenue allegations further indicated that domestic producers had to lower their prices to compete with subject imports. In sum, the Commission found that the significant and growing volume of low-priced subject imports competed directly with the domestic like product and undersold the domestic like product at significant margins, causing the domestic industry to lose revenue and market share.140
In these reviews, as described above, the record indicates that there is generally at least a moderate degree of substitutability between subject imports and the domestic like product and that price plays an important role in purchasing decisions. Six U.S. producers and 24 importers provided usable quarterly net U.S. f.o.b. selling price data for eight MLWF products for the period of January 2011 through June 2017, although not all firms reported pricing for all products for all quarters.141 According to these pricing data, prices of subject imports from
140 Original Determinations, USITC Pub. 4278 at 30-31. On remand, the CIT ordered the Commission to make “explicit findings on the effects of subject imports on the price suppression and depression factors” and to explain in its price effects analysis “those economic issues addressed by the Dissenting Views.” In the remand determination, the Commission explained that it did not include in its original determinations a finding of significant price depression or a finding of significant price suppression because it found neither in reaching its affirmative determinations. It observed that, under the statutory language, a lack of price suppression or price depression does not preclude a finding of adverse price effects based on underselling, nor does it preclude the Commission from making an affirmative determination where the significant underselling enabled subject imports to maintain a significant volume in the U.S. market or increase significantly. The Commission further explained its price depression findings, clarifying that, although it found evidence of price depression, it did not find “significant” price depression. It also addressed the dissenting Commissioners’ finding that there was not significant price depression, observing that the dissenting Commissioners based their analysis solely on quarterly pricing data, while the Commission based its analysis on the quarterly pricing data as well as supplemental pricing data, purchaser questionnaire responses, and confirmed lost sales revenue allegations. Remand Determinations, USITC Pub. 4430 at 14-23.
141 The pricing products include the following: Product 1. Multilayered wood flooring, non-click, 12.5 mm. (½ inch) thick, red oak-face product, prefinished (veneer core), “Select” or “Clear” grade, smooth finish, 125 mm (4 ¾ to 5 ½ inches) width, with a face thickness of 2 mm; Product 2. Multilayered wood flooring, non-click, 9.5 mm. (3/8 inch) thick, red oak-face product, smooth finish, prefinished (veneer core), 76 mm (2 ¾ to 3 ½ inches) width, with a face thickness of 1.6 to 2 mm; (Continued…)
27
China were below those of the domestic like product in 107 of 191 instances (involving 69.4 million square feet of MLWF imported from China). In the remaining 84 instances (involving 110.6 million square feet of MLWF imported from China), prices for imports from China were above prices for the domestic like product.142 Accordingly, there has been some underselling of the domestic like product even under the discipline of the orders. The record further indicates that the orders have had some discipline on the pricing of subject imports. As described above, purchasers reported decreasing their purchases of MLWF from China due to uncompetitive pricing and increasing their purchases from U.S. suppliers and suppliers from nonsubject sources, including nonsubject suppliers in China.143 Moreover, the AUVs of subject imports were higher than those of nonsubject imports from all sources. In particular, the AUVs of nonsubject imports from China were significantly lower than the AUVs of nonsubject imports from other sources, as well as the AUVs of subject imports, for most of the period of review.144 (…Continued) Product 3. Multilayered wood flooring, non-click, 9.5 mm. (3/8 inch) thick, red oak-face product, prefinished (veneer core), hand-scraped, distressed, or wire-brushed finish, 76 mm (4 ¾ to 5 ½ inches) width, with a face thickness of 1.6 to 2 mm; Product 4. Multilayered wood flooring, non-click, 9.5 mm. (3/8 inch) thick, maple-face product, smooth finish, prefinished (veneer core), “Select” or “Clear” grade, 125 mm (4 ¾ to 5 ½ inches) width, with a face thickness of 2 mm; Product 5. Multilayered wood flooring, interlocking/click installation, 9.5 mm. (3/8 inch) thick, red oak-face product, smooth finish, prefinished (MDF, HDF, or similar core), 125 mm (4 ¾ to 5 ½ inches) width, with a face thickness of 1.6 to 2 mm, 121.92 cm to 182.88 cm; Product 6. Multilayered wood flooring, interlocking/click installation, 9.5 mm. (3/8 inch) thick, red oak-face product, smooth finish, prefinished (MDF, HDF, or similar core), 125 mm (4 ¾ to 5 ½ inches) width, with a face thickness of 1.6 to 2 mm, 121.92 cm to 182.88 cm; Product 7. Multilayered wood flooring, non-click, 12.5 mm. (½ inch) thick, birch face product, prefinished, smooth finish, veneer core, 125 mm (4 ¾ to 5 ½ inches) width, with a face thickness of 1.6 to 2 mm; Product 8. Multilayered wood flooring, non-click, 12.5 mm. (½ inch) thick, birch face product, prefinished, hand-scraped, distressed, or wire-brushed finish, veneer core, 125 mm (4 ¾ to 5 ½ inches) width, with a face thickness of 1.6 to 2 mm. CR at V-8 – V-9; PR at V-6. These pricing data accounted for approximately 23 percent of all U.S. producers’ shipments of MLWF and 19 percent of U.S. shipments of subject imports from China in 2016. CR at V-9; PR at V-6. With respect to U.S. import data, 29.4 percent of the total reported volume and 40.0 percent of the total reported valued was attributable to firms that are also U.S. producers. Id.
142 CR at V-27; PR at V-17; CR/PR at Tables V-5 – V-12. 143 CR at II-30; PR at II-21. 144 CR/PR at Table C-1. We recognize that AUV data may reflect differences in the product mixes
of subject and nonsubject imports. Nevertheless, there is information on the record indicating that the (Continued…)
28
In view of our findings of the likely significant volume of subject imports, the degree of substitutability between subject imports and the domestic like product, and the importance of price in purchasing decisions, we find that upon revocation subject producers would likely undersell the domestic like product to gain market share, as they did during the original investigations. In doing so, prices of subject MLWF are likely to fall to levels comparable or below those of the nonsubject imports. As a result, in the face of increased subject import underselling, domestic producers would likely be forced to cut prices, forego price increases, or risk losing market share. We consequently find that if the orders were revoked, subject imports would again undersell the domestic like product to gain market share, and the pricing pressure from subject imports would cause the domestic industry to lose market share and/or depress or suppress prices of the domestic like product, thereby having adverse price effects.
E. Likely Impact
In the original investigations, the Commission found that subject imports had a significant impact on the domestic industry during the period of investigation. It observed that almost all of the domestic industry’s performance indicators declined significantly from 2008 to 2009 and that, although some performance factors improved from 2009 to 2010, they remained at lower levels than in 2008. In particular, the Commission found that market share, U.S. shipments, and net sales declined and that the domestic industry reduced capacity, produced less, and operated at relatively low capacity utilization rates. It further found that the domestic industry’s financial condition was poor over the period of investigation and that any modest improvement in financial performance in interim 2011 was not mirrored in employment levels, which dropped consistently during the period of investigation.145
The Commission also considered whether other factors may have had an impact on the domestic industry. In particular, the Commission found that MLWF maintained its share of the overall floor covering market relative to other substitute products during the period of investigation. The Commission also considered the economic downturn and declining demand, but found that the domestic industry’s poor performance preceded the decline in demand and that the domestic industry’s loss in market share was not a function of declining demand. The Commission also found that improvements in the industry’s indicators from 2009 to 2010 generally lagged behind the U.S. market’s general recovery. It further observed that the improvement in the domestic industry’s financial performance was due more to severe measures the domestic industry took to cut costs and reorganize rather than enhanced sales
(…Continued) AUV data provide useful information concerning relative prices of products from different sources. First, as previously discussed, the data indicating higher AUVs for subject imports from China relative to other imports is consistent with the reported experiences of purchasers in the U.S. market that the orders have resulted in higher prices for subject imports from China. Second, large majorities of purchasers reported that the subject imports from China were comparable in all factors, including those pertaining to product range and characteristics, with nonsubject imports. CR/PR at Table II-8.
145 Original Determinations, USITC Pub. 4278 at 32-33.
29
related to a general economic recovery. Finally, the Commission observed that nonsubject imports declined overall during the investigation period, both in absolute and relative terms.146
In these reviews as discussed above, the domestic industry has undergone significant growth since January 1, 2011, with new entrants as well as expansions of existing facilities, including ***. As a result of this growth, the domestic industry increased capacity between 2011 and 2016, and capacity was higher in interim 2017 than interim 2016.147 Production also increased from 2011 to 2016, although it was lower in interim 2017 than interim 2016.148 Capacity utilization initially increased from 2011 to 2014 before declining in 2015 and 2016; it was lower in interim 2017 than in interim 2016.149 U.S. producers’ U.S. shipments increased from 2011 to 2016, but were lower in interim 2017 than in interim 2016.150 The domestic industry’s end-of-period inventories also increased overall from 2011 to 2016 and were higher in interim 2017 than in interim 2016.151
146 Original Determinations, USITC Pub. 4278 at 33-36. On remand, the CIT found that the Commission’s determinations were unsupported by substantial evidence because they did not adequately consider the effect that the severe disruption of the homebuilding and remodeling industries had on the domestic industry. The CIT ordered the Commission to ensure that subject imports were the “but-for” cause of the injury. In its remand determinations, the Commission expanded its explanation of the causal nexus that it found in the original determinations and, in particular, addressed demand trends during the period of investigation and explained how, but for the unfairly traded subject imports, the domestic industry would have been better off both during the housing market collapse and the developing recovery that followed. Remand Determinations, USITC Pub. 4430 at 23-47.
147 CR/PR at Table III-4. Capacity was 266.5 million square feet in 2011, 263.1 million square feet in 2012, 270.5 million square feet in 2013, 284.6 million square feet in 2014, 301.4 million square feet in 2015, and 325.7 million square feet in 2016; it was 162.6 million square feet in interim 2016 and 164.0 million square feet in interim 2017. Id.
148 CR/PR at Table III-4. Production was 144.1 million square feet in 2011, 163.8 million square feet in 2012, 194.6 million square feet in 2013, 213.2 million square feet in 2014, 202.8 million square feet in 2015, and 219.5 million square feet in 2016; it was 107.2 million square feet in interim 2016 and 95.5 million square feet in interim 2017. Id.
149 CR/PR at Table III-4. Capacity utilization increased from 54.1 percent in 2011 to 62.3 percent in 2012, 72.0 percent in 2013, and 74.9 percent in 2014, then declined to 67.3 percent in 2015 and was 67.4 percent in 2016; it was 66.0 percent in interim 2016 and 58.3 percent in interim 2017. Id.
150 CR/PR at Table III-6. U.S. shipments were 141.5 million square feet in 2011, 158.1 million square feet in 2012, 189.9 million square feet in 2013, 198.6 million square feet in 2014, 202.3 million square feet in 2015, and 209.6 million square feet in 2016; they were 100.9 million square feet in interim 2016 and 92.4 million square feet in interim 2017. Id.
151 CR/PR at Table III-7. Inventories were 56.6 million square feet in 2011, 58.2 million square feet in 2012, 62.8 million feet in 2013, 73.3 million square feet in 2014, 69.0 million square feet in 2015, and 73.8 million square feet in 2016; they were 72.6 million square feet in interim 2016 and 75.3 million square feet in interim 2017. Id.
30
The number of production related workers (“PRWs”) increased from 2011 to 2016 but was lower in interim 2017 than interim 2016.152 Total hours worked and wages paid followed the same trend.153 Productivity fluctuated during the period of review.154
Although many production and employment indicia reflect considerable growth since January 1, 2011, sustained financial gains have been elusive for the domestic industry. Net sales by quantity and value increased from 2011 to 2016, but were lower in interim 2017 than in interim 2016.155 The ratio of COGS to net sales increased overall from 2011 to 2016 but was lower in interim 2017 than in interim 2016.156 The domestic industry’s gross profits, operating income, and net income fluctuated during the period of review, but the domestic industry incurred operating and net losses during the latter part of the period.157 Capital expenditures and research and development (“R&D”) expenses fluctuated from 2011 to 2016 and were
152 CR/PR at III-10. The number of PRWs was 2,106 in 2011, 2,245 in 2012, 2,719 in 2013, 2,949 in 2014, 3,050 in 2015, and 3,128 in 2016; it was 3,172 in interim 2016 and 3,061 in interim 2017. Id.
153 CR/PR at Table III-10. Total hours worked were 4.2 million in 2011, 4.5 million in 2012, 5.5 million in 2013, 6.0 million in 2014, 6.2 million in 2015, and 6.6 million in 2016; they were 3.4 million in interim 2016 and 3.1 million in interim 2016. Wages paid were $61.0 million in 2011, $68.4 million in 2012, $81.8 million in 2013, $91.6 million in 2014, $94.2 million in 2015, and $100.4 million in 2016; they were $51.6 million in interim 2016 and $46.6 million in interim 2017. Id.
154 CR/PR at Table III-10. Productivity was 34.2 square feet per hour in 2011, 36.1 square feet per hour in 2012, 35.4 square feet per hour in 2013, 35.5 square feet per hour in 2014, 32.5 square feet per hour in 2015, and 33.5 square feet per hour in 2016; it was 32.0 square feet per hour in interim 2016 and 30.8 square feet per hour in interim 2017. Id.
155 CR/PR at Table III-11. By quantity, net sales were 135.0 million square feet in 2011, 156.7 million square feet in 2012, 183.4 million square feet in 2013, 196.2 million square feet in 2014, 201.3 million in 2015, and 213.1 million square feet in 2016; they were 103.2 million square feet in interim 2016 and 93.7 million square feet in interim 2017. By value, net sales were $343.2 million in 2011, $383.5 million in 2012, $451.3 million in 2013, $482.9 million in 2014, $491.2 million in 2015, and $501.0 million in 2016; they were $241.9 million in interim 2016 and $225.8 million in interim 2017. Id.
156 CR/PR at Table III-1. The ratio of COGS to net sales was 79.0 percent in 2011, 77.5 percent in 2012, 79.5 percent in 2013, 86.0 percent in 2014, 90.5 percent in 2015, and 92.6 percent in 2016; it was 93.5 percent in interim 2016 and 88.9 percent in interim 2017. Id.
157 CR/PR at Table III-11. The domestic industry’s gross profits were $71.9 million in 2011, $86.4 million in 2012, $92.4 million in 2013, $67.4 million in 2014, $46.8 million in 2015, and $37.3 million in 2016; they were $15.6 million in interim 2016 and $25.0 million in interim 2017. Operating income was $24.5 million in 2011, $35.4 million in 2012, $41.4 million in 2013, $12.7 million in 2014, negative $10.9 million in 2015, and negative $30.4 million in 2016; it was negative $16.6 million in interim 2016 and negative $8.0 million in interim 2017. Net income was $24.4 million in 2011, $35.2 million in 2012, $41.4 million in 2013, $12.6 million in 2014, negative $11.4 million in 2015, and negative $30.8 million in 2016; it was negative $16.7 million in interim 2016 and negative $8.2 million in interim 2017. Id. Some of the decline in the domestic industry’s gross profits was related to ***. CR at III-35 nn. 34, 35; PR at III-16 nn. 34, 35.
31
higher in interim 2017 than in interim 2016.158 In view of the foregoing, we find the domestic industry to be in a vulnerable condition.
As discussed above, we find that revocation of the antidumping duty and countervailing duty orders on subject imports from China would likely lead to an increased and significant volume of subject imports that would likely undersell the domestic like product to gain market share. This increased volume of low-priced subject imports would in turn likely have the effect of causing the domestic industry to lose market share, revenues, or both, all of which would have a negative impact on the domestic industry’s performance. In light of these likely adverse effects, we find that the subject imports would have a significant impact on the production, shipments, sales, market share, and revenue of the domestic industry. These reductions would have a direct adverse impact on the domestic industry’s profitability and employment. We conclude that, if the orders were revoked, subject imports from China would likely have a significant impact on the domestic industry within a reasonable foreseeable time.
We have also considered factors other than subject imports in the U.S. market. As discussed above, nonsubject imports maintained a relatively stable presence in the U.S. market during the period of review. We also observe, as discussed above, that the record indicates that during the period of review nonsubject imports from all sources had lower AUVs than subject imports, primarily due to the fact that the AUVs of nonsubject imports from China were lower than those of subject MLWF and MLWF from other nonsubject sources during most of the period of review. Notwithstanding the availability of low-priced nonsubject imports in the market, any gains in subject imports’ market penetration are likely to come at least in part at the expense of the domestic industry. Moreover, in the event of revocation, additional subject imports are likely to compete at reduced prices without the discipline of the orders. These prices would likely place additional competitive pressure on the domestic industry. In light of the substitutability of MLWF from all sources as well as the importance of price in purchasing decisions,159 we consequently find that subject imports would likely have adverse effects on the domestic industry distinct from those of nonsubject imports.
We have also considered competition from substitute flooring products. As described above, notwithstanding the growth in the popularity and acceptance of certain non-wood flooring products in the U.S. market, demand for MLWF grew during the period of review and is expected to continue to grow further in the near future. By contrast, as subject imports increase their penetration into the growing market, they will likely gain market share at least in part at the expense of the domestic industry. This likely adverse impact on the domestic industry would be distinct and distinguishable from any competition from other flooring products.
158 CR/PR at Table III-14. Total capital expenditures were $*** in 2011, $*** in 2012, $*** in 2013, $*** in 2014, $*** in 2015, and $*** in 2016; they were $*** in interim 2016 and $*** in interim 2017. R&D expenses were $*** in 2011, $*** in 2012, $*** in 2013, $*** in 2014, $*** in 2015, and $*** in 2016; they were $*** in interim 2016 and $*** in interim 2017. Id.
159 See generally CR/PR at Tables II-8, II-9.
32
We have also considered whether any harm to the domestic industry in the future might be as a result of domestic producers’ own actions, either by virtue of their own imports of MLWF from China or their own production of substitute flooring products.160 As discussed above, although some domestic producers will continue to import some subject MLWF to complement their product lines, the industry as a whole is increasing production of certain products that were previously imported and consequently will be likely to reduce importation of certain subject MLWF products that are being produced domestically in greater quantities. Nevertheless, as previously explained, reduced subject imports by related parties are unlikely to reduce subject imports overall. In the same vein, we do not view the domestic industry’s production of non-wood substitute products as likely to harm its MLWF operations. As discussed above, the market for MLWF is expected to grow notwithstanding any competition from substitute products, and the domestic industry has significantly grown and expanded during the period of review. Accordingly, we find that the domestic industry likely will not be constrained by its participation in the market for substitute products and will be able to supply the U.S. market with additional MLWF.
Conclusion IV.
For the foregoing reasons, we determine that revocation of the antidumping duty and countervailing duty orders on MLWF from China would be likely lead to continuation or recurrence of material injury to an industry in the United States within a reasonably foreseeable time.
160 Alliance Posthearing Br. at 11-15 & Response to Questions Related to Import Volume and Market Shares; Alliance Prehearing Br. at 20-23; Lumber Liquidators’ Posthearing Br. at 11-12.
I-1
PART I: INTRODUCTION
BACKGROUND
On November 1, 2016, the U.S. International Trade Commission (“Commission” or “USITC”) gave notice, pursuant to section 751(c) of the Tariff Act of 1930, as amended (“the Act”),1 that it had instituted reviews to determine whether revocation of the countervailing duty order on multilayered wood flooring (“MLWF”) from China and the antidumping duty order on MLWF from China would likely lead to the continuation or recurrence of material injury to a domestic industry.2 3 On February 6, 2017, the Commission determined that it would conduct full reviews pursuant to section 751(c)(5) of the Act.4 The following tabulation presents information relating to the background and schedule of this proceeding:5
1 19 U.S.C. 1675(c). 2 Multilayered Wood Flooring from China Institution of Five-Year Reviews, 81 FR 75854, November 2,
2016. All interested parties were requested to respond to this notice by submitting the information requested by the Commission.
3 In accordance with section 751(c) of the Act, the U.S. Department of Commerce (“Commerce”) published a notice of initiation of five-year reviews of the subject antidumping and countervailing duty orders concurrently with the Commission’s notice of institution. Initiation of Five-Year (“Sunset”) Review, 81 FR 75808, November 1, 2016.
4 Multilayered Wood Flooring From China; Notice of Commission Determination to Conduct Full Five-Year Reviews, 82 FR 10588, February 14, 2017. All six Commissioners concluded that both the domestic and the respondent group responses were adequate and voted for full reviews.
5 The Commission’s notice of institution, notice to conduct full reviews, scheduling notice, and statement on adequacy are referenced in appendix A and may also be found at the Commission’s web site (internet address www.usitc.gov). Commissioners’ votes on whether to conduct expedited or full reviews may also be found at the web site. A list of witnesses appearing at the Commission’s hearing is presented in appendix B.
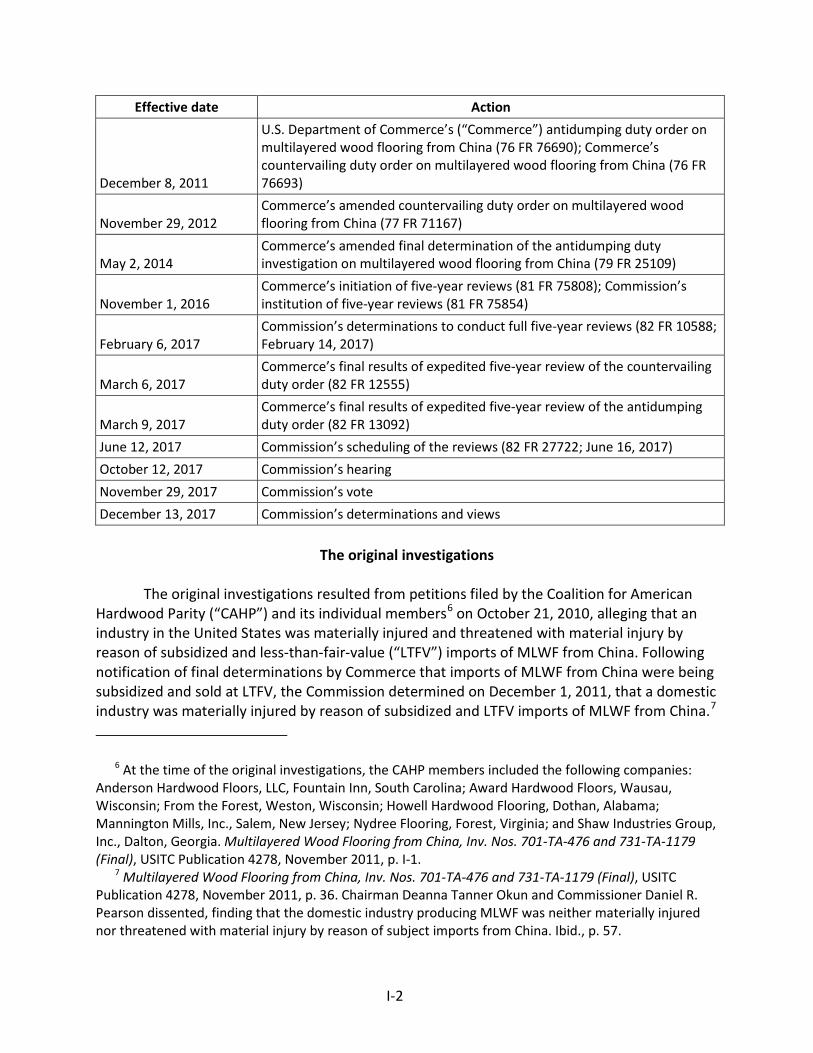
I-2
Effective date Action
December 8, 2011
U.S. Department of Commerce’s (“Commerce”) antidumping duty order on multilayered wood flooring from China (76 FR 76690); Commerce’s countervailing duty order on multilayered wood flooring from China (76 FR 76693)
November 29, 2012 Commerce’s amended countervailing duty order on multilayered wood flooring from China (77 FR 71167)
May 2, 2014 Commerce’s amended final determination of the antidumping duty investigation on multilayered wood flooring from China (79 FR 25109)
November 1, 2016 Commerce’s initiation of five-year reviews (81 FR 75808); Commission’s institution of five-year reviews (81 FR 75854)
February 6, 2017 Commission’s determinations to conduct full five-year reviews (82 FR 10588; February 14, 2017)
March 6, 2017 Commerce’s final results of expedited five-year review of the countervailing duty order (82 FR 12555)
March 9, 2017 Commerce’s final results of expedited five-year review of the antidumping duty order (82 FR 13092)
June 12, 2017 Commission’s scheduling of the reviews (82 FR 27722; June 16, 2017) October 12, 2017 Commission’s hearing November 29, 2017 Commission’s vote December 13, 2017 Commission’s determinations and views
The original investigations
The original investigations resulted from petitions filed by the Coalition for American Hardwood Parity (“CAHP”) and its individual members6 on October 21, 2010, alleging that an industry in the United States was materially injured and threatened with material injury by reason of subsidized and less-than-fair-value (“LTFV”) imports of MLWF from China. Following notification of final determinations by Commerce that imports of MLWF from China were being subsidized and sold at LTFV, the Commission determined on December 1, 2011, that a domestic industry was materially injured by reason of subsidized and LTFV imports of MLWF from China.7
6 At the time of the original investigations, the CAHP members included the following companies: Anderson Hardwood Floors, LLC, Fountain Inn, South Carolina; Award Hardwood Floors, Wausau, Wisconsin; From the Forest, Weston, Wisconsin; Howell Hardwood Flooring, Dothan, Alabama; Mannington Mills, Inc., Salem, New Jersey; Nydree Flooring, Forest, Virginia; and Shaw Industries Group, Inc., Dalton, Georgia. Multilayered Wood Flooring from China, Inv. Nos. 701-TA-476 and 731-TA-1179 (Final), USITC Publication 4278, November 2011, p. I-1.
7 Multilayered Wood Flooring from China, Inv. Nos. 701-TA-476 and 731-TA-1179 (Final), USITC Publication 4278, November 2011, p. 36. Chairman Deanna Tanner Okun and Commissioner Daniel R. Pearson dissented, finding that the domestic industry producing MLWF was neither materially injured nor threatened with material injury by reason of subject imports from China. Ibid., p. 57.
I-3
Commerce published the antidumping and countervailing duty orders on subject imports of MLWF from China on December 8, 2011.8
Subsequent proceedings
As the result of a 2012 appeal of the Commission’s affirmative determinations in the original investigations, the U.S. Court of International Trade (“CIT”) remanded four issues and affirmed all other aspects of the Commission’s determinations.9 The CIT directed the Commission on remand to (1) analyze and reconsider “its decision not to investigate domestic producers of hardwood plywood used for flooring”; (2) “make findings on the issue of price suppression/depression”; (3) “re-evaluate whether the subject imports were the ‘but-for’ cause of material injury to the domestic industry”; and (4) explain “the impact the subject imports had on the domestic industry in light of {the} collapse of the housing market during the period of investigation.” On remand, the Commission again determined that the domestic industry producing MLWF was materially injured by reason of subject imports from China.10
As the result of a 2012 decision by the CIT, Commerce published an amended countervailing duty order on November 29, 2012, in which two firms, Shanghai Eswell Enterprise Co., Ltd. and Elegant Living Corporation, were removed from the non-cooperative firms list, thereby subjecting their subject merchandise to the “all other” rate of 1.50 percent.11 As the result of a separate 2014 decision by the CIT, Commerce published an amended antidumping duty determination on May 2, 2014, in which the final weighted-average dumping margins for two firms, Zhejiang Layo Wood Industry Co., Ltd (“Layo Wood”) and the Samling Group,12 were modified to be de minimis.13 Following Commerce’s 2014 amended antidumping
8 Multilayered Wood Flooring from the People's Republic of China: Countervailing Duty Order, 76 FR 76693, December 8, 2011 and Multilayered Wood Flooring from the People's Republic of China: Amended Final Determination of Sales at Less Than Fair Value and Antidumping Duty Order, 76 FR 76690, December 8, 2011.
9 Swiff-Train Co. v. United States, 904 F. Supp. 2d 1336 (Ct. Int’l Trade 2013) and Multilayered Wood Flooring from China (Remand), Inv. Nos. 701-TA-476 and 731-TA-1179 (Remand), USITC Publication 4430, October 2013, p. 3, fn. 3.
10 Multilayered Wood Flooring from China (Remand), Inv. Nos. 701-TA-476 and 731-TA-1179 (Final), USITC Publication 4430, October 2013, p. 47. The Commission’s remand determinations were affirmed on judicial review. Swiff-Train Co. v. United States, 999 F. Supp. 2d 1334 (Ct. Int’l Trade 2014), aff’d, 793 F.3d 1355 (Fed. Cir. 2015).
11 Multilayered Wood Flooring from the People's Republic of China: Notice of Court Decision Not in Harmony with Final Determination of Countervailing Duty Investigation and Notice of Amended Countervailing Duty Order, 77 FR 71167, November 29, 2012.
12 The Samling Group consists of the following companies: Baroque Timber Industries (Zhongshan) Co., Ltd.; Riverside Plywood Corporation; Samling Elegant Living Trading (Labuan) Limited; Samling Riverside Co., Ltd.; and Suzhou Times Flooring Co., Ltd. Multilayered Wood Flooring from the People's Republic of China: Final Determination of Sales at Less Than Fair Value, 76 FR 64318, October 18, 2011.
I-4
duty determination, two firms, Layo Wood and Zhejiang Yuhua Timber Co., Ltd (“Yuhua Timber”), received de minimis final antidumping and countervailing duty margins, thereby excluding their imports of MLWF from both the antidumping and countervailing duty orders. In another separate action, certain separate rate respondents and importers on behalf of exporters assigned a separate rate challenged certain aspects of Commerce’s antidumping duty determination to the CIT, which sustained Commerce’s determination.14 The U.S. Court of Appeals for the Federal Circuit subsequently remanded the matter for Commerce to reconsider its separate rate determination.15 Currently, Commerce’s final remand determination is before the CIT.16
RELATED INVESTIGATIONS
The Commission has conducted two related proceedings on hardwood plywood. In each of these proceedings, the scope as defined by Commerce included statistical reporting numbers of the Harmonized Tariff Schedule of the United States (‘‘HTSUS’’) under which MLFW may enter the United States. In its 2013 final determinations on Hardwood Plywood from China (Inv. Nos. 701-TA-490 and 731-TA-1204), the Commission determined that a U.S. industry was not materially injured or threatened with material injury by reason of subject imports.17 In its 2016 preliminary determinations on Hardwood Plywood from China (Inv. Nos. 701-TA-565 and 731-TA-1341), the Commission determined that there was a reasonable indication that an industry in the United States was materially injured by reason of subject imports.18 The Commission is currently scheduled to make its final determinations regarding the most recent hardwood plywood investigations in December 2017.
(…continued)
13 Multilayered Wood Flooring from the People’s Republic of China: Notice of Court Decision Not in Harmony with the Final Determination and Amended Final Determination of the Antidumping Duty Investigation, 79 FR 25109, May 2, 2014.
14 Changzhou Hawd Flooring Co. v. United States, 44 F. Supp. 3d 1376 (Ct. Int’l Trade 2015); Changzhou Hawd Flooring Co. v. United States, 77 F. Supp. 3d 1351 (Ct. Int’l Trade 2015).
15 Changzhou Hawd Flooring Co. v. United States, 848 F.3d 1006, 1008 (Fed. Cir. 2017). 16 Certain plaintiffs are arguing that separate rate plaintiffs that received a zero margin should be
excluded from the antidumping duty order or that the order should be terminated in its entirety. The CIT has yet to rule on the challenges regarding Commerce’s final remand determination, and is unlikely to do so prior to the conclusion of these reviews because oral argument in that case is not scheduled until November 30, 2018. Hearing transcript, p. 192 (Levinson). Accordingly, the plaintiffs in that case presently continue to be covered by the antidumping duty order.
17 Hardwood Plywood from China, Inv. Nos. 701-TA-490 and 731-TA-1204 (Final), USITC Publication 4434, November 2013, p. 30.
18 Hardwood Plywood from China, Inv. Nos. 701-TA-565 and 731-TA-1341 (Preliminary), USITC Publication 4661, January 2017, p. 26.
I-5
SUMMARY DATA
Table I-1 presents a summary of data from the terminal years of the original investigations and the current full five-year reviews.19 Data from the original investigations and these current five-year reviews are not comparable in the following respects. First, apparent U.S. consumption and import shares in 2016 may be understated due to an understatement of import data. Forty-eight importers submitted usable questionnaire responses in these five-year reviews, compared to 65 in the original investigations.20 Second, Layo Wood was not excluded from Commerce’s antidumping and countervailing duty orders until 2014 following a remand decision by the CIT. Layo Wood’s exports of MLWF were considered subject merchandise in the original investigations, whereas they are treated as nonsubject in these five-year reviews.21
19 Complete summaries of these data appear in Appendix C. 20 In the original investigations, 65 responding U.S. importers reported importing 149 million square
feet of MLWF from China and 47 million square feet of MLWF from all other sources. Multilayered Wood Flooring from China, Inv. Nos. 701-TA-476 and 731-TA-1179 (Final), USITC Publication 4278, November 2011, p. IV-1, fn. 1 and table IV-2. In these first five-year reviews, 48 responding U.S. importers accounted for 156 million square feet of subject MLWF from China, 75 million square feet of nonsubject MLWF from China, and 49 million square feet of MLWF from all other sources.
In addition, an analysis of *** using the five six-digit subheadings under which MLWF may have been imported determined that dutied imports of MLWF from China in 2015, the first full year in which Commerce’s duty orders excluding Layo Wood were in effect, totaled $***, compared to $342 million of subject imports reported by responding importers.
21 In the original investigations, Layo Wood reported the following export quantities and values of MLWF to the United States: ***. See Layo Wood’s questionnaire submission from the original investigations, reproduced as EDIS document 622614 in the current proceeding.
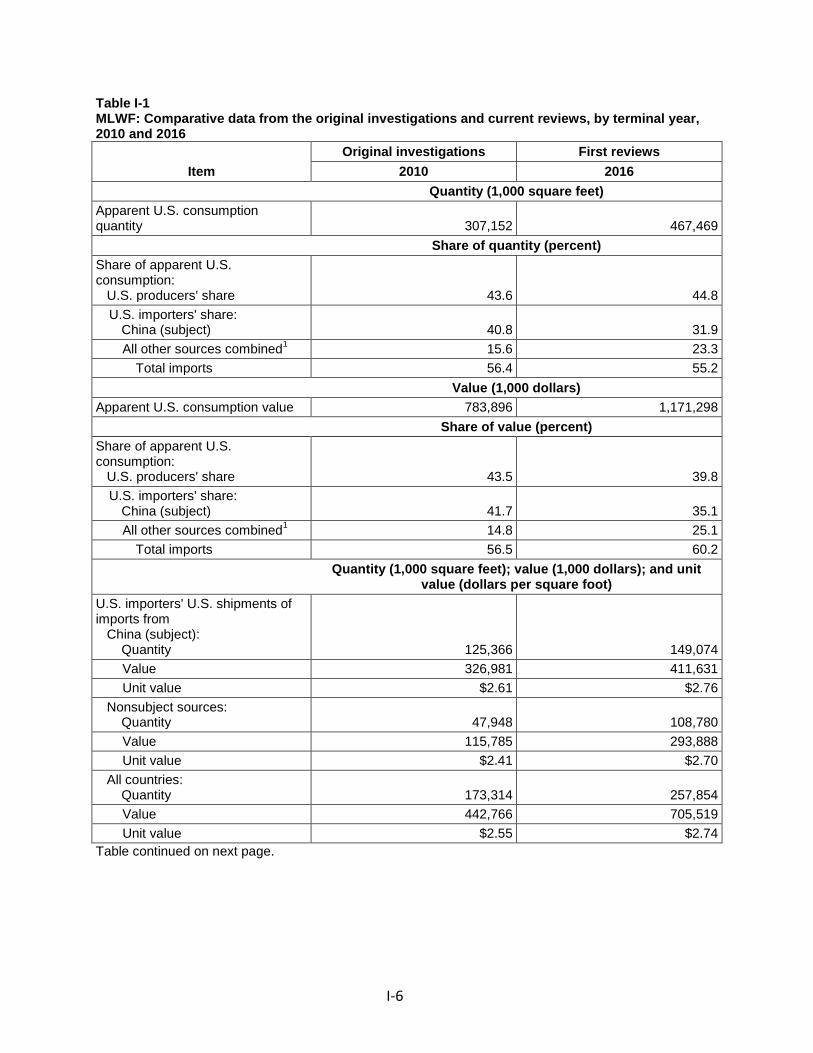
I-6
Table I-1 MLWF: Comparative data from the original investigations and current reviews, by terminal year, 2010 and 2016
Item Original investigations First reviews
2010 2016 Quantity (1,000 square feet) Apparent U.S. consumption quantity 307,152 467,469
Share of quantity (percent) Share of apparent U.S. consumption: U.S. producers' share 43.6 44.8
U.S. importers' share: China (subject) 40.8 31.9
All other sources combined1 15.6 23.3 Total imports 56.4 55.2
Value (1,000 dollars) Apparent U.S. consumption value 783,896 1,171,298
Share of value (percent) Share of apparent U.S. consumption: U.S. producers' share 43.5 39.8
U.S. importers' share: China (subject) 41.7 35.1
All other sources combined1 14.8 25.1 Total imports 56.5 60.2
Quantity (1,000 square feet); value (1,000 dollars); and unit
value (dollars per square foot) U.S. importers' U.S. shipments of imports from China (subject): Quantity 125,366 149,074
Value 326,981 411,631 Unit value $2.61 $2.76
Nonsubject sources: Quantity 47,948 108,780
Value 115,785 293,888 Unit value $2.41 $2.70
All countries: Quantity 173,314 257,854
Value 442,766 705,519 Unit value $2.55 $2.74
Table continued on next page.
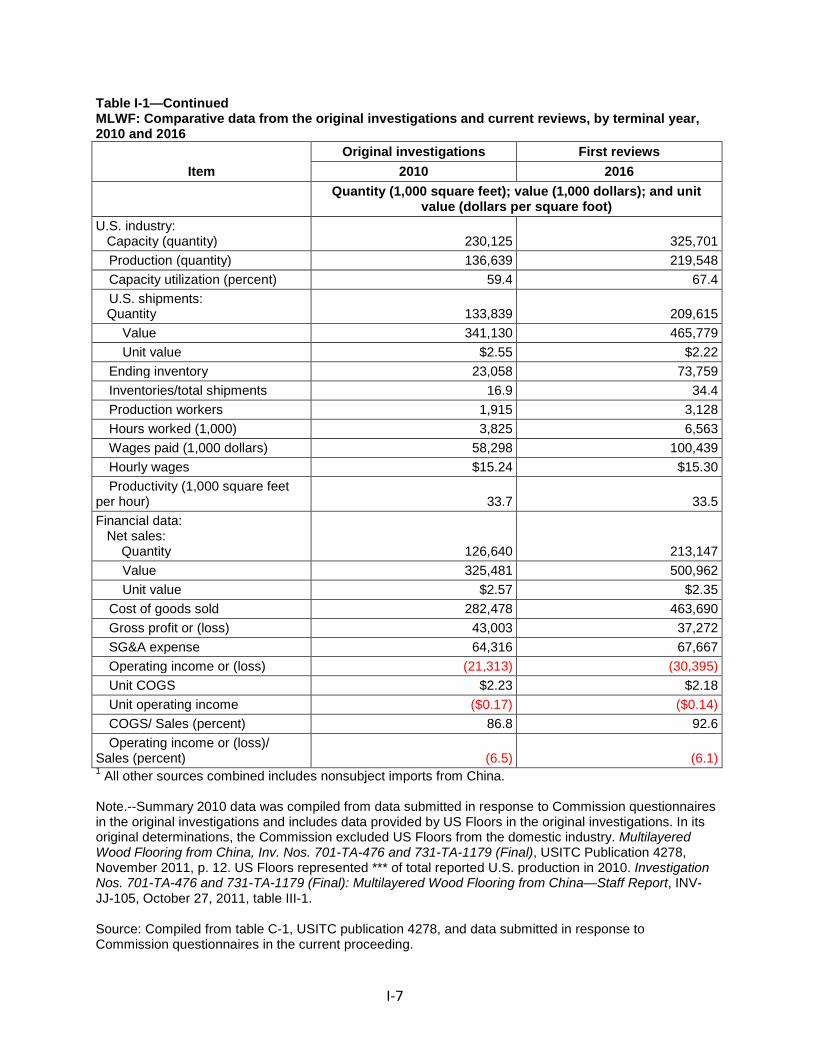
I-7
Table I-1—Continued MLWF: Comparative data from the original investigations and current reviews, by terminal year, 2010 and 2016
Item Original investigations First reviews
2010 2016
Quantity (1,000 square feet); value (1,000 dollars); and unit
value (dollars per square foot) U.S. industry: Capacity (quantity) 230,125 325,701
Production (quantity) 136,639 219,548 Capacity utilization (percent) 59.4 67.4 U.S. shipments:
Quantity 133,839 209,615 Value 341,130 465,779 Unit value $2.55 $2.22
Ending inventory 23,058 73,759 Inventories/total shipments 16.9 34.4 Production workers 1,915 3,128 Hours worked (1,000) 3,825 6,563 Wages paid (1,000 dollars) 58,298 100,439 Hourly wages $15.24 $15.30 Productivity (1,000 square feet
per hour) 33.7 33.5 Financial data: Net sales: Quantity 126,640 213,147
Value 325,481 500,962 Unit value $2.57 $2.35
Cost of goods sold 282,478 463,690 Gross profit or (loss) 43,003 37,272 SG&A expense 64,316 67,667 Operating income or (loss) (21,313) (30,395) Unit COGS $2.23 $2.18 Unit operating income ($0.17) ($0.14) COGS/ Sales (percent) 86.8 92.6 Operating income or (loss)/
Sales (percent) (6.5) (6.1) 1 All other sources combined includes nonsubject imports from China. Note.--Summary 2010 data was compiled from data submitted in response to Commission questionnaires in the original investigations and includes data provided by US Floors in the original investigations. In its original determinations, the Commission excluded US Floors from the domestic industry. Multilayered Wood Flooring from China, Inv. Nos. 701-TA-476 and 731-TA-1179 (Final), USITC Publication 4278, November 2011, p. 12. US Floors represented *** of total reported U.S. production in 2010. Investigation Nos. 701-TA-476 and 731-TA-1179 (Final): Multilayered Wood Flooring from China—Staff Report, INV-JJ-105, October 27, 2011, table III-1. Source: Compiled from table C-1, USITC publication 4278, and data submitted in response to Commission questionnaires in the current proceeding.
I-8
STATUTORY CRITERIA AND ORGANIZATION OF THE REPORT
Statutory criteria
Section 751(c) of the Act requires Commerce and the Commission to conduct a review no later than five years after the issuance of an antidumping or countervailing duty order or the suspension of an investigation to determine whether revocation of the order or termination of the suspended investigation “would be likely to lead to continuation or recurrence of dumping or a countervailable subsidy (as the case may be) and of material injury.”
Section 752(a) of the Act provides that in making its determination of likelihood of continuation or recurrence of material injury—
(1) IN GENERAL.-- . . . the Commission shall determine whether revocation of an order, or termination of a suspended investigation, would be likely to lead to continuation or recurrence of material injury within a reasonably foreseeable time. The Commission shall consider the likely volume, price effect, and impact of imports of the subject merchandise on the industry if the order is revoked or the suspended investigation is terminated. The Commission shall take into account--
(A) its prior injury determinations, including the volume, price effect, and impact of imports of the subject merchandise on the industry before the order was issued or the suspension agreement was accepted, (B) whether any improvement in the state of the industry is related to the order or the suspension agreement, (C) whether the industry is vulnerable to material injury if the
order is revoked or the suspension agreement is terminated, and (D) in an antidumping proceeding . . ., (Commerce’s findings) regarding duty absorption . . .. (2) VOLUME.--In evaluating the likely volume of imports of the subject
merchandise if the order is revoked or the suspended investigation is terminated, the Commission shall consider whether the likely volume of imports of the subject merchandise would be significant if the order is revoked or the suspended investigation is terminated, either in absolute terms or relative to production or consumption in the United States. In so doing, the Commission shall consider all relevant economic factors, including--
(A) any likely increase in production capacity or existing unused production capacity in the exporting country, (B) existing inventories of the subject merchandise, or likely increases in inventories, (C) the existence of barriers to the importation of such merchandise into countries other than the United States, and (D) the potential for product-shifting if production facilities in the foreign country, which can be used to produce the subject merchandise, are currently being used to produce other products.
I-9
(3) PRICE.--In evaluating the likely price effects of imports of the subject merchandise if the order is revoked or the suspended investigation is terminated, the Commission shall consider whether--
(A) there is likely to be significant price underselling by imports of the subject merchandise as compared to domestic like products, and (B) imports of the subject merchandise are likely to enter the United States at prices that otherwise would have a significant depressing or suppressing effect on the price of domestic like products.
(4) IMPACT ON THE INDUSTRY.--In evaluating the likely impact of imports of the subject merchandise on the industry if the order is revoked or the suspended investigation is terminated, the Commission shall consider all relevant economic factors which are likely to have a bearing on the state of the industry in the United States, including, but not limited to–
(A) likely declines in output, sales, market share, profits, productivity, return on investments, and utilization of capacity, (B) likely negative effects on cash flow, inventories, employment, wages, growth, ability to raise capital, and investment, and (C) likely negative effects on the existing development and production efforts of the industry, including efforts to develop a derivative or more advanced version of the domestic like product.
The Commission shall evaluate all such relevant economic factors . . . within the context of the business cycle and the conditions of competition that are distinctive to the affected industry. Section 752(a)(6) of the Act states further that in making its determination, “the
Commission may consider the magnitude of the margin of dumping or the magnitude of the net countervailable subsidy. If a countervailable subsidy is involved, the Commission shall consider information regarding the nature of the countervailable subsidy and whether the subsidy is a subsidy described in Article 3 or 6.1 of the Subsidies Agreement.”
Organization of report
Information obtained during the course of the reviews that relates to the statutory criteria is presented throughout this report. Summaries of trade and financial data for MLWF as collected in the original investigations and current reviews are presented in appendix C. U.S. industry data are based on the questionnaire responses of 11 U.S. producers of MLWF that are believed to have accounted for nearly all known domestic production of MLWF in 2016. U.S. import data and related information are based on the questionnaire responses of 48 U.S. importers of MLWF that are believed to have accounted for the majority of subject U.S. imports during 2016. Foreign industry data and related information are based on the questionnaire responses of 10 producers of MLWF and one exporter of MWLF. The 10 responding producers in China accounted for less than 12.2 percent of total production in China in the original
I-10
investigations,22 while the reported exports of all 11 responding firms in China were equivalent to 9.6 percent of the total reported subject imports of MLWF from China in 2016. Responses by U.S. producers, importers, purchasers, and foreign producers of MLWF to a series of questions concerning the significance of the existing antidumping and countervailing duty orders and the likely effects of revocation of such orders are presented in appendix D. Responses by U.S. purchasers to a question concerning changes in the U.S. industry since January 1, 2011 are presented in appendix E. Data concerning U.S. producers’ imports of MLWF are presented in appendix F.
COMMERCE’S REVIEWS
Commerce has not made scope rulings, duty absorption findings, or anti-circumvention determinations, or conducted critical circumstances reviews, since the orders were imposed. As previously discussed, recalculation of dumping margins pursuant to remand resulted in the revocation of the antidumping duty order with respect to certain companies. In addition, Commerce issued one scope clarification stating that the wood flooring products covered by the duty orders are composed of a minimum of three layers.23
Administrative reviews
Commerce has completed four administrative reviews on the countervailing duty order on MLWF. For the firms reviewed in 2011, Commerce assigned final duty deposit rates of 0.67 percent, 0.98 percent, and 1.21 percent for one firm each, and 0.83 percent for all other separate rate firms.24 For the firms reviewed in 2012, Commerce assigned a final duty deposit rate of 0.99 percent for all separate rate firms.25 For the firms reviewed in 2013, Commerce assigned final duty deposit rates of 0.92 percent and 1.83 percent for one firm each, and 1.38
22 In the original investigations, 52 responding producers in China reported producing 165.2 million square feet of MLWF in 2010. Multilayered Wood Flooring from China, Inv. Nos. 701-TA-476 and 731-TA-1179 (Final), USITC Publication 4278, November 2011, table VII-2. Although the total is believed to represent a majority of all production of MLWF in China, Commerce’s antidumping duty order included 92 individually-named producers in China. Multilayered Wood Flooring from the People's Republic of China: Amended Final Determination of Sales at Less Than Fair Value and Antidumping Duty Order, 76 FR 76690, December 8, 2011.
23 Multilayered Wood Flooring from the People’s Republic of China: Final Clarification of the Scope of the Antidumping and Countervailing Duty Orders, 82 FR 27799, June 19, 2017.
24 Multilayered Wood Flooring from the People's Republic of China: Final Results and Partial Rescission of Countervailing Duty Administrative Review; 2011, 79 FR 45178, August 4, 2014.
25 Multilayered Wood Flooring from the People's Republic of China: Final Results and Partial Rescission of Countervailing Duty Administrative Review; 2012, 80 FR 41007, July 14, 2015 and Multilayered Wood Flooring from the People's Republic of China: Correction to Final Results and Partial Rescission of Countervailing Duty Administrative Review; 2012, 80 FR 50265, August 19, 2015.
I-11
percent for all other separate rate firms.26 For the firms reviewed in 2014, Commerce assigned final duty deposit rates of 0.67 percent and 1.45 percent for one firm each, and 1.06 percent for all other separate rate firms.27 The rate for all other firms remained unchanged at 1.50 percent for all administrative review periods.
Commerce has completed four administrative reviews on the antidumping duty order on MLWF, and is currently conducting a fifth.28 For the firms reviewed from 2011 to 2012, Commerce assigned de minimis final duty deposit rates for Armstrong Wood Products (Kunshan) Co., Ltd.29 and Nanjing Minling Wooden Industry Co. Ltd.,30 and a 5.92 percent final duty deposit rate for all other separate rate firms.31 For the firms reviewed from 2012 to 2013, Commerce assigned a de minimis final duty deposit rate for Dalian Dajen Wood Co., Ltd. and a 13.74 percent final duty deposit rate for all other separate rate firms.32 For the firms reviewed from 2013 to 2014, Commerce assigned a de minimis final duty deposit rate for Dalian Penghong Floor Products Co., Ltd./Dalian Shumaike Floor Manufacturing Co., Ltd.33 and a 17.37 percent final duty deposit rate for all other separate rate firms.34 For the firms reviewed from
26 Multilayered Wood Flooring from the People's Republic of China: Final Results and Partial Rescission of Countervailing Duty Administrative Review; 2013, 81 FR 32291, May 23, 2016.
27 Multilayered Wood Flooring from the People’s Republic of China: Final Results and Partial Rescission of Countervailing Duty Administrative Review; 2014, 82 FR 22311, May 15, 2017 and Multilayered Wood Flooring From the People’s Republic of China: Notice of Correction to the Final Results of Countervailing Duty Administrative Review; 2014, 82 FR 24941, May 31, 2017.
28 Initiation of Antidumping and Countervailing Duty Administrative Reviews, 82 FR 13795, March 15, 2017.
29 In its review from 2013 to 2014, Commerce reinstated a final duty deposit rate of 17.37 percent for Armstrong Kunshan. Multilayered Wood Flooring from the People's Republic of China: Final Results of Antidumping Duty Administrative Review; 2013-2014, 81 FR 46899, July 19, 2016.
30 In its review from 2012 to 2013, Commerce reinstated a final duty deposit rate of 13.74 percent for Nanjing Minling. Multilayered Wood Flooring from the People's Republic of China: Final Results of Antidumping Duty Administrative Review and Final Results of New Shipper Review; 2012-2013, 80 FR 41476, July 15, 2015.
31 Multilayered Wood Flooring from the People's Republic of China: Amended Final Results of Antidumping Duty Administrative Review; 2011-2012, 79 FR 35314, June 20, 2014.
32 Multilayered Wood Flooring from the People's Republic of China: Final Results of Antidumping Duty Administrative Review and Final Results of New Shipper Review; 2012-2013, 80 FR 41476, July 15, 2015.
33 In its review from 2014 to 2015, Commerce reinstated a preliminary dumping margin of 4.92 percent for Dalian Penghong. Multilayered Wood Flooring from the People's Republic of China: Preliminary Results of Antidumping Duty Administrative Review, Preliminary Determination of No Shipments, and Preliminary Partial Rescission of Antidumping Duty Administrative Review; 2014-2015, 81 FR 95114, December 27, 2016.
34 Multilayered Wood Flooring from the People's Republic of China: Final Results of Antidumping Duty Administrative Review; 2013-2014, 81 FR 46899, July 19, 2016 and Multilayered Wood Flooring from the People’s Republic of China: Correction to the Final Results of Antidumping Duty Administrative Review, Rescission of Review, in Part, 82 FR 10332, February 10, 2017.
I-12
2014 to 2015, Commerce assigned a de minimis final duty deposit rate for all separate rate firms.35
Regarding new shipper reviews, Commerce determined that five new shippers did not make sales of subject merchandise at less than normal value. They were: Power Dekor Group Co., Ltd.36 in the 2011 to 2012 review; Dalian Huade Wood Product Co., Ltd.;37 Linyi Bonn Flooring Manufacturing Co., Ltd.;38 Zhejiang Fuerjia Wooden Co., Ltd.39 in the 2012 to 2013 review;40 and Jiangsu Keri Wood Co., Ltd. in the 2014 to 2015 review.41 Commerce also determined that four new shippers’ sales were not bona fide.42
35 Multilayered Wood Flooring from the People’s Republic of China: Final Results of Antidumping Duty Administrative Review, Final Determination of No Shipments, and Final Partial Rescission of Antidumping Duty Administrative Review; 2014–2015, 82 FR 25766, June 5, 2017.
36 In its review from 2013 to 2014, Commerce assigned a final dumping margin of 17.37 percent for Power Dekor. Multilayered Wood Flooring from the People's Republic of China: Final Results of Antidumping Duty Administrative Review; 2013-2014, 81 FR 46899, July 19, 2016.
37 In its review from 2013 to 2014, Commerce assigned a final dumping margin of 17.37 percent for Dalian Huade. Ibid.
38 In its review from 2014 to 2015, Commerce assigned a preliminary dumping margin of 4.92 percent for Linyi Bonn. Multilayered Wood Flooring from the People's Republic of China: Preliminary Results of Antidumping Duty Administrative Review, Preliminary Determination of No Shipments, and Preliminary Partial Rescission of Antidumping Duty Administrative Review; 2014-2015, 81 FR 95114, December 27, 2016.
39 In its review from 2014 to 2015, Commerce assigned a preliminary dumping margin of 4.92 percent for Zhejiang Fuerjia. Ibid.
40 Multilayered Wood Flooring from the People's Republic of China: Final Results of Antidumping Duty New Shipper Review; 2011-2012, 78 FR 52502, August 23, 2013 and Multilayered Wood Flooring from the People's Republic of China: Final Results of Antidumping Duty New Shipper Reviews; 2012-2013, 79 FR 66355, November 7, 2014.
41 Multilayered Wood Flooring from the People’s Republic of China: Final Results and Partial Rescission of Antidumping Duty New Shipper Reviews; 2014–2015, 82 FR 25773, June 5, 2017.
42 Multilayered Wood Flooring from the People's Republic of China: Rescission of Antidumping Duty New Shipper Review; 2013-2014, 81 FR 46906, July 19, 2016; Multilayered Wood Flooring from the People's Republic of China: Rescission of Antidumping Duty New Shipper Reviews; 2014-2015, 81 FR 74393, October 26, 2016; and Multilayered Wood Flooring from the People’s Republic of China: Final Results and Partial Rescission of Antidumping Duty New Shipper Reviews; 2014–2015, 82 FR 25773, June 5, 2017.
I-13
Changed circumstances reviews
Commerce has conducted three changed circumstance reviews. On September 30, 2014, Commerce determined that Linyi Youyou Wood Co., Ltd. is the successor-in-interest to Shanghai Lizhong Wood Product Co., Ltd.43 On July 13, 2015, Commerce determined that Zhejiang Fuma Warm Technology Co., Ltd. is the successor-in-interest to Huzhou Fuma Wood Bus. Co., Ltd.44 On November 16, 2013, Commerce determined that Sino-Maple (JiangSu) Co., Ltd. is the successor-in-interest to Jiafeng Wood (Suzhou) Co., Ltd.45 On March 22, 2017, Commerce determined that Yihua Lifestyle Technology Co., Ltd. is the successor-in-interest to Guangdong Yihua Timber Industry Co., Ltd.46
Five-year reviews
Commerce has issued the final results of its expedited reviews with respect to MLWF from China. Table I-2 presents the countervailable subsidy margins calculated by Commerce in its original investigations and first reviews. Table I-3 presents dumping margins calculated by Commerce in its original investigations and first reviews.
43 Multilayered Wood Flooring from the People's Republic of China: Final Results of Changed Circumstances Review, 79 FR 58740, September 30, 2014.
44 Multilayered Wood Flooring from the People's Republic of China: Final Results of Changed Circumstances Review 80 FR 39998, July 13, 2015.
45 Multilayered Wood Flooring from the People's Republic of China: Final Results of Changed Circumstances Review, 80 FR 70756, November 16, 2015.
46 Multilayered Wood Flooring from the People’s Republic of China: Final Results of Changed Circumstances Reviews, 82 FR 14691, March 22, 2017.

I-14
Table I-2 MLWF: Commerce’s original and first five-year countervailable subsidy margins for producers in China
Producer Original margin
(percent) Amended margin
(percent) First five-year review
margin (percent) Layo Wood de minimis de minimis --- Yuhua Timber de minimis de minimis --- Fine Furniture (Shanghai) Ltd.; Great Wood (Tonghua) Ltd.; Fine Furniture Plantation (Shishou) Ltd. 1.50 1.50 1.90 Shanghai Eswell Enterprise Co., Ltd.; Elegant Living Corporation 26.73 1.50(1) 27.37(2)
122 other separate rate companies specifically named in Commerce’s order 26.73 26.73 27.37 All others 1.50 1.50 2.27 1 Shanghai Eswell Enterprise Co., Ltd. and Elegant Living Corporation were removed from the list of non-cooperating companies, thereby subjecting their subject merchandise to the “all others” rate. 2 Commerce classified Shanghai Eswell Enterprise Co., Ltd. and Elegant Living Corporation as non-cooperating companies in its expedited review of the countervailing duty order. Source: Multilayered Wood Flooring from the People's Republic of China: Countervailing Duty Order, 76 FR 76693, December 8, 2011; Multilayered Wood Flooring from the People's Republic of China: Notice of Court Decision Not in Harmony with Final Determination of Countervailing Duty Investigation and Notice of Amended Countervailing Duty Order, 77 FR 71167, November 29, 2012; and Multilayered Wood Flooring From the People’s Republic of China: Final Results of Expedited First Sunset Review of the Countervailing Duty Order, 82 FR 12555, March 6, 2017, and accompanying Issues and Decision Memorandum at Appendix I.
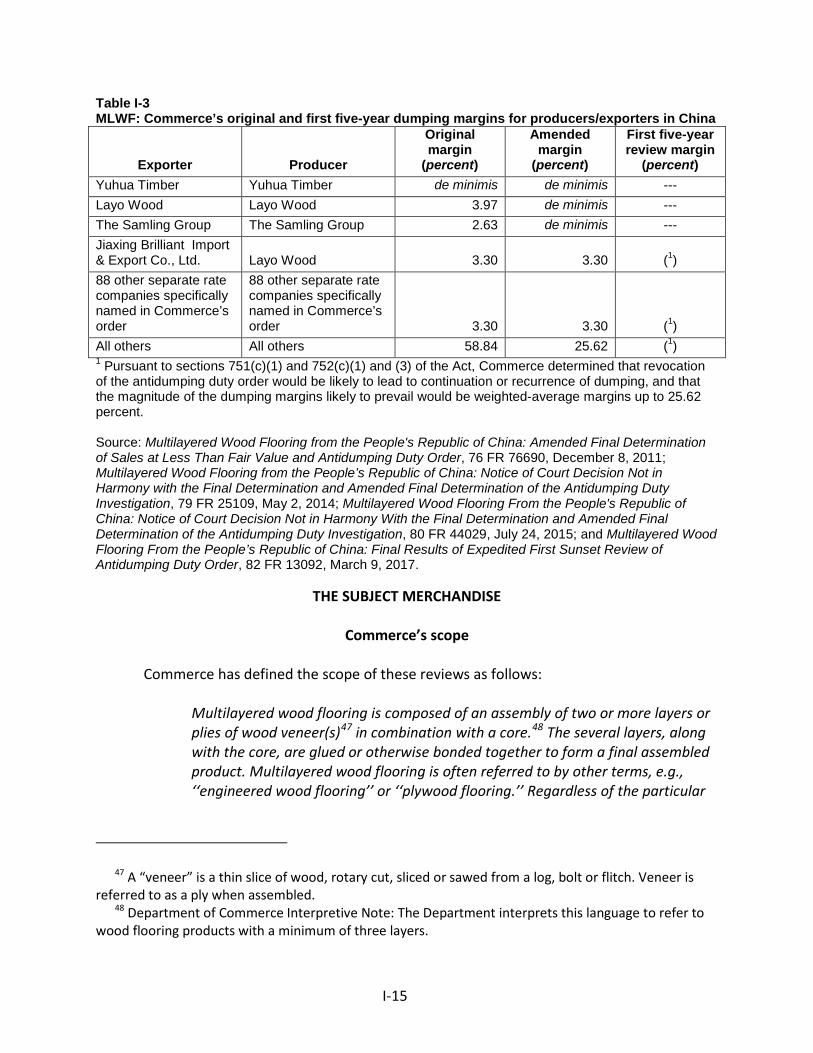
I-15
Table I-3 MLWF: Commerce’s original and first five-year dumping margins for producers/exporters in China
Exporter Producer
Original margin
(percent)
Amended margin
(percent)
First five-year review margin
(percent) Yuhua Timber Yuhua Timber de minimis de minimis --- Layo Wood Layo Wood 3.97 de minimis --- The Samling Group The Samling Group 2.63 de minimis --- Jiaxing Brilliant Import & Export Co., Ltd. Layo Wood 3.30 3.30 (1) 88 other separate rate companies specifically named in Commerce’s order
88 other separate rate companies specifically named in Commerce’s order 3.30 3.30 (1)
All others All others 58.84 25.62 (1) 1 Pursuant to sections 751(c)(1) and 752(c)(1) and (3) of the Act, Commerce determined that revocation of the antidumping duty order would be likely to lead to continuation or recurrence of dumping, and that the magnitude of the dumping margins likely to prevail would be weighted-average margins up to 25.62 percent. Source: Multilayered Wood Flooring from the People's Republic of China: Amended Final Determination of Sales at Less Than Fair Value and Antidumping Duty Order, 76 FR 76690, December 8, 2011; Multilayered Wood Flooring from the People’s Republic of China: Notice of Court Decision Not in Harmony with the Final Determination and Amended Final Determination of the Antidumping Duty Investigation, 79 FR 25109, May 2, 2014; Multilayered Wood Flooring From the People's Republic of China: Notice of Court Decision Not in Harmony With the Final Determination and Amended Final Determination of the Antidumping Duty Investigation, 80 FR 44029, July 24, 2015; and Multilayered Wood Flooring From the People’s Republic of China: Final Results of Expedited First Sunset Review of Antidumping Duty Order, 82 FR 13092, March 9, 2017.
THE SUBJECT MERCHANDISE
Commerce’s scope
Commerce has defined the scope of these reviews as follows:
Multilayered wood flooring is composed of an assembly of two or more layers or plies of wood veneer(s)47 in combination with a core.48 The several layers, along with the core, are glued or otherwise bonded together to form a final assembled product. Multilayered wood flooring is often referred to by other terms, e.g., ‘‘engineered wood flooring’’ or ‘‘plywood flooring.’’ Regardless of the particular
47 A “veneer” is a thin slice of wood, rotary cut, sliced or sawed from a log, bolt or flitch. Veneer is referred to as a ply when assembled.
48 Department of Commerce Interpretive Note: The Department interprets this language to refer to wood flooring products with a minimum of three layers.
I-16
terminology, all products that meet the description set forth herein are intended for inclusion within the definition of subject merchandise. All multilayered wood flooring is included within the definition of subject merchandise, without regard to: Dimension (overall thickness, thickness of face ply, thickness of back ply, thickness of core, and thickness of inner plies; width; and length); wood species used for the face, back and inner veneers; core composition; and face grade. Multilayered wood flooring included within the definition of subject merchandise may be unfinished (i.e., without a finally finished surface to protect the face veneer from wear and tear) or ‘‘prefinished’’ (i.e., a coating applied to the face veneer, including, but not exclusively, oil or oil-modified or water-based polyurethanes, ultraviolet light cured polyurethanes, wax, epoxy-ester finishes, moisture-cured urethanes and acid-curing formaldehyde finishes). The veneers may be also soaked in an acrylic-impregnated finish. All multilayered wood flooring is included within the definition of subject merchandise regardless of whether the face (or back) of the product is smooth, wire brushed, distressed by any method or multiple methods, or hand-scraped. In addition, all multilayered wood flooring is included within the definition of subject merchandise regardless of whether or not it is manufactured with any interlocking or connecting mechanism (for example, tongue-and-groove construction or locking joints). All multilayered wood flooring is included within the definition of the subject merchandise regardless of whether the product meets a particular industry or similar standard.
The core of multilayered wood flooring may be composed of a range of materials, including but not limited to hardwood or softwood veneer, particleboard, medium-density fiberboard, high-density fiberboard (‘‘HDF’’), stone and/or plastic composite, or strips of lumber placed edge-to-edge. Multilayered wood flooring products generally, but not exclusively, may be in the form of a strip, plank, or other geometrical patterns (e.g., circular, hexagonal). All multilayered wood flooring products are included within this definition regardless of the actual or nominal dimensions or form of the product. Specifically excluded from the scope are cork flooring and bamboo flooring, regardless of whether any of the sub-surface layers of either flooring are made from wood. Also excluded is laminate flooring. Laminate flooring consists of a top wear layer sheet not made of wood, a decorative paper layer, a core-layer of HDF, and a stabilizing bottom layer.
I-17
Commerce’s final clarification of the scope of the antidumping and countervailing duty orders noted that imports of the subject merchandise are provided for under more than 100 statistical reporting numbers of the HTSUS. 49 While HTSUS statistical reporting numbers are provided for convenience and customs purposes, the written description of the subject merchandise is dispositive.
Tariff treatment
Imports of multilayered wood flooring are classifiable within several subheadings in Chapter 44 of the HTSUS. The predominant classifications are subheadings 4412.31 and 4412.32, which provide as follows:
4412.31: Plywood consisting solely of sheets of wood (other than of bamboo),
each ply not exceeding 6 mm in thickness, with at least one outer ply of tropical wood (general rates of duty are free or 8 percent ad valorem).
4412.32: Plywood consisting solely of sheets of wood (other than of bamboo),
each ply not exceeding 6 mm in thickness; with at least one outer ply of nonconiferous wood (general rates of duty are free, 5.1 percent, or 8 percent ad valorem).
To a lesser degree, and depending on the particular composition and construction of the
product (particularly the composition of the face veneer and the core), imports of multilayered wood flooring may be classified under other subheadings encompassed within HTS heading 4412, including subheadings 4412.39, 4412.94, and 4412.99. These subheadings provide as follows:
4412.39: Plywood consisting solely of sheets of wood (other than of bamboo),
each ply not exceeding 6 mm in thickness; with both outer plies of coniferous wood (general rates of duty are free, 3.4 percent, 5.1 percent, or 8 percent ad valorem).
4412.94: Blockboard, laminboard and battenboard (general rates of duty are free,
3.4 percent, 5.1 percent, or 8 percent ad valorem). 4412.99: Other plywood other than blockboard, laminboard and battenboard, with
at least one outer ply of nonconiferous wood (general rates of duty are free, 3.4 percent, 5.1 percent, or 8 percent ad valorem).
49 Multilayered Wood Flooring from the People’s Republic of China: Final Clarification of the Scope of the Antidumping and Countervailing Duty Orders, 82 FR 27799, June 19, 2017.
I-18
Decisions on the tariff classification and treatment of imported goods are within the authority of U.S. Customs and Border Protection.
THE PRODUCT
Description and applications
MLWF is a type of wood flooring product fabricated by using multiple layers of wood veneer or other kinds of wood materials. It can be composed of three to ten laminated wood layers or plies that include a core sandwiched between a back or bottom veneer layer and a face veneer surface of a desired wood species and finish.50 While the core is typically composed of wood veneers, it may also be made of solid wood pieces or a composite wood such as medium- or high-density fiberboard (MDF or HDF). A wide range of MLWF is produced both domestically and abroad in terms of thicknesses, widths, species, and finishes.
Thicknesses of MLWF typically range from ¼ inch to ¾ inch with the most common thicknesses being ⅜ inch and ½ inch. The number of plies in domestically produced as well as imported MLWF varies. The majority of U.S.-manufactured MLWF is made using five plies because the automated manufacturing processes, the sizes of trees, and species used in the United States allow the use of thicker veneers.51 However, some MLWF is constructed with as many as nine plies of veneers. Irrespective of the number of plies, veneer layers are glued with their grain in alternating directions to provide strength and durability to the product. The surface or face veneer is referred to as the “wear” layer and generally varies from one millimeter (0.04 inches) to 6.35 millimeters (0.25 inches) in thickness.52 The thicker the face veneer, the greater the surface durability. However, technology has advanced to enable production of MLWF using a very thin face veneer or wear layer with impregnated resins and finishes to enhance durability.53
MLWF generally can be installed in the same way as the solid product. However, unlike solid wood flooring, which typically can only be installed by nailing over a wood underlayment, certain types of MLWF can be glued directly onto a concrete substrate or installed using a
50 The industry generally uses between two to ten plies to construct MLWF. Commerce has defined the scope of these five-year reviews to include wood flooring products with a minimum of three layers. Multilayered Wood Flooring from the People’s Republic of China: Final Clarification of the Scope of the Antidumping and Countervailing Duty Orders, 82 FR 27799, June 19, 2017.
51 In the original investigations, petitioners argued that Chinese manufacturers use thinner veneers and more plies because they use smaller diameter logs of species that must be pressed at lower temperatures. In contrast, respondents noted that more plies require additional handling and processing. Multilayered Wood Flooring from China, Inv. Nos. 701-TA-476 and 731-TA-1179 (Final), USITC Publication 4278, November 2011, p. I-8.
52 Old House Online, “Hardwood vs. Engineered Flooring,” November 10, 2014 and Bernstein, Fred A.; New York Times, “Engineered Floors Are Getting Serious,” September 28, 2011.
53 Ryan, Ken, Floor Covering News, “Hardwood flooring finishes deliver aesthetics, durability,” August 31/September 7, 2015; Volume 30, Issue 6.
I-19
glueless click and lock system. MLWF tends to be more stable than solid wood flooring so it can be installed below grade or in areas with high humidity where solid wood flooring is not typically suitable.54
While standard 19.05 millimeter (¾ inch) thick solid wood flooring with a 7.9 millimeter (5/16 inch) top wear layer can be refinished up to seven times, the thinner wear layers in MLWF reduce or preclude refinishing.55 A thinner wood flooring product such as MLWF may be more suitable than using solid wood flooring in a remodel because, for example, doors might otherwise have to be trimmed to fit thicker flooring.56
MLWF generally is produced and sold in strips, planks, or geometric patterns such as parquet flooring. Typically, MLWF is sold in lengths of 42 to 58 inches with widths ranging from 2¼ to 8 inches, but it is also available in longer lengths and wider dimensions. Recent market trends have been moving toward using wider planks and longer boards.57
MLWF is most often sold as a pre-finished product. This lends itself for use as a design element in remodeling projects where consumers may prefer to avoid dust and finishing odors. However, MLWF is also widely used in new construction. The rustic, aged, and weathered textures of hand-scraped and wire-brushed surfaces make scratches and dents part of the appearance. Color is added to these and to smooth finishes using several stain technologies such as water, alcohol, and oil stains, as well as “reactive” products that are designed to react with the wood species’ natural tannins. Cerused—or limed—finishes use a technique that layers multiple colors on top of each other.58 59
The residential market accounts for the vast majority of the total market, but MLWF is also used in commercial applications. In 2015 and 2016, the residential sector accounted for an estimated 79 percent of hardwood flooring end-use markets and non-residential end-uses represented 21 percent.60
Within the residential market, historically, the product is used in roughly equal volumes in new construction and for remodeling, although the actual market
54 Old House Online, “Hardwood vs. Engineered Flooring,” November 10, 2014. 55 MLWF with thicker (three millimeter-plus) wear layers can be sanded two or more times and
MLWF with thinner wear layers (less than two millimeters) cannot be refinished. 56 Tucker, Reginald, Floor Covering News, “Wood: New Engineered Platforms Provide Momentum,”
June 26, 2017, Volume 32, Issue 1. 57 Konzak, Lindsay and Angela Poulson, Hardwood Floors Magazine, “2018 Industry Outlook,”
October 2, 2017. 58 The cerused finish process uses multiple layers of color; the initial color coat is followed by at least
one additional coat of a contrasting or complementary color. This process can be costly because more drying time and labor is needed than applying one color.
59 Respondents noted U.S. producers and “zero mills” in China do not provide these specialized finishes, Alliance posthearing brief, p. 6. In contrast, petitioners argued that these finishes are not new in the industry and that reactive finishes used by Chinese producers involve techniques that cause caustic fumes, which are federally regulated in the United States. Domestic producers use a process that provides the reactive finish look without the associated toxicity concerns, CAHP posthearing brief, p. 28.
60 Floor Covering Weekly, “Statistical Report 2015,” July 25, 2016, Chart 12, p. 23 and Floor Covering Weekly, “Statistical Report 2016,” July 24, 2017, Chart 6, p. 18.
I-20
share of each fluctuates with the strength of activity in each market. The shares were out of step with historical norms in 2016, as industry data indicate that replacements accounted for 67 percent of total hardwood flooring sales (solid flooring and MLWF), while new construction accounted for 33 percent of the residential market.61 Industry reports indicate that engineered wood flooring accounts for a greater share of the wood flooring market, as compared to solid hardwood flooring.62
Manufacturing processes
The production of MLWF typically begins with veneers that have been peeled or sliced from debarked logs, flitches, or lumber, sorted and graded for quality, and dried. MLWF is highly resource-efficient. On average, peeling a log for MLWF results in an 80 percent yield.63 In contrast, solid wood flooring yields only 20 percent from each log.64 The balance of the log not used for flooring is used for other products, including wood chips for pulp and energy.
Veneer used in the manufacture of MLWF is a thin sheet of wood removed from a log by one of several processes, including rotary and several slicing techniques. Most wood veneer is the result of rotary cuts. Rotary cutting involves a log rotated against a knife in a lathe. The veneer comes off the log similar to removing paper towels from a roll. Rotary cutting produces a variegated grain pattern, yields the most veneer per log, and is generally the least expensive of wood veneers.65
Slicing yields less veneer per log, but results in a more distinct repeating pattern—the cathedral and straight grain patterns—and is more desirable. Plain slicing involves a flitch, half or quarter log loaded into a machine with the widest and flattest side pushed against the slicer, cutting along the growth rings. The slicer then raises and lowers the flitch or log on a diagonal angle, cut by a stationary knife. The plain sliced method is the most common, offers the highest yield of the slicing methods, and is the least expensive. The quarter sliced method is similar; however, it cuts perpendicular to the growth rings, producing a straight grain appearance. The yield is lower per log than plain slicing and is thus more expensive. Rift cutting is usually only done on red and white oak to minimize flaking in the appearance of the straight grains. The knife cuts in a 15-degree angle to the radius of the quarter log. It is the most expensive cutting method because it yields the least veneer per log.66
61 Floor Covering Weekly, “Statistical Report 2016,” July 24, 2017, Chart 6, p. 18. Calculation is based on proportions of total end uses represented within residential market only.
62 Floor Covering Weekly, “Statistical Report 2016,” July 24, 2017, p. 19. U.S. producer, Shaw Floors, indicated that solid wood sales account for approximately 40-percent of the wood floor category.
63 The top layer of MLWF is thinner; a log that would produce a single solid floorboard can yield multiple engineered boards.
64 Multilayered Wood Flooring from China, Inv. Nos. 701-TA-476 and 731-TA-1179 (Final), USITC Publication 4278, November 2011, p. I-9.
65 HPVA, “Hardwood Plywood Handbook,” 2004, pp. 8-11. 66 Respondent interested parties argued that domestic producers use rotary wear layers in their
MLWF products and the Chinese imports use mostly sliced and sawn wear layers, Alliance posthearing (continued...)

I-21
Once peeled or sliced, the veneers are stacked with the grain of each layer perpendicular to the next and glued under high pressure.67
To ensure stability, core layers must be uniform in moisture content, and must be of a species and quality that allow for even expansion and contraction. Some MLWF uses a core layer of composite wood material or strips of lumber instead of veneer.68 Either U.S. producers purchase raw logs and peel veneer for use in the MLWF core and/or wear layer, or they purchase the core hardwood plywood and/or veneer from other unrelated manufacturers and produce the finished product from those materials. The face veneer for MLWF is selected based upon marketing considerations and consumer preferences. Face veneers are typically of high quality with few or no defects, but grades of flooring can vary depending on the quality of the veneer. During several stages of the manufacturing process, defects in the veneers and/or core plywood are removed or repaired.
The glues used to make MLWF have moved to soy-based and other alternatives to those made with urea-formaldehyde.69 Once glue is applied, the wood layers are made into a panel using a heated press. The panels are sanded and cut to the desired strip or plank width.
Next, the edges of the planks or strips are shaped with a tongue and groove to facilitate installation. The tongue and groove profile permits expansion and contraction of the wood flooring once installed. Some manufacturers incorporate a click and lock system so that the MLFW can be installed without glue or nails as a “floating” floor. If the MLWF flooring is to be finished prior to installation (as most is), the edges of the surface are slightly beveled to hide any differences in thicknesses between planks where the planks connect to each other.
The final stage of the manufacturing process involves finishing. Unless the natural color of the face veneer is preferred, a stain is applied. Flooring with hand-scraped or distressed (…continued) brief, pp. 5-6. In contrast, domestic interested parties stated that since this is a growing market segment, and that a domestic producer *** has added this capacity and domestic production started in early 2017 and will increase in the near term. CAHP posthearing brief, exh. 5.
67 This requires a press used by most MLWF producers in conjunction with additional steps in producing MLWF (called a press line). Most press lines require additional components, such as layup stations and glue spreaders. Installation of the press line is an additional expense and can cost more than the press itself.
68 For example, hardwood plywood cores offer more resistance to shrinkage and expansion with changes in weather than solid wood products, whereas HDF cores, made from synthetic material, offer greater moisture resistance and guard the product from shrinking and cupping.
69 California regulations, enacted by the California Air Resource Board, regulate formaldehyde emissions on products sold in California. In addition, the U.S. Environmental Protection Agency has finalized a rule that is identical to the California “Phase 2” formaldehyde emission standards (other than record keeping and disclosure requirements), for certain wood products, as regulated under TSCA Title VI (https://www.epa.gov/formaldehyde/consumer-frequently-asked-questions-formaldehyde-standards-composite-wood-products-act#PDFanchor). The EPA has proposed an amendment to the final rule to align it with multiple voluntary consensus standards quality control test methods. Voluntary Consensus Standards Update; Formaldehyde Emission Standards for Composite Wood Products, 82 FR 49302, October 25, 2017, https://www.federalregister.gov/documents/2017/10/25/2017-23061/voluntary-consensus-standards-update-formaldehyde-emission-standards-for-composite-wood-products.
I-22
appearance that emulates the texture of an older, worn hardwood floor is popular.70 To achieve this look, the flooring is textured prior to finishing. Generally, the wear layers on the top of the MLWF are too thin to manually scrape and this look is replicated in the factory.71 Some manufacturers have machines to apply the hand-scraped or similar texture, which can be randomly placed, to accurately replicate a time worn look. Whether smooth or hand-scraped, a high durability finish is applied to the face veneer of pre-finished flooring.
Most manufacturers add aluminum oxide to water-based urethane finishes that result in a durable, abrasion-resistant surface. Impregnated acrylic resin72 or other hard-surface preparations are also used by some manufacturers. In the final step, the product is packaged (boxed) and sold. The basic manufacturing process for MLWF is similar for both imported and domestic MLWF.
DOMESTIC LIKE PRODUCT ISSUES
In its original determinations, the Commission defined a single domestic like product, MLWF, that was coextensive with the scope of the investigations.73 In its notice of institution in these current five-year reviews, the Commission solicited comments from interested parties regarding the appropriate domestic like product and domestic industry,74 and three interested parties commented on the Commission’s definition of the domestic like product. Domestic interested parties agreed with the Commission’s definition of the domestic like product in its original determinations.75 Importer and Chinese interested parties did not contest the Commission’s definition of the domestic like product in its original determinations, but reserved the right to do so in this proceeding.76 No party requested that the Commission collect data concerning other possible domestic like products in their comments on the Commission’s draft questionnaires. Domestic interested parties continue to argue that the domestic like product
70 Hirschhorn, Stuart, Hardwood Floors Magazine, “U.S. Wood Flooring Markets and Factors Driving Demand,” August 1, 2017.
71 Domestic interested parties stated that some domestically produced flooring is scraped by hand and some by machine, hearing transcript, p. 201 (Levin). In contrast, respondent interestedparties stated that the distressed finishes of domestic producers are normally produced by machine, while the Chinese distressed finishes are normally done by hand. Alliance posthearing brief, p. 5.
72 The wear layer wood is infused with stain and a liquid acrylic replacing moisture through a high-pressure technique. This process allows the color to permeate the top layer and this color is retained through high-traffic wear. This type of flooring is durable and easier to maintain than other surfaces, but since the color is infused, the flooring cannot be refinished.
73 Multilayered Wood Flooring from China, Inv. Nos. 701-TA-476 and 731-TA-1179 (Final), USITC Publication 4278, November 2011, p. 7.
74 Multilayered Wood Flooring from China Institution of Five-Year Reviews, 81 FR 75854, November 1, 2016.
75 Domestic Interested Parties’ Response to the Notice of Institution, December 1, 2016, p. 15. 76 Importer Interested Parties’ Response to the Notice of Institution, December 1, 2016, p. 27 and
Chinese Interested Parties’ Response to the Notice of Institution, December 1, 2016, p. 9.
I-23
should be defined as co-extensive with the scope definition, while importer interested parties do not contest the Commission’s definition of the domestic like product.77
U.S. MARKET PARTICIPANTS
U.S. producers
During the original investigations, 12 firms supplied the Commission with information on their U.S. operations with respect to MLWF. These firms accounted for nearly all known U.S. production of MLWF in 2010.78 In these current proceedings, the Commission issued U.S. producers’ questionnaires to 20 firms, 11 of which provided the Commission with information on their product operations. These firms are believed to account for the vast majority of U.S. production of MLWF in 2016. Presented in table I-4 is a list of current domestic producers of product and each company’s position on continuation of the orders, production locations, and share of reported production of MLWF in 2016.
77 CAHP prehearing brief, p. 10. Alliance posthearing brief, “Questions Related to Wood Visuals Competition,” p. 7.
78 The 12 U.S. producers that supplied the Commission with usable questionnaire information during the original investigations were: Anderson Hardwood Floors, LLC (“Anderson”); Armstrong World Industries, Inc. (“Armstrong”); Award Hardwood Floors (“Award”); Colonial Craft; From the Forest; Home Legend Manufacturing (“Home Legend”); Mannington Mills, Inc. (“Mannington”); Mohawk Industries, Inc. (“Mohawk”); Nydree Flooring (“Nydree”); QEP Comp., Inc. (“QEP”); Shaw Industries Group, Inc. (“Shaw”), and U.S. Floors, Inc. (“U.S. Floors”). Multilayered Wood Flooring from China, Inv. Nos. 701-TA-476 and 731-TA-1179 (Final), USITC Publication 4278, November 2011, p. I-13 and table III-1.
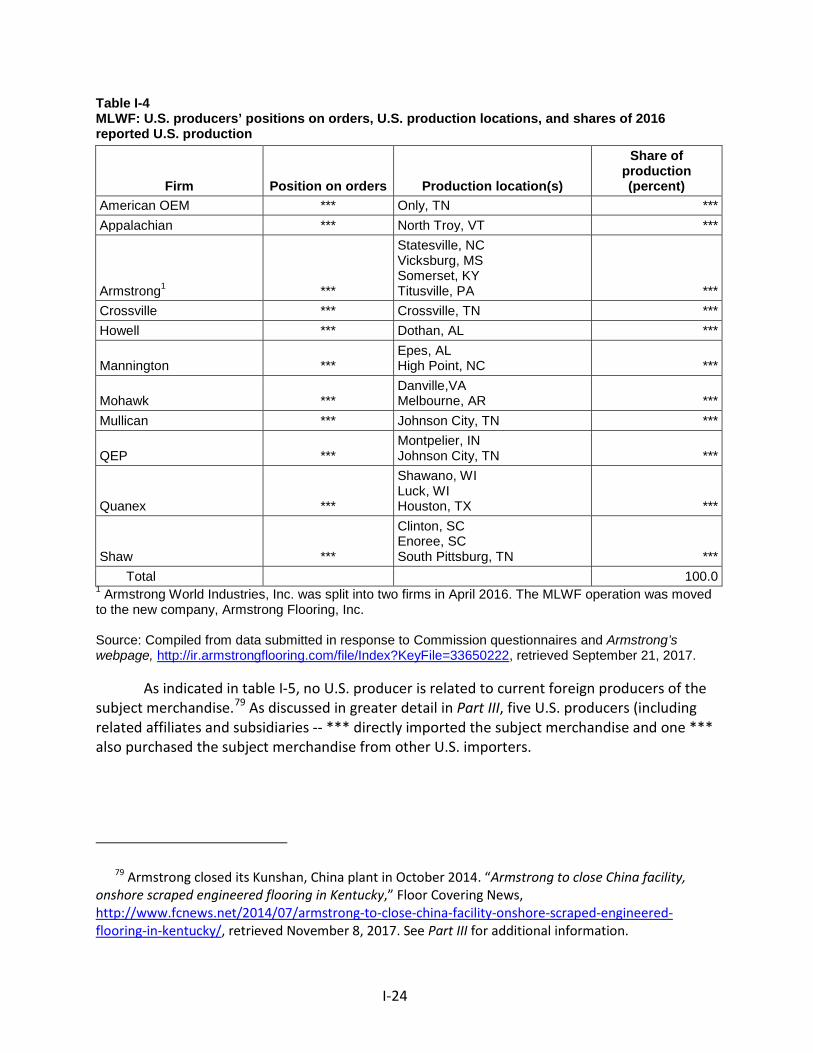
I-24
Table I-4 MLWF: U.S. producers’ positions on orders, U.S. production locations, and shares of 2016 reported U.S. production
Firm Position on orders Production location(s)
Share of production (percent)
American OEM *** Only, TN *** Appalachian *** North Troy, VT ***
Armstrong1 ***
Statesville, NC Vicksburg, MS Somerset, KY Titusville, PA ***
Crossville *** Crossville, TN *** Howell *** Dothan, AL ***
Mannington *** Epes, AL High Point, NC ***
Mohawk *** Danville,VA Melbourne, AR ***
Mullican *** Johnson City, TN ***
QEP *** Montpelier, IN Johnson City, TN ***
Quanex ***
Shawano, WI Luck, WI Houston, TX ***
Shaw ***
Clinton, SC Enoree, SC South Pittsburg, TN ***
Total 100.0 1 Armstrong World Industries, Inc. was split into two firms in April 2016. The MLWF operation was moved to the new company, Armstrong Flooring, Inc. Source: Compiled from data submitted in response to Commission questionnaires and Armstrong’s webpage, http://ir.armstrongflooring.com/file/Index?KeyFile=33650222, retrieved September 21, 2017.
As indicated in table I-5, no U.S. producer is related to current foreign producers of the subject merchandise.79 As discussed in greater detail in Part III, five U.S. producers (including related affiliates and subsidiaries -- *** directly imported the subject merchandise and one *** also purchased the subject merchandise from other U.S. importers.
79 Armstrong closed its Kunshan, China plant in October 2014. “Armstrong to close China facility, onshore scraped engineered flooring in Kentucky,” Floor Covering News, http://www.fcnews.net/2014/07/armstrong-to-close-china-facility-onshore-scraped-engineered-flooring-in-kentucky/, retrieved November 8, 2017. See Part III for additional information.
I-25
Table I-5 MLWF: U.S. producers’ ownership, related, and/or affiliated firms
* * * * * * *
U.S. importers
In the original investigations, 65 U.S. importing firms supplied the Commission with usable information on their operations involving the importation of MLWF, accounting for the majority of U.S. imports of MLWF during 2010.80 Of these responding U.S. importers, eight were also a domestic producer of MLWF: ***.81
In the current proceedings, the Commission issued U.S. importers’ questionnaires to 100 firms believed to be importers of MLWF, as well as to all U.S. producers of MLWF. Usable questionnaire responses were received from 48 firms, representing the majority of subject U.S. imports from China. Table I-6 lists all responding U.S. importers of MLWF from China and other sources, their locations, and their shares of U.S. imports in 2016.
80 Multilayered Wood Flooring from China, Inv. Nos. 701-TA-476 and 731-TA-1179 (Final), USITC Publication 4278, November 2011, p. IV-1.
81 Investigation Nos. 701-TA-476 and 731-TA-1179 (Final): Multilayered Wood Flooring from China—Staff Report, INV-JJ-105, October 27, 2011, table III-6.
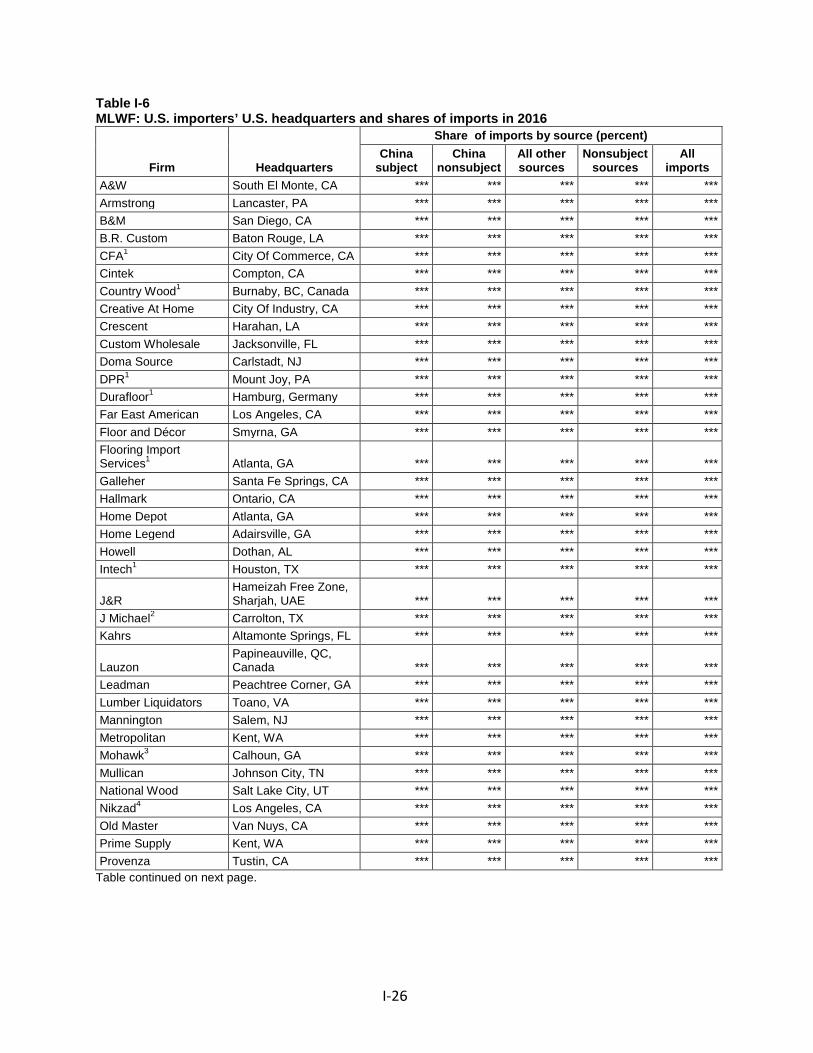
I-26
Table I-6 MLWF: U.S. importers’ U.S. headquarters and shares of imports in 2016
Firm Headquarters
Share of imports by source (percent) China
subject China
nonsubject All other sources
Nonsubject sources
All imports
A&W South El Monte, CA *** *** *** *** *** Armstrong Lancaster, PA *** *** *** *** *** B&M San Diego, CA *** *** *** *** *** B.R. Custom Baton Rouge, LA *** *** *** *** *** CFA1 City Of Commerce, CA *** *** *** *** *** Cintek Compton, CA *** *** *** *** *** Country Wood1 Burnaby, BC, Canada *** *** *** *** *** Creative At Home City Of Industry, CA *** *** *** *** *** Crescent Harahan, LA *** *** *** *** *** Custom Wholesale Jacksonville, FL *** *** *** *** *** Doma Source Carlstadt, NJ *** *** *** *** *** DPR1 Mount Joy, PA *** *** *** *** *** Durafloor1 Hamburg, Germany *** *** *** *** *** Far East American Los Angeles, CA *** *** *** *** *** Floor and Décor Smyrna, GA *** *** *** *** *** Flooring Import Services1 Atlanta, GA *** *** *** *** *** Galleher Santa Fe Springs, CA *** *** *** *** *** Hallmark Ontario, CA *** *** *** *** *** Home Depot Atlanta, GA *** *** *** *** *** Home Legend Adairsville, GA *** *** *** *** *** Howell Dothan, AL *** *** *** *** *** Intech1 Houston, TX *** *** *** *** ***
J&R Hameizah Free Zone, Sharjah, UAE *** *** *** *** ***
J Michael2 Carrolton, TX *** *** *** *** *** Kahrs Altamonte Springs, FL *** *** *** *** ***
Lauzon Papineauville, QC, Canada *** *** *** *** ***
Leadman Peachtree Corner, GA *** *** *** *** *** Lumber Liquidators Toano, VA *** *** *** *** *** Mannington Salem, NJ *** *** *** *** *** Metropolitan Kent, WA *** *** *** *** *** Mohawk3 Calhoun, GA *** *** *** *** *** Mullican Johnson City, TN *** *** *** *** *** National Wood Salt Lake City, UT *** *** *** *** *** Nikzad4 Los Angeles, CA *** *** *** *** *** Old Master Van Nuys, CA *** *** *** *** *** Prime Supply Kent, WA *** *** *** *** *** Provenza Tustin, CA *** *** *** *** ***
Table continued on next page.
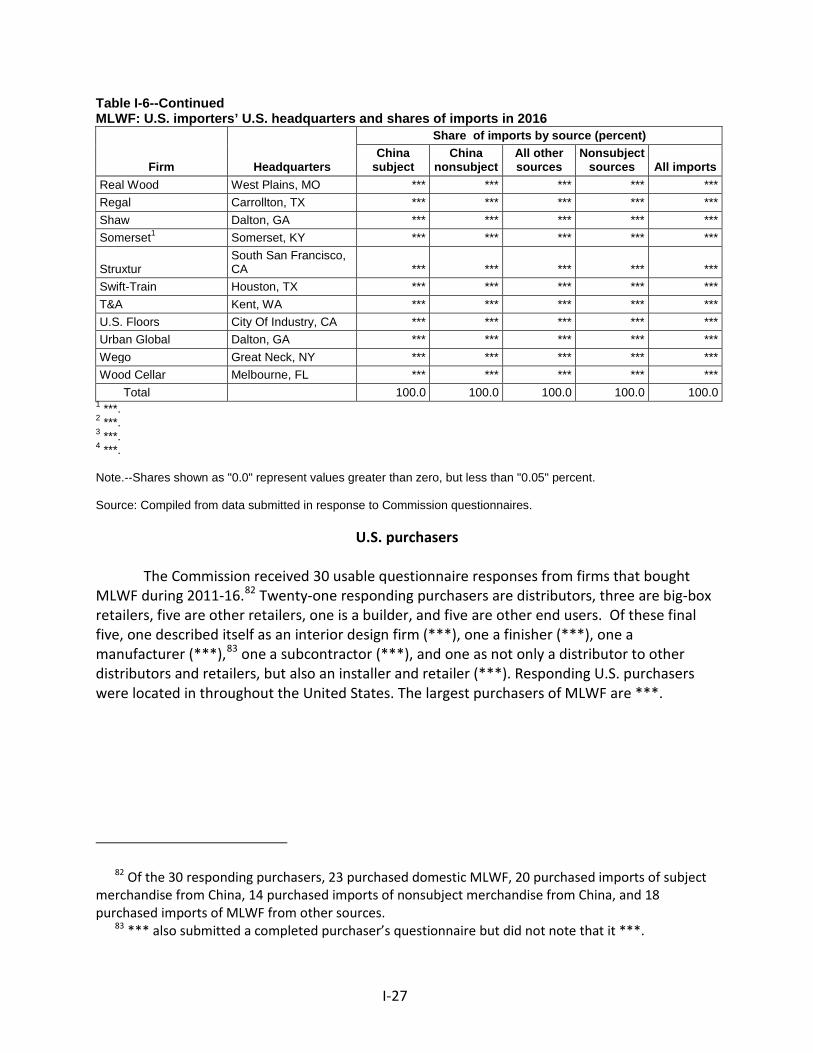
I-27
Table I-6--Continued MLWF: U.S. importers’ U.S. headquarters and shares of imports in 2016
Firm Headquarters
Share of imports by source (percent) China
subject China
nonsubject All other sources
Nonsubject sources All imports
Real Wood West Plains, MO *** *** *** *** *** Regal Carrollton, TX *** *** *** *** *** Shaw Dalton, GA *** *** *** *** *** Somerset1 Somerset, KY *** *** *** *** ***
Struxtur South San Francisco, CA *** *** *** *** ***
Swift-Train Houston, TX *** *** *** *** *** T&A Kent, WA *** *** *** *** *** U.S. Floors City Of Industry, CA *** *** *** *** *** Urban Global Dalton, GA *** *** *** *** *** Wego Great Neck, NY *** *** *** *** *** Wood Cellar Melbourne, FL *** *** *** *** ***
Total 100.0 100.0 100.0 100.0 100.0 1 ***. 2 ***. 3 ***. 4 ***. Note.--Shares shown as "0.0" represent values greater than zero, but less than "0.05" percent. Source: Compiled from data submitted in response to Commission questionnaires.
U.S. purchasers
The Commission received 30 usable questionnaire responses from firms that bought MLWF during 2011-16.82 Twenty-one responding purchasers are distributors, three are big-box retailers, five are other retailers, one is a builder, and five are other end users. Of these final five, one described itself as an interior design firm (***), one a finisher (***), one a manufacturer (***),83 one a subcontractor (***), and one as not only a distributor to other distributors and retailers, but also an installer and retailer (***). Responding U.S. purchasers were located in throughout the United States. The largest purchasers of MLWF are ***.
82 Of the 30 responding purchasers, 23 purchased domestic MLWF, 20 purchased imports of subject merchandise from China, 14 purchased imports of nonsubject merchandise from China, and 18 purchased imports of MLWF from other sources.
83 *** also submitted a completed purchaser’s questionnaire but did not note that it ***.
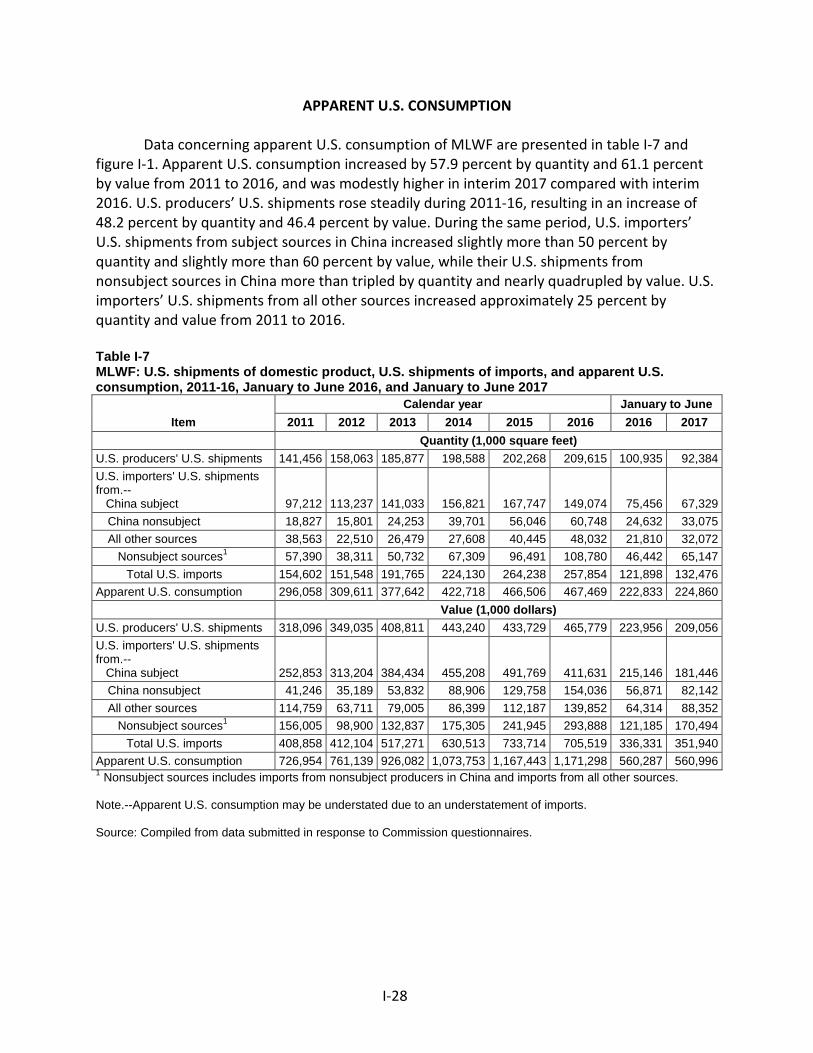
I-28
APPARENT U.S. CONSUMPTION
Data concerning apparent U.S. consumption of MLWF are presented in table I-7 and figure I-1. Apparent U.S. consumption increased by 57.9 percent by quantity and 61.1 percent by value from 2011 to 2016, and was modestly higher in interim 2017 compared with interim 2016. U.S. producers’ U.S. shipments rose steadily during 2011-16, resulting in an increase of 48.2 percent by quantity and 46.4 percent by value. During the same period, U.S. importers’ U.S. shipments from subject sources in China increased slightly more than 50 percent by quantity and slightly more than 60 percent by value, while their U.S. shipments from nonsubject sources in China more than tripled by quantity and nearly quadrupled by value. U.S. importers’ U.S. shipments from all other sources increased approximately 25 percent by quantity and value from 2011 to 2016.
Table I-7 MLWF: U.S. shipments of domestic product, U.S. shipments of imports, and apparent U.S. consumption, 2011-16, January to June 2016, and January to June 2017
Item Calendar year January to June
2011 2012 2013 2014 2015 2016 2016 2017 Quantity (1,000 square feet) U.S. producers' U.S. shipments 141,456 158,063 185,877 198,588 202,268 209,615 100,935 92,384 U.S. importers' U.S. shipments from.-- China subject 97,212 113,237 141,033 156,821 167,747 149,074 75,456 67,329
China nonsubject 18,827 15,801 24,253 39,701 56,046 60,748 24,632 33,075 All other sources 38,563 22,510 26,479 27,608 40,445 48,032 21,810 32,072 Nonsubject sources1 57,390 38,311 50,732 67,309 96,491 108,780 46,442 65,147
Total U.S. imports 154,602 151,548 191,765 224,130 264,238 257,854 121,898 132,476 Apparent U.S. consumption 296,058 309,611 377,642 422,718 466,506 467,469 222,833 224,860 Value (1,000 dollars) U.S. producers' U.S. shipments 318,096 349,035 408,811 443,240 433,729 465,779 223,956 209,056 U.S. importers' U.S. shipments from.-- China subject 252,853 313,204 384,434 455,208 491,769 411,631 215,146 181,446
China nonsubject 41,246 35,189 53,832 88,906 129,758 154,036 56,871 82,142 All other sources 114,759 63,711 79,005 86,399 112,187 139,852 64,314 88,352 Nonsubject sources1 156,005 98,900 132,837 175,305 241,945 293,888 121,185 170,494
Total U.S. imports 408,858 412,104 517,271 630,513 733,714 705,519 336,331 351,940 Apparent U.S. consumption 726,954 761,139 926,082 1,073,753 1,167,443 1,171,298 560,287 560,996 1 Nonsubject sources includes imports from nonsubject producers in China and imports from all other sources. Note.--Apparent U.S. consumption may be understated due to an understatement of imports. Source: Compiled from data submitted in response to Commission questionnaires.
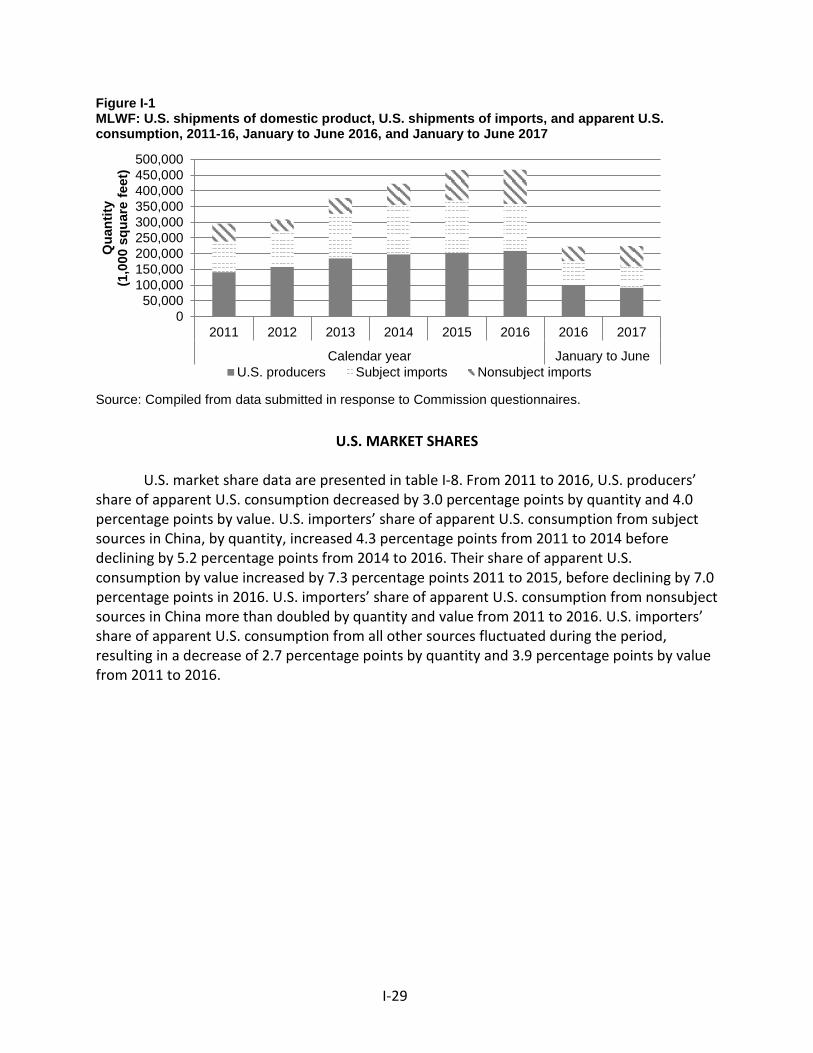
I-29
Figure I-1 MLWF: U.S. shipments of domestic product, U.S. shipments of imports, and apparent U.S. consumption, 2011-16, January to June 2016, and January to June 2017
Source: Compiled from data submitted in response to Commission questionnaires.
U.S. MARKET SHARES
U.S. market share data are presented in table I-8. From 2011 to 2016, U.S. producers’ share of apparent U.S. consumption decreased by 3.0 percentage points by quantity and 4.0 percentage points by value. U.S. importers’ share of apparent U.S. consumption from subject sources in China, by quantity, increased 4.3 percentage points from 2011 to 2014 before declining by 5.2 percentage points from 2014 to 2016. Their share of apparent U.S. consumption by value increased by 7.3 percentage points 2011 to 2015, before declining by 7.0 percentage points in 2016. U.S. importers’ share of apparent U.S. consumption from nonsubject sources in China more than doubled by quantity and value from 2011 to 2016. U.S. importers’ share of apparent U.S. consumption from all other sources fluctuated during the period, resulting in a decrease of 2.7 percentage points by quantity and 3.9 percentage points by value from 2011 to 2016.
050,000
100,000150,000200,000250,000300,000350,000400,000450,000500,000
2011 2012 2013 2014 2015 2016 2016 2017
Calendar year January to June
Qua
ntity
(1
,000
squ
are
feet
)
U.S. producers Subject imports Nonsubject imports
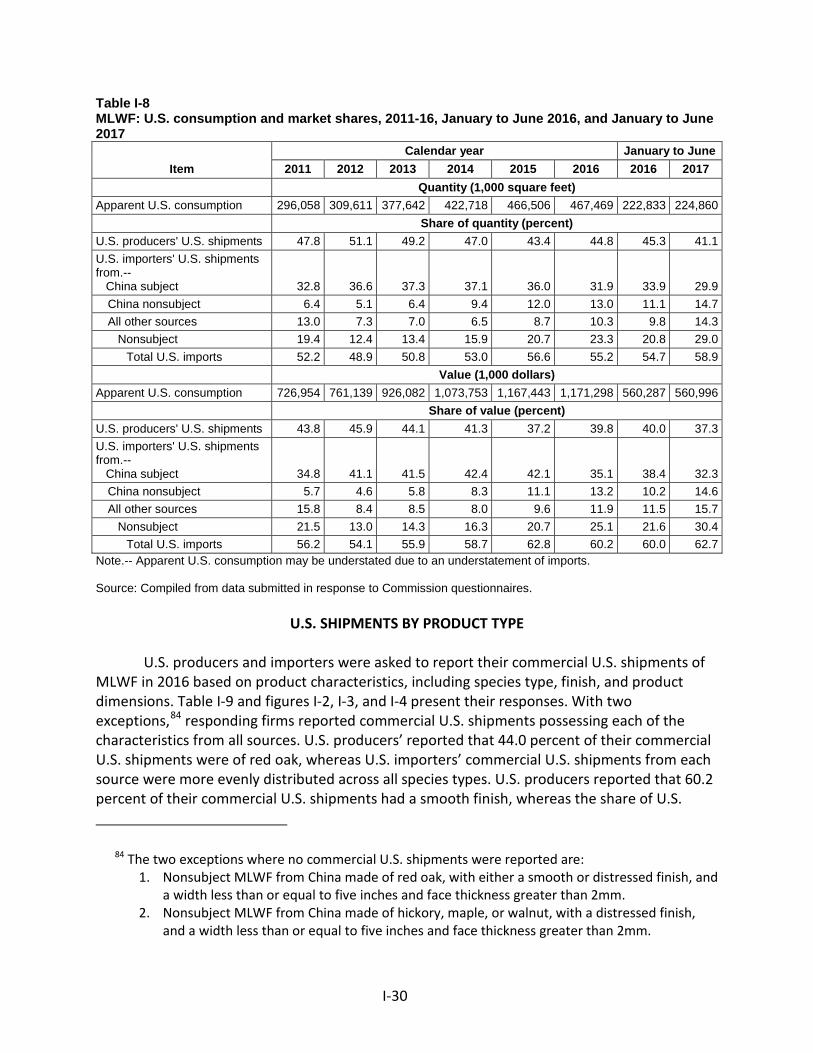
I-30
Table I-8 MLWF: U.S. consumption and market shares, 2011-16, January to June 2016, and January to June 2017
Item Calendar year January to June
2011 2012 2013 2014 2015 2016 2016 2017 Quantity (1,000 square feet) Apparent U.S. consumption 296,058 309,611 377,642 422,718 466,506 467,469 222,833 224,860 Share of quantity (percent) U.S. producers' U.S. shipments 47.8 51.1 49.2 47.0 43.4 44.8 45.3 41.1 U.S. importers' U.S. shipments from.-- China subject 32.8 36.6 37.3 37.1 36.0 31.9 33.9 29.9
China nonsubject 6.4 5.1 6.4 9.4 12.0 13.0 11.1 14.7 All other sources 13.0 7.3 7.0 6.5 8.7 10.3 9.8 14.3 Nonsubject 19.4 12.4 13.4 15.9 20.7 23.3 20.8 29.0
Total U.S. imports 52.2 48.9 50.8 53.0 56.6 55.2 54.7 58.9 Value (1,000 dollars) Apparent U.S. consumption 726,954 761,139 926,082 1,073,753 1,167,443 1,171,298 560,287 560,996 Share of value (percent) U.S. producers' U.S. shipments 43.8 45.9 44.1 41.3 37.2 39.8 40.0 37.3 U.S. importers' U.S. shipments from.-- China subject 34.8 41.1 41.5 42.4 42.1 35.1 38.4 32.3
China nonsubject 5.7 4.6 5.8 8.3 11.1 13.2 10.2 14.6 All other sources 15.8 8.4 8.5 8.0 9.6 11.9 11.5 15.7 Nonsubject 21.5 13.0 14.3 16.3 20.7 25.1 21.6 30.4
Total U.S. imports 56.2 54.1 55.9 58.7 62.8 60.2 60.0 62.7 Note.-- Apparent U.S. consumption may be understated due to an understatement of imports. Source: Compiled from data submitted in response to Commission questionnaires.
U.S. SHIPMENTS BY PRODUCT TYPE
U.S. producers and importers were asked to report their commercial U.S. shipments of MLWF in 2016 based on product characteristics, including species type, finish, and product dimensions. Table I-9 and figures I-2, I-3, and I-4 present their responses. With two exceptions,84 responding firms reported commercial U.S. shipments possessing each of the characteristics from all sources. U.S. producers’ reported that 44.0 percent of their commercial U.S. shipments were of red oak, whereas U.S. importers’ commercial U.S. shipments from each source were more evenly distributed across all species types. U.S. producers reported that 60.2 percent of their commercial U.S. shipments had a smooth finish, whereas the share of U.S.
84 The two exceptions where no commercial U.S. shipments were reported are: 1. Nonsubject MLWF from China made of red oak, with either a smooth or distressed finish, and
a width less than or equal to five inches and face thickness greater than 2mm. 2. Nonsubject MLWF from China made of hickory, maple, or walnut, with a distressed finish,
and a width less than or equal to five inches and face thickness greater than 2mm.
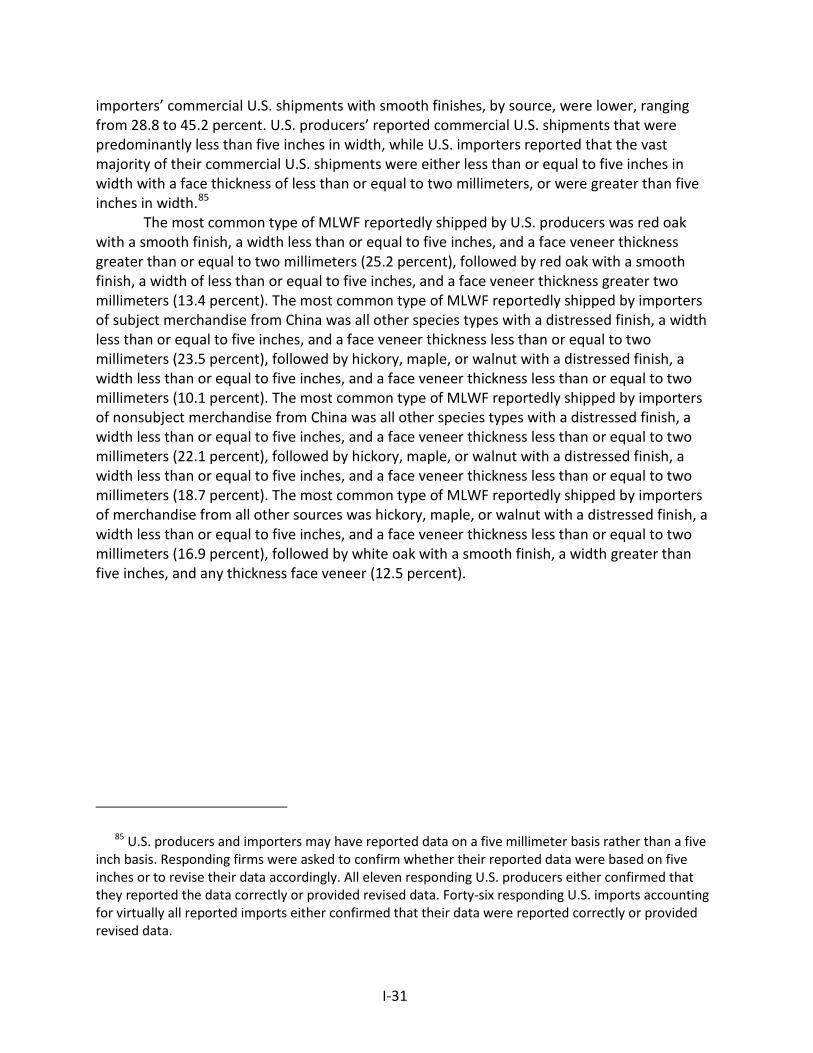
I-31
importers’ commercial U.S. shipments with smooth finishes, by source, were lower, ranging from 28.8 to 45.2 percent. U.S. producers’ reported commercial U.S. shipments that were predominantly less than five inches in width, while U.S. importers reported that the vast majority of their commercial U.S. shipments were either less than or equal to five inches in width with a face thickness of less than or equal to two millimeters, or were greater than five inches in width.85
The most common type of MLWF reportedly shipped by U.S. producers was red oak with a smooth finish, a width less than or equal to five inches, and a face veneer thickness greater than or equal to two millimeters (25.2 percent), followed by red oak with a smooth finish, a width of less than or equal to five inches, and a face veneer thickness greater two millimeters (13.4 percent). The most common type of MLWF reportedly shipped by importers of subject merchandise from China was all other species types with a distressed finish, a width less than or equal to five inches, and a face veneer thickness less than or equal to two millimeters (23.5 percent), followed by hickory, maple, or walnut with a distressed finish, a width less than or equal to five inches, and a face veneer thickness less than or equal to two millimeters (10.1 percent). The most common type of MLWF reportedly shipped by importers of nonsubject merchandise from China was all other species types with a distressed finish, a width less than or equal to five inches, and a face veneer thickness less than or equal to two millimeters (22.1 percent), followed by hickory, maple, or walnut with a distressed finish, a width less than or equal to five inches, and a face veneer thickness less than or equal to two millimeters (18.7 percent). The most common type of MLWF reportedly shipped by importers of merchandise from all other sources was hickory, maple, or walnut with a distressed finish, a width less than or equal to five inches, and a face veneer thickness less than or equal to two millimeters (16.9 percent), followed by white oak with a smooth finish, a width greater than five inches, and any thickness face veneer (12.5 percent).
85 U.S. producers and importers may have reported data on a five millimeter basis rather than a five inch basis. Responding firms were asked to confirm whether their reported data were based on five inches or to revise their data accordingly. All eleven responding U.S. producers either confirmed that they reported the data correctly or provided revised data. Forty-six responding U.S. imports accounting for virtually all reported imports either confirmed that their data were reported correctly or provided revised data.
I-32
Table I-9 MLWF: U.S. shipments, by product type, 2016 Calendar year 2016
Species and finish <= 5" width and <=2mm face thickness
<= 5" width and >2mm face thickness
>5" width and any face thickness
All widths and face thicknesses
Quantity (in 1,000 square feet) Red oak
Smooth finish-- U.S. producers *** *** *** ***
China subject *** *** *** *** China nonsubject *** *** *** *** All other sources *** *** *** *** Nonsubject *** *** *** *** All imports *** *** *** ***
Distressed finish-- U.S. producers *** *** *** ***
China subject *** *** *** *** China nonsubject *** *** *** *** All other sources *** *** *** *** Nonsubject *** *** *** *** All imports *** *** *** ***
White oak Smooth finish-- U.S. producers *** *** *** ***
China subject *** *** *** *** China nonsubject *** *** *** *** All other sources *** *** *** *** Nonsubject *** *** *** *** All imports *** *** *** ***
Distressed finish-- U.S. producers *** *** *** ***
China subject *** *** *** *** China nonsubject *** *** *** *** All other sources *** *** *** *** Nonsubject *** *** *** *** All imports *** *** *** ***
Hickory, maple or walnut Smooth finish-- U.S. producers *** *** *** ***
China subject *** *** *** *** China nonsubject *** *** *** *** All other sources *** *** *** *** Nonsubject *** *** *** *** All imports *** *** *** ***
Distressed finish-- U.S. producers *** *** *** ***
China subject *** *** *** *** China nonsubject *** *** *** *** All other sources *** *** *** *** Nonsubject *** *** *** *** All imports *** *** *** ***
Table continued on next page.
I-33
Table I-9--Continued MLWF: U.S. shipments, by product type, 2016 Calendar year 2016
Species and finish <= 5" width and <=2mm face thickness
<= 5" width and >2mm face thickness
>5" width and any face thickness
All widths and face thicknesses
Quantity (in 1,000 square feet) All other species.--
Smooth finish-- U.S. producers *** *** *** ***
China subject *** *** *** *** China nonsubject *** *** *** *** All other sources *** *** *** *** Nonsubject *** *** *** *** All imports *** *** *** ***
Distressed finish-- U.S. producers *** *** *** ***
China subject *** *** *** *** China nonsubject *** *** *** *** All other sources *** *** *** *** Nonsubject *** *** *** *** All imports *** *** *** ***
All species Smooth finish-- U.S. producers *** *** *** ***
China subject *** *** *** *** China nonsubject *** *** *** *** All other sources *** *** *** *** Nonsubject *** *** *** *** All imports *** *** *** ***
Distressed finish-- U.S. producers *** *** *** ***
China subject *** *** *** *** China nonsubject *** *** *** *** All other sources *** *** *** *** Nonsubject *** *** *** *** All imports *** *** *** ***
All species and finishes Total commercial U.S. shipments-- U.S. producers *** *** *** ***
China subject *** *** *** *** China nonsubject *** *** *** *** All other sources *** *** *** *** Nonsubject *** *** *** *** All imports *** *** *** ***
Table continued on next page.
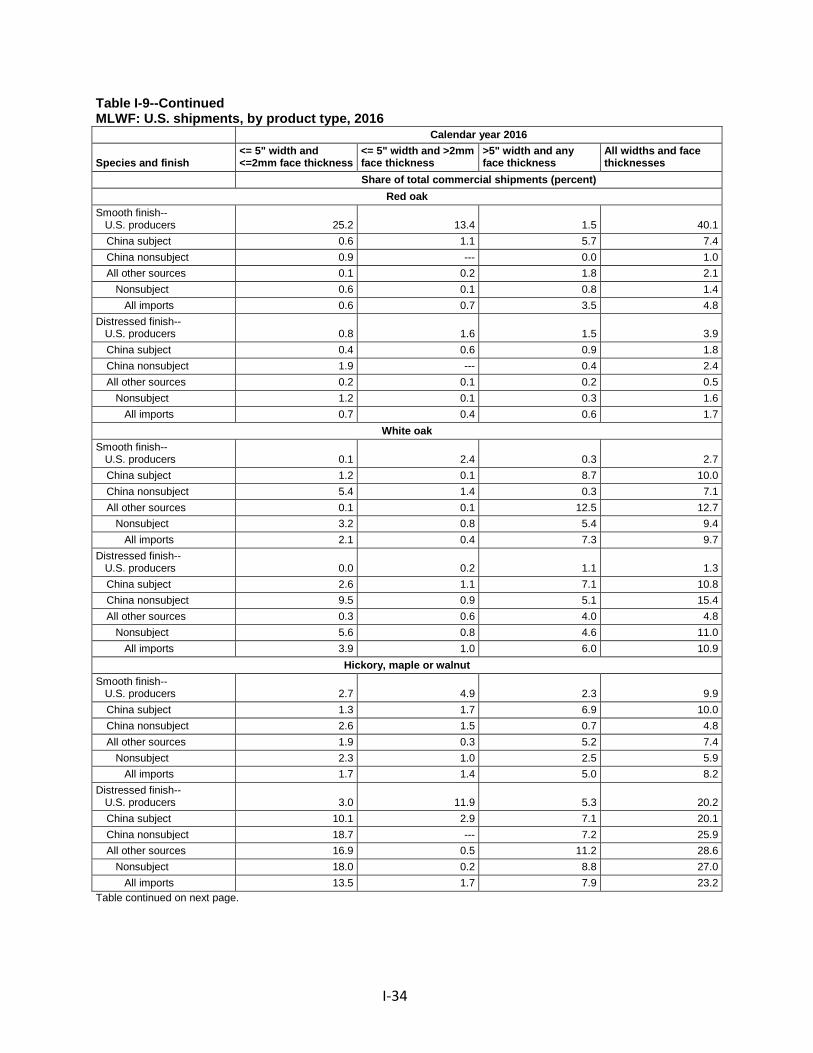
I-34
Table I-9--Continued MLWF: U.S. shipments, by product type, 2016 Calendar year 2016
Species and finish <= 5" width and <=2mm face thickness
<= 5" width and >2mm face thickness
>5" width and any face thickness
All widths and face thicknesses
Share of total commercial shipments (percent) Red oak
Smooth finish-- U.S. producers 25.2 13.4 1.5 40.1
China subject 0.6 1.1 5.7 7.4 China nonsubject 0.9 --- 0.0 1.0 All other sources 0.1 0.2 1.8 2.1 Nonsubject 0.6 0.1 0.8 1.4 All imports 0.6 0.7 3.5 4.8
Distressed finish-- U.S. producers 0.8 1.6 1.5 3.9
China subject 0.4 0.6 0.9 1.8 China nonsubject 1.9 --- 0.4 2.4 All other sources 0.2 0.1 0.2 0.5 Nonsubject 1.2 0.1 0.3 1.6 All imports 0.7 0.4 0.6 1.7
White oak Smooth finish-- U.S. producers 0.1 2.4 0.3 2.7
China subject 1.2 0.1 8.7 10.0 China nonsubject 5.4 1.4 0.3 7.1 All other sources 0.1 0.1 12.5 12.7 Nonsubject 3.2 0.8 5.4 9.4 All imports 2.1 0.4 7.3 9.7
Distressed finish-- U.S. producers 0.0 0.2 1.1 1.3
China subject 2.6 1.1 7.1 10.8 China nonsubject 9.5 0.9 5.1 15.4 All other sources 0.3 0.6 4.0 4.8 Nonsubject 5.6 0.8 4.6 11.0 All imports 3.9 1.0 6.0 10.9
Hickory, maple or walnut Smooth finish-- U.S. producers 2.7 4.9 2.3 9.9
China subject 1.3 1.7 6.9 10.0 China nonsubject 2.6 1.5 0.7 4.8 All other sources 1.9 0.3 5.2 7.4 Nonsubject 2.3 1.0 2.5 5.9 All imports 1.7 1.4 5.0 8.2
Distressed finish-- U.S. producers 3.0 11.9 5.3 20.2
China subject 10.1 2.9 7.1 20.1 China nonsubject 18.7 --- 7.2 25.9 All other sources 16.9 0.5 11.2 28.6 Nonsubject 18.0 0.2 8.8 27.0 All imports 13.5 1.7 7.9 23.2
Table continued on next page.
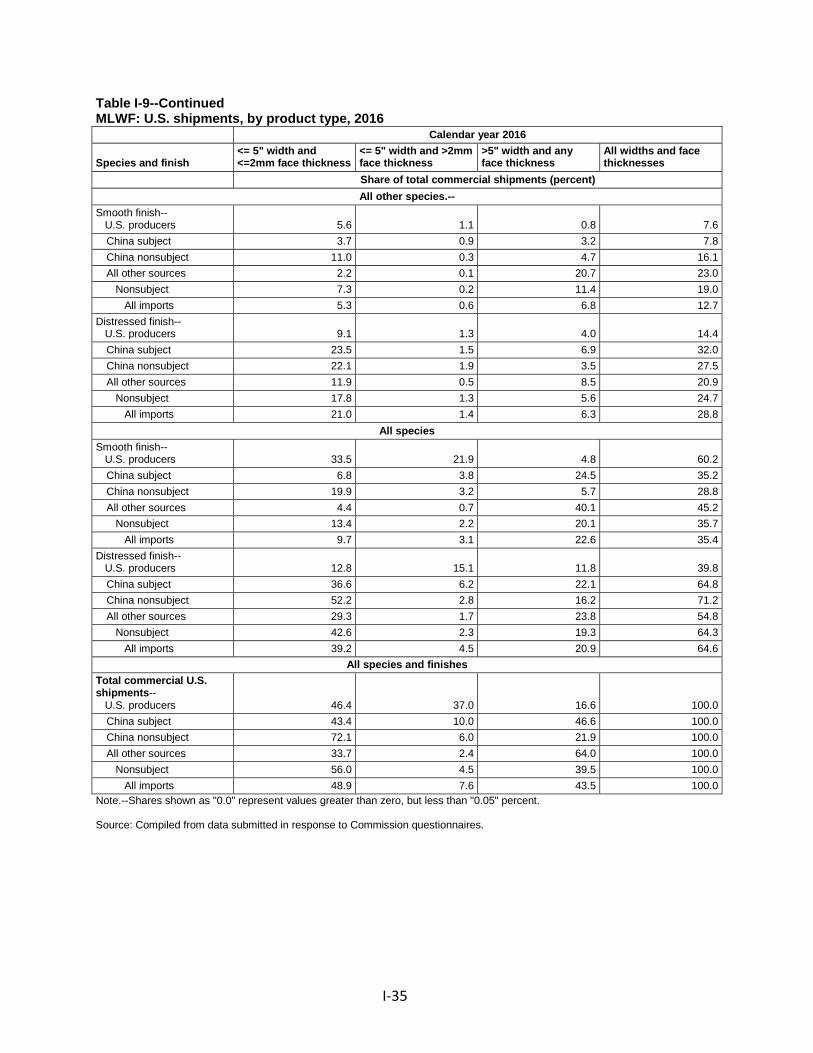
I-35
Table I-9--Continued MLWF: U.S. shipments, by product type, 2016 Calendar year 2016
Species and finish <= 5" width and <=2mm face thickness
<= 5" width and >2mm face thickness
>5" width and any face thickness
All widths and face thicknesses
Share of total commercial shipments (percent) All other species.--
Smooth finish-- U.S. producers 5.6 1.1 0.8 7.6
China subject 3.7 0.9 3.2 7.8 China nonsubject 11.0 0.3 4.7 16.1 All other sources 2.2 0.1 20.7 23.0 Nonsubject 7.3 0.2 11.4 19.0 All imports 5.3 0.6 6.8 12.7
Distressed finish-- U.S. producers 9.1 1.3 4.0 14.4
China subject 23.5 1.5 6.9 32.0 China nonsubject 22.1 1.9 3.5 27.5 All other sources 11.9 0.5 8.5 20.9 Nonsubject 17.8 1.3 5.6 24.7 All imports 21.0 1.4 6.3 28.8
All species Smooth finish-- U.S. producers 33.5 21.9 4.8 60.2
China subject 6.8 3.8 24.5 35.2 China nonsubject 19.9 3.2 5.7 28.8 All other sources 4.4 0.7 40.1 45.2 Nonsubject 13.4 2.2 20.1 35.7 All imports 9.7 3.1 22.6 35.4
Distressed finish-- U.S. producers 12.8 15.1 11.8 39.8
China subject 36.6 6.2 22.1 64.8 China nonsubject 52.2 2.8 16.2 71.2 All other sources 29.3 1.7 23.8 54.8 Nonsubject 42.6 2.3 19.3 64.3 All imports 39.2 4.5 20.9 64.6
All species and finishes Total commercial U.S. shipments-- U.S. producers 46.4 37.0 16.6 100.0
China subject 43.4 10.0 46.6 100.0 China nonsubject 72.1 6.0 21.9 100.0 All other sources 33.7 2.4 64.0 100.0 Nonsubject 56.0 4.5 39.5 100.0 All imports 48.9 7.6 43.5 100.0
Note.--Shares shown as "0.0" represent values greater than zero, but less than "0.05" percent. Source: Compiled from data submitted in response to Commission questionnaires.
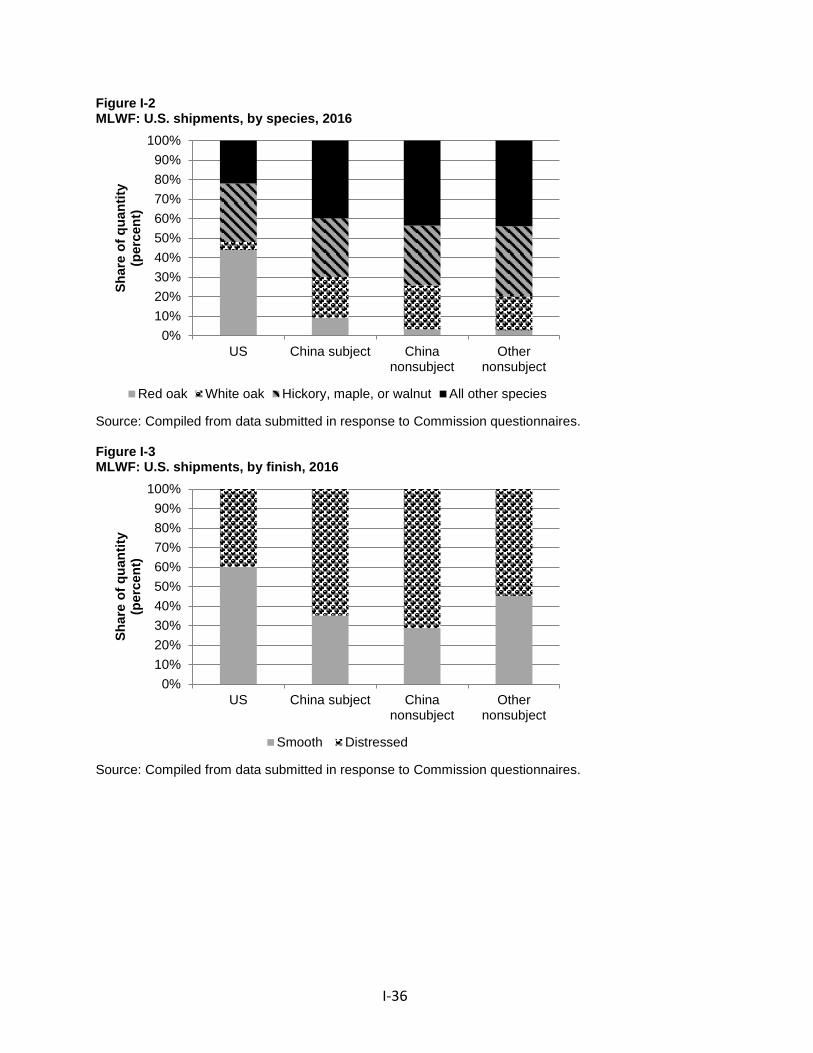
I-36
Figure I-2 MLWF: U.S. shipments, by species, 2016
Source: Compiled from data submitted in response to Commission questionnaires. Figure I-3 MLWF: U.S. shipments, by finish, 2016
Source: Compiled from data submitted in response to Commission questionnaires.
0%10%20%30%40%50%60%70%80%90%
100%
US China subject Chinanonsubject
Othernonsubject
Shar
e of
qua
ntity
(p
erce
nt)
Red oak White oak Hickory, maple, or walnut All other species
0%10%20%30%40%50%60%70%80%90%
100%
US China subject Chinanonsubject
Othernonsubject
Shar
e of
qua
ntity
(p
erce
nt)
Smooth Distressed
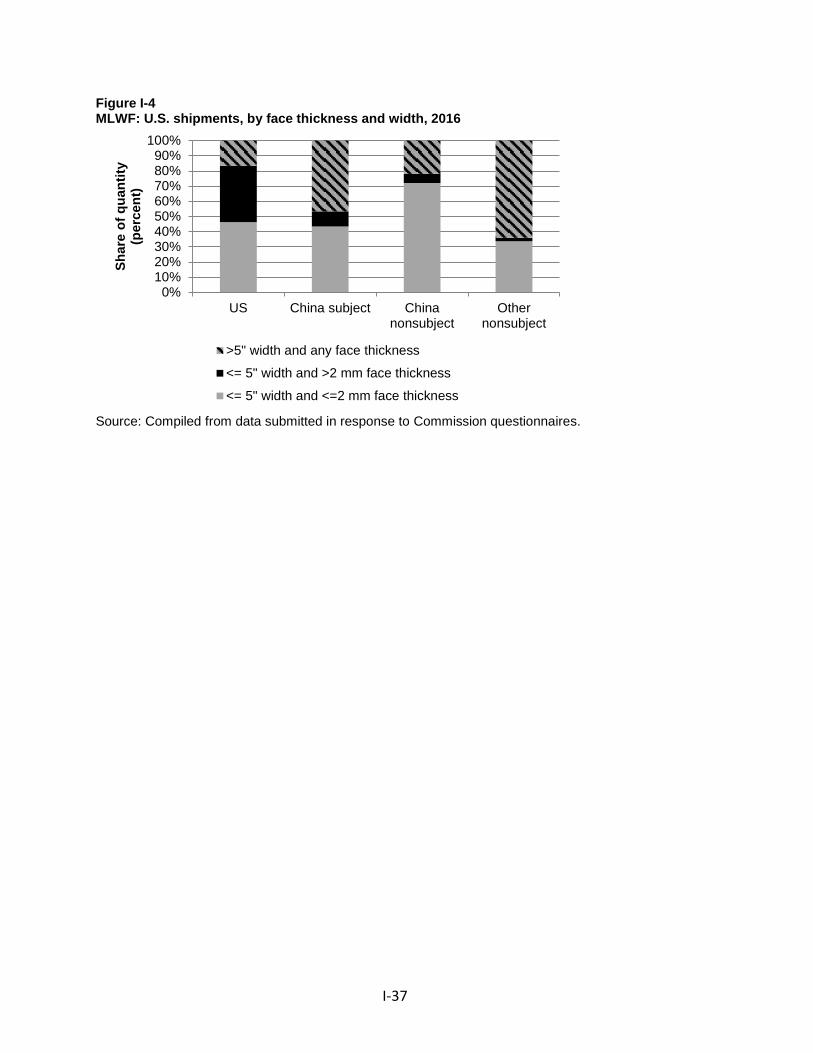
I-37
Figure I-4 MLWF: U.S. shipments, by face thickness and width, 2016
Source: Compiled from data submitted in response to Commission questionnaires.
0%10%20%30%40%50%60%70%80%90%
100%
US China subject Chinanonsubject
Othernonsubject
Shar
e of
qua
ntity
(p
erce
nt)
>5" width and any face thickness
<= 5" width and >2 mm face thickness
<= 5" width and <=2 mm face thickness

II-1
PART II: CONDITIONS OF COMPETITION IN THE U.S. MARKET
U.S. MARKET CHARACTERISTICS
U.S.-produced MLWF made up 44.8 percent of the market in terms of volume in 2016, down from 47.8 percent in 2011. In 2011, subject imports from China made up 32.8 percent of the U.S. market, and then increased to 37.3 percent by 2013 before decreasing to 31.9 percent in 2016. The four largest U.S. producers (***) represented nearly *** percent of reported domestic production in 2016. Three importers (***) represented *** of reported subject Chinese imports of MLWF in 2016.
Apparent U.S. consumption of MLWF increased by 57.9 percent during 2011-16, and was 0.9 percent higher in the first half of 2017 compared with the first half of 2016, on a quantity basis. On a value basis, U.S. consumption increased by 61.1 percent between 2011 and 2016. The increase in apparent consumption reflects increases in both new construction and remodeling markets for flooring.
MLWF is constructed of multiple layers, with only the top layer visible once installed. Sales of MLWF are subject to changing consumer preferences for different surfaces, surface thicknesses, widths, lengths, installation methods, textures, stains, and surface treatments, among others. Consequently, 9 of 11 producers, 31 of 45 responding importers, and 7 of 11 responding foreign producers/exporters (“foreign producers”)1 reported changes in the product mix or product range of MLWF since January 1, 2011. Eight producers, 25 importers, and 8 foreign producers anticipate continued changes in the product mix or product range in the next two years.
Since January 1, 2011, there have been an increasing number of lower-cost substitutes that compete with MLWF. Many of these substitutes have a surface that appears to be wood, but are made of a different material such as ceramic tile or laminate. In addition, there has been the introduction of different substrate upon which the surface layer of the MLWF is adhered.
CHANNELS OF DISTRIBUTION
U.S. producers sold slightly more than half of their MLWF to retailers and slightly less
than half to distributors during most years (table II-1). Although shipments to big box retailers by U.S. producers were overshadowed by sales to other retailers on more than a 4-to-1 basis in 2011, by 2016 the gap had narrowed to less than 3-to-1. Importers of MLWF from subject Chinese sources sold approximately three-fifths of their product to distributors in 2011-14, but this decreased in 2015-16. Shipments to builders and non-big box retailers increased their shares of subject Chinese shipments while the shares sold to distributors and big box retailers decreased since 2011. Of the 30 responding purchasers, most (21) described themselves as
1 Ten foreign producers responded and one exporter. For the remainder of Part II, the term “foreign producers” will include the exporter as well.
II-2
distributors; eight retailers (three big box and six non-big box), one builder, and five other end users also responded. The market is not characterized by strict distribution chains: 16 purchasers (***) stated that they compete with their suppliers for sales. These purchasers’ customers include contractors, flooring retailers, home builders, interior designers, and end consumers. Table II-1 MLWF: U.S. producers’ and importers’ share of reported U.S. commercial shipments (percent), by sources and channels of distribution, 2011-16, January-June 2016, and January-June 2017
Item
Period Calendar year January-June
2011 2012 2013 2014 2015 2016 2016 2017 Share of reported shipments (percent) U.S. producers’ U.S. commercial shipments of MLWF: Distributors 38.4 39.7 37.7 35.8 41.7 37.6 41.6 36.7 Big box retailers 10.5 10.2 11.1 13.3 12.3 14.0 14.3 11.3 Other retailers 42.2 41.6 43.3 41.7 34.4 38.3 35.1 45.5 Builders 7.4 7.3 6.7 8.1 8.8 7.8 6.8 4.9 Other end users 1.5 1.2 1.2 1.1 2.8 2.2 2.2 1.7 U.S. importers’ U.S. commercial shipments of MLWF from subject China: Distributors 63.0 63.8 62.2 64.6 58.0 47.4 48.4 48.6 Big box retailers *** *** *** *** *** *** *** *** Other retailers *** *** *** *** *** *** *** *** Builders *** *** *** *** *** *** *** *** Other end users *** *** *** *** *** *** *** *** U.S. importers’ U.S. commercial shipments of MLWF from nonsubject China: Distributors 19.9 31.8 33.4 33.7 37.0 31.0 21.9 34.1 Big box retailers *** *** *** *** *** *** *** *** Other retailers *** *** *** *** *** *** *** *** Builders *** *** *** *** *** *** *** *** Other end users *** *** *** *** *** *** *** *** U.S. importers’ U.S. commercial shipments of MLWF from all other countries: Distributors 50.2 59.5 57.4 50.8 48.9 41.1 44.9 41.2 Big box retailers *** *** *** *** *** *** *** *** Other retailers *** *** *** *** *** *** *** *** Builders *** *** *** *** *** *** *** *** Other end users *** *** *** *** *** *** *** ***
Note.--“Other end users” includes Interior designers, homeowners/DIYers, flooring installers, general contractors, employees, and online consumers Source: Compiled from data submitted in response to Commission questionnaires.
GEOGRAPHIC DISTRIBUTION
U.S. producers and importers reported selling MLWF to all regions in the contiguous United States (table II-2). For U.S. producers, 5 percent of sales were within 100 miles of their production facility, 72 percent were between 101 and 1,000 miles, and 23 percent were over 1,000 miles. Importers sold 33 percent within 100 miles of their U.S. point of shipment, 49 percent between 101 and 1,000 miles, and 18 percent over 1,000 miles.
II-3
Table II-2 MLWF: Geographic market areas in the United States served by U.S. producers and importers
Region U.S. producers Importers Northeast 10 33 Midwest 9 27 Southeast 10 33 Central Southwest 10 30 Mountain 8 30 Pacific Coast 9 32 Other1 5 17 All regions (except Other) 8 23 Reporting firms 11 42
1 All other U.S. markets, including AK, HI, PR, and VI. Source: Compiled from data submitted in response to Commission questionnaires.
SUPPLY AND DEMAND CONSIDERATIONS
U.S. supply Domestic production
Based on available information, U.S. producers of MLWF have the ability to respond to changes in demand with moderate-to-large changes in the quantity of shipments of U.S.-produced MLWF to the U.S. market. The main contributing factors to this degree of responsiveness of supply are the availability of unused capacity and high levels of inventories. Factors mitigating responsiveness of supply include a limited ability to shift shipments from alternate markets and a limited ability to shift production to or from alternate products.
Industry capacity
Domestic capacity utilization increased from 54.1 percent to 67.4 percent between 2011 and 2016, but was 58.3 percent in interim 2017 compared with 66.0 percent in interim 2016. This increase in capacity utilization occurred despite a 22.2 percent increase in U.S. producers’ capacity between 2011 and 2016. This relatively moderate level of capacity utilization suggests that U.S. producers may have adequate capacity available to increase production of MLWF in response to an increase in prices.
Alternative markets
U.S. producers’ exports, as a share of total shipments, decreased from 2.9 percent in 2011 to 1.9 percent in 2013 and 2014, but increased to 2.4 percent in 2015 and 2016. U.S. producers’ export shipments were 1.9 percent in interim 2017, compared with 2.5 percent in interim 2016. This indicates that U.S. producers have a limited ability to shift shipments between the U.S. market and other markets in response to price changes. Two of nine responding U.S. producers reported tariff barriers to trade in other markets, specifically tariffs
II-4
“throughout Asia” (***) and Value Added Taxes (VATs) in “most countries” (***). Other constraints making exporting difficult noted by producers included the financing of goods with longer shipping times outside the United States, higher transportation costs outside of NAFTA, a large Chinese presence in other markets and other local competition, some MLWF products formatted for the U.S. market not being in the format used in other countries, and appreciation of the dollar.
Inventory levels
U.S. producers made 82.0 percent of sales out of inventory in 2016. U.S. producers’ inventories increased on an absolute basis, from 56.6 million square feet in 2011 to 73.8 million square feet in 2016. Relative to total shipments, however, U.S. producers’ inventory levels decreased, from 38.9 percent at the end of 2011 to 34.4 percent at the end of 2016. Annualized inventory levels in January-June 2017 were 40.0 percent, compared with 35.0 percent during that time in 2016. These inventory levels suggest that U.S. producers may have substantial ability to respond to changes in demand with changes in the quantity shipped from inventories. Production alternatives
Ten of 11 U.S. producers stated that they could not switch production from MLWF to other products. Producers reportedly can produce other products on the same equipment as MLWF (hardwood plywood, ***) or in the same facilities as MLWF (prefinished solid flooring, ***). Six of the nine U.S. producers that indicated they were unable to shift production reported that their equipment and/or production facilities are specifically designed to produce only MLWF.
Subject imports from China2
Based on available information, producers of MLWF from China have the ability to respond to changes in demand with moderate-to-high changes in the quantity of shipments of MLWF to the U.S. market. The main contributing factors to this degree of responsiveness of supply are the availability of unused capacity and the high variability in capacity levels, the ability to shift shipments from alternate markets, and ability to shift production to or from alternate products.
2 Foreign industry data and related information are based on the questionnaire responses of 10 producers of MLWF and one exporter of MWLF. The reported exports of all 11 responding firms in China were equivalent to 9.6 percent of the total reported subject imports of MLWF from China in 2016.
II-5
Industry capacity
Capacity utilization for responding Chinese producers of MLWF increased from 54.4 percent to *** percent between 2011 and 2016. Capacity utilization was nearly identical in interim 2016 and interim 2017 at approximately *** percent. Reported capacity was highly variable in 2011-16, increasing from 83 million square feet in 2011 to 107 million square feet in 2013 before decreasing to approximately *** square feet in 2015 and 2016 due to ***. Capacity was slightly lower (*** percent) in interim 2017 than in interim 2016. This variable level of total capacity, combined with relatively moderate level of capacity utilization, suggests that Chinese producers may have a moderate-to-substantial ability to increase production of MLWF in response to an increase in prices.
Alternative markets
The vast majority of MLWF produced by responding Chinese producers was exported, although this proportion has decreased since 2011. Home market shipments increased from *** percent in 2011 to *** percent of total shipments in 2016. China’s exports to markets other than the United States, as a share of total shipments, increased from *** percent in 2011 to *** percent in 2016. In the first half of 2017, these exports were *** percent of total shipments, compared with *** percent in the first half of 2016.
Three foreign producers stated that they could easily shift between markets. Two others noted similarities between products in different markets or that they understand their home and other markets. Four foreign producers (including ***) reported that it would be difficult to switch between the United States and alternative markets. *** reported that samples and products manufactured in the United States and Asia differ, and that builders have selected certain products for use in their model homes and in their selection process for new homes long before purchase. Nine of 11 responding foreign producers indicated that the MLWF they sell in their home market is interchangeable with the MLWF they sell to the United States and other foreign markets. Seven of 11 foreign producers indicated that the product range is not different in markets other than the United States; those that indicated a difference reported distinctions in products shipped to China, India, the Philippines, and the United Kingdom, as well as differences in grades, lengths, gloss, or other customer requirements, and differences in regulatory requirements.
More than 97 percent of foreign producers’ reported shipments were made via contract. However, only 40 percent made via annual or long-term contracts. China’s export patterns indicate that its producers may have substantial ability to shift shipments between domestic or other markets and the U.S. market in response to price changes.
II-6
Inventory levels
Responding Chinese firms’ inventories declined relative to total shipments, decreasing from *** percent at the end of 2011 to *** percent at the end of 2016. These inventory levels suggest that responding foreign firms may have some ability to respond to changes in demand with changes in the quantity shipped from inventories, although substantially less than U.S. producers’ ability to ship from inventories.3
Production alternatives
Seven of 11 responding foreign producers stated that they could switch production from MLWF to other products. Other products that responding foreign producers reportedly can produce on the same equipment as MLWF include bamboo and 2-ply flooring, as well as moldings and solid wood products. Factors affecting foreign producers’ ability to shift production include equipment, raw materials, and technical knowledge.
Imports from nonsubject sources
Imports from nonsubject sources accounted for 44.2 percent of total reported U.S. imports in 2016. Major nonsubject import sources included nonsubject Chinese suppliers (26.8 percent of total imports), Canada, Indonesia, Brazil, Chile, and Russia.
Supply constraints
Eight of 11 U.S. producers, 31 of 46 responding importers, and 25 of 31 purchasers reported that they had not experienced any supply constraints in the MLWF market since January 1, 2011. Producer *** noted a period of supply disruption due to manufacturing consolidation. Producer *** restricted supply to some clients for 3-4 months in 2016 due to ***. Multiple importers reported that the antidumping and countervailing duties from the final investigation, manufacturing slowdowns, raw material shortages and other issues, and the bankruptcy of a shipping line caused some supply disruptions. Purchaser *** stated that domestic suppliers have been unable to provide certain species or unique visuals and textures which foreign producers were able to supply. Purchaser *** stated that despite meeting with multiple U.S. suppliers, they would either offer limited products or refused to sell it MLWF. Two purchasers (***) reported that domestic producers required restrictions on the purchasers in order to supply them MLWF (e.g., require that half of a showroom showcase that producer’s flooring products). Purchaser and importer ***’s supplier stopped importing MLWF after the original investigations, so it became an importer from a nonsubject producer in China. *** stated that foreign producer ***’s lead time increased from 90 days to 120 days.
3 Although these ratios are small compared to domestic inventory ratios, importers held between 22.0 and 33.3 percent of their total shipments of subject Chinese MLWF in U.S. inventories.
II-7
New suppliers
Sixteen of 30 responding purchasers indicated that new suppliers entered the U.S. market since January 1, 2011, and 17 of 27 expect additional entrants. Many purchasers did not identify specific companies noting that there were either large numbers of entrants or that the entry/exit of companies occurs frequently. Although a few purchasers identified new entrants from Europe and South America, a plurality of responding purchasers listed multiple new mills opening up in various countries in Southeast Asia, including ones in Cambodia, Indonesia, Malaysia, and Vietnam. Purchaser and importer *** stated that the factories in these Southeast Asian countries “were set up because of the AD/CVD China orders and in most cases are managed and operated by the same Chinese groups. The Chinese factories were disassembled and moved to Southeast Asia and in most cases the flooring produced in these factories are offered for less than they were in China.” Two purchasers mentioned domestic producer American OEM as a new producer. Purchaser and importer *** stated that American OEM was started by the previous president of former U.S. producer Anderson.4 It further stated that entry to the industry is becoming more difficult due to increasing regulations and raw material shortages.
U.S. demand
Based on available information, the overall demand for MLWF is likely to experience
moderate changes in response to changes in price. The main contributing factors are the existence of substitute products and the small cost share of MLWF in final cost of home construction.
End uses and cost share
U.S. demand for MLWF depends on the demand for U.S.-produced downstream products. The main end use is construction, including both new construction and remodeling.5 Six of 10 responding U.S. producers, 22 of 37 responding importers, 11 of 18 purchasers, and 9 of 11 responding foreign producers indicated that end uses have not changed since January 1, 2011, and slightly more anticipate no changes in end uses in the next two years. Most responding purchasers also noted the increasing availability of substitutes or the growth of the MLWF market in general. Eleven of 18 responding purchasers reported that demand has increased for the end-use products in which MLWF are a component.
4 In its questionnaire response, when describing American OEM’s entrance to the market, Metropolitan added that American OEM “***.”
5 Two purchasers indicated relative sizes of the new construction and remodel markets. *** estimated, with the assistance of its customers, that approximately 65 percent is used in new construction and 35 percent in remodeling. *** stated that MLWF is primarily used in the remodel market with a “minor presence” in new home construction. *** reported that its main end use is the remodeling market with “some new home construction” demand.
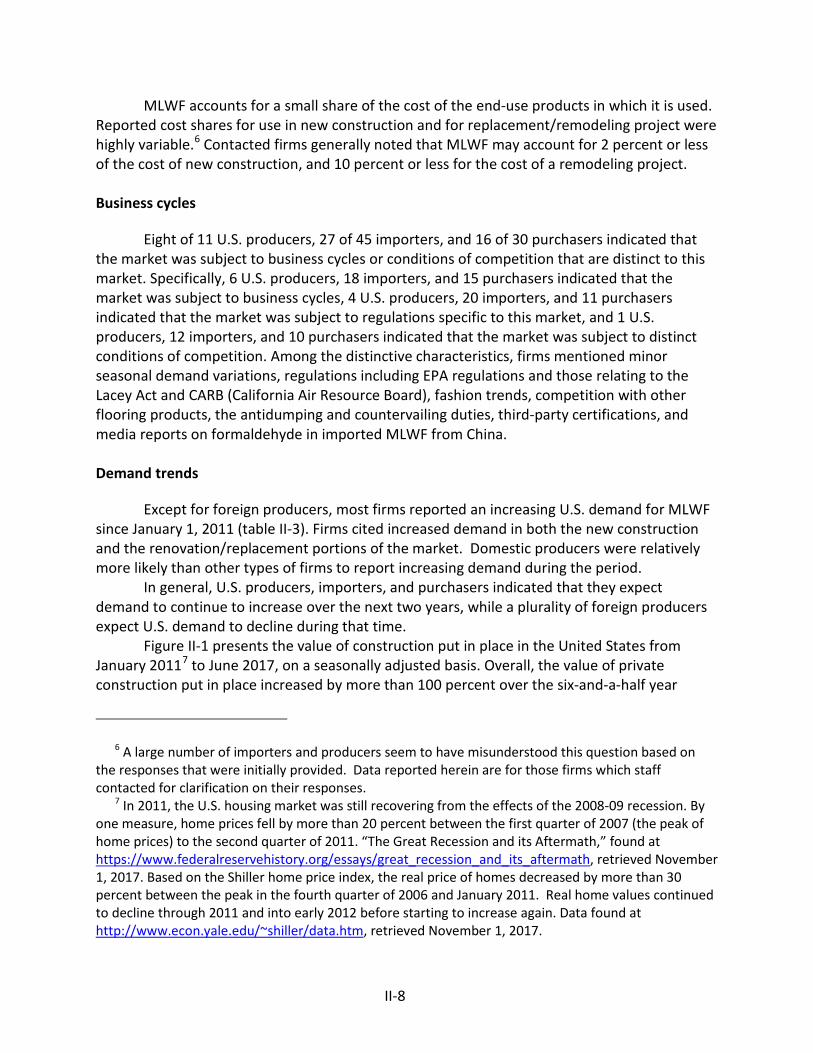
II-8
MLWF accounts for a small share of the cost of the end-use products in which it is used. Reported cost shares for use in new construction and for replacement/remodeling project were highly variable.6 Contacted firms generally noted that MLWF may account for 2 percent or less of the cost of new construction, and 10 percent or less for the cost of a remodeling project.
Business cycles
Eight of 11 U.S. producers, 27 of 45 importers, and 16 of 30 purchasers indicated that the market was subject to business cycles or conditions of competition that are distinct to this market. Specifically, 6 U.S. producers, 18 importers, and 15 purchasers indicated that the market was subject to business cycles, 4 U.S. producers, 20 importers, and 11 purchasers indicated that the market was subject to regulations specific to this market, and 1 U.S. producers, 12 importers, and 10 purchasers indicated that the market was subject to distinct conditions of competition. Among the distinctive characteristics, firms mentioned minor seasonal demand variations, regulations including EPA regulations and those relating to the Lacey Act and CARB (California Air Resource Board), fashion trends, competition with other flooring products, the antidumping and countervailing duties, third-party certifications, and media reports on formaldehyde in imported MLWF from China.
Demand trends
Except for foreign producers, most firms reported an increasing U.S. demand for MLWF since January 1, 2011 (table II-3). Firms cited increased demand in both the new construction and the renovation/replacement portions of the market. Domestic producers were relatively more likely than other types of firms to report increasing demand during the period.
In general, U.S. producers, importers, and purchasers indicated that they expect demand to continue to increase over the next two years, while a plurality of foreign producers expect U.S. demand to decline during that time.
Figure II-1 presents the value of construction put in place in the United States from January 20117 to June 2017, on a seasonally adjusted basis. Overall, the value of private construction put in place increased by more than 100 percent over the six-and-a-half year
6 A large number of importers and producers seem to have misunderstood this question based on the responses that were initially provided. Data reported herein are for those firms which staff contacted for clarification on their responses.
7 In 2011, the U.S. housing market was still recovering from the effects of the 2008-09 recession. By one measure, home prices fell by more than 20 percent between the first quarter of 2007 (the peak of home prices) to the second quarter of 2011. “The Great Recession and its Aftermath,” found at https://www.federalreservehistory.org/essays/great_recession_and_its_aftermath, retrieved November 1, 2017. Based on the Shiller home price index, the real price of homes decreased by more than 30 percent between the peak in the fourth quarter of 2006 and January 2011. Real home values continued to decline through 2011 and into early 2012 before starting to increase again. Data found at http://www.econ.yale.edu/~shiller/data.htm, retrieved November 1, 2017.
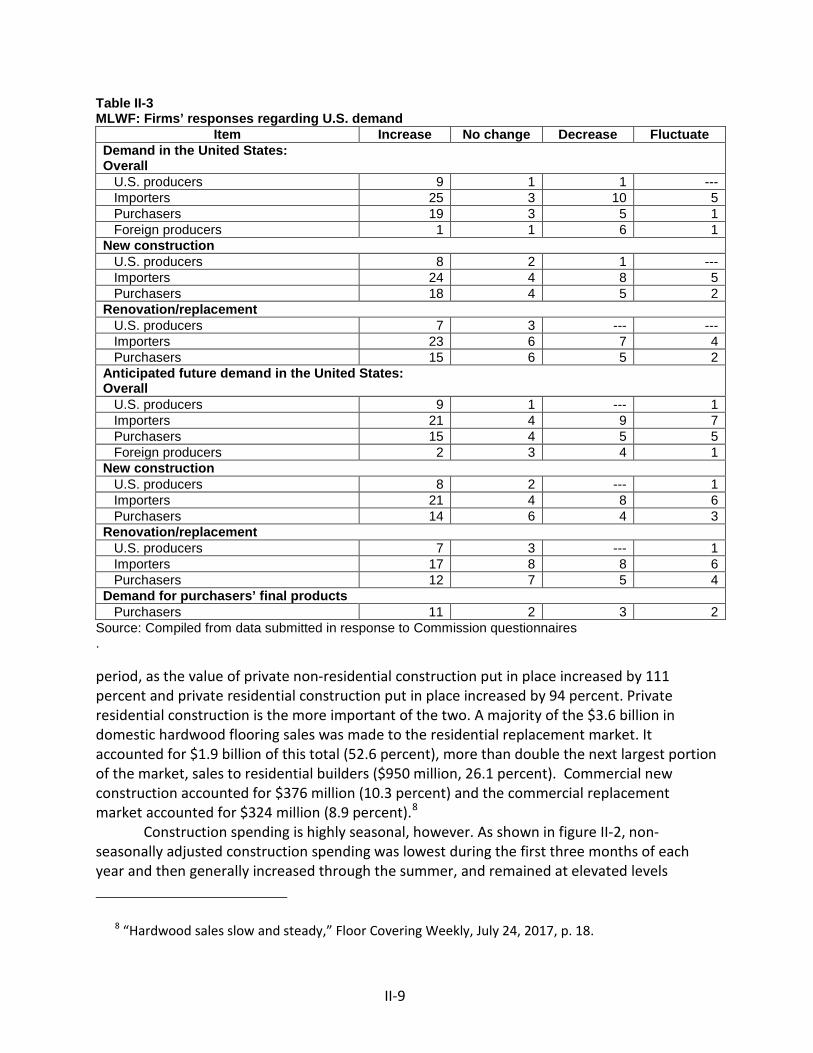
II-9
Table II-3 MLWF: Firms’ responses regarding U.S. demand
Item Increase No change Decrease Fluctuate Demand in the United States: Overall U.S. producers 9 1 1 --- Importers 25 3 10 5 Purchasers 19 3 5 1 Foreign producers 1 1 6 1 New construction U.S. producers 8 2 1 --- Importers 24 4 8 5 Purchasers 18 4 5 2 Renovation/replacement U.S. producers 7 3 --- --- Importers 23 6 7 4 Purchasers 15 6 5 2 Anticipated future demand in the United States: Overall U.S. producers 9 1 --- 1 Importers 21 4 9 7 Purchasers 15 4 5 5 Foreign producers 2 3 4 1 New construction U.S. producers 8 2 --- 1 Importers 21 4 8 6 Purchasers 14 6 4 3 Renovation/replacement U.S. producers 7 3 --- 1 Importers 17 8 8 6 Purchasers 12 7 5 4 Demand for purchasers’ final products Purchasers 11 2 3 2
Source: Compiled from data submitted in response to Commission questionnaires . period, as the value of private non-residential construction put in place increased by 111 percent and private residential construction put in place increased by 94 percent. Private residential construction is the more important of the two. A majority of the $3.6 billion in domestic hardwood flooring sales was made to the residential replacement market. It accounted for $1.9 billion of this total (52.6 percent), more than double the next largest portion of the market, sales to residential builders ($950 million, 26.1 percent). Commercial new construction accounted for $376 million (10.3 percent) and the commercial replacement market accounted for $324 million (8.9 percent).8
Construction spending is highly seasonal, however. As shown in figure II-2, non-seasonally adjusted construction spending was lowest during the first three months of each year and then generally increased through the summer, and remained at elevated levels
8 “Hardwood sales slow and steady,” Floor Covering Weekly, July 24, 2017, p. 18.
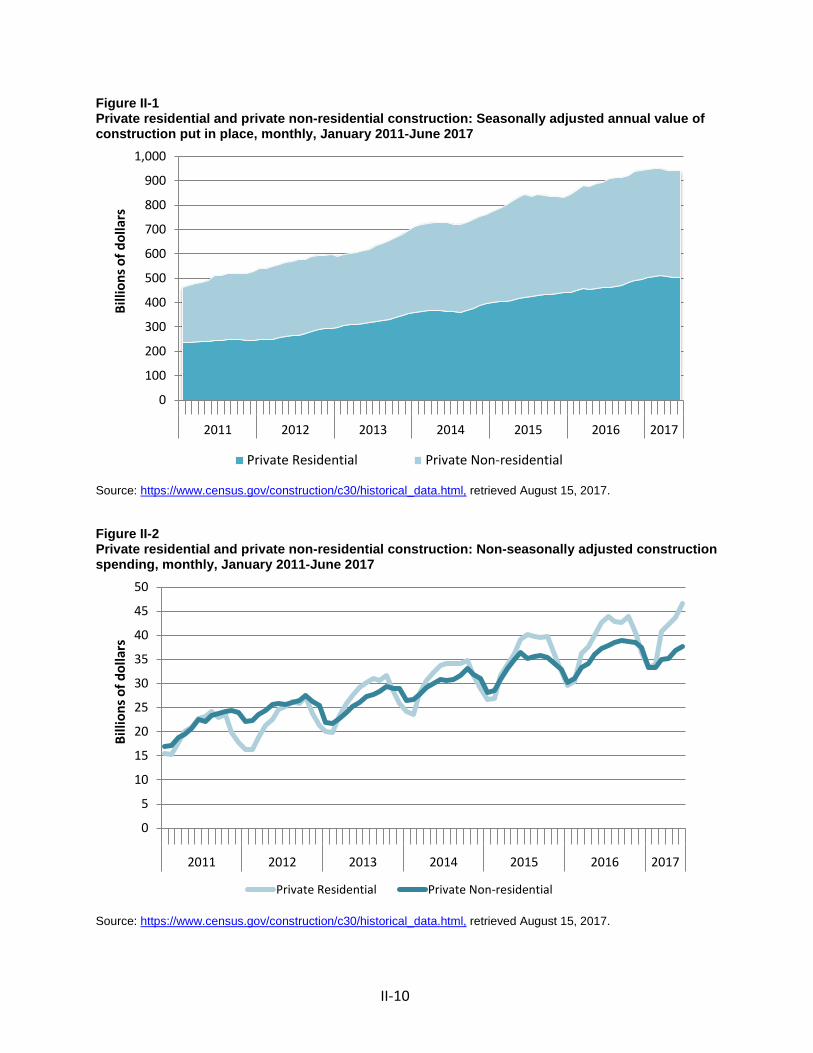
II-10
Figure II-1 Private residential and private non-residential construction: Seasonally adjusted annual value of construction put in place, monthly, January 2011-June 2017
Source: https://www.census.gov/construction/c30/historical_data.html, retrieved August 15, 2017. Figure II-2 Private residential and private non-residential construction: Non-seasonally adjusted construction spending, monthly, January 2011-June 2017
Source: https://www.census.gov/construction/c30/historical_data.html, retrieved August 15, 2017.
0
100
200
300
400
500
600
700
800
900
1,000
2011 2012 2013 2014 2015 2016 2017
Billi
ons o
f dol
lars
Private Residential Private Non-residential
0
5
10
15
20
25
30
35
40
45
50
2011 2012 2013 2014 2015 2016 2017
Billi
ons o
f dol
lars
Private Residential Private Non-residential
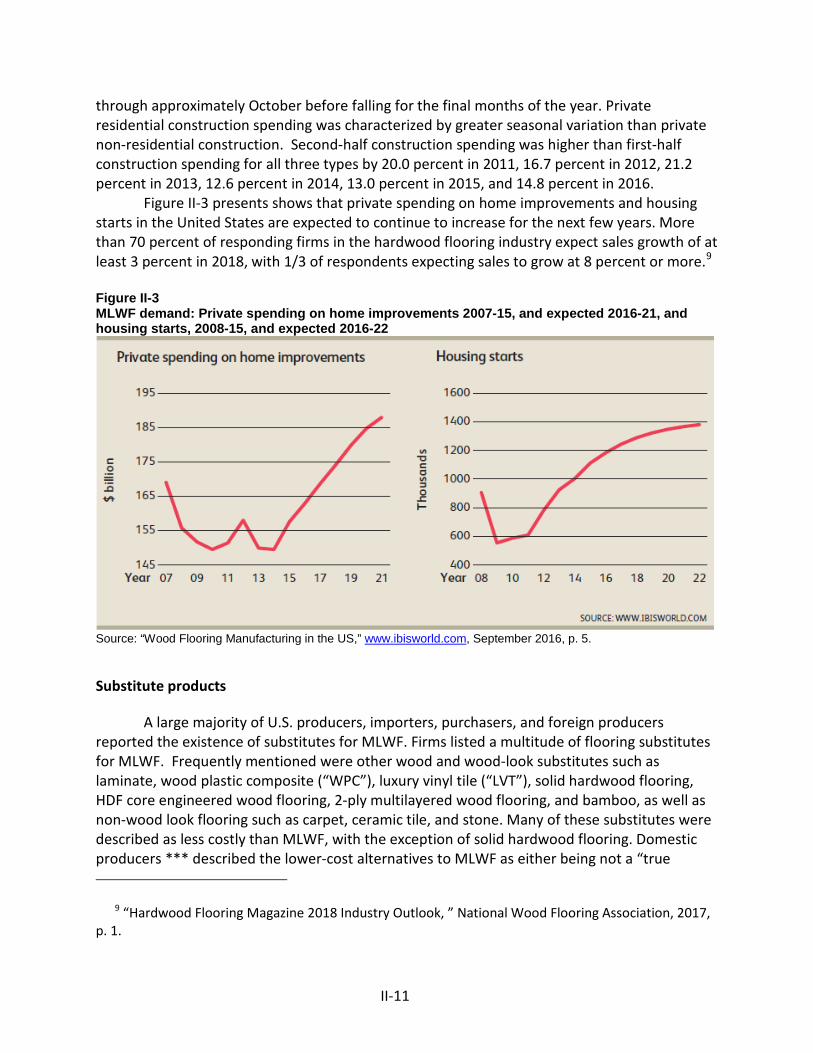
II-11
through approximately October before falling for the final months of the year. Private residential construction spending was characterized by greater seasonal variation than private non-residential construction. Second-half construction spending was higher than first-half construction spending for all three types by 20.0 percent in 2011, 16.7 percent in 2012, 21.2 percent in 2013, 12.6 percent in 2014, 13.0 percent in 2015, and 14.8 percent in 2016.
Figure II-3 presents shows that private spending on home improvements and housing starts in the United States are expected to continue to increase for the next few years. More than 70 percent of responding firms in the hardwood flooring industry expect sales growth of at least 3 percent in 2018, with 1/3 of respondents expecting sales to grow at 8 percent or more.9
Figure II-3 MLWF demand: Private spending on home improvements 2007-15, and expected 2016-21, and housing starts, 2008-15, and expected 2016-22
Source: “Wood Flooring Manufacturing in the US,” www.ibisworld.com, September 2016, p. 5. Substitute products
A large majority of U.S. producers, importers, purchasers, and foreign producers reported the existence of substitutes for MLWF. Firms listed a multitude of flooring substitutes for MLWF. Frequently mentioned were other wood and wood-look substitutes such as laminate, wood plastic composite (“WPC”), luxury vinyl tile (“LVT”), solid hardwood flooring, HDF core engineered wood flooring, 2-ply multilayered wood flooring, and bamboo, as well as non-wood look flooring such as carpet, ceramic tile, and stone. Many of these substitutes were described as less costly than MLWF, with the exception of solid hardwood flooring. Domestic producers *** described the lower-cost alternatives to MLWF as either being not a “true
9 “Hardwood Flooring Magazine 2018 Industry Outlook, ” National Wood Flooring Association, 2017, p. 1.
II-12
substitute” or not “play{ing} in the same realm” as MLWF. Producer *** stated that many importers and manufacturers have converted to making alternatives such as heavy HDF core or solid wood products, and that importers are offering locking/click versions of solid wood flooring at low prices, which may take sales away from MLWF. Producer *** further noted that substitutes for MLWF have been increasing in their visual quality, which, when combined with the durability and water resistance of substitutes such as wood-look ceramic tile, has led to decreased flooring market share for MLWF. A slight majority of firms noted that, in aggregate, these substitutes do influence the price of MLWF.10
A majority of responding U.S. producers (7 of 11), importers (30 of 41), purchasers (20 of 30), and foreign producers (6 of 10) reported that many of these substitutes have been introduced since January 1, 2011. These include 2-ply MLWF, bamboo LVT, rigid-core vinyl products, WPC, and wood-look ceramic tile. Furthermore, most of the firms that noted changes in substitutes since 2011 expect continued changes in the substitutes available to the market. There has been movement among demand for the various flooring products toward less expensive alternatives. Purchaser *** stated that “There has been a market shift away from traditional 3/4 solid hardwood flooring to multilayered wood flooring.” Purchaser *** *** stated that “customer demand is gradually shifting from engineered wood to other flooring installations (i.e., laminate, vinyl flooring).”
A large majority of responding firms reported that there have been changes in the popularity/market acceptance of these substitutes for MLWF. Ten of 11 responding U.S. producers, 35 of 41 responding importers, and 24 of 30 responding purchasers stated there have been changes, with a majority of each type of firm indicating the increasing popularity of the MLWF substitutes. Importer *** noted that WPC and rigid-core wood products are growing at “double and triple digits each year.” Nearly as many responding importers (30) and purchasers (23) stated that there have been improvements in the manufacturing technology used to produce these substitutes. The most frequent reason given for the growth in substitutes was technological improvements which allow the substitutes to look more realistic. Other reasons given included the manufacture of products that are easier to install, different substrates for other substitute engineered wood products, and the ability of the substitute products to be waterproof.
Figure II-4 presents the trends in the volume and value of U.S. resilient floor coverings for 2012-16, including hardwood flooring, ceramic floor & wall tile, laminate flooring, luxury vinyl tile, vinyl sheet & floor tile, other resilient flooring, and stone flooring. It also presents the volume and value of carpets and area rugs on the secondary axis.
10 Of all the substitute products listed by individual firms, 112 were reported to affect the price of MLWF, compared to 89 which were reported to not affect the price of MLWF.
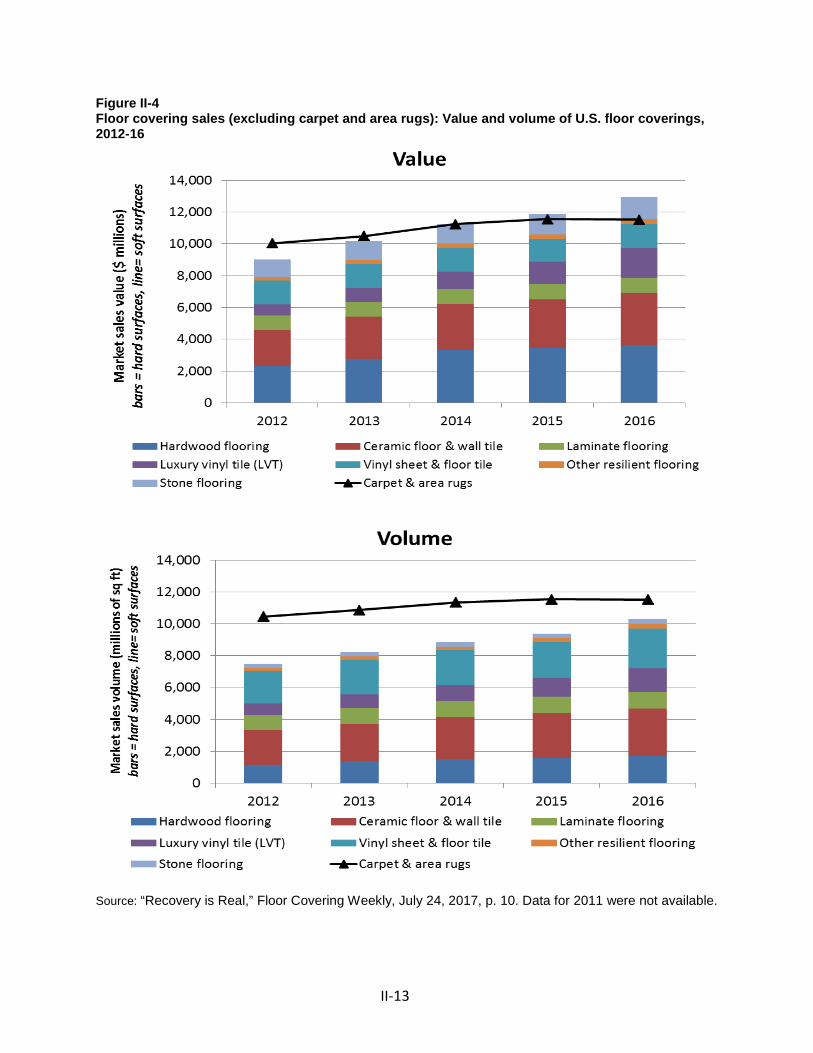
II-13
Figure II-4 Floor covering sales (excluding carpet and area rugs): Value and volume of U.S. floor coverings, 2012-16
Source: “Recovery is Real,” Floor Covering Weekly, July 24, 2017, p. 10. Data for 2011 were not available.
II-14
Over the period, LVT sales volume increased by 110 percent and value by 160 percent.11 The next largest increase is in hardwood flooring (including MLWF), which increased by 45.8 percent in volume but 56.1 percent in value. Growth was fastest for hardwood flooring in 2012-14 and slowed somewhat in 2014-16 in terms of value, but growth in volume terms has increased at a faster pace since the average price per square foot of hardwood products has declined. Although carpet and area rug volume and value also increased over the period, it increased at a slower pace, and decreased slightly between 2015 and 2016.
As noted in one industry publication, the decline in wood flooring prices in 2015 and 2016 occurred alongside decreases in lumber prices. This publication summarized the market as having slower sales due to “increased competition from wood-look ceramic tile planks and from new and innovative luxury vinyl tile and wood plastic composite flooring products. Despite slower growth, wood flooring has been able to make inroads in the U.S. floor covering market. Inroads reflect the growing popularity of engineered wood floors.”12 In 2016, hardwood floors accounted for 14.9 percent of the floor covering market in terms of value, an increase from the 12.2 percent market share in 2012.13 After increasing through most of the period, sales of carpet and area rugs declined very slightly in both volume and value terms in 2016, as “both new homebuyers and replacement purchasers are increasing their preference for hard surface flooring.”14 Additionally, industry witnesses indicated that reporting on “60 Minutes” in March 2015 regarding elevated levels of formaldehyde gas contained in laminate flooring sold by Lumber Liquidators had the effect of switching purchases away from laminate flooring and possibly into engineered wood.15 However, as highlighted in a recent industry publication “Wood-look products are causing the prices of wood flooring to drop.”16
11 LVT includes WPC (Wood Plastic Composite) and hybrid floors if the flooring is made primarily of vinyl. Other vinyl includes VCT (Vinyl Composition Tile) and other vinyl tile not classified as LVT. Other resilient flooring includes linoleum, cork, non-vinyl plastics, and rubber. Stone flooring excludes manufactured and engineered stone; it only includes natural stone. These data do not include sales of carpeting and area rugs. Sales of carpet and area rugs was greater than all these categories combined in volume terms (11.5 billion square feet vs. 10.3 billion square feet in 2016). As the value of these categories increased over 2012-16 (from $9.0 billion to $12.9 billion), they surpassed the value of carpeting and area rugs in 2014 despite the value of carpeting and area rugs increasing from $10.0 billion in 2012 to $11.5 billion in 2016.
12 “Recovery is Real,” Floor Covering Weekly, July 24, 2017, p. 10. 13 Ibid. 14 “Better Goods Boost Sales,” Floor Covering Weekly, July 24, 2017, p. 3, and “Carpet Loses Share,”
pp 27-28. 15 Hearing transcript, pp. 81 (Howett), 183 (Troendle), and 185 (Baldwin). 16 “Hardwood Flooring Magazine 2018 Industry Outlook, ” National Wood Flooring Association, 2017,
p. 5.
II-15
SUBSTITUTABILITY ISSUES
The degree of substitution between domestic and imported MLWF depends upon such factors as relative prices, quality (e.g., product consistency, regulation compliance, substrate quality, etc.), product range (e.g., dimensions, species and veneer patterns, etc.), and conditions of sale (e.g., price discounts/rebates, lead times between order and delivery dates, payment terms, product services, reliability of supply, etc.). Based on available data, staff believes that there is moderate degree of substitutability between domestically produced MLWF and MLWF imported from subject sources.
Lead times
MLWF is primarily sold from inventory. Seven of nine responding U.S. producers
reported selling at least 70 percent of their MLWF from inventories. Domestic lead time for shipments out of inventory ranged between one and seven days for all producers but ***. Half of producer ***’ s sales are produced-to-order, and 90-100 percent of domestic shipments from *** are produced-to-order. Produced-to-order lead times for these four firms ranged between 10 and 21 days, with most other responding producers reporting in that range as well.
Twenty-four of 37 importers also sold at least 70 percent of their commercial shipments of imported MLWF from inventory. Most importers shipping out of inventory also reported lead times of one to seven days. Lead times for shipments sold out of foreign inventories ranged between 30 and 90 days, and lead times for shipments that were made-to-order typically ranged between 60 and 120 days. Foreign producers reported shipping more than 97 percent of their MLWF on a produced-to-order basis, with lead times between 21 and 100 days, averaging just over 60 days.
Knowledge of country sources
Twenty-eight purchasers indicated they had marketing/pricing knowledge of domestic
MLWF, 24 of MLWF from subject Chinese sources, 18 of MLWF from nonsubject Chinese sources, and 19 of MLWF from other countries. These countries include Belgium (1 purchaser), Brazil (4), Cambodia (5), Canada (4), France (1), Germany (1), Indonesia (9), Italy (1), Lithuania (1), Malaysia (1), the Netherlands (1) Poland (1), Portugal (1), Russia (1), Spain (3), Taiwan (3), Thailand (2), Vietnam (4), as well as Europe (2) and Southeast Asia in general (1).
As shown in table II-4, most purchasers and their customers either sometimes or never make purchasing decisions based on the producer or country of origin. It is more common for the purchasers or their customers to make decisions based on the manufacturer, albeit more for the purchaser than their customers. Twenty-six of 30 purchasers indicated that their customers sometimes or never make decisions based on the manufacturer. Nine purchasers always make decisions based on the manufacturer. Of these nine, quality was the most frequently cited reason but other reasons cited include availability, regulatory compliance, financial strength, lead times, location, performance records, production capability, record keeping, reputation, and secure supply chains.
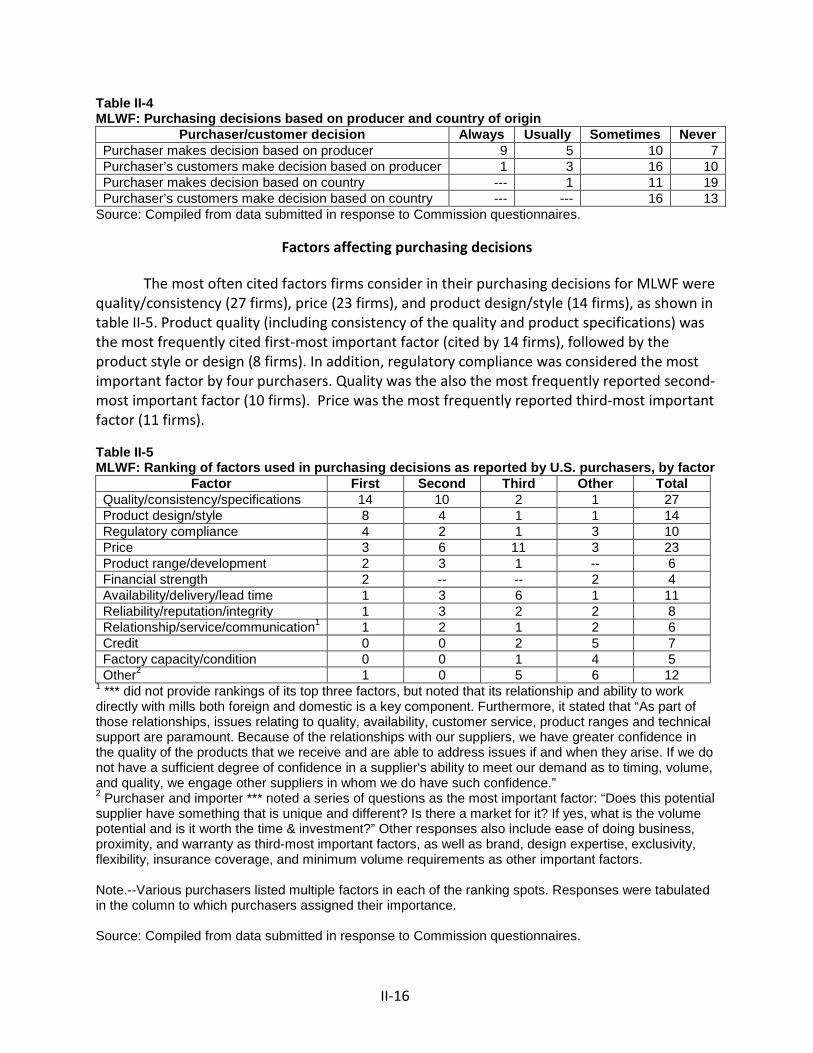
II-16
Table II-4 MLWF: Purchasing decisions based on producer and country of origin
Purchaser/customer decision Always Usually Sometimes Never Purchaser makes decision based on producer 9 5 10 7 Purchaser’s customers make decision based on producer 1 3 16 10 Purchaser makes decision based on country --- 1 11 19 Purchaser’s customers make decision based on country --- --- 16 13
Source: Compiled from data submitted in response to Commission questionnaires.
Factors affecting purchasing decisions
The most often cited factors firms consider in their purchasing decisions for MLWF were quality/consistency (27 firms), price (23 firms), and product design/style (14 firms), as shown in table II-5. Product quality (including consistency of the quality and product specifications) was the most frequently cited first-most important factor (cited by 14 firms), followed by the product style or design (8 firms). In addition, regulatory compliance was considered the most important factor by four purchasers. Quality was the also the most frequently reported second-most important factor (10 firms). Price was the most frequently reported third-most important factor (11 firms). Table II-5 MLWF: Ranking of factors used in purchasing decisions as reported by U.S. purchasers, by factor
Factor First Second Third Other Total Quality/consistency/specifications 14 10 2 1 27 Product design/style 8 4 1 1 14 Regulatory compliance 4 2 1 3 10 Price 3 6 11 3 23 Product range/development 2 3 1 -- 6 Financial strength 2 -- -- 2 4 Availability/delivery/lead time 1 3 6 1 11 Reliability/reputation/integrity 1 3 2 2 8 Relationship/service/communication1 1 2 1 2 6 Credit 0 0 2 5 7 Factory capacity/condition 0 0 1 4 5 Other2 1 0 5 6 12
1 *** did not provide rankings of its top three factors, but noted that its relationship and ability to work directly with mills both foreign and domestic is a key component. Furthermore, it stated that “As part of those relationships, issues relating to quality, availability, customer service, product ranges and technical support are paramount. Because of the relationships with our suppliers, we have greater confidence in the quality of the products that we receive and are able to address issues if and when they arise. If we do not have a sufficient degree of confidence in a supplier's ability to meet our demand as to timing, volume, and quality, we engage other suppliers in whom we do have such confidence.” 2 Purchaser and importer *** noted a series of questions as the most important factor: “Does this potential supplier have something that is unique and different? Is there a market for it? If yes, what is the volume potential and is it worth the time & investment?” Other responses also include ease of doing business, proximity, and warranty as third-most important factors, as well as brand, design expertise, exclusivity, flexibility, insurance coverage, and minimum volume requirements as other important factors. Note.--Various purchasers listed multiple factors in each of the ranking spots. Responses were tabulated in the column to which purchasers assigned their importance. Source: Compiled from data submitted in response to Commission questionnaires.
II-17
The majority of purchasers (23 of 31) reported that they sometimes purchase the lowest-priced product, while 7 never do, 1 frequently does, and none always do. Twelve of 30 purchasers reported that they purchase MLWF from specific countries. Seven purchasers noted occasional preferences for domestically produced MLWF. Purchaser and importer *** stated that some customers, final consumers in particular, have a bias against Chinese flooring. Purchaser *** stated that it has some retail customers that specifically seek certain exotic species from other countries.17
When asked if they purchased MLWF from one source although a comparable product was available at a lower price from another source, 21 purchasers reported reasons including availability, color, design, lead times, quality, relationships, reputation, and the cost to switch suppliers. The majority of purchasers (18 of 31) reported that certain types of product were only available from a single source. Most of these purchasers indicated that certain species, finishes, stains, specialized handiwork, and sizes are not available from domestic manufacturers. No purchaser specified any product that was only available in from U.S. producers.
Importance of specified purchase factors
Purchasers were asked to rate the importance of 24 factors in their purchasing decisions (table II-6). The factors rated as very important by more than half of responding purchasers were the ability to meet regulations and product consistency (30 each), availability, finish quality, and reliability of supply (29 each), quality meets industry standards (27), delivery time (26), finish availability (24), price (20), board width availability (18), and product range and quality exceeds industry standards (17 each). Factors that purchasers evaluate to determine quality included adhesive used, appearance, board lengths and widths, consistency, coating quality, core construction, design, dimensional stability, drying process, installation method (click/non-click), number of plies, packaging, species, stain colors, veneer and overall thickness, and warranty.
17 One purchaser, ***, indicated both “yes” and “no,” stating that “Each mill that we buy from has certain areas of expertise. We do not buy on the basis of price, but rather, which supplier do we trust to make a quality product based on the specifications required for the product of interest. Width, lengths, wear layer, veneer type, specie options, topical treatments, finish type, lead times, dependability and reliability determine who we buy from. Generally China has been #1 in satisfying the above although Vietnam, Indonesia and Taiwan are all catching up rapidly with domestic production light years behind.”
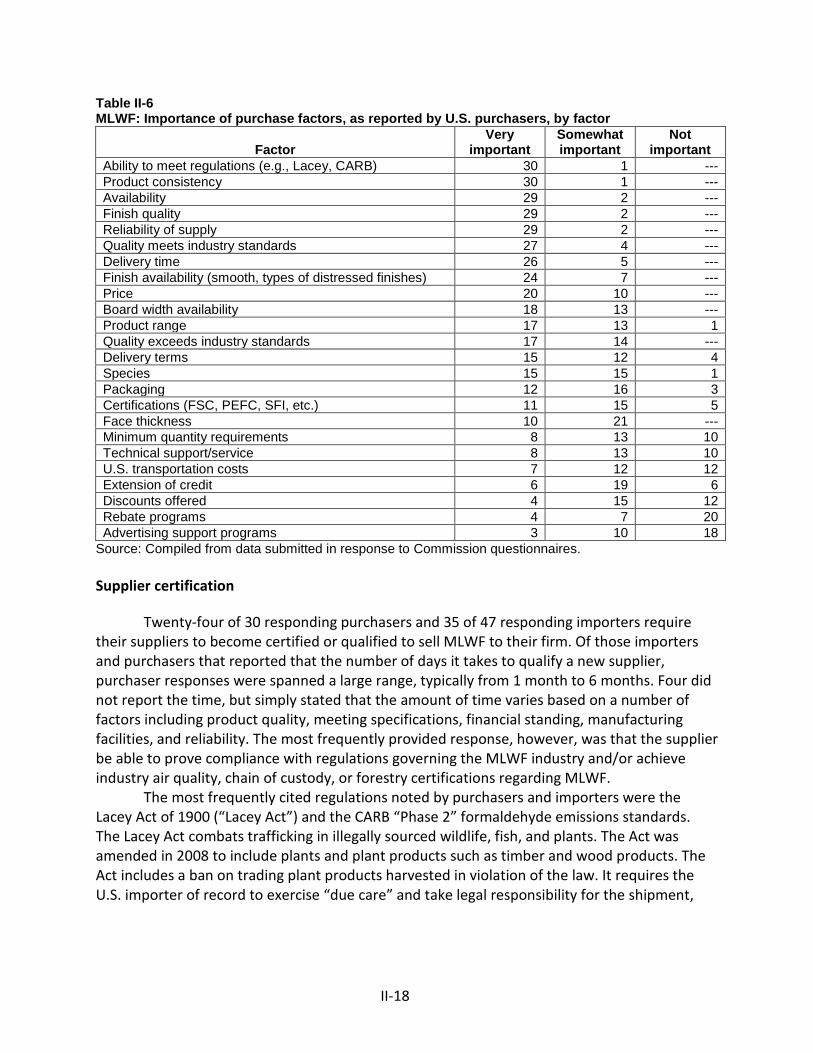
II-18
Table II-6 MLWF: Importance of purchase factors, as reported by U.S. purchasers, by factor
Factor Very
important Somewhat important
Not important
Ability to meet regulations (e.g., Lacey, CARB) 30 1 --- Product consistency 30 1 --- Availability 29 2 --- Finish quality 29 2 --- Reliability of supply 29 2 --- Quality meets industry standards 27 4 --- Delivery time 26 5 --- Finish availability (smooth, types of distressed finishes) 24 7 --- Price 20 10 --- Board width availability 18 13 --- Product range 17 13 1 Quality exceeds industry standards 17 14 --- Delivery terms 15 12 4 Species 15 15 1 Packaging 12 16 3 Certifications (FSC, PEFC, SFI, etc.) 11 15 5 Face thickness 10 21 --- Minimum quantity requirements 8 13 10 Technical support/service 8 13 10 U.S. transportation costs 7 12 12 Extension of credit 6 19 6 Discounts offered 4 15 12 Rebate programs 4 7 20 Advertising support programs 3 10 18
Source: Compiled from data submitted in response to Commission questionnaires. Supplier certification
Twenty-four of 30 responding purchasers and 35 of 47 responding importers require their suppliers to become certified or qualified to sell MLWF to their firm. Of those importers and purchasers that reported that the number of days it takes to qualify a new supplier, purchaser responses were spanned a large range, typically from 1 month to 6 months. Four did not report the time, but simply stated that the amount of time varies based on a number of factors including product quality, meeting specifications, financial standing, manufacturing facilities, and reliability. The most frequently provided response, however, was that the supplier be able to prove compliance with regulations governing the MLWF industry and/or achieve industry air quality, chain of custody, or forestry certifications regarding MLWF.
The most frequently cited regulations noted by purchasers and importers were the Lacey Act of 1900 (“Lacey Act”) and the CARB “Phase 2” formaldehyde emissions standards. The Lacey Act combats trafficking in illegally sourced wildlife, fish, and plants. The Act was amended in 2008 to include plants and plant products such as timber and wood products. The Act includes a ban on trading plant products harvested in violation of the law. It requires the U.S. importer of record to exercise “due care” and take legal responsibility for the shipment,
II-19
contents, and paperwork. The U.S. importer must also accurately declare the scientific name, value, quantity, and country of harvest origin.18
The U.S. Environmental Protection Agency finalized a rule that is closely aligned with the CARB “Phase 2” formaldehyde emission standards (other than record keeping and disclosure requirements), for certain wood products. Under the Toxic Substances Control Act (TSCA) Title VI, the rule limits harmful exposure to formaldehyde and sets up a third-party certification program for testing and oversight of these emissions from certain wood products.19
The three most frequently mentioned industry certifications were Floorscore, Forestry Stewardship Council (“FSC”) certification, and Greenguard Gold. Floorscore is an indoor air quality standard certification for hard flooring surfaces, underlayments, and adhesives.20 FSC certification is granted to products to ensure that the wood has come from responsibly managed forests. There are two types of FSC certification: forest management and chain of custody.21 Greenguard certification is administered by the Underwriters’ Laboratories Environment program and “helps manufacturers create--and helps buyers identify--interior products and materials that have low chemical emissions, improving the quality of the air in which the products are used.”22
18 “Lacey Act Primer”, a presentation from the USDA Animal and Plant Health Inspection Service (http://www.aphis.usda.gov/plant_health/lacey_act/downloads/LaceyActPrimer.pdf), retrieved September 13, 2017.
19 The original effective date was February 10, 2017. The date for emission standards, recordkeeping, and labeling has been extended to December 12, 2018; import certification to March 22, 2019; and laminated products to March 22, 2024. The end of the transition period for CARB third party certifiers is now March 22, 2019. The direct final rule is effective on October 25, 2017. Compliance Date Extension; Formaldehyde Emission Standards for Composite Wood Products, 82 FR 44533, September 25, 2017, https://www.federalregister.gov/documents/2017/09/25/2017-19455/compliance-date-extension-formaldehyde-emission-standards-for-composite-wood-products.
The EPA has proposed an amendment to this final rule to update multiple voluntary consensus standards to align it with quality control test methods. The comment period is open until November 9, 2017. Unless adverse comments are registered, the final rule takes effect on December 11, 2017. Voluntary Consensus Standards Update; Formaldehyde Emission Standards for Composite Wood Products, 82 FR 49302, October 25, 2017, https://www.federalregister.gov/documents/2017/10/25/2017-23061/voluntary-consensus-standards-update-formaldehyde-emission-standards-for-composite-wood-products.
20 “FloorScore: Indoor Air Quality Certification for Flooring ,” found at https://www.scsglobalservices.com/floorscore, retrieved September 13, 2017.
21“Certification,” found at https://us.fsc.org/en-us/certification and “Become Certified,” found at https://us.fsc.org/en-us/certification/become-certified, retrieved September 13, 2017.
22 Greenguard Gold also includes health-based criteria for additional chemicals and has more stringent volatile organic compound (“VOC”) emissions requirements. “Greenguard Certificaiton” found at http://greenguard.org/en/index.aspx and http://greenguard.org/en/certificationprograms.aspx, retrieved September 13, 2017.
II-20
As noted in table II-6, all but one purchaser identified compliance with regulations as a very important part of their purchasing decisions, whereas a plurality (nearly half) of all responding purchasers indicated certification was only somewhat important. Nearly all importers and more than half of U.S. producers listed specific provisions they have implemented to ensure compliance with the Lacey Act. One respondent testified that it spends a year evaluating new suppliers’ commitment to compliance with regulations such as the Lacey Act and CARB.23 Another testified that the regulations add complexity and cost to the sourcing of products from both new and existing suppliers.24 Since the importer or retailer can be held responsible for compliance of the material, it is important for them to take prudent precautions to minimize risk.25
In contrast, only 14 of 45 responding importers maintain a chain of custody certification for the MLWF they import from China, and 6 of 11 responding U.S. producers maintain one for the MLWF they produce. Responding U.S. producers reported that 99 percent of their commercial shipments do not require forest content certification such as FSC, and nearly 84 percent of responding importers’ commercial shipments do not require forest content certification.
Eight of 47 responding importers reported that they had rejected shipments of MLWF from foreign suppliers due to concerns regarding the traceability of the wood used in its manufacture.
Seven purchasers reported that foreign suppliers had failed to qualify product, or had lost its approved status since January 1, 2011. Three of these purchasers noted this was for compliance reasons, one rejected multiple sources for lack of response to requests for terms and insurance certifications, and one other purchaser voluntarily elected not to do business with any factory with which it had legal or procurement concerns.
Changes in purchasing patterns
Purchasers were asked about changes in their purchasing patterns from different sources since 2011 (table II-7). Reasons reported for changes in sourcing included the need for greater supplier capacity due to increasing market demand and general business growth, the need for unique manufacturing capabilities to meet specifications of new product offerings, and the general need for greater supplier reliability.
23 Hearing transcript, p. 123 (Cobb). 24 Hearing transcript, p. 132 (Schultz). 25 Hearing transcript, p. 176 (Schultz).
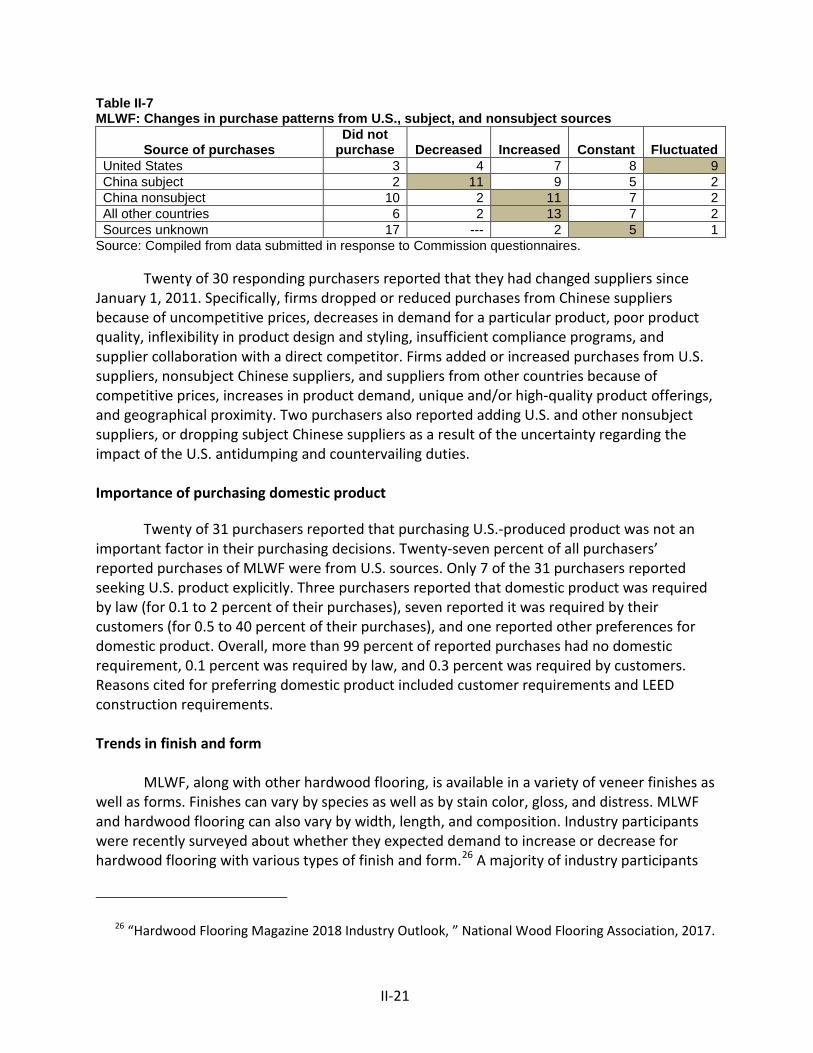
II-21
Table II-7 MLWF: Changes in purchase patterns from U.S., subject, and nonsubject sources
Source of purchases Did not
purchase Decreased Increased Constant Fluctuated United States 3 4 7 8 9 China subject 2 11 9 5 2 China nonsubject 10 2 11 7 2 All other countries 6 2 13 7 2 Sources unknown 17 --- 2 5 1
Source: Compiled from data submitted in response to Commission questionnaires.
Twenty of 30 responding purchasers reported that they had changed suppliers since January 1, 2011. Specifically, firms dropped or reduced purchases from Chinese suppliers because of uncompetitive prices, decreases in demand for a particular product, poor product quality, inflexibility in product design and styling, insufficient compliance programs, and supplier collaboration with a direct competitor. Firms added or increased purchases from U.S. suppliers, nonsubject Chinese suppliers, and suppliers from other countries because of competitive prices, increases in product demand, unique and/or high-quality product offerings, and geographical proximity. Two purchasers also reported adding U.S. and other nonsubject suppliers, or dropping subject Chinese suppliers as a result of the uncertainty regarding the impact of the U.S. antidumping and countervailing duties. Importance of purchasing domestic product
Twenty of 31 purchasers reported that purchasing U.S.-produced product was not an important factor in their purchasing decisions. Twenty-seven percent of all purchasers’ reported purchases of MLWF were from U.S. sources. Only 7 of the 31 purchasers reported seeking U.S. product explicitly. Three purchasers reported that domestic product was required by law (for 0.1 to 2 percent of their purchases), seven reported it was required by their customers (for 0.5 to 40 percent of their purchases), and one reported other preferences for domestic product. Overall, more than 99 percent of reported purchases had no domestic requirement, 0.1 percent was required by law, and 0.3 percent was required by customers. Reasons cited for preferring domestic product included customer requirements and LEED construction requirements.
Trends in finish and form
MLWF, along with other hardwood flooring, is available in a variety of veneer finishes as well as forms. Finishes can vary by species as well as by stain color, gloss, and distress. MLWF and hardwood flooring can also vary by width, length, and composition. Industry participants were recently surveyed about whether they expected demand to increase or decrease for hardwood flooring with various types of finish and form.26 A majority of industry participants
26 “Hardwood Flooring Magazine 2018 Industry Outlook, ” National Wood Flooring Association, 2017.
II-22
reported expecting demand for white oak, long boards, wide plank, grey stains and finishes, cerused wood,27 low-gloss finishes, and engineered floors to increase in 2018. At the hearing, a number of industry participants highlighted similar trends for popular wood flooring products.28 One respondent stated that whereas browns were very popular 10-15 years ago, grays and oil finishes, reactive stains, lye washing, reactive acid stains being wiped on the wood are popular in the current market.29
Comparisons of domestic products, subject imports, and nonsubject imports
Purchasers were asked a number of questions comparing MLWF produced in the United
States, subject countries, and nonsubject countries. First, purchasers were asked for a country-by-country comparison on the same 24 factors (table II-8) for which they were asked to rate the importance (table II-6).
The majority of purchasers reported that U.S. product was superior to Chinese subject product in advertising support programs, and was inferior to Chinese subject product in face thickness. Compared to China subject, China nonsubject, and other nonsubject product, U.S. product was reported by a majority of purchasers to be superior in terms of delivery time, and inferior in terms of board width availability, finish availability, and product range. Most purchasers reported that U.S. and nonsubject product from China and other countries were comparable on ability to meet regulations, availability, certifications, delivery terms, discounts offered, extension of credit, minimum quantity requirements, finish quality, packaging, price, product consistency, quality meeting and exceeding industry standards, reliability of supply, technical support and services, and U.S. transportation costs. Seventeen purchasers compared product from China subject with nonsubject product from China and other countries, with the majority reporting that the product was comparable across all 24 factors. Of the most important purchase factors identified (see table II-6), finish availability was the only factor where U.S. product was reported as inferior to Chinese subject, nonsubject, and other nonsubject products, while delivery time was the only factor where U.S. product was reported as superior to all comparison products by a majority of purchasers reporting.
27 “Cerused” wood is treated to help create a greater contrast between grain and the rest of the surface. Oak is the typical species on which this technique is used. “What is Cerused Wood?”, GoHaus.com, found at http://www.gohaus.com/wood-flooring/cerused-wood/, retrieved October 25, 2017.
28 Hearing transcript, pp. 30, 76 (Ward), 36 (Dougan), 127-128, 159, and 160 (Troendle), 159 (Sandover), and 161 (Schultz).
29 Hearing transcript, p. 159 (Troendle).
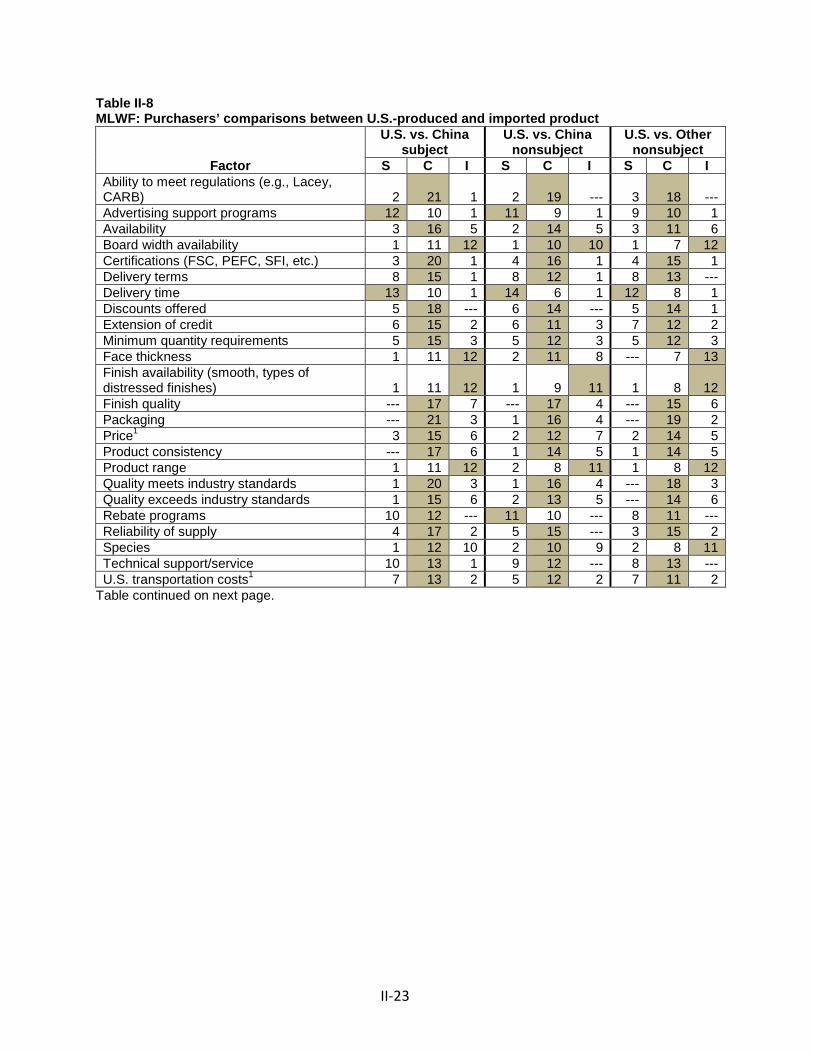
II-23
Table II-8 MLWF: Purchasers’ comparisons between U.S.-produced and imported product
Factor
U.S. vs. China subject
U.S. vs. China nonsubject
U.S. vs. Other nonsubject
S C I S C I S C I Ability to meet regulations (e.g., Lacey, CARB) 2 21 1 2 19 --- 3 18 --- Advertising support programs 12 10 1 11 9 1 9 10 1 Availability 3 16 5 2 14 5 3 11 6 Board width availability 1 11 12 1 10 10 1 7 12 Certifications (FSC, PEFC, SFI, etc.) 3 20 1 4 16 1 4 15 1 Delivery terms 8 15 1 8 12 1 8 13 --- Delivery time 13 10 1 14 6 1 12 8 1 Discounts offered 5 18 --- 6 14 --- 5 14 1 Extension of credit 6 15 2 6 11 3 7 12 2 Minimum quantity requirements 5 15 3 5 12 3 5 12 3 Face thickness 1 11 12 2 11 8 --- 7 13 Finish availability (smooth, types of distressed finishes) 1 11 12 1 9 11 1 8 12 Finish quality --- 17 7 --- 17 4 --- 15 6 Packaging --- 21 3 1 16 4 --- 19 2 Price1 3 15 6 2 12 7 2 14 5 Product consistency --- 17 6 1 14 5 1 14 5 Product range 1 11 12 2 8 11 1 8 12 Quality meets industry standards 1 20 3 1 16 4 --- 18 3 Quality exceeds industry standards 1 15 6 2 13 5 --- 14 6 Rebate programs 10 12 --- 11 10 --- 8 11 --- Reliability of supply 4 17 2 5 15 --- 3 15 2 Species 1 12 10 2 10 9 2 8 11 Technical support/service 10 13 1 9 12 --- 8 13 --- U.S. transportation costs1 7 13 2 5 12 2 7 11 2
Table continued on next page.
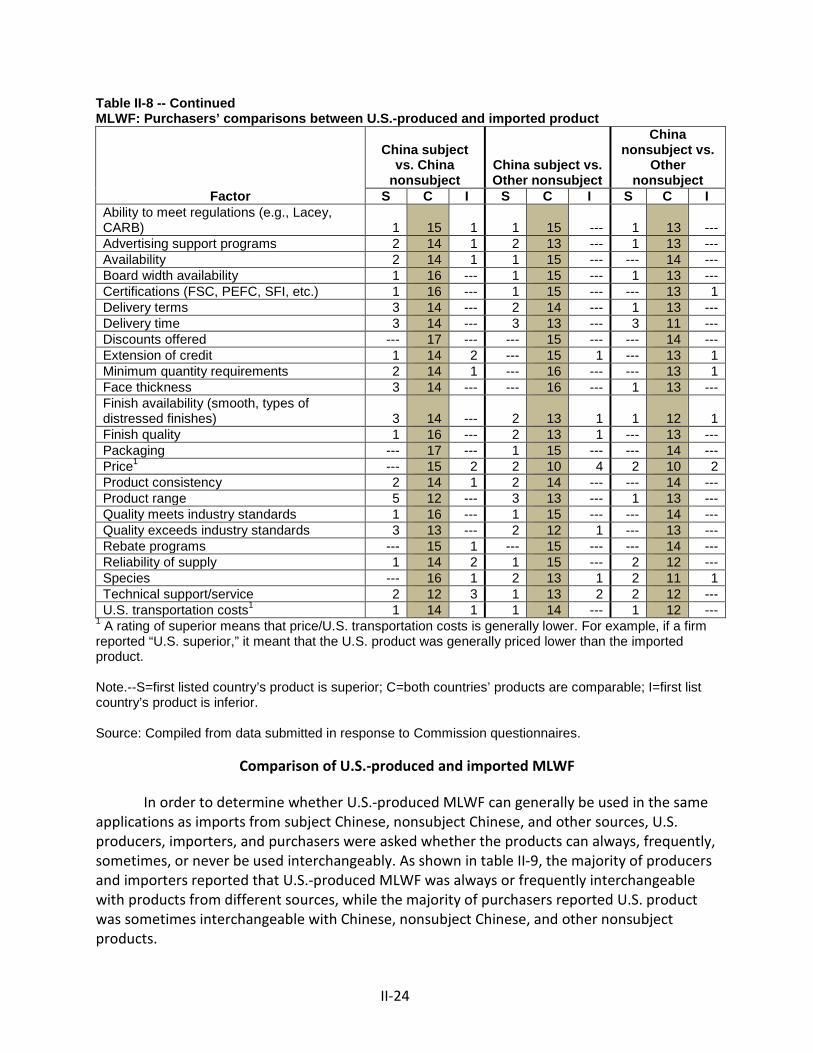
II-24
Table II-8 -- Continued MLWF: Purchasers’ comparisons between U.S.-produced and imported product
Factor
China subject vs. China
nonsubject China subject vs. Other nonsubject
China nonsubject vs.
Other nonsubject
S C I S C I S C I Ability to meet regulations (e.g., Lacey, CARB) 1 15 1 1 15 --- 1 13 --- Advertising support programs 2 14 1 2 13 --- 1 13 --- Availability 2 14 1 1 15 --- --- 14 --- Board width availability 1 16 --- 1 15 --- 1 13 --- Certifications (FSC, PEFC, SFI, etc.) 1 16 --- 1 15 --- --- 13 1 Delivery terms 3 14 --- 2 14 --- 1 13 --- Delivery time 3 14 --- 3 13 --- 3 11 --- Discounts offered --- 17 --- --- 15 --- --- 14 --- Extension of credit 1 14 2 --- 15 1 --- 13 1 Minimum quantity requirements 2 14 1 --- 16 --- --- 13 1 Face thickness 3 14 --- --- 16 --- 1 13 --- Finish availability (smooth, types of distressed finishes) 3 14 --- 2 13 1 1 12 1 Finish quality 1 16 --- 2 13 1 --- 13 --- Packaging --- 17 --- 1 15 --- --- 14 --- Price1 --- 15 2 2 10 4 2 10 2 Product consistency 2 14 1 2 14 --- --- 14 --- Product range 5 12 --- 3 13 --- 1 13 --- Quality meets industry standards 1 16 --- 1 15 --- --- 14 --- Quality exceeds industry standards 3 13 --- 2 12 1 --- 13 --- Rebate programs --- 15 1 --- 15 --- --- 14 --- Reliability of supply 1 14 2 1 15 --- 2 12 --- Species --- 16 1 2 13 1 2 11 1 Technical support/service 2 12 3 1 13 2 2 12 --- U.S. transportation costs1 1 14 1 1 14 --- 1 12 ---
1 A rating of superior means that price/U.S. transportation costs is generally lower. For example, if a firm reported “U.S. superior,” it meant that the U.S. product was generally priced lower than the imported product. Note.--S=first listed country’s product is superior; C=both countries’ products are comparable; I=first list country’s product is inferior. Source: Compiled from data submitted in response to Commission questionnaires.
Comparison of U.S.-produced and imported MLWF
In order to determine whether U.S.-produced MLWF can generally be used in the same applications as imports from subject Chinese, nonsubject Chinese, and other sources, U.S. producers, importers, and purchasers were asked whether the products can always, frequently, sometimes, or never be used interchangeably. As shown in table II-9, the majority of producers and importers reported that U.S.-produced MLWF was always or frequently interchangeable with products from different sources, while the majority of purchasers reported U.S. product was sometimes interchangeable with Chinese, nonsubject Chinese, and other nonsubject products.
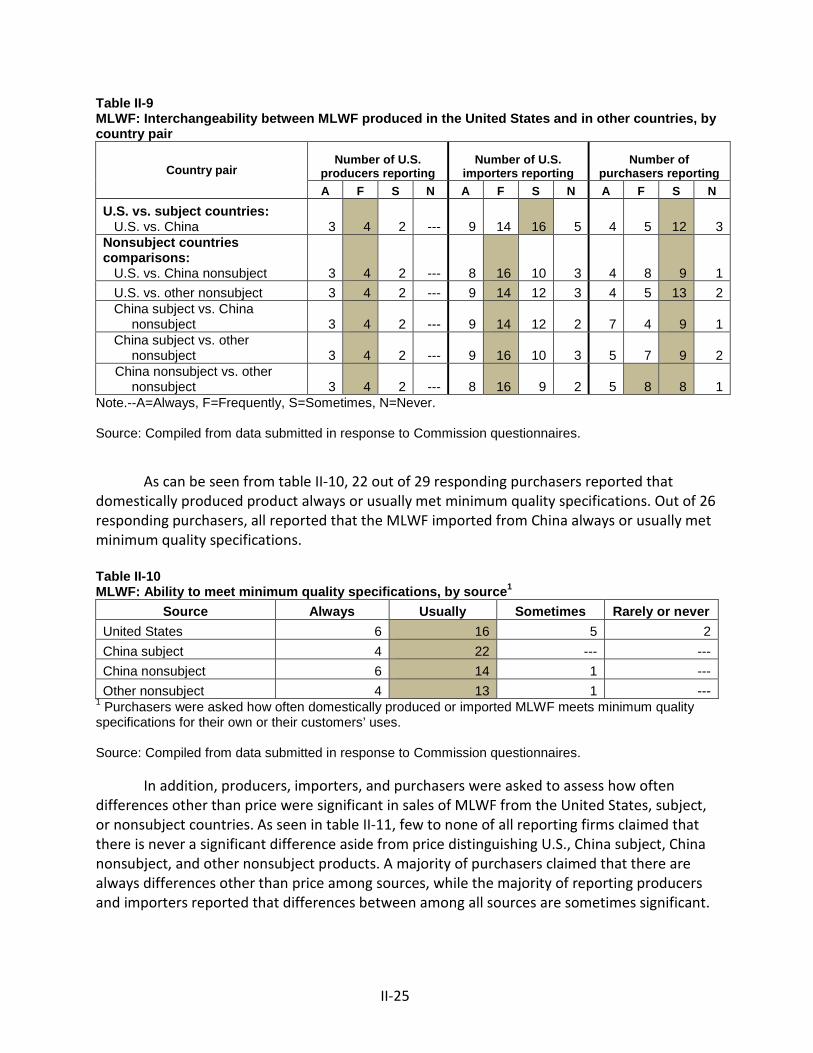
II-25
Table II-9 MLWF: Interchangeability between MLWF produced in the United States and in other countries, by country pair
Country pair Number of U.S.
producers reporting Number of U.S.
importers reporting Number of
purchasers reporting A F S N A F S N A F S N
U.S. vs. subject countries: U.S. vs. China 3 4 2 --- 9 14 16 5 4 5 12 3 Nonsubject countries comparisons: U.S. vs. China nonsubject 3 4 2 --- 8 16 10 3 4 8 9 1 U.S. vs. other nonsubject 3 4 2 --- 9 14 12 3 4 5 13 2 China subject vs. China nonsubject 3 4 2 --- 9 14 12 2 7 4 9 1 China subject vs. other nonsubject 3 4 2 --- 9 16 10 3 5 7 9 2
China nonsubject vs. other nonsubject 3 4 2 --- 8 16 9 2 5 8 8 1
Note.--A=Always, F=Frequently, S=Sometimes, N=Never. Source: Compiled from data submitted in response to Commission questionnaires.
As can be seen from table II-10, 22 out of 29 responding purchasers reported that domestically produced product always or usually met minimum quality specifications. Out of 26 responding purchasers, all reported that the MLWF imported from China always or usually met minimum quality specifications.
Table II-10 MLWF: Ability to meet minimum quality specifications, by source1
Source Always Usually Sometimes Rarely or never United States 6 16 5 2 China subject 4 22 --- --- China nonsubject 6 14 1 --- Other nonsubject 4 13 1 ---
1 Purchasers were asked how often domestically produced or imported MLWF meets minimum quality specifications for their own or their customers’ uses. Source: Compiled from data submitted in response to Commission questionnaires.
In addition, producers, importers, and purchasers were asked to assess how often differences other than price were significant in sales of MLWF from the United States, subject, or nonsubject countries. As seen in table II-11, few to none of all reporting firms claimed that there is never a significant difference aside from price distinguishing U.S., China subject, China nonsubject, and other nonsubject products. A majority of purchasers claimed that there are always differences other than price among sources, while the majority of reporting producers and importers reported that differences between among all sources are sometimes significant.
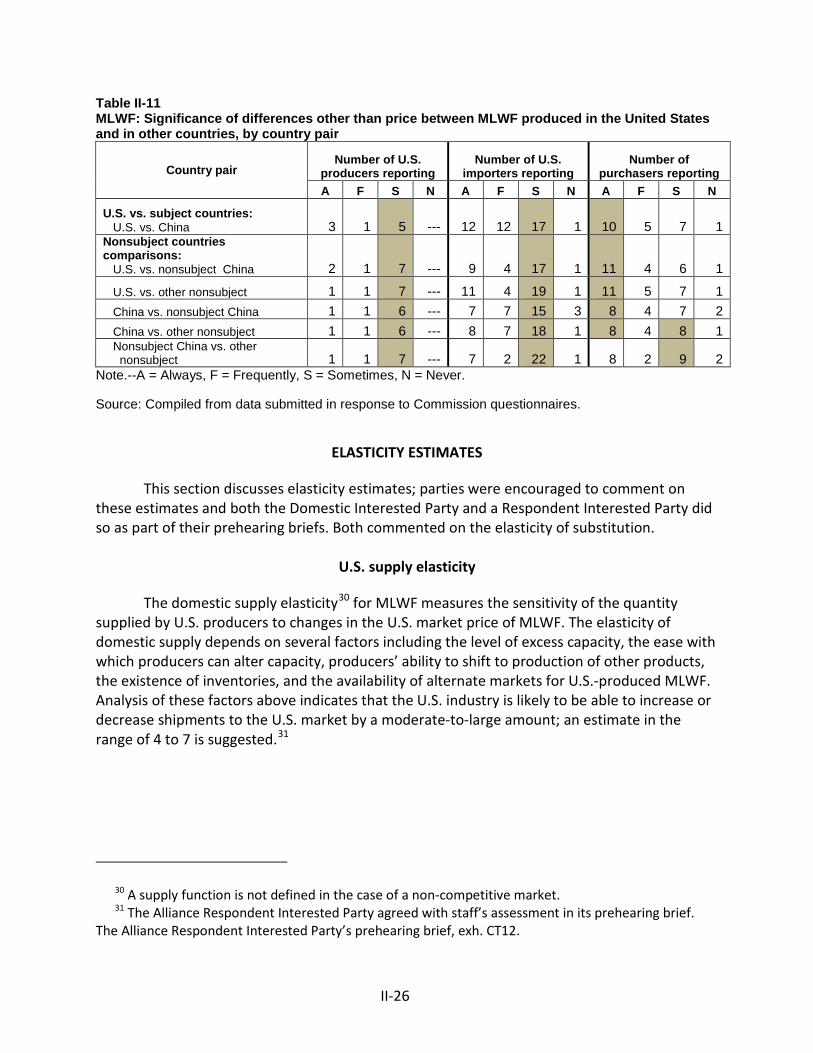
II-26
Table II-11 MLWF: Significance of differences other than price between MLWF produced in the United States and in other countries, by country pair
Country pair Number of U.S.
producers reporting Number of U.S.
importers reporting Number of
purchasers reporting A F S N A F S N A F S N
U.S. vs. subject countries: U.S. vs. China 3 1 5 --- 12 12 17 1 10 5 7 1 Nonsubject countries comparisons: U.S. vs. nonsubject China 2 1 7 --- 9 4 17 1 11 4 6 1
U.S. vs. other nonsubject 1 1 7 --- 11 4 19 1 11 5 7 1 China vs. nonsubject China 1 1 6 --- 7 7 15 3 8 4 7 2 China vs. other nonsubject 1 1 6 --- 8 7 18 1 8 4 8 1 Nonsubject China vs. other
nonsubject 1 1 7 --- 7 2 22 1 8 2 9 2 Note.--A = Always, F = Frequently, S = Sometimes, N = Never. Source: Compiled from data submitted in response to Commission questionnaires.
ELASTICITY ESTIMATES
This section discusses elasticity estimates; parties were encouraged to comment on these estimates and both the Domestic Interested Party and a Respondent Interested Party did so as part of their prehearing briefs. Both commented on the elasticity of substitution.
U.S. supply elasticity
The domestic supply elasticity30 for MLWF measures the sensitivity of the quantity
supplied by U.S. producers to changes in the U.S. market price of MLWF. The elasticity of domestic supply depends on several factors including the level of excess capacity, the ease with which producers can alter capacity, producers’ ability to shift to production of other products, the existence of inventories, and the availability of alternate markets for U.S.-produced MLWF. Analysis of these factors above indicates that the U.S. industry is likely to be able to increase or decrease shipments to the U.S. market by a moderate-to-large amount; an estimate in the range of 4 to 7 is suggested.31
30 A supply function is not defined in the case of a non-competitive market. 31 The Alliance Respondent Interested Party agreed with staff’s assessment in its prehearing brief.
The Alliance Respondent Interested Party’s prehearing brief, exh. CT12.
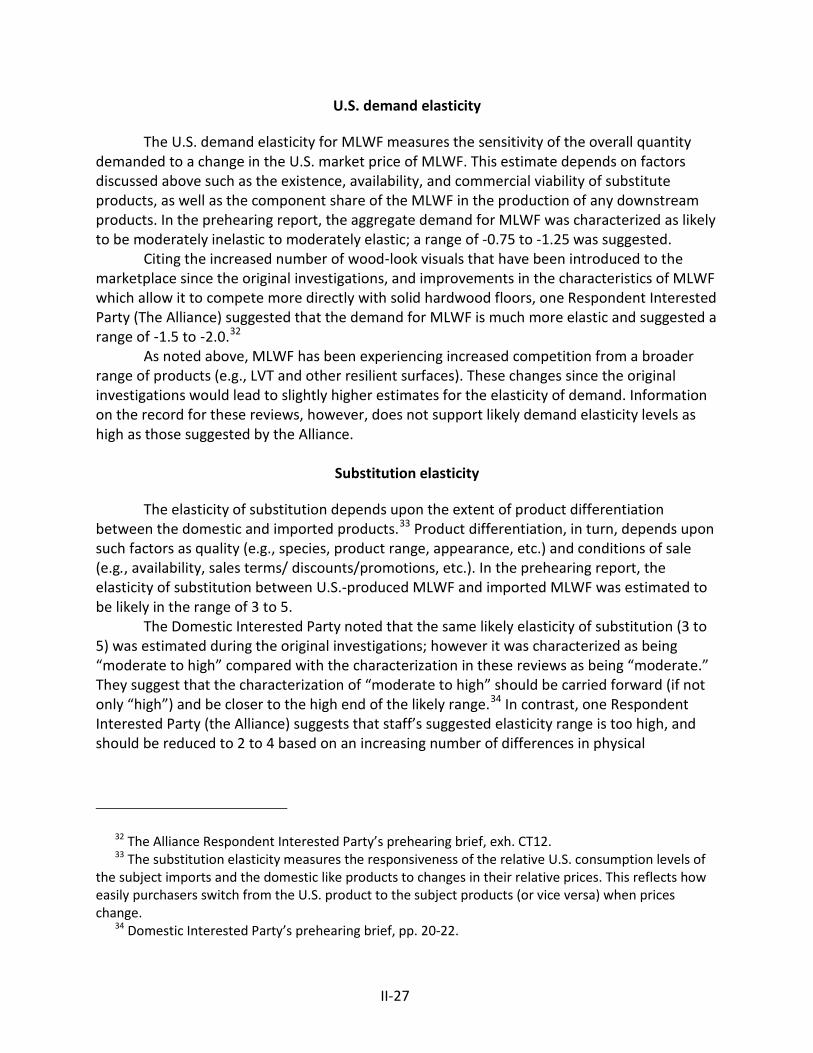
II-27
U.S. demand elasticity
The U.S. demand elasticity for MLWF measures the sensitivity of the overall quantity demanded to a change in the U.S. market price of MLWF. This estimate depends on factors discussed above such as the existence, availability, and commercial viability of substitute products, as well as the component share of the MLWF in the production of any downstream products. In the prehearing report, the aggregate demand for MLWF was characterized as likely to be moderately inelastic to moderately elastic; a range of -0.75 to -1.25 was suggested.
Citing the increased number of wood‐look visuals that have been introduced to the marketplace since the original investigations, and improvements in the characteristics of MLWF which allow it to compete more directly with solid hardwood floors, one Respondent Interested Party (The Alliance) suggested that the demand for MLWF is much more elastic and suggested a range of ‐1.5 to ‐2.0.32
As noted above, MLWF has been experiencing increased competition from a broader range of products (e.g., LVT and other resilient surfaces). These changes since the original investigations would lead to slightly higher estimates for the elasticity of demand. Information on the record for these reviews, however, does not support likely demand elasticity levels as high as those suggested by the Alliance.
Substitution elasticity
The elasticity of substitution depends upon the extent of product differentiation
between the domestic and imported products.33 Product differentiation, in turn, depends upon such factors as quality (e.g., species, product range, appearance, etc.) and conditions of sale (e.g., availability, sales terms/ discounts/promotions, etc.). In the prehearing report, the elasticity of substitution between U.S.-produced MLWF and imported MLWF was estimated to be likely in the range of 3 to 5.
The Domestic Interested Party noted that the same likely elasticity of substitution (3 to 5) was estimated during the original investigations; however it was characterized as being “moderate to high” compared with the characterization in these reviews as being “moderate.” They suggest that the characterization of “moderate to high” should be carried forward (if not only “high”) and be closer to the high end of the likely range.34 In contrast, one Respondent Interested Party (the Alliance) suggests that staff’s suggested elasticity range is too high, and should be reduced to 2 to 4 based on an increasing number of differences in physical
32 The Alliance Respondent Interested Party’s prehearing brief, exh. CT12. 33 The substitution elasticity measures the responsiveness of the relative U.S. consumption levels of
the subject imports and the domestic like products to changes in their relative prices. This reflects how easily purchasers switch from the U.S. product to the subject products (or vice versa) when prices change.
34 Domestic Interested Party’s prehearing brief, pp. 20-22.
II-28
characteristics between the MLWF original investigations and these reviews, other non-price factors, and when comparing MLWF market characteristics to those of other markets.35
Staff maintains that the prehearing substitution elasticity estimate and characterization is proper. Both interested parties suggest estimates that are at least partially in the original likely estimate of 3 to 5. Compared with the data from the original investigations, purchasers’ responses regarding interchangeability indicate slightly less interchangeability between domestic and subject Chinese MLWF. While the difference is enough to eliminate the characterization of high substitution elasticity, it is not likely that it has decreased the lower bound of this elasticity to 2.
35 The Alliance Respondent Interested Party’s prehearing brief, exh. CT 12.
III-1
PART III: CONDITION OF THE U.S. INDUSTRY
OVERVIEW The information in this section of the report was compiled from responses to the
Commission’s questionnaires. Eleven firms, which accounted for the vast majority of U.S. production of MLWF during 2016, supplied information on their operations in these reviews.
Twelve U.S. firms reported production of MLWF during the original investigations: (1) Anderson; (2) Armstrong; (3) Award Hardwood Floors, LLC (“Award”);1 (4) Colonial Craft, now known as Quanex;2 (5) Home Legend;3 (6) Howell; (7) Mannington; (8) Mohawk; (9) Nydree;4 (10) QEP; (11) Shaw; and (12) U.S. Floors. These firms were believed to comprise nearly all known U.S. production of MLWF in 2010.5
Since 2010, several firms have begun producing MLWF in the United States: (1) American OEM, Burns, Tennessee in 2013;6 (2) Appalachian, North Troy, Vermont in 2012; (3) Crossville Hardwoods, LLC (“Crossville”), Crossville, Tennessee in 2012;7 and (4) Mullican, Johnson City, Tennessee in November 2011.8 9 Table III-1 presents responding U.S. producers from the final phase investigations and the current first five-year reviews.
1 Award, a petitioner in the original investigations, ceased operations in November 2013 and closed its facility in Wausau, Wisconsin. Wood Floor Business webpage, http://www.woodfloorbusiness.com/news/manufacturer-award-hardwood-floors-closes-its-doors.html?Itemid=0&_escaped_fragment , retrieved January 5, 2017.
2 Colonial Craft changed its name to Quanex ***. ***. 3 Home Legend reported that it ***. ***. Staff contacted Trout River Dry Kiln LLC (“Trout River”),
Krewe, Virginia. ***. ***. ***. *** did not submit a questionnaire response. 4 Nydree ***. ***. In 2010, Nydree accounted for *** percent of U.S. production. Based on
production information provided by Nydree in this proceeding, Nydree accounted for *** percent of total U.S. production of MLWF in 2016.
5 Multilayered Wood Flooring from China, Inv. Nos. 701-TA-476 and 731-TA-1179 (Final), USITC Publication 4278, November 2011, p. I-3.
6 Counsel for CAHP, email to USITC staff, December 23, 2016, p. 9, fn. 9. 7 Crossville is reported in at least one news website with the name Somerset Hardwood Flooring
(“Somerset”). ***. ***. 8 A fifth new producer, Sheoga Hardwood Flooring & Paneling (“Sheoga”), Middlefield, Ohio ***. ***. 9 Aacer Acquisition LLC dba Aacer Flooring (“Aacer”), Peshtigo, Wisconsin, announced plans to
produce MLWF and reported to the Commission that it ***. ***. In a follow-up, ***. Production of MLWF is expected to be ***. Aacer Flooring webpage, https://www.aacerflooring.com/groundbreaking-news/, retrieved September 19, 2017, ***, ***.
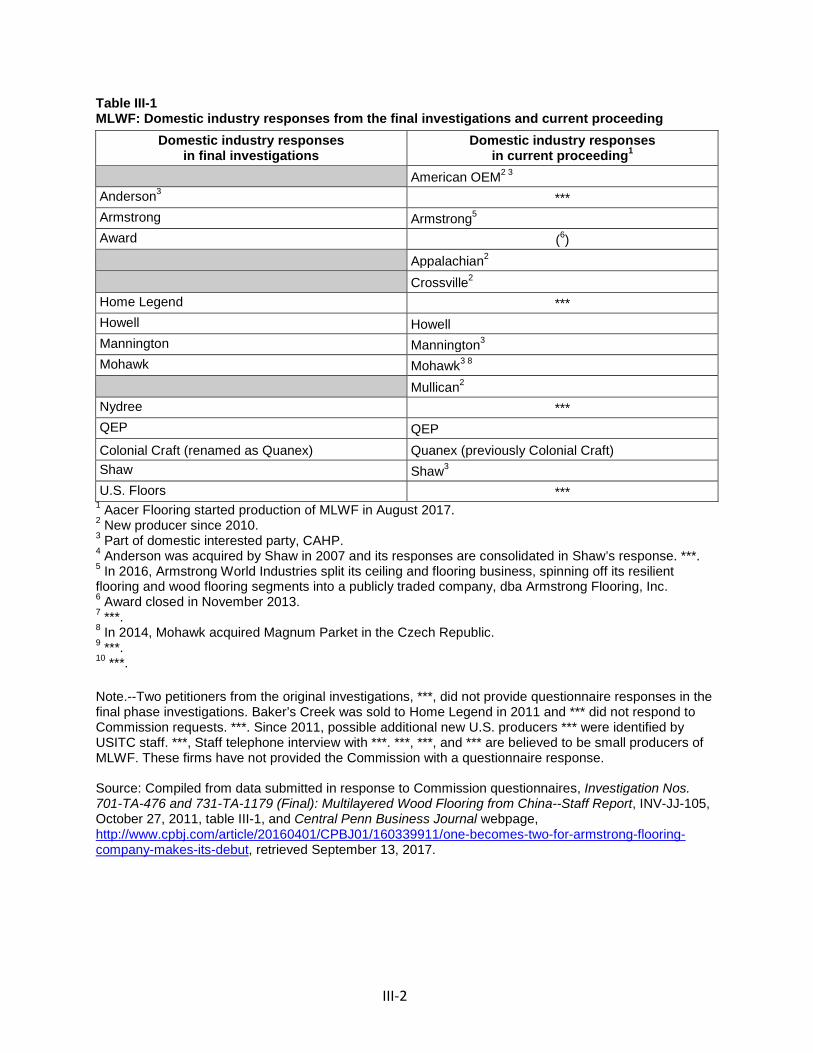
III-2
Table III-1 MLWF: Domestic industry responses from the final investigations and current proceeding
Domestic industry responses in final investigations
Domestic industry responses in current proceeding1
American OEM2 3
Anderson3 *** Armstrong Armstrong5
Award (6) Appalachian2 Crossville2 Home Legend *** Howell Howell Mannington Mannington3 Mohawk Mohawk3 8
Mullican2 Nydree *** QEP QEP Colonial Craft (renamed as Quanex) Quanex (previously Colonial Craft) Shaw Shaw3 U.S. Floors ***
1 Aacer Flooring started production of MLWF in August 2017. 2 New producer since 2010. 3 Part of domestic interested party, CAHP. 4 Anderson was acquired by Shaw in 2007 and its responses are consolidated in Shaw’s response. ***. 5 In 2016, Armstrong World Industries split its ceiling and flooring business, spinning off its resilient flooring and wood flooring segments into a publicly traded company, dba Armstrong Flooring, Inc. 6 Award closed in November 2013. 7 ***. 8 In 2014, Mohawk acquired Magnum Parket in the Czech Republic. 9 ***. 10 ***. Note.--Two petitioners from the original investigations, ***, did not provide questionnaire responses in the final phase investigations. Baker’s Creek was sold to Home Legend in 2011 and *** did not respond to Commission requests. ***. Since 2011, possible additional new U.S. producers *** were identified by USITC staff. ***, Staff telephone interview with ***. ***, ***, and *** are believed to be small producers of MLWF. These firms have not provided the Commission with a questionnaire response. Source: Compiled from data submitted in response to Commission questionnaires, Investigation Nos. 701-TA-476 and 731-TA-1179 (Final): Multilayered Wood Flooring from China--Staff Report, INV-JJ-105, October 27, 2011, table III-1, and Central Penn Business Journal webpage, http://www.cpbj.com/article/20160401/CPBJ01/160339911/one-becomes-two-for-armstrong-flooring-company-makes-its-debut, retrieved September 13, 2017.
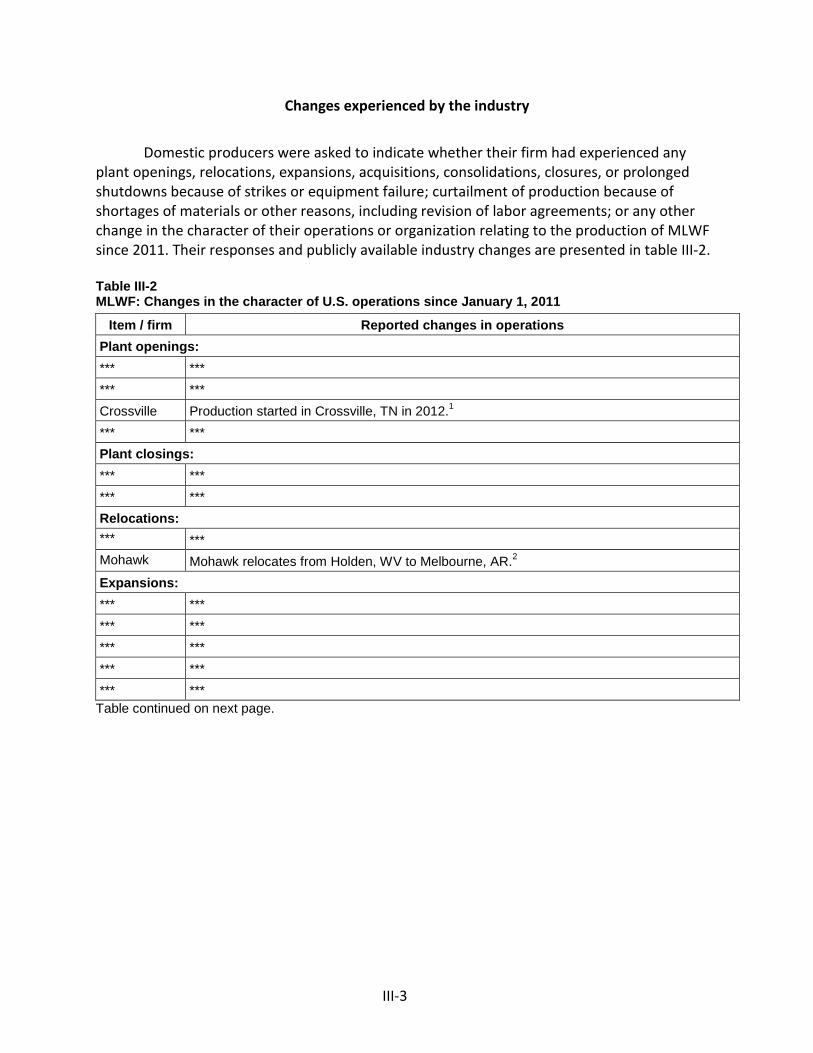
III-3
Changes experienced by the industry
Domestic producers were asked to indicate whether their firm had experienced any
plant openings, relocations, expansions, acquisitions, consolidations, closures, or prolonged shutdowns because of strikes or equipment failure; curtailment of production because of shortages of materials or other reasons, including revision of labor agreements; or any other change in the character of their operations or organization relating to the production of MLWF since 2011. Their responses and publicly available industry changes are presented in table III-2. Table III-2 MLWF: Changes in the character of U.S. operations since January 1, 2011
Item / firm Reported changes in operations Plant openings: *** *** *** *** Crossville Production started in Crossville, TN in 2012.1
*** *** Plant closings: *** *** *** *** Relocations: *** *** Mohawk Mohawk relocates from Holden, WV to Melbourne, AR.2
Expansions: *** ***
*** *** *** *** *** *** *** ***
Table continued on next page.
III-4
Table III-2--Continued MLWF: Changes in the character of U.S. operations since January 1, 2011
Consolidations: *** *** Prolonged shutdowns or curtailments: *** *** *** *** *** *** Other: *** *** *** *** *** ***
1 Floor Covering News webpage, http://www.fcnews.net/2015/01/somerset-hardwood-supplier-walks-softly-carries-big-stick/, retrieved September 19, 2017. 2 WOAY TV webpage, https://woay.tv/mohawk-industries-close-west-virginia-wood-flooring-plant/, retrieved September 13, 2017. Source: Compiled from data submitted in response to Commission questionnaires.
Anticipated changes in operations
The Commission asked domestic producers to report anticipated changes in the character of their operations relating to the production of MLWF. Three out of 11 responding producers anticipated changes and their responses are below in table III-3.
Table III-3 MLWF: Anticipated changes in the character of U.S. operations
Item / Firm Reported changed in operations *** *** Armstrong Armstrong to close MLWF plant in Vicksburg, MS in the fourth quarter of 2017.1 *** ***
1 Harwood Floors Magazine webpage, https://hardwoodfloorsmag.com/2017/08/07/armstrong-flooring-close-two-wood-flooring-manufacturing-facilities/, retrieved September 13, 2017. Source: Compiled from data submitted in response to Commission questionnaires.
III-5
U.S. PRODUCTION, CAPACITY, AND CAPACITY UTILIZATION
Table III-4 and figure III-1 present U.S. producers’ production, capacity, and capacity utilization on a firm-by-firm basis. As the result of multiple industry events, production, capacity, and capacity utilization increased for MLWF from 2011 to 2016. Four new producers entered the MLWF industry: American OEM, Appalachia, Crossvile, and Mullican. One producer, Armstrong, relocated its China-based production of MLWF back to the United States in *** 2014. Six U.S. producers *** expanded their production capacity while four *** reported reductions in production shifts. Capacity was higher in January-June 2017 than January-June 2016 but production was lower.
Two producers, ***, reported tolling agreements. ***. ***. ***. No U.S. producer reported producing other products on the same machinery as that used to produce MLWF.
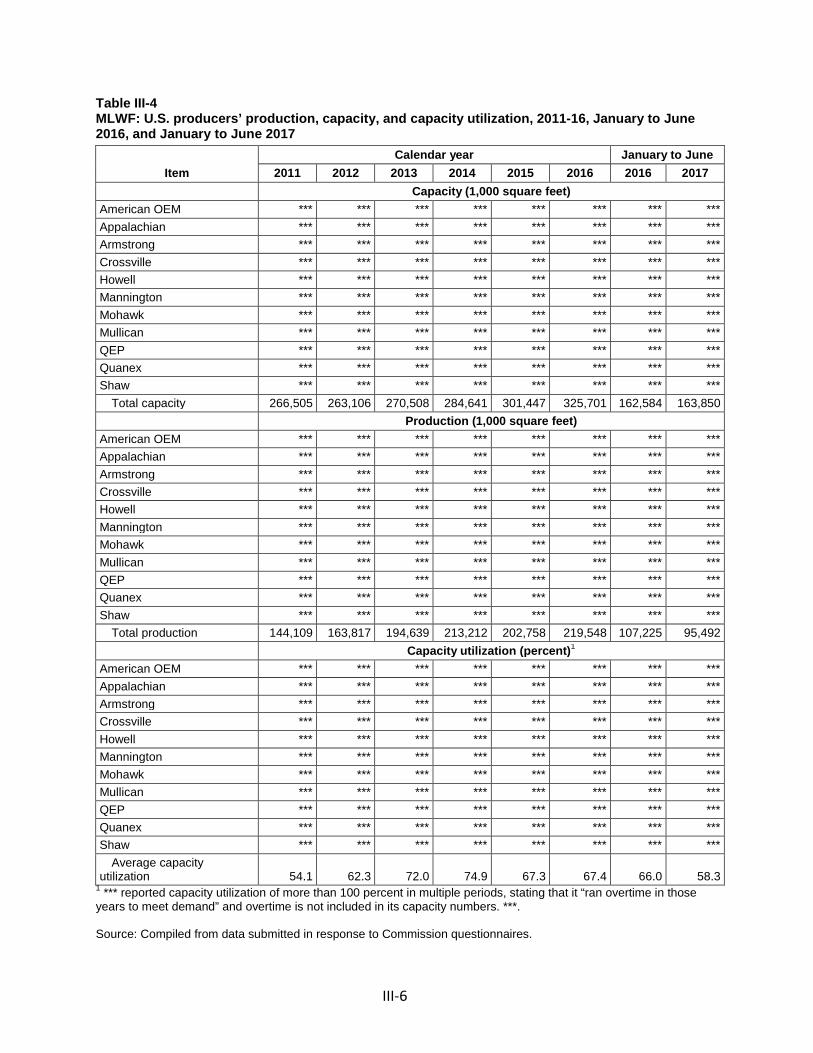
III-6
Table III-4 MLWF: U.S. producers’ production, capacity, and capacity utilization, 2011-16, January to June 2016, and January to June 2017
Item Calendar year January to June
2011 2012 2013 2014 2015 2016 2016 2017 Capacity (1,000 square feet) American OEM *** *** *** *** *** *** *** *** Appalachian *** *** *** *** *** *** *** *** Armstrong *** *** *** *** *** *** *** *** Crossville *** *** *** *** *** *** *** *** Howell *** *** *** *** *** *** *** *** Mannington *** *** *** *** *** *** *** *** Mohawk *** *** *** *** *** *** *** *** Mullican *** *** *** *** *** *** *** *** QEP *** *** *** *** *** *** *** *** Quanex *** *** *** *** *** *** *** *** Shaw *** *** *** *** *** *** *** ***
Total capacity 266,505 263,106 270,508 284,641 301,447 325,701 162,584 163,850 Production (1,000 square feet) American OEM *** *** *** *** *** *** *** *** Appalachian *** *** *** *** *** *** *** *** Armstrong *** *** *** *** *** *** *** *** Crossville *** *** *** *** *** *** *** *** Howell *** *** *** *** *** *** *** *** Mannington *** *** *** *** *** *** *** *** Mohawk *** *** *** *** *** *** *** *** Mullican *** *** *** *** *** *** *** *** QEP *** *** *** *** *** *** *** *** Quanex *** *** *** *** *** *** *** *** Shaw *** *** *** *** *** *** *** ***
Total production 144,109 163,817 194,639 213,212 202,758 219,548 107,225 95,492 Capacity utilization (percent)1 American OEM *** *** *** *** *** *** *** *** Appalachian *** *** *** *** *** *** *** *** Armstrong *** *** *** *** *** *** *** *** Crossville *** *** *** *** *** *** *** *** Howell *** *** *** *** *** *** *** *** Mannington *** *** *** *** *** *** *** *** Mohawk *** *** *** *** *** *** *** *** Mullican *** *** *** *** *** *** *** *** QEP *** *** *** *** *** *** *** *** Quanex *** *** *** *** *** *** *** *** Shaw *** *** *** *** *** *** *** ***
Average capacity utilization 54.1 62.3 72.0 74.9 67.3 67.4 66.0 58.3
1 *** reported capacity utilization of more than 100 percent in multiple periods, stating that it “ran overtime in those years to meet demand” and overtime is not included in its capacity numbers. ***. Source: Compiled from data submitted in response to Commission questionnaires.
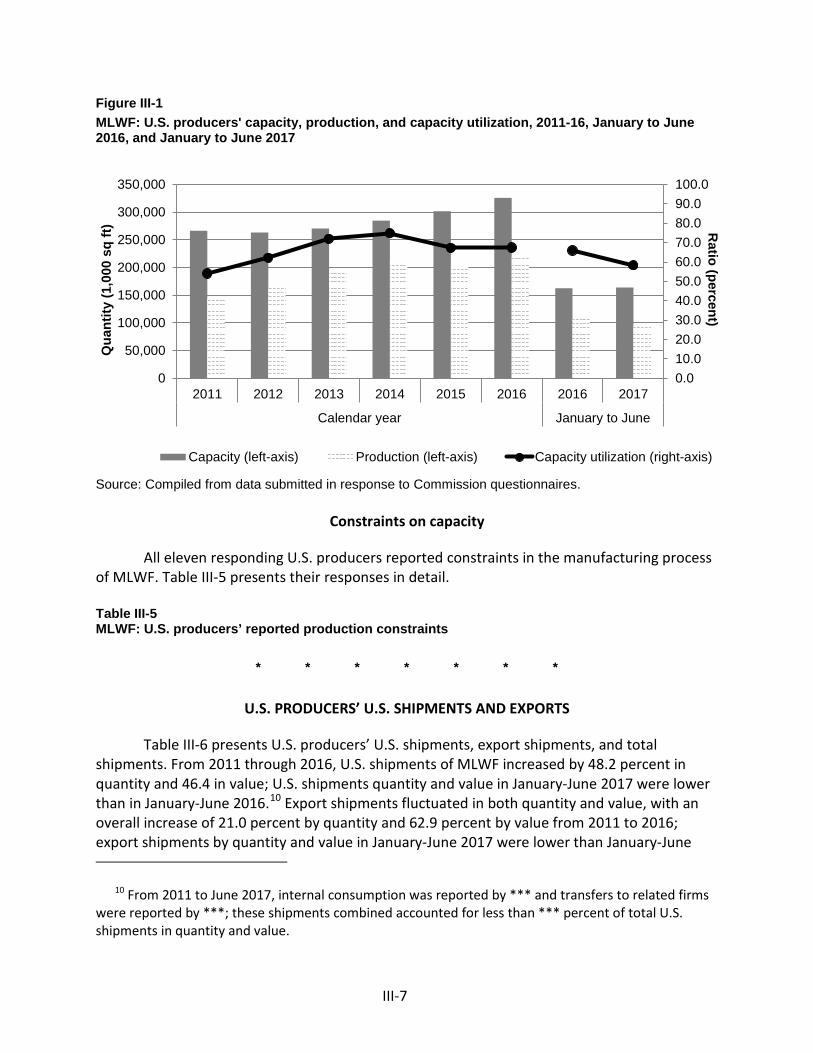
III-7
Figure III-1 MLWF: U.S. producers' capacity, production, and capacity utilization, 2011-16, January to June 2016, and January to June 2017
Source: Compiled from data submitted in response to Commission questionnaires.
Constraints on capacity
All eleven responding U.S. producers reported constraints in the manufacturing process of MLWF. Table III-5 presents their responses in detail.
Table III-5 MLWF: U.S. producers’ reported production constraints
* * * * * * *
U.S. PRODUCERS’ U.S. SHIPMENTS AND EXPORTS
Table III-6 presents U.S. producers’ U.S. shipments, export shipments, and total shipments. From 2011 through 2016, U.S. shipments of MLWF increased by 48.2 percent in quantity and 46.4 in value; U.S. shipments quantity and value in January-June 2017 were lower than in January-June 2016.10 Export shipments fluctuated in both quantity and value, with an overall increase of 21.0 percent by quantity and 62.9 percent by value from 2011 to 2016; export shipments by quantity and value in January-June 2017 were lower than January-June
10 From 2011 to June 2017, internal consumption was reported by *** and transfers to related firms were reported by ***; these shipments combined accounted for less than *** percent of total U.S. shipments in quantity and value.
0.010.020.030.040.050.060.070.080.090.0100.0
0
50,000
100,000
150,000
200,000
250,000
300,000
350,000
2011 2012 2013 2014 2015 2016 2016 2017
Calendar year January to June
Ratio (percent)
Qua
ntity
(1,0
00 s
q ft)
Capacity (left-axis) Production (left-axis) Capacity utilization (right-axis)
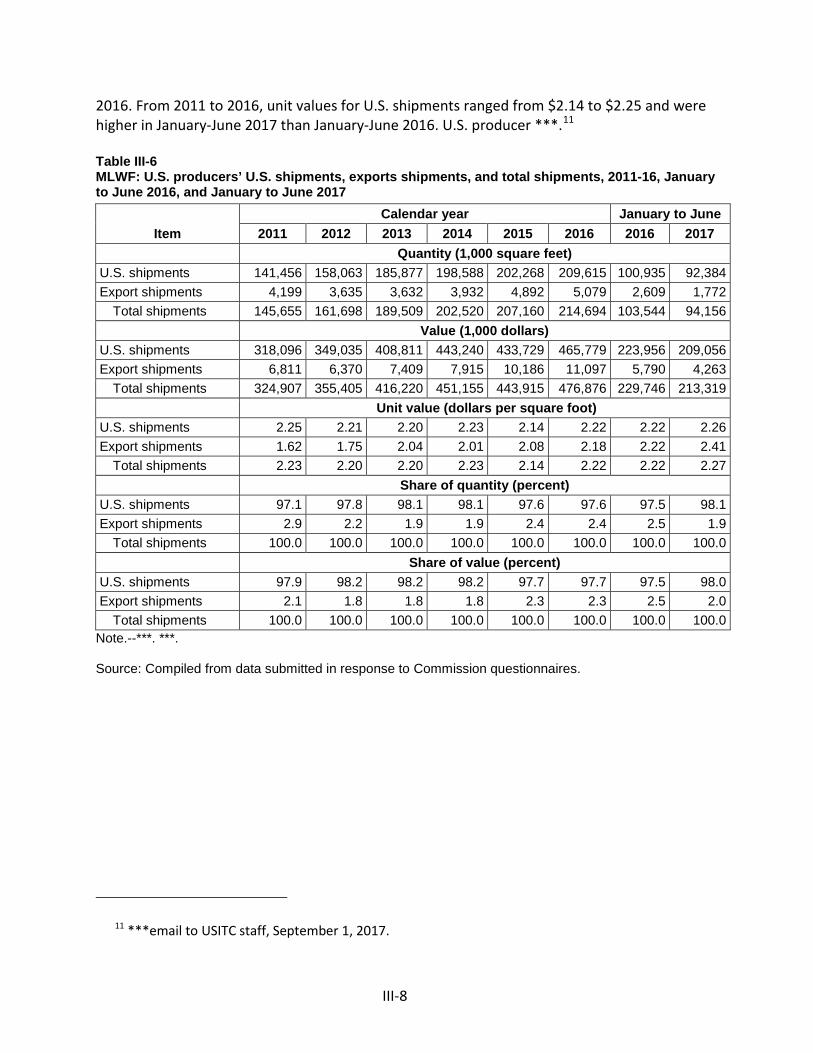
III-8
2016. From 2011 to 2016, unit values for U.S. shipments ranged from $2.14 to $2.25 and were higher in January-June 2017 than January-June 2016. U.S. producer ***.11 Table III-6 MLWF: U.S. producers’ U.S. shipments, exports shipments, and total shipments, 2011-16, January to June 2016, and January to June 2017
Item Calendar year January to June
2011 2012 2013 2014 2015 2016 2016 2017 Quantity (1,000 square feet) U.S. shipments 141,456 158,063 185,877 198,588 202,268 209,615 100,935 92,384 Export shipments 4,199 3,635 3,632 3,932 4,892 5,079 2,609 1,772
Total shipments 145,655 161,698 189,509 202,520 207,160 214,694 103,544 94,156 Value (1,000 dollars) U.S. shipments 318,096 349,035 408,811 443,240 433,729 465,779 223,956 209,056 Export shipments 6,811 6,370 7,409 7,915 10,186 11,097 5,790 4,263
Total shipments 324,907 355,405 416,220 451,155 443,915 476,876 229,746 213,319 Unit value (dollars per square foot) U.S. shipments 2.25 2.21 2.20 2.23 2.14 2.22 2.22 2.26 Export shipments 1.62 1.75 2.04 2.01 2.08 2.18 2.22 2.41
Total shipments 2.23 2.20 2.20 2.23 2.14 2.22 2.22 2.27 Share of quantity (percent) U.S. shipments 97.1 97.8 98.1 98.1 97.6 97.6 97.5 98.1 Export shipments 2.9 2.2 1.9 1.9 2.4 2.4 2.5 1.9
Total shipments 100.0 100.0 100.0 100.0 100.0 100.0 100.0 100.0 Share of value (percent) U.S. shipments 97.9 98.2 98.2 98.2 97.7 97.7 97.5 98.0 Export shipments 2.1 1.8 1.8 1.8 2.3 2.3 2.5 2.0
Total shipments 100.0 100.0 100.0 100.0 100.0 100.0 100.0 100.0 Note.--***. ***. Source: Compiled from data submitted in response to Commission questionnaires.
11 ***email to USITC staff, September 1, 2017.
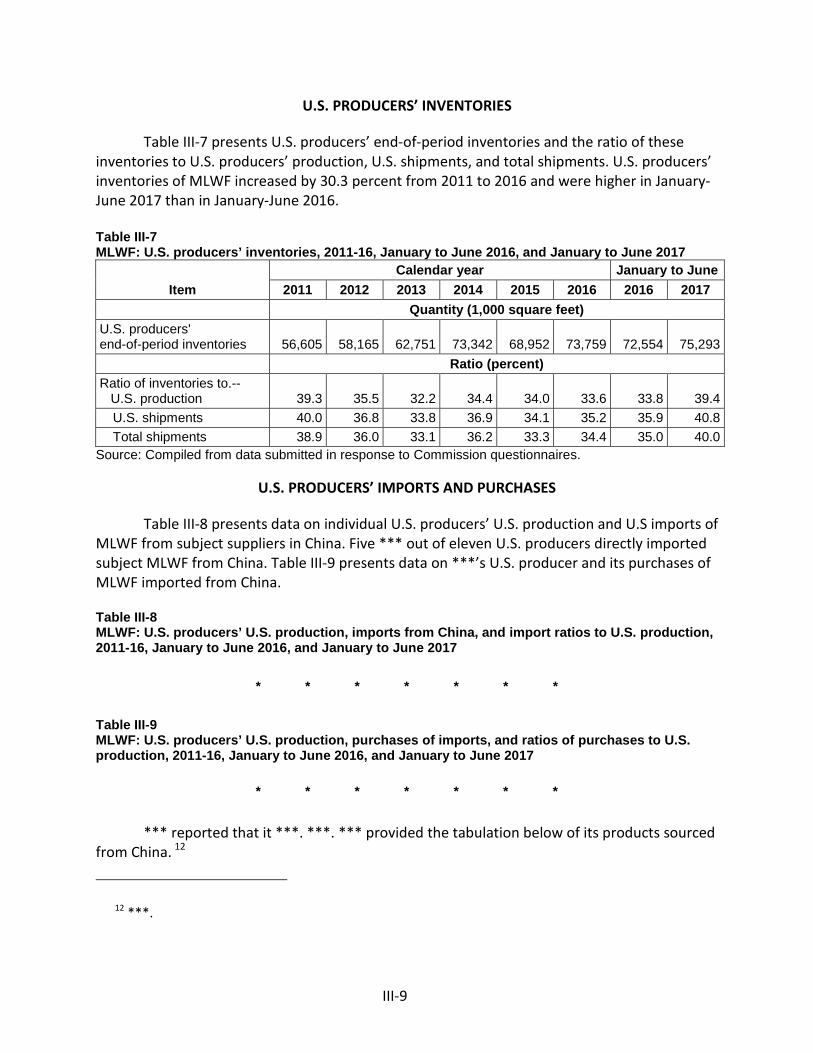
III-9
U.S. PRODUCERS’ INVENTORIES
Table III-7 presents U.S. producers’ end-of-period inventories and the ratio of these inventories to U.S. producers’ production, U.S. shipments, and total shipments. U.S. producers’ inventories of MLWF increased by 30.3 percent from 2011 to 2016 and were higher in January-June 2017 than in January-June 2016.
Table III-7 MLWF: U.S. producers’ inventories, 2011-16, January to June 2016, and January to June 2017
Item Calendar year January to June
2011 2012 2013 2014 2015 2016 2016 2017 Quantity (1,000 square feet) U.S. producers' end-of-period inventories 56,605 58,165 62,751 73,342 68,952 73,759 72,554 75,293 Ratio (percent) Ratio of inventories to.-- U.S. production 39.3 35.5 32.2 34.4 34.0 33.6 33.8 39.4
U.S. shipments 40.0 36.8 33.8 36.9 34.1 35.2 35.9 40.8 Total shipments 38.9 36.0 33.1 36.2 33.3 34.4 35.0 40.0
Source: Compiled from data submitted in response to Commission questionnaires.
U.S. PRODUCERS’ IMPORTS AND PURCHASES
Table III-8 presents data on individual U.S. producers’ U.S. production and U.S imports of MLWF from subject suppliers in China. Five *** out of eleven U.S. producers directly imported subject MLWF from China. Table III-9 presents data on ***’s U.S. producer and its purchases of MLWF imported from China. Table III-8 MLWF: U.S. producers’ U.S. production, imports from China, and import ratios to U.S. production, 2011-16, January to June 2016, and January to June 2017
* * * * * * * Table III-9 MLWF: U.S. producers’ U.S. production, purchases of imports, and ratios of purchases to U.S. production, 2011-16, January to June 2016, and January to June 2017
* * * * * * * *** reported that it ***. ***. *** provided the tabulation below of its products sourced
from China. 12
12 ***.
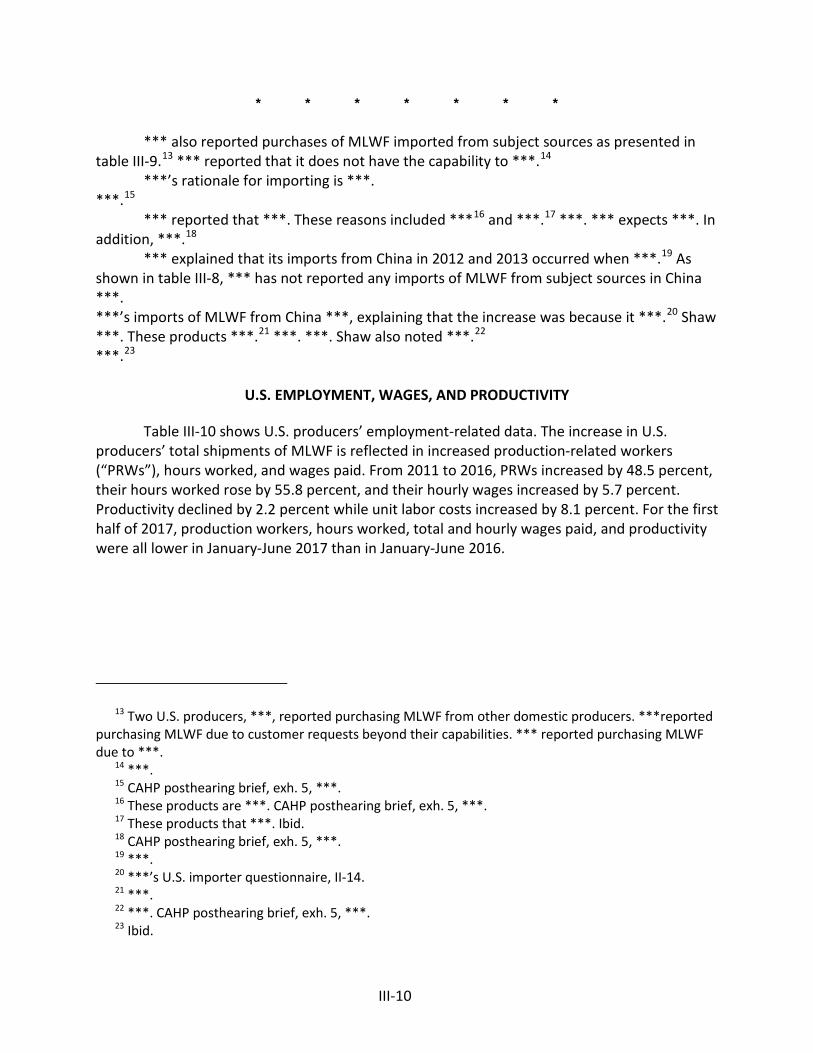
III-10
* * * * * * *
*** also reported purchases of MLWF imported from subject sources as presented in table III-9.13 *** reported that it does not have the capability to ***.14
***’s rationale for importing is ***. ***.15
*** reported that ***. These reasons included ***16 and ***.17 ***. *** expects ***. In addition, ***.18
*** explained that its imports from China in 2012 and 2013 occurred when ***.19 As shown in table III-8, *** has not reported any imports of MLWF from subject sources in China ***. ***’s imports of MLWF from China ***, explaining that the increase was because it ***.20 Shaw ***. These products ***.21 ***. ***. Shaw also noted ***.22 ***.23
U.S. EMPLOYMENT, WAGES, AND PRODUCTIVITY
Table III-10 shows U.S. producers’ employment-related data. The increase in U.S. producers’ total shipments of MLWF is reflected in increased production-related workers (“PRWs”), hours worked, and wages paid. From 2011 to 2016, PRWs increased by 48.5 percent, their hours worked rose by 55.8 percent, and their hourly wages increased by 5.7 percent. Productivity declined by 2.2 percent while unit labor costs increased by 8.1 percent. For the first half of 2017, production workers, hours worked, total and hourly wages paid, and productivity were all lower in January-June 2017 than in January-June 2016.
13 Two U.S. producers, ***, reported purchasing MLWF from other domestic producers. ***reported purchasing MLWF due to customer requests beyond their capabilities. *** reported purchasing MLWF due to ***.
14 ***. 15 CAHP posthearing brief, exh. 5, ***. 16 These products are ***. CAHP posthearing brief, exh. 5, ***. 17 These products that ***. Ibid. 18 CAHP posthearing brief, exh. 5, ***. 19 ***. 20 ***’s U.S. importer questionnaire, II-14. 21 ***. 22 ***. CAHP posthearing brief, exh. 5, ***. 23 Ibid.
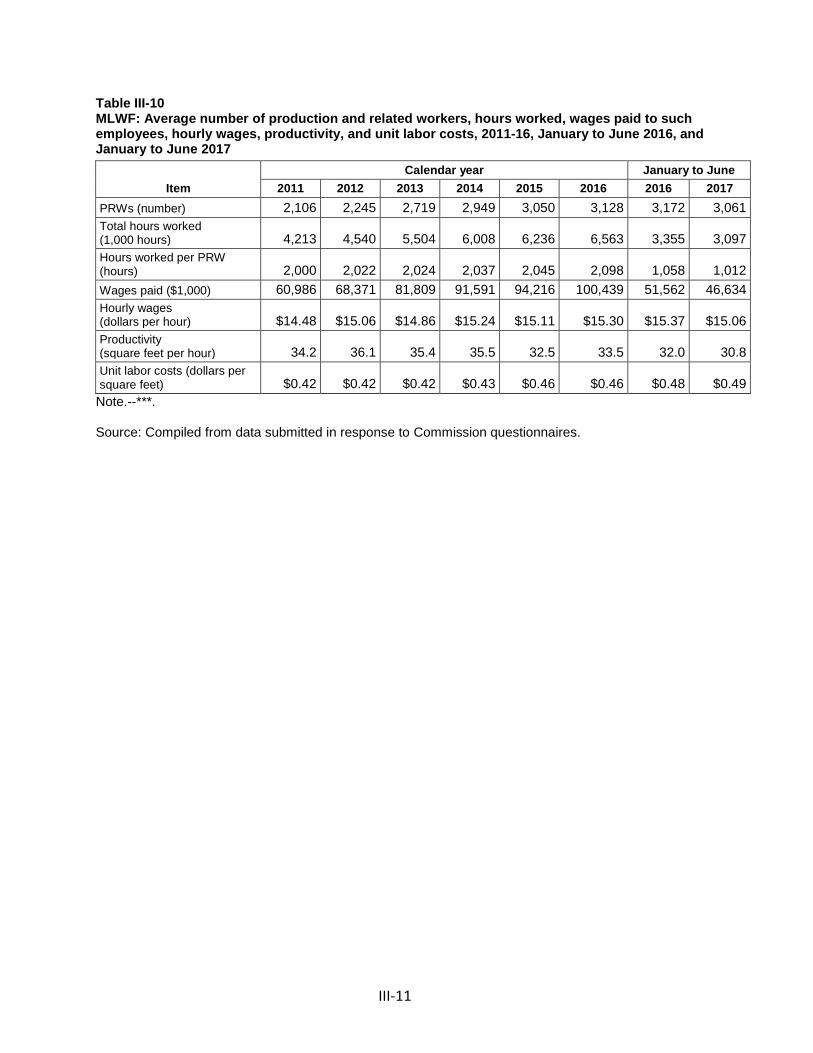
III-11
Table III-10 MLWF: Average number of production and related workers, hours worked, wages paid to such employees, hourly wages, productivity, and unit labor costs, 2011-16, January to June 2016, and January to June 2017
Item Calendar year January to June
2011 2012 2013 2014 2015 2016 2016 2017 PRWs (number) 2,106 2,245 2,719 2,949 3,050 3,128 3,172 3,061 Total hours worked (1,000 hours) 4,213 4,540 5,504 6,008 6,236 6,563 3,355 3,097 Hours worked per PRW (hours) 2,000 2,022 2,024 2,037 2,045 2,098 1,058 1,012 Wages paid ($1,000) 60,986 68,371 81,809 91,591 94,216 100,439 51,562 46,634 Hourly wages (dollars per hour) $14.48 $15.06 $14.86 $15.24 $15.11 $15.30 $15.37 $15.06 Productivity (square feet per hour) 34.2 36.1 35.4 35.5 32.5 33.5 32.0 30.8 Unit labor costs (dollars per square feet) $0.42 $0.42 $0.42 $0.43 $0.46 $0.46 $0.48 $0.49
Note.--***. Source: Compiled from data submitted in response to Commission questionnaires.
III-12
INANCIAL EXPERIENCE OF U.S. PRODUCERS
FINANCIAL EXPERIENCE OF U.S. PRODUCERS
Background
Eleven U.S. producers provided financial results on their MLWF operations.24 With the exceptions noted below, annual financial results were reported for calendar-year periods based on U.S. generally accepted accounting principles (GAAP).25
MLWF revenue primarily reflects commercial sales (*** percent of total sales quantity reported for 2011 through second quarter 2017), but also includes small amounts of transfers and internal consumption: *** percent and *** percent of total sales quantity, respectively.26 MLWF operations are relatively concentrated with the four largest producers accounting for *** percent of total sales quantity: ***. The remaining U.S. producers account for shares of total MLWF sales quantity ranging from *** percent (***) to *** percent (***).
During 2011 through second quarter 2017, the U.S. industry’s MLWF operations and costs reflect the repatriation of offshore capacity, additions to existing capacity, and start-up activity. On April 1, 2016, Armstrong became a separate publicly traded company.27 As noted below, this ***.
Operations on MLWF
Table III-11 presents U.S. producers’ financial results on MLWF. Table III-12 presents corresponding changes in average per-square-foot values. Table III-13 presents financial results information by firm.
Net sales
Total MLWF sales quantity increased during full-year 2011-16. Notably large company-specific increases in sales quantity generally reflect transition from start-up phase to full-scale manufacturing operations. While similar during parts of the period, the four largest U.S. producers were not uniform in terms of magnitude of change or directional trend of MLWF sales quantity (table III-13).28 Smaller-quantity producers also tended to have a mixed directional pattern of sales quantity. Reflecting a more uniform pattern of directional trend, the majority of U.S. producers reported lower MLWF sales quantity in interim 2017 compared to interim 2016. The *** whose interim 2017 sales quantity was *** percent higher compared to interim 2016.
24 While *** reported limited trade data and responses to some qualitative questions, the company did not report financial results. *** is therefore not included in this section of the report.
25 The following companies reported their annual financial results on a fiscal year (FY) basis: ***. *** reported its tax basis financial results.
26 The small amount of internal consumption was reported by *** and reflects samples produced for marketing purposes. Transfer sales were reported by ***. Given the predominance of commercial sales, a single line item for MLWF revenue is presented in this section of the report.
27 Armstrong 2016 10-K, p. 2. 28 ***. August 23, 2017 e-mail (first) from *** to USITC auditor.
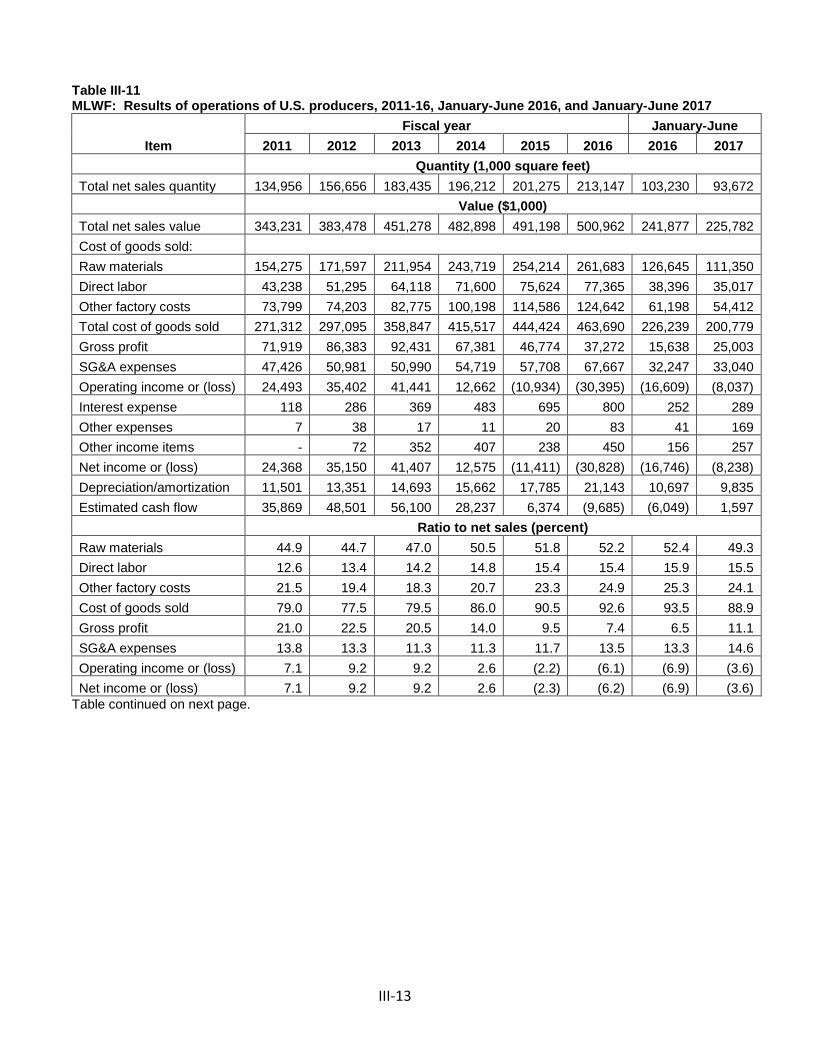
III-13
Table III-11 MLWF: Results of operations of U.S. producers, 2011-16, January-June 2016, and January-June 2017
Item Fiscal year January-June
2011 2012 2013 2014 2015 2016 2016 2017
Quantity (1,000 square feet)
Total net sales quantity 134,956 156,656 183,435 196,212 201,275 213,147 103,230 93,672
Value ($1,000)
Total net sales value 343,231 383,478 451,278 482,898 491,198 500,962 241,877 225,782 Cost of goods sold:
Raw materials 154,275 171,597 211,954 243,719 254,214 261,683 126,645 111,350 Direct labor 43,238 51,295 64,118 71,600 75,624 77,365 38,396 35,017 Other factory costs 73,799 74,203 82,775 100,198 114,586 124,642 61,198 54,412 Total cost of goods sold 271,312 297,095 358,847 415,517 444,424 463,690 226,239 200,779 Gross profit 71,919 86,383 92,431 67,381 46,774 37,272 15,638 25,003 SG&A expenses 47,426 50,981 50,990 54,719 57,708 67,667 32,247 33,040 Operating income or (loss) 24,493 35,402 41,441 12,662 (10,934) (30,395) (16,609) (8,037) Interest expense 118 286 369 483 695 800 252 289 Other expenses 7 38 17 11 20 83 41 169 Other income items - 72 352 407 238 450 156 257 Net income or (loss) 24,368 35,150 41,407 12,575 (11,411) (30,828) (16,746) (8,238) Depreciation/amortization 11,501 13,351 14,693 15,662 17,785 21,143 10,697 9,835 Estimated cash flow 35,869 48,501 56,100 28,237 6,374 (9,685) (6,049) 1,597
Ratio to net sales (percent)
Raw materials 44.9 44.7 47.0 50.5 51.8 52.2 52.4 49.3 Direct labor 12.6 13.4 14.2 14.8 15.4 15.4 15.9 15.5 Other factory costs 21.5 19.4 18.3 20.7 23.3 24.9 25.3 24.1 Cost of goods sold 79.0 77.5 79.5 86.0 90.5 92.6 93.5 88.9 Gross profit 21.0 22.5 20.5 14.0 9.5 7.4 6.5 11.1 SG&A expenses 13.8 13.3 11.3 11.3 11.7 13.5 13.3 14.6 Operating income or (loss) 7.1 9.2 9.2 2.6 (2.2) (6.1) (6.9) (3.6) Net income or (loss) 7.1 9.2 9.2 2.6 (2.3) (6.2) (6.9) (3.6)
Table continued on next page.
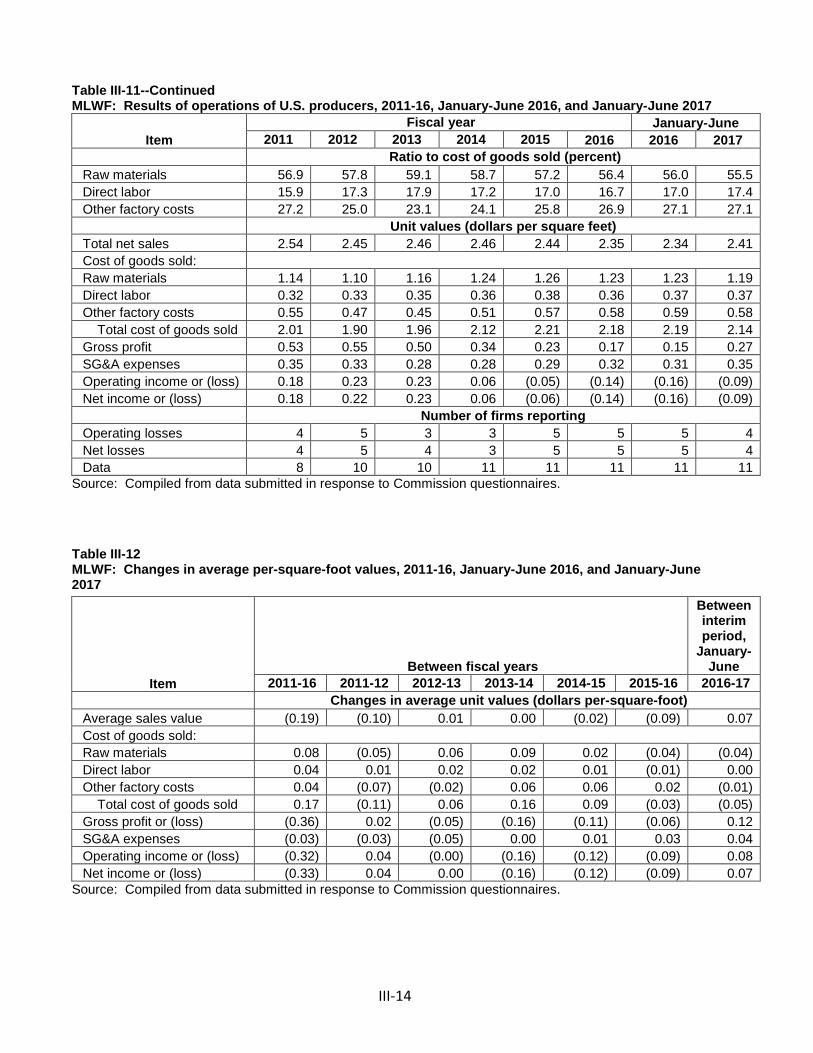
III-14
Table III-11--Continued MLWF: Results of operations of U.S. producers, 2011-16, January-June 2016, and January-June 2017
Item Fiscal year January-June
2011 2012 2013 2014 2015 2016 2016 2017 Ratio to cost of goods sold (percent) Raw materials 56.9 57.8 59.1 58.7 57.2 56.4 56.0 55.5 Direct labor 15.9 17.3 17.9 17.2 17.0 16.7 17.0 17.4 Other factory costs 27.2 25.0 23.1 24.1 25.8 26.9 27.1 27.1 Unit values (dollars per square feet) Total net sales 2.54 2.45 2.46 2.46 2.44 2.35 2.34 2.41 Cost of goods sold:
Raw materials 1.14 1.10 1.16 1.24 1.26 1.23 1.23 1.19 Direct labor 0.32 0.33 0.35 0.36 0.38 0.36 0.37 0.37 Other factory costs 0.55 0.47 0.45 0.51 0.57 0.58 0.59 0.58 Total cost of goods sold 2.01 1.90 1.96 2.12 2.21 2.18 2.19 2.14 Gross profit 0.53 0.55 0.50 0.34 0.23 0.17 0.15 0.27 SG&A expenses 0.35 0.33 0.28 0.28 0.29 0.32 0.31 0.35 Operating income or (loss) 0.18 0.23 0.23 0.06 (0.05) (0.14) (0.16) (0.09) Net income or (loss) 0.18 0.22 0.23 0.06 (0.06) (0.14) (0.16) (0.09) Number of firms reporting Operating losses 4 5 3 3 5 5 5 4 Net losses 4 5 4 3 5 5 5 4 Data 8 10 10 11 11 11 11 11
Source: Compiled from data submitted in response to Commission questionnaires.
Table III-12 MLWF: Changes in average per-square-foot values, 2011-16, January-June 2016, and January-June 2017
Item Between fiscal years
Between interim period,
January-June
2011-16 2011-12 2012-13 2013-14 2014-15 2015-16 2016-17 Changes in average unit values (dollars per-square-foot)
Average sales value (0.19) (0.10) 0.01 0.00 (0.02) (0.09) 0.07 Cost of goods sold:
Raw materials 0.08 (0.05) 0.06 0.09 0.02 (0.04) (0.04) Direct labor 0.04 0.01 0.02 0.02 0.01 (0.01) 0.00 Other factory costs 0.04 (0.07) (0.02) 0.06 0.06 0.02 (0.01) Total cost of goods sold 0.17 (0.11) 0.06 0.16 0.09 (0.03) (0.05) Gross profit or (loss) (0.36) 0.02 (0.05) (0.16) (0.11) (0.06) 0.12 SG&A expenses (0.03) (0.03) (0.05) 0.00 0.01 0.03 0.04 Operating income or (loss) (0.32) 0.04 (0.00) (0.16) (0.12) (0.09) 0.08 Net income or (loss) (0.33) 0.04 0.00 (0.16) (0.12) (0.09) 0.07
Source: Compiled from data submitted in response to Commission questionnaires.
III-15
Table III-13 MLWF: Results of operations of U.S. producers by firm, 2011-16, January-June 2016, and January-June 2017
* * * * * *
While average per-square-foot MLWF sales values remained within a relatively narrow
range throughout much of the period, declines were reported in 2012 and 2016 and corresponded directionally with declines in average per-square-foot raw material costs. An increase in interim 2017 average per-square-foot sales value, notwithstanding a decline in average per-square-foot raw material cost, recovered some of the previous decline.
Company-specific average per-square-foot sales values were in the same general range with *** alternating in terms of which firm reported the highest average per-square-foot sales value. ***, generally reported the lowest average per-square-foot sales value.29 *** reported the lowest average per-square-foot sales values for most of the period. Cost of goods sold and gross profit
Raw material costs, ranging from 55.5 percent of total cost of goods sold (COGS) in interim 2017 to 59.1 percent in 2013, represent the largest share of total COGS (see table III-11).30 Raw material inputs were identified as logs, core veneer, face veneer, back veneer, chemicals, finish, and glue. Depending on the level of vertical integration, the form of company-specific primary wood input varies.
While declining in 2012 and 2016, average per-square-foot raw material costs increased for the period as a whole. Company-specific average per-square-foot raw material costs reflect a relatively broad range (see table III-13).31 32 33
Other factory costs, ranging from 23.1 percent of total COGS in 2013 to 27.2 percent in 2011, account for the second largest share of COGS. Direct labor, the smallest share of COGS, ranged from 15.9 percent of total COGS in 2011 to 17.9 percent in 2013.
On an overall basis, average per-square-foot other factory costs declined in 2012 and 2013, increased in 2014 through 2016, and were marginally lower in interim 2017 compared to interim 2016. The decline in average per-square-foot other factory costs in 2011-13 is generally consistent with higher levels of sales volume and corresponding increased fixed cost absorption. The increase in average per-square-foot other factory costs in 2014-16, despite continued increases in sales volume, largely reflects *** (see footnotes 28 and 29).
During the first part of the period, 2011-13, the U.S. industry’s gross profit increased on an absolute basis, with gross profit ratios (total gross profit divided by total revenue) at their highest levels and moving within a relatively narrow range (see table III-11). To the extent that the U.S. industry’s total sales quantity was still increasing in the second part of the period,
29 ***. August 30, 2017 e-mail with attachment from *** to USITC auditor. 30 ***. September 1, 2017 e-mail with attachment from *** to USITC auditor. 31 ***. August 23, 2017 e-mail (first) from *** to USITC auditor. 32 ***. September 1, 2017 e-mail with attachments from counsel on behalf of *** to USITC auditor. 33 ***. August 29, 2017 e-mail with attachment from *** to USITC auditor.
III-16
2014-16, albeit at a slower rate, the subsequent decline in total gross profit generally reflects a contraction in gross profit ratio.
With respect to 2014 and 2015, the contraction in gross profit ratio can be attributed to more-or-less static average per-square-foot sales values which did not offset higher average per-square-foot COGS, principally reflecting higher average per-square-foot raw material costs and other factory costs (see table III-12).34 35 In 2016, the continued contraction in gross profit ratio reflects a decline in average per-square-foot sales value, which was only partially offset by a decline in average per-square-foot COGS. Lower average per-square-foot COGS in 2016 was principally due to lower average per-square-foot raw material costs. In interim 2017 compared to interim 2016, the gross profit ratio expanded somewhat reflecting an increase in average per-square-foot sales value, which was amplified by a decline in average per-square-foot COGS. Lower interim 2017 COGS was principally due to a decline in average per-square-foot raw material cost.
SG&A expenses and operating income or loss
Total selling, general and administrative (SG&A) expenses increased throughout the period with the U.S. industry’s full-year SG&A expense ratio (total SG&A expenses divided by total revenue) at its lowest level in 2013-14 followed by increases in 2015 and 2016 (see table III-11). Generally reflecting lower total revenue and somewhat higher total SG&A expenses, the U.S. industry’s SG&A expense ratio was at its highest level in interim 2017.
While the pattern of increasing SG&A expenses during the full-year period is directionally consistent with increases in total sales quantity, the *** total SG&A expenses in 2016 largely explains the increase in the U.S. industry’s total SG&A expenses in that year (see table III-13).36 *** higher SG&A expense ratios in 2016 through interim 2017, *** reported SG&A expense ratios that were generally in a similar range. *** producers, in contrast, reported a broader range of SG&A expense ratios.
On a company-specific basis, a number of the *** producers were profitable for a large part of the period during which they reported operations and, in some cases, the entire period.37 With regard to several of the ***, the transition from operating losses to profitability reflects the exit from start-up phase and/or a shift in the type of MLWF products offered.38 39 40 *** were more mixed in terms of the pattern of their operating results: *** reported operating losses of varying magnitude throughout most of the period.41 42 *** reported operating income during 2011 through 2013. In 2014, *** reported operating income and *** reported
34 ***. September 1, 2017 e-mail with attachment from *** to USITC auditor. 35 ***. August 29, 2017 e-mail with attachment from *** to USITC auditor. 36 ***. *** U.S. producer questionnaire, response to III-4. 37 ***. August 27, 2017 e-mail with attachment from *** to USITC auditor. ***. August 29, 2017 e-mail with attachment from *** to USITC auditor. 38 ***. August 23, 2017 e-mail from *** to USITC auditor. 39 ***. August 23, 2017 e-mail with attachments from *** to USITC auditor. 40 ***. August 23, 2017 e-mail with attachments from *** to USITC auditor. 41 ***. August 23, 2017 e-mail (first) from *** to USITC auditor. 42 ***. September 1, 2017 e-mail with attachments from counsel on behalf of *** to USITC auditor.
III-17
an operating loss. In 2015-16, *** reported operating losses and then diverged again at the end of the period with *** reporting an operating loss in interim 2017 and *** reporting operating income.43
Changes in the U.S. industry’s total operating income followed the same directional pattern as gross profit. The operating income ratio (total operating income divided by total revenue) was at its highest level, 9.2 percent, in 2012-13. In conjunction with the previously noted contraction in gross profit ratios, the decline in 2014 operating income was followed by operating losses of increasing magnitude in 2015 and 2016. At the end of the period, there was a relative improvement in operating results inasmuch as the interim 2017 operating loss was about half of the interim 2016 operating loss. Interest expense, other expenses, and net income or loss
Given the relatively small levels of total interest expense and other income and expenses reported (see table III-11), the U.S. industry’s financial results at the net level are essentially the same as the operating level.
Capital expenditures and research and development expenses
Table III-14 presents capital expenditures and research and development (“R&D”) expenses by firm. Table III-14 MLWF: Capital expenditures and research and development (R&D) expenses of U.S. producers, 2011-16, January-June 2016, and January-June 2017
* * * * * *
Total capital expenditures increased irregularly during 2011-14, which in part reflects
new entrants, as well as capacity expansions/additions.44 In 2014, the large increase in total capital expenditures, to its highest level of the period, primarily reflects capital expenditures reported by ***.45 In 2015-16, the level of the U.S. industry’s capital expenditures declined
43 See footnote 28 regarding the decline in *** gross profit during 2014-16. *** operational results were also impacted by an increase in assigned SG&A expenses (see footnote 30). In addition to operational issues, which affected *** gross profit during 2014-16, the company noted ***. August 29, 2017 e-mail with attachment from *** to USITC auditor.
44 ***. August 30, 2017 e-mail with attachment from *** to USITC auditor. ***. August 23, 2017 e-mail with attachments from *** to USITC auditor. ***. August 23, 2017 e-mail with attachments from *** to USITC auditor. 45 ***. August 29, 2017 e-mail with attachment from *** to USITC auditor. ***. September 1, 2017 e-mail with attachment from *** to USITC auditor. ***. August 29, 2017 e-mail with attachment from *** to USITC auditor. ***. *** U.S. producer questionnaire response to III-13 (note 1). ***. *** U.S. producer questionnaire response to III-13 (note 1). ***. *** U.S. producer questionnaire response to III-13 (note 1).
III-18
and then was higher in interim 2017 compared to interim 2016, which primarily reflects capital expenditures reported by ***. Total R&D expenses fluctuated somewhat but remained within a relatively narrow range throughout the period (see table III-14). With the exception of the small amount of R&D expenses reported by *** in 2016,46 R&D expenses were limited to *** producers.47
Assets and return on investment
Table III-15 presents data on the U.S. producers’ MLWF total assets, asset turnover (sales divided by total assets), and return on assets, respectively.48
Table III-15 MLWF: U.S. producers’ total assets, asset turnover, and return on assets, 2011-16
* * * * * *
46 ***. August 31, 2017 e-mail with attachments from *** to USITC auditor. 47 ***. September 1, 2017 e-mail with attachment from *** to USITC auditor. ***. *** U.S.
producer questionnaire response to III-13 (note 2). ***. *** U.S. producer questionnaire response to III-13 (note 2). ***. August 29, 2017 e-mail with attachment from *** to USITC auditor.
48 With respect to a company’s overall operations, staff notes that a total asset value (i.e., the bottom line value on the asset side of a company’s balance sheet) reflects an aggregation of a number of assets, which are not necessarily product specific. The ability to assign total asset values to a discrete product line affects the accuracy of calculated asset turnover and corresponding product-specific return on assets.
IV-1
PART IV: U.S. IMPORTS AND THE FOREIGN INDUSTRIES
U.S. IMPORTS
Overview
The Commission issued questionnaires to 100 firms believed to import MLWF since 2011. Forty-eight firms provided data and information in response to the questionnaires, while 28 firms indicated that they had not imported MLWF during the period for which data were collected.1 Questionnaire data from the responding 48 importers are believed to account for the majority of subject imports in 2016.2
MLWF may be imported under five different HTS subheadings, some of which overlap with subheadings under which hardwood plywood may also be imported. As a result, and in light of the data coverage by the Commission’s questionnaires, import data in this report are based on questionnaire responses for MLWF.3
Chinese producers and exporters Layo Wood and Yuhua Timber received de minimis margins in Commerce’s antidumping and countervailing duty orders, and as a result, both firms’ exports are excluded from the orders.4 Accordingly, importers were asked to report imports
1 Of the 65 responding importers in the original investigations, six firms, which accounted for *** percent of imports from China and *** percent of total imports in 2010, certified that they have not imported MLWF since 2011. ***. The remaining 18 firms, which accounted for *** percent of imports from China and *** percent of total imports in 2010, could not be contacted or have not responded to the Commission’s requests for information. Investigation Nos. 701-TA-476 and 731-TA-1179 (Final): Multilayered Wood Flooring from China—Staff Report, INV-JJ-105, October 27, 2011, Table IV-1.
2 In the original investigations, 65 responding U.S. importers reported importing 149 million square feet of MLWF from China and 47 million square feet of MLWF from all other sources. Multilayered Wood Flooring from China, Inv. Nos. 701-TA-476 and 731-TA-1179 (Final), USITC Publication 4278, November 2011, p. IV-1, fn. 1 and table IV-2. In these first five-year reviews, 48 responding U.S. importers accounted for 156 million square feet of subject MLWF from China, 75 million square feet of nonsubject MLWF from China, and 49 million square feet of MLWF from all other sources.
In addition, an analysis of *** using the five six-digit subheadings under which MLWF may have been imported determined that dutied imports of MLWF from China in 2015, the first full year in which Commerce’s duty orders excluding Layo Wood were in effect, totaled $***, compared to $342 million of subject imports reported by responding importers.
3 Questionnaire data are not supplemented by ***, as proposed by Alliance respondents, due to a lack of comparability between the two data sources. Alliance prehearing brief, p. 28, fn. 1 and exh. CT-5. While certain HTS numbers contain predominantly MLWF, they may still include out-of-scope merchandise, including two-ply wood flooring. In addition, data prior to 2014 may include exports by Layo Wood as subject merchandise because the company had not yet been excluded from the antidumping duty order.
4 For more information, see “The original investigations” section in Part I of this report.
IV-2
from these firms separately from all other imports from China, as imports originating from Layo Wood and Yuhua Timber are considered to be nonsubject merchandise.
Imports from subject and nonsubject countries
Table IV-1 and figure IV-1 present information on U.S. imports of subject MLWF from China, nonsubject MLWF from China, and MLWF from all other sources. Imports from each source increased from 2011 to 2016, with subject imports from China growing by approximately 55 percent, nonsubject imports from China nearly quadrupling, and imports from all other sources growing by nearly 30 percent.5 The increase in subject imports from China occurred during a period of time in which a number of de minimis findings were made by Commerce in its administrative reviews on the antidumping and countervailing duty orders.6 Unit values of subject imports from China and imports from all other sources were similar and fluctuated from 2011 to 2016, while unit values for nonsubject imports from China were approximately 20 percent lower than prices from the aforementioned sources, and ranged from $1.77 per square foot in 2011 to $1.89 per square foot in 2015. Subject imports from China made up the majority of total imports of MLWF, by both quantity and value, from 2011 to 2016. Imports from each source and all sources combined as a ratio to U.S. production increased from 2011 to 2016, with the exception of imports from all other sources, which fluctuated over the period.
5 Firms reported importing MWLF from 15 other nonsubject sources. The top non-Chinese sources were Vietnam and Cambodia, followed by Indonesia, Brazil, Taiwan, and Canada.
6 For more information, see the “Administrative reviews” section in Part I of this report.
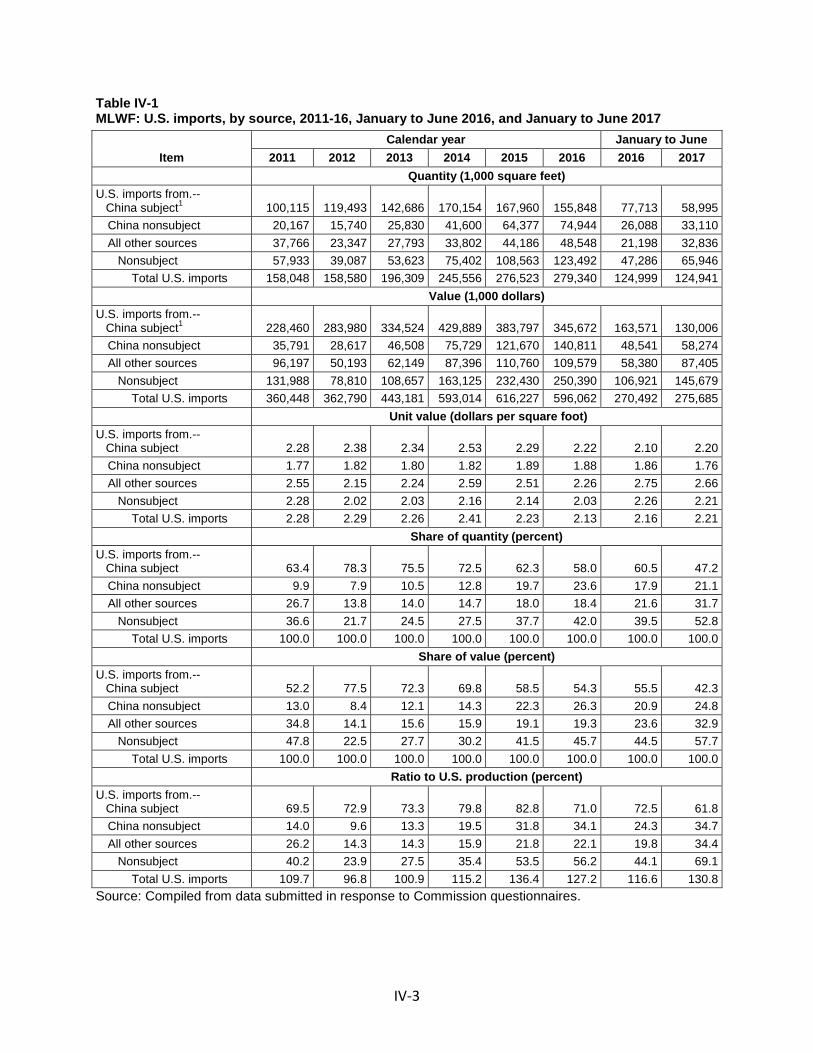
IV-3
Table IV-1 MLWF: U.S. imports, by source, 2011-16, January to June 2016, and January to June 2017
Item Calendar year January to June
2011 2012 2013 2014 2015 2016 2016 2017 Quantity (1,000 square feet) U.S. imports from.-- China subject1 100,115 119,493 142,686 170,154 167,960 155,848 77,713 58,995
China nonsubject 20,167 15,740 25,830 41,600 64,377 74,944 26,088 33,110 All other sources 37,766 23,347 27,793 33,802 44,186 48,548 21,198 32,836 Nonsubject 57,933 39,087 53,623 75,402 108,563 123,492 47,286 65,946
Total U.S. imports 158,048 158,580 196,309 245,556 276,523 279,340 124,999 124,941 Value (1,000 dollars) U.S. imports from.-- China subject1 228,460 283,980 334,524 429,889 383,797 345,672 163,571 130,006
China nonsubject 35,791 28,617 46,508 75,729 121,670 140,811 48,541 58,274 All other sources 96,197 50,193 62,149 87,396 110,760 109,579 58,380 87,405 Nonsubject 131,988 78,810 108,657 163,125 232,430 250,390 106,921 145,679
Total U.S. imports 360,448 362,790 443,181 593,014 616,227 596,062 270,492 275,685 Unit value (dollars per square foot) U.S. imports from.-- China subject 2.28 2.38 2.34 2.53 2.29 2.22 2.10 2.20
China nonsubject 1.77 1.82 1.80 1.82 1.89 1.88 1.86 1.76 All other sources 2.55 2.15 2.24 2.59 2.51 2.26 2.75 2.66 Nonsubject 2.28 2.02 2.03 2.16 2.14 2.03 2.26 2.21
Total U.S. imports 2.28 2.29 2.26 2.41 2.23 2.13 2.16 2.21 Share of quantity (percent) U.S. imports from.-- China subject 63.4 78.3 75.5 72.5 62.3 58.0 60.5 47.2
China nonsubject 9.9 7.9 10.5 12.8 19.7 23.6 17.9 21.1 All other sources 26.7 13.8 14.0 14.7 18.0 18.4 21.6 31.7 Nonsubject 36.6 21.7 24.5 27.5 37.7 42.0 39.5 52.8
Total U.S. imports 100.0 100.0 100.0 100.0 100.0 100.0 100.0 100.0 Share of value (percent) U.S. imports from.-- China subject 52.2 77.5 72.3 69.8 58.5 54.3 55.5 42.3
China nonsubject 13.0 8.4 12.1 14.3 22.3 26.3 20.9 24.8 All other sources 34.8 14.1 15.6 15.9 19.1 19.3 23.6 32.9 Nonsubject 47.8 22.5 27.7 30.2 41.5 45.7 44.5 57.7
Total U.S. imports 100.0 100.0 100.0 100.0 100.0 100.0 100.0 100.0 Ratio to U.S. production (percent) U.S. imports from.-- China subject 69.5 72.9 73.3 79.8 82.8 71.0 72.5 61.8
China nonsubject 14.0 9.6 13.3 19.5 31.8 34.1 24.3 34.7 All other sources 26.2 14.3 14.3 15.9 21.8 22.1 19.8 34.4 Nonsubject 40.2 23.9 27.5 35.4 53.5 56.2 44.1 69.1
Total U.S. imports 109.7 96.8 100.9 115.2 136.4 127.2 116.6 130.8 Source: Compiled from data submitted in response to Commission questionnaires.
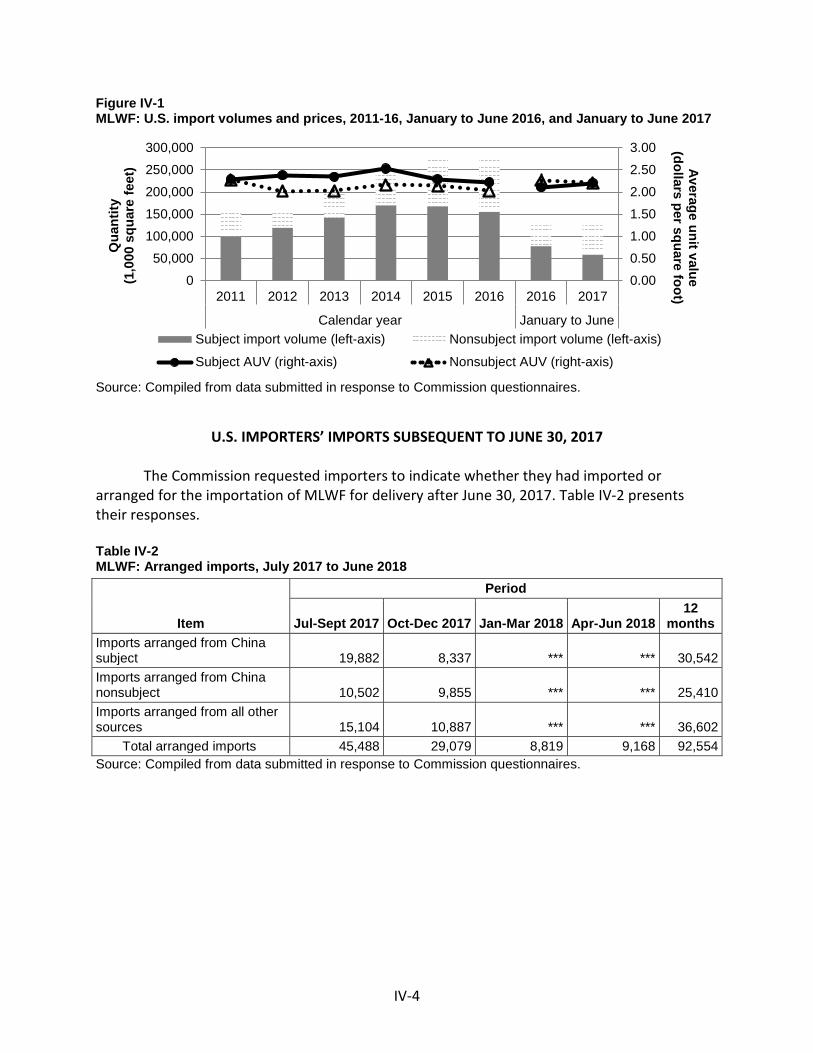
IV-4
Figure IV-1 MLWF: U.S. import volumes and prices, 2011-16, January to June 2016, and January to June 2017
Source: Compiled from data submitted in response to Commission questionnaires.
U.S. IMPORTERS’ IMPORTS SUBSEQUENT TO JUNE 30, 2017
The Commission requested importers to indicate whether they had imported or arranged for the importation of MLWF for delivery after June 30, 2017. Table IV-2 presents their responses.
Table IV-2 MLWF: Arranged imports, July 2017 to June 2018
Item
Period
Jul-Sept 2017 Oct-Dec 2017 Jan-Mar 2018 Apr-Jun 2018 12
months Imports arranged from China subject 19,882 8,337 *** *** 30,542 Imports arranged from China nonsubject 10,502 9,855 *** *** 25,410 Imports arranged from all other sources 15,104 10,887 *** *** 36,602
Total arranged imports 45,488 29,079 8,819 9,168 92,554 Source: Compiled from data submitted in response to Commission questionnaires.
0.00
0.50
1.00
1.50
2.00
2.50
3.00
0
50,000
100,000
150,000
200,000
250,000
300,000
2011 2012 2013 2014 2015 2016 2016 2017
Calendar year January to June
Average unit value (dollars per square foot)
Qua
ntity
(1
,000
squ
are
feet
)
Subject import volume (left-axis) Nonsubject import volume (left-axis)
Subject AUV (right-axis) Nonsubject AUV (right-axis)
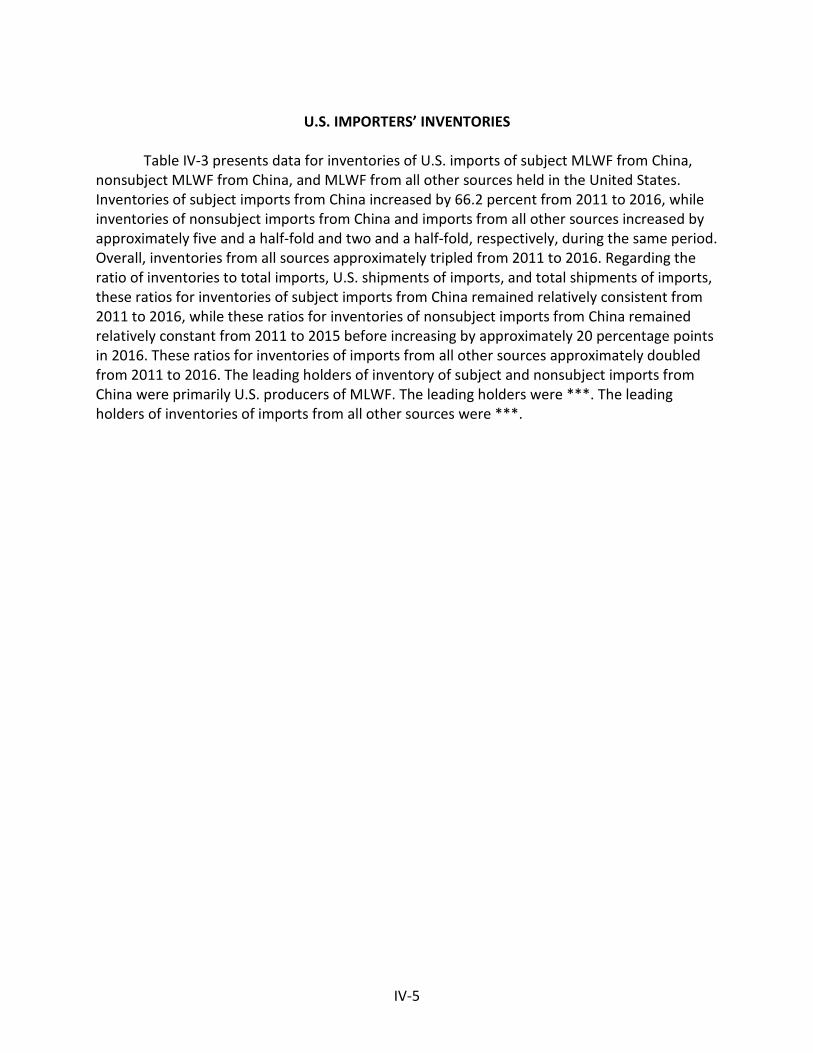
IV-5
U.S. IMPORTERS’ INVENTORIES
Table IV-3 presents data for inventories of U.S. imports of subject MLWF from China, nonsubject MLWF from China, and MLWF from all other sources held in the United States. Inventories of subject imports from China increased by 66.2 percent from 2011 to 2016, while inventories of nonsubject imports from China and imports from all other sources increased by approximately five and a half-fold and two and a half-fold, respectively, during the same period. Overall, inventories from all sources approximately tripled from 2011 to 2016. Regarding the ratio of inventories to total imports, U.S. shipments of imports, and total shipments of imports, these ratios for inventories of subject imports from China remained relatively consistent from 2011 to 2016, while these ratios for inventories of nonsubject imports from China remained relatively constant from 2011 to 2015 before increasing by approximately 20 percentage points in 2016. These ratios for inventories of imports from all other sources approximately doubled from 2011 to 2016. The leading holders of inventory of subject and nonsubject imports from China were primarily U.S. producers of MLWF. The leading holders were ***. The leading holders of inventories of imports from all other sources were ***.
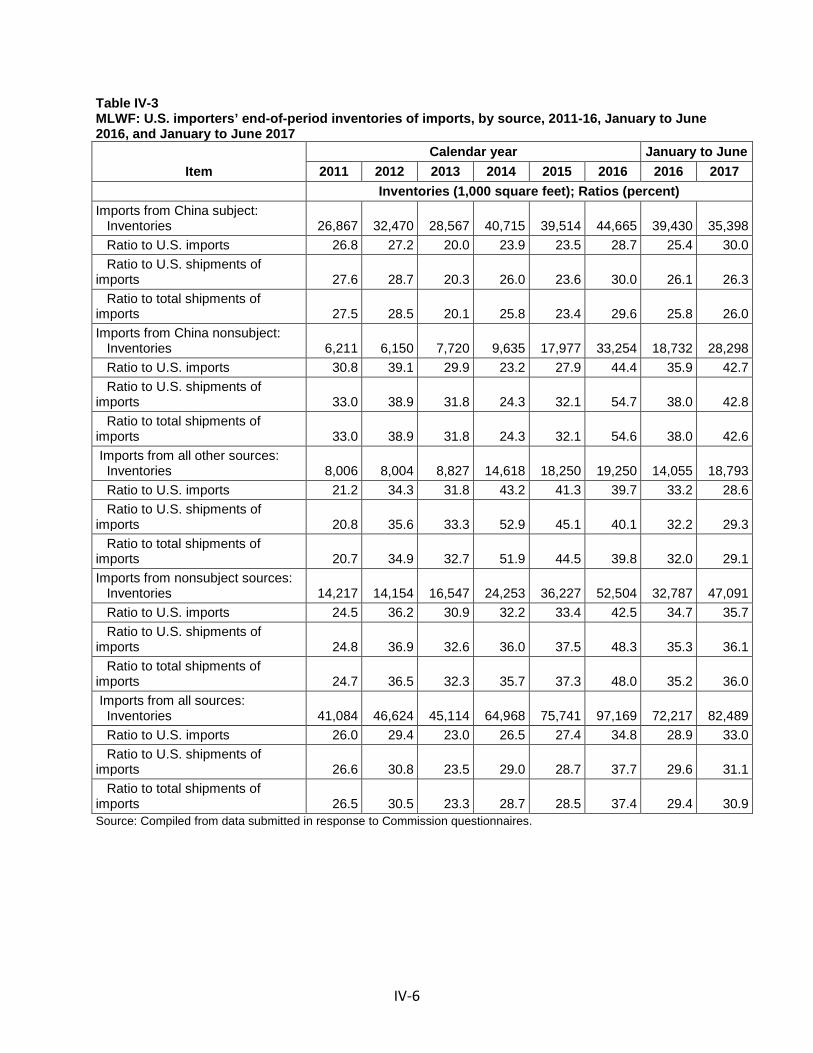
IV-6
Table IV-3 MLWF: U.S. importers’ end-of-period inventories of imports, by source, 2011-16, January to June 2016, and January to June 2017
Item Calendar year January to June
2011 2012 2013 2014 2015 2016 2016 2017 Inventories (1,000 square feet); Ratios (percent) Imports from China subject: Inventories 26,867 32,470 28,567 40,715 39,514 44,665 39,430 35,398 Ratio to U.S. imports 26.8 27.2 20.0 23.9 23.5 28.7 25.4 30.0 Ratio to U.S. shipments of imports 27.6 28.7 20.3 26.0 23.6 30.0 26.1 26.3 Ratio to total shipments of imports 27.5 28.5 20.1 25.8 23.4 29.6 25.8 26.0 Imports from China nonsubject: Inventories 6,211 6,150 7,720 9,635 17,977 33,254 18,732 28,298 Ratio to U.S. imports 30.8 39.1 29.9 23.2 27.9 44.4 35.9 42.7 Ratio to U.S. shipments of imports 33.0 38.9 31.8 24.3 32.1 54.7 38.0 42.8 Ratio to total shipments of imports 33.0 38.9 31.8 24.3 32.1 54.6 38.0 42.6 Imports from all other sources: Inventories 8,006 8,004 8,827 14,618 18,250 19,250 14,055 18,793 Ratio to U.S. imports 21.2 34.3 31.8 43.2 41.3 39.7 33.2 28.6 Ratio to U.S. shipments of imports 20.8 35.6 33.3 52.9 45.1 40.1 32.2 29.3 Ratio to total shipments of imports 20.7 34.9 32.7 51.9 44.5 39.8 32.0 29.1 Imports from nonsubject sources: Inventories 14,217 14,154 16,547 24,253 36,227 52,504 32,787 47,091 Ratio to U.S. imports 24.5 36.2 30.9 32.2 33.4 42.5 34.7 35.7 Ratio to U.S. shipments of imports 24.8 36.9 32.6 36.0 37.5 48.3 35.3 36.1 Ratio to total shipments of imports 24.7 36.5 32.3 35.7 37.3 48.0 35.2 36.0 Imports from all sources: Inventories 41,084 46,624 45,114 64,968 75,741 97,169 72,217 82,489 Ratio to U.S. imports 26.0 29.4 23.0 26.5 27.4 34.8 28.9 33.0 Ratio to U.S. shipments of imports 26.6 30.8 23.5 29.0 28.7 37.7 29.6 31.1 Ratio to total shipments of imports 26.5 30.5 23.3 28.7 28.5 37.4 29.4 30.9 Source: Compiled from data submitted in response to Commission questionnaires.
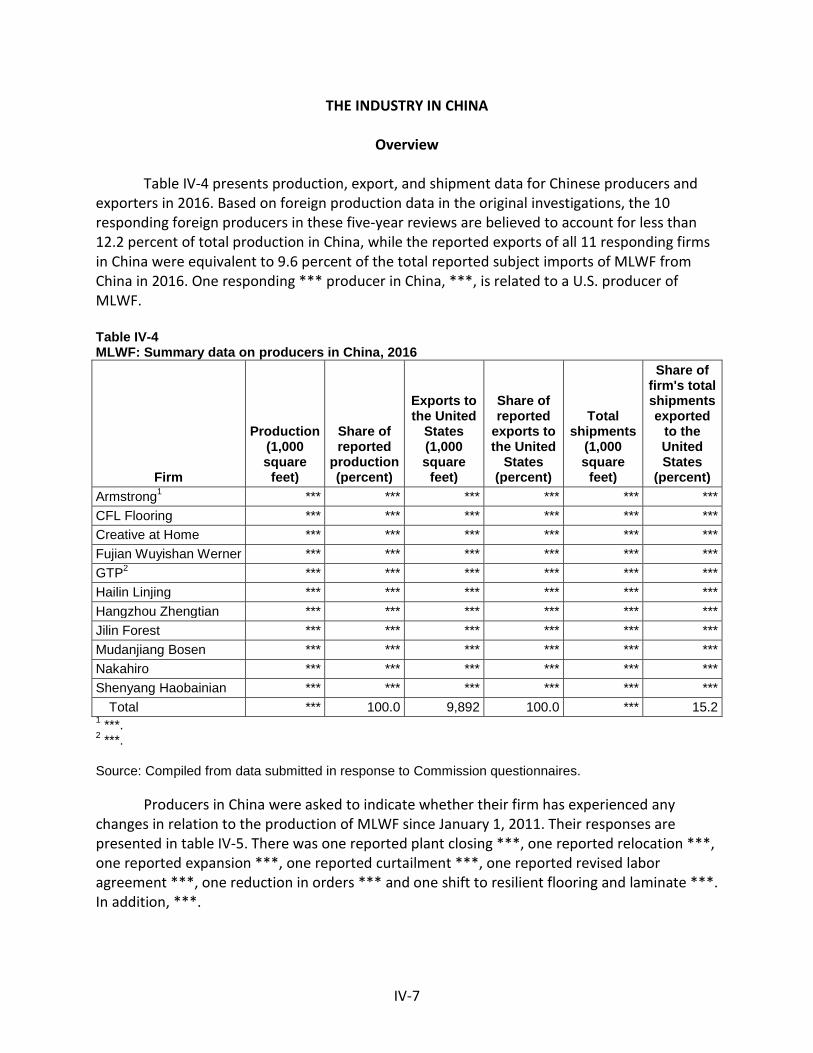
IV-7
THE INDUSTRY IN CHINA
Overview
Table IV-4 presents production, export, and shipment data for Chinese producers and exporters in 2016. Based on foreign production data in the original investigations, the 10 responding foreign producers in these five-year reviews are believed to account for less than 12.2 percent of total production in China, while the reported exports of all 11 responding firms in China were equivalent to 9.6 percent of the total reported subject imports of MLWF from China in 2016. One responding *** producer in China, ***, is related to a U.S. producer of MLWF.
Table IV-4 MLWF: Summary data on producers in China, 2016
Firm
Production (1,000 square
feet)
Share of reported
production (percent)
Exports to the United
States (1,000 square
feet)
Share of reported
exports to the United
States (percent)
Total shipments
(1,000 square
feet)
Share of firm's total shipments exported
to the United States
(percent) Armstrong1 *** *** *** *** *** *** CFL Flooring *** *** *** *** *** *** Creative at Home *** *** *** *** *** *** Fujian Wuyishan Werner *** *** *** *** *** *** GTP2 *** *** *** *** *** *** Hailin Linjing *** *** *** *** *** *** Hangzhou Zhengtian *** *** *** *** *** *** Jilin Forest *** *** *** *** *** *** Mudanjiang Bosen *** *** *** *** *** *** Nakahiro *** *** *** *** *** *** Shenyang Haobainian *** *** *** *** *** ***
Total *** 100.0 9,892 100.0 *** 15.2 1 ***. 2 ***. Source: Compiled from data submitted in response to Commission questionnaires.
Producers in China were asked to indicate whether their firm has experienced any changes in relation to the production of MLWF since January 1, 2011. Their responses are presented in table IV-5. There was one reported plant closing ***, one reported relocation ***, one reported expansion ***, one reported curtailment ***, one reported revised labor agreement ***, one reduction in orders *** and one shift to resilient flooring and laminate ***. In addition, ***.
IV-8
Table IV-5 MLWF: Reported changes in operations by firms in China, since January 1, 2011
* * * * * * *
Operations on MLWF
Table IV-6 presents aggregate production, capacity, shipments, and inventory data for responding firms in China. *** comprised the vast majority of reported capacity and production through 2014. ***. Reported production capacity in China increased by 24.3 percent from 2011 to 2014, before decreasing by *** percent from 2014 to 2015 and remaining relatively constant thereafter. Reported production of MLWF increased by 50.7 percent from 2011 to 2014, before decreasing by *** percent from 2014 to 2015 and increasing by *** percent from 2015 to 2016. Reported capacity utilization ranged from 54.4 percent in 2011 to *** percent in 2016. Reported exports to the United States fluctuated slightly 2011 to 2014 before decreasing by *** percent from 2014 to 2015. As a share of total reported shipments, exports to the United States represented approximately *** percent until dropping by ***. This decrease ***.7 Reported exports to all markets as a share of total shipments ranged from *** to *** percent from 2011 to 2016. During this same period, the average unit value of reported exports to the United States was lower than all other types of shipments, with the exception of internal consumption. Reported end-of-period inventories fluctuated from 2011 to 2016, equaling approximately 10 percent of total reported production and total reported shipments in each year.
7 The European Union was the top reported export market for firms in China. Other reported export markets included Canada, Mexico, South Africa, and countries in East Asia, Southeast Asia, and the Middle East.
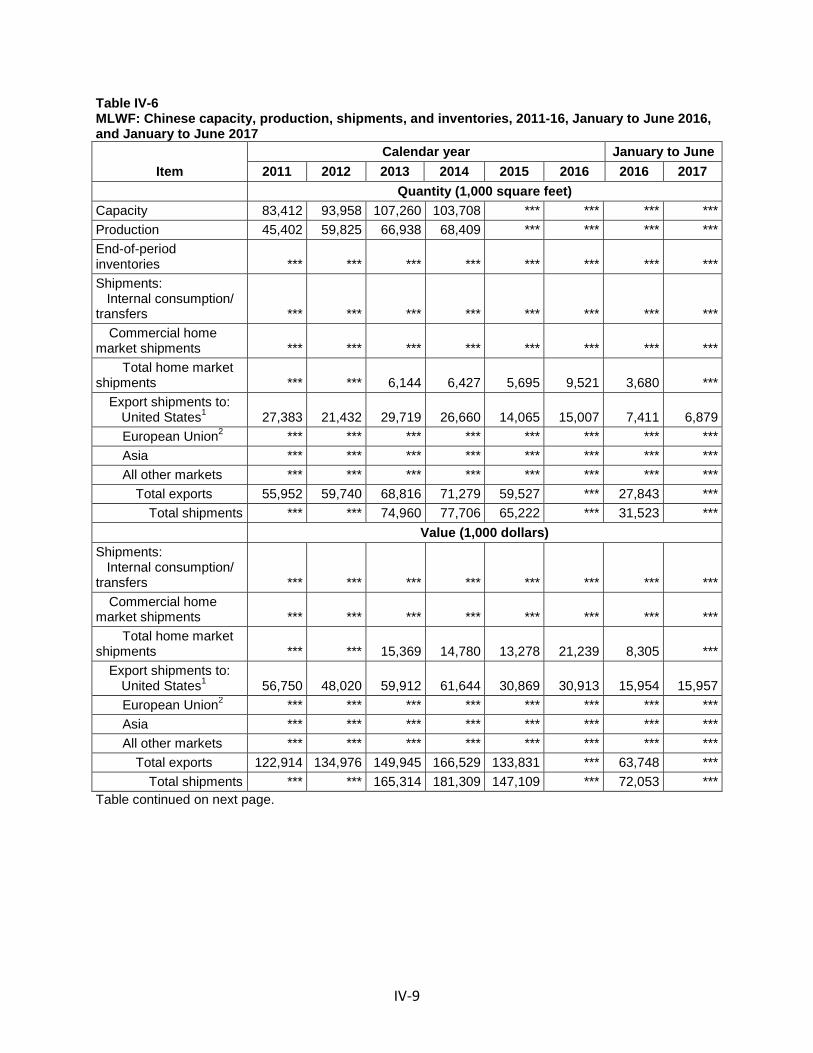
IV-9
Table IV-6 MLWF: Chinese capacity, production, shipments, and inventories, 2011-16, January to June 2016, and January to June 2017
Item Calendar year January to June
2011 2012 2013 2014 2015 2016 2016 2017 Quantity (1,000 square feet) Capacity 83,412 93,958 107,260 103,708 *** *** *** *** Production 45,402 59,825 66,938 68,409 *** *** *** *** End-of-period inventories *** *** *** *** *** *** *** *** Shipments: Internal consumption/ transfers *** *** *** *** *** *** *** ***
Commercial home market shipments *** *** *** *** *** *** *** ***
Total home market shipments *** *** 6,144 6,427 5,695 9,521 3,680 ***
Export shipments to: United States1 27,383 21,432 29,719 26,660 14,065 15,007 7,411 6,879
European Union2 *** *** *** *** *** *** *** *** Asia *** *** *** *** *** *** *** *** All other markets *** *** *** *** *** *** *** ***
Total exports 55,952 59,740 68,816 71,279 59,527 *** 27,843 *** Total shipments *** *** 74,960 77,706 65,222 *** 31,523 ***
Value (1,000 dollars) Shipments: Internal consumption/ transfers *** *** *** *** *** *** *** ***
Commercial home market shipments *** *** *** *** *** *** *** ***
Total home market shipments *** *** 15,369 14,780 13,278 21,239 8,305 ***
Export shipments to: United States1 56,750 48,020 59,912 61,644 30,869 30,913 15,954 15,957
European Union2 *** *** *** *** *** *** *** *** Asia *** *** *** *** *** *** *** *** All other markets *** *** *** *** *** *** *** ***
Total exports 122,914 134,976 149,945 166,529 133,831 *** 63,748 *** Total shipments *** *** 165,314 181,309 147,109 *** 72,053 ***
Table continued on next page.
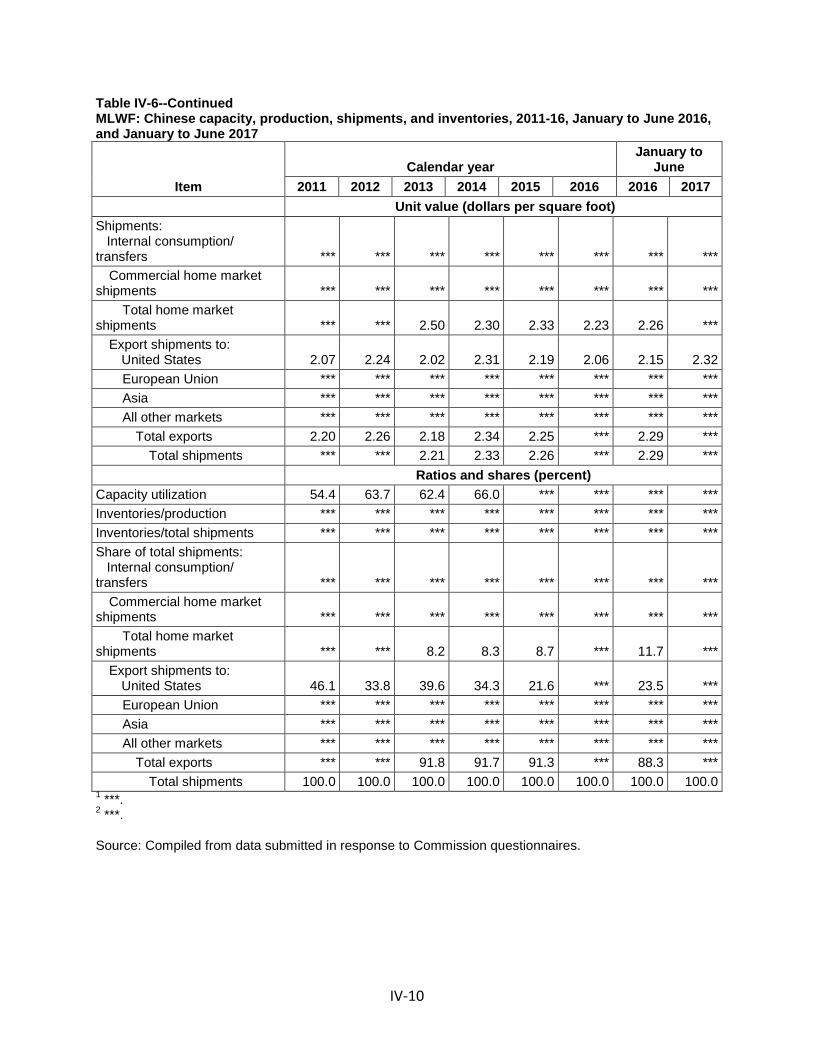
IV-10
Table IV-6--Continued MLWF: Chinese capacity, production, shipments, and inventories, 2011-16, January to June 2016, and January to June 2017
Item Calendar year
January to June
2011 2012 2013 2014 2015 2016 2016 2017 Unit value (dollars per square foot) Shipments: Internal consumption/ transfers *** *** *** *** *** *** *** ***
Commercial home market shipments *** *** *** *** *** *** *** ***
Total home market shipments *** *** 2.50 2.30 2.33 2.23 2.26 ***
Export shipments to: United States 2.07 2.24 2.02 2.31 2.19 2.06 2.15 2.32
European Union *** *** *** *** *** *** *** *** Asia *** *** *** *** *** *** *** *** All other markets *** *** *** *** *** *** *** ***
Total exports 2.20 2.26 2.18 2.34 2.25 *** 2.29 *** Total shipments *** *** 2.21 2.33 2.26 *** 2.29 ***
Ratios and shares (percent) Capacity utilization 54.4 63.7 62.4 66.0 *** *** *** *** Inventories/production *** *** *** *** *** *** *** *** Inventories/total shipments *** *** *** *** *** *** *** *** Share of total shipments: Internal consumption/ transfers *** *** *** *** *** *** *** ***
Commercial home market shipments *** *** *** *** *** *** *** ***
Total home market shipments *** *** 8.2 8.3 8.7 *** 11.7 ***
Export shipments to: United States 46.1 33.8 39.6 34.3 21.6 *** 23.5 ***
European Union *** *** *** *** *** *** *** *** Asia *** *** *** *** *** *** *** *** All other markets *** *** *** *** *** *** *** ***
Total exports *** *** 91.8 91.7 91.3 *** 88.3 *** Total shipments 100.0 100.0 100.0 100.0 100.0 100.0 100.0 100.0
1 ***. 2 ***. Source: Compiled from data submitted in response to Commission questionnaires.
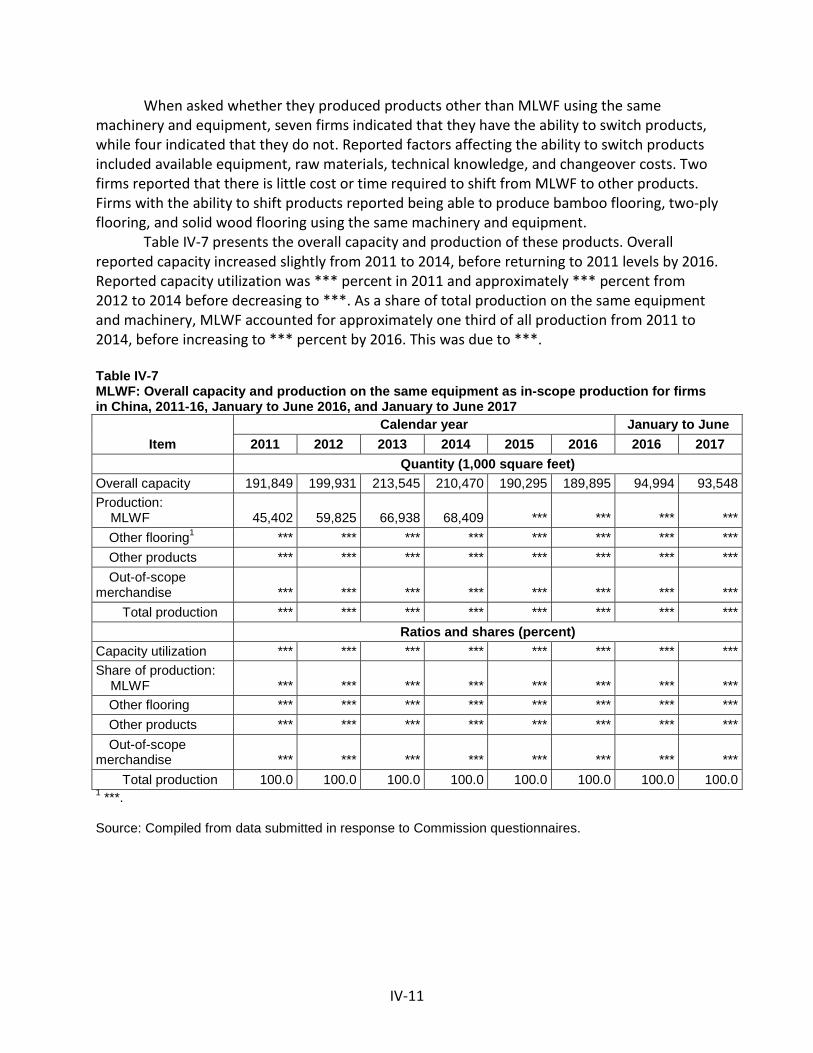
IV-11
When asked whether they produced products other than MLWF using the same machinery and equipment, seven firms indicated that they have the ability to switch products, while four indicated that they do not. Reported factors affecting the ability to switch products included available equipment, raw materials, technical knowledge, and changeover costs. Two firms reported that there is little cost or time required to shift from MLWF to other products. Firms with the ability to shift products reported being able to produce bamboo flooring, two-ply flooring, and solid wood flooring using the same machinery and equipment.
Table IV-7 presents the overall capacity and production of these products. Overall reported capacity increased slightly from 2011 to 2014, before returning to 2011 levels by 2016. Reported capacity utilization was *** percent in 2011 and approximately *** percent from 2012 to 2014 before decreasing to ***. As a share of total production on the same equipment and machinery, MLWF accounted for approximately one third of all production from 2011 to 2014, before increasing to *** percent by 2016. This was due to ***.
Table IV-7 MLWF: Overall capacity and production on the same equipment as in-scope production for firms in China, 2011-16, January to June 2016, and January to June 2017
Item Calendar year January to June
2011 2012 2013 2014 2015 2016 2016 2017 Quantity (1,000 square feet) Overall capacity 191,849 199,931 213,545 210,470 190,295 189,895 94,994 93,548 Production: MLWF 45,402 59,825 66,938 68,409 *** *** *** ***
Other flooring1 *** *** *** *** *** *** *** *** Other products *** *** *** *** *** *** *** *** Out-of-scope
merchandise *** *** *** *** *** *** *** *** Total production *** *** *** *** *** *** *** ***
Ratios and shares (percent) Capacity utilization *** *** *** *** *** *** *** *** Share of production: MLWF *** *** *** *** *** *** *** ***
Other flooring *** *** *** *** *** *** *** *** Other products *** *** *** *** *** *** *** *** Out-of-scope
merchandise *** *** *** *** *** *** *** *** Total production 100.0 100.0 100.0 100.0 100.0 100.0 100.0 100.0
1 ***. Source: Compiled from data submitted in response to Commission questionnaires.
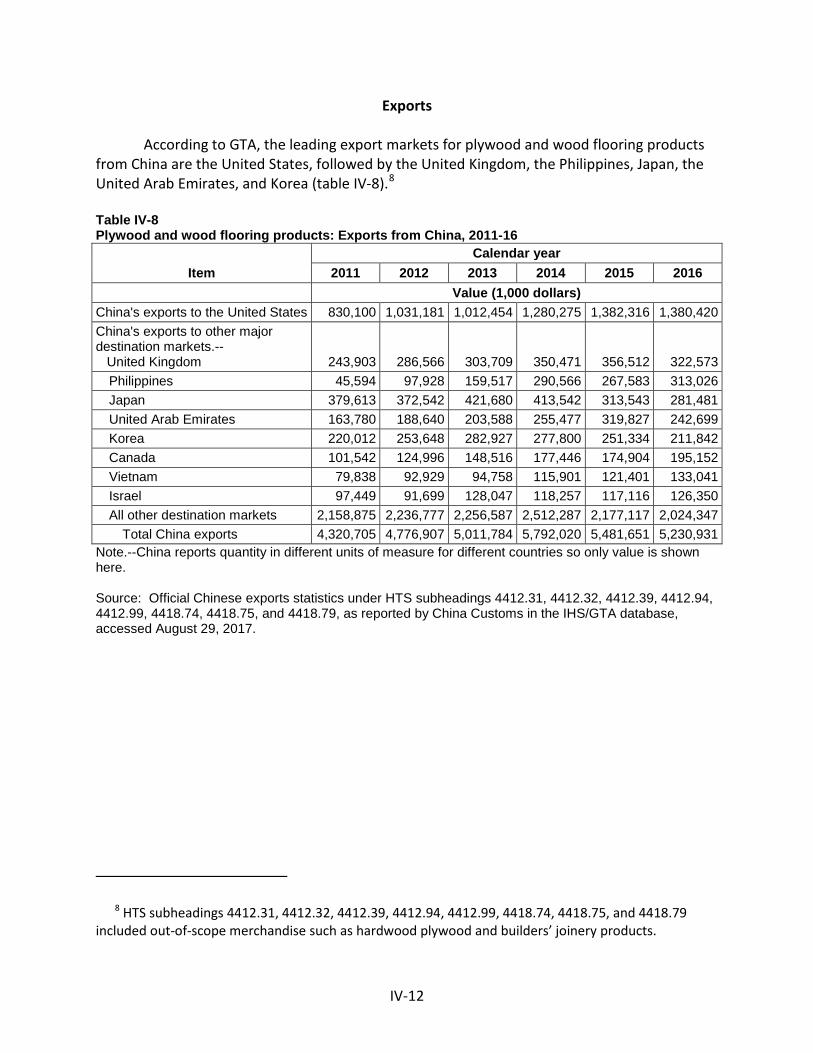
IV-12
Exports
According to GTA, the leading export markets for plywood and wood flooring products from China are the United States, followed by the United Kingdom, the Philippines, Japan, the United Arab Emirates, and Korea (table IV-8).8
Table IV-8 Plywood and wood flooring products: Exports from China, 2011-16
Item Calendar year
2011 2012 2013 2014 2015 2016 Value (1,000 dollars) China's exports to the United States 830,100 1,031,181 1,012,454 1,280,275 1,382,316 1,380,420 China's exports to other major destination markets.-- United Kingdom 243,903 286,566 303,709 350,471 356,512 322,573
Philippines 45,594 97,928 159,517 290,566 267,583 313,026 Japan 379,613 372,542 421,680 413,542 313,543 281,481 United Arab Emirates 163,780 188,640 203,588 255,477 319,827 242,699 Korea 220,012 253,648 282,927 277,800 251,334 211,842 Canada 101,542 124,996 148,516 177,446 174,904 195,152 Vietnam 79,838 92,929 94,758 115,901 121,401 133,041 Israel 97,449 91,699 128,047 118,257 117,116 126,350 All other destination markets 2,158,875 2,236,777 2,256,587 2,512,287 2,177,117 2,024,347
Total China exports 4,320,705 4,776,907 5,011,784 5,792,020 5,481,651 5,230,931 Note.--China reports quantity in different units of measure for different countries so only value is shown here. Source: Official Chinese exports statistics under HTS subheadings 4412.31, 4412.32, 4412.39, 4412.94, 4412.99, 4418.74, 4418.75, and 4418.79, as reported by China Customs in the IHS/GTA database, accessed August 29, 2017.
8 HTS subheadings 4412.31, 4412.32, 4412.39, 4412.94, 4412.99, 4418.74, 4418.75, and 4418.79 included out-of-scope merchandise such as hardwood plywood and builders’ joinery products.
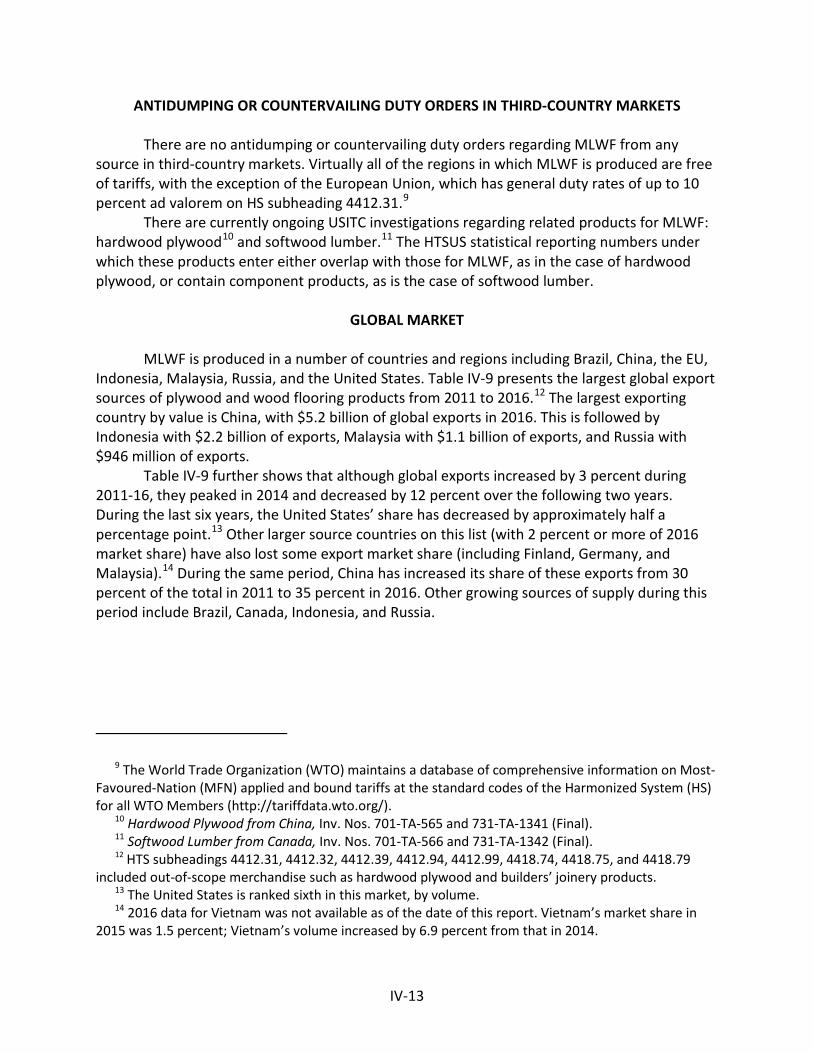
IV-13
ANTIDUMPING OR COUNTERVAILING DUTY ORDERS IN THIRD-COUNTRY MARKETS
There are no antidumping or countervailing duty orders regarding MLWF from any source in third-country markets. Virtually all of the regions in which MLWF is produced are free of tariffs, with the exception of the European Union, which has general duty rates of up to 10 percent ad valorem on HS subheading 4412.31.9
There are currently ongoing USITC investigations regarding related products for MLWF: hardwood plywood10 and softwood lumber.11 The HTSUS statistical reporting numbers under which these products enter either overlap with those for MLWF, as in the case of hardwood plywood, or contain component products, as is the case of softwood lumber.
GLOBAL MARKET
MLWF is produced in a number of countries and regions including Brazil, China, the EU,
Indonesia, Malaysia, Russia, and the United States. Table IV-9 presents the largest global export sources of plywood and wood flooring products from 2011 to 2016.12 The largest exporting country by value is China, with $5.2 billion of global exports in 2016. This is followed by Indonesia with $2.2 billion of exports, Malaysia with $1.1 billion of exports, and Russia with $946 million of exports.
Table IV-9 further shows that although global exports increased by 3 percent during 2011-16, they peaked in 2014 and decreased by 12 percent over the following two years. During the last six years, the United States’ share has decreased by approximately half a percentage point.13 Other larger source countries on this list (with 2 percent or more of 2016 market share) have also lost some export market share (including Finland, Germany, and Malaysia).14 During the same period, China has increased its share of these exports from 30 percent of the total in 2011 to 35 percent in 2016. Other growing sources of supply during this period include Brazil, Canada, Indonesia, and Russia.
9 The World Trade Organization (WTO) maintains a database of comprehensive information on Most-Favoured-Nation (MFN) applied and bound tariffs at the standard codes of the Harmonized System (HS) for all WTO Members (http://tariffdata.wto.org/).
10 Hardwood Plywood from China, Inv. Nos. 701-TA-565 and 731-TA-1341 (Final). 11 Softwood Lumber from Canada, Inv. Nos. 701-TA-566 and 731-TA-1342 (Final). 12 HTS subheadings 4412.31, 4412.32, 4412.39, 4412.94, 4412.99, 4418.74, 4418.75, and 4418.79
included out-of-scope merchandise such as hardwood plywood and builders’ joinery products. 13 The United States is ranked sixth in this market, by volume. 14 2016 data for Vietnam was not available as of the date of this report. Vietnam’s market share in
2015 was 1.5 percent; Vietnam’s volume increased by 6.9 percent from that in 2014.
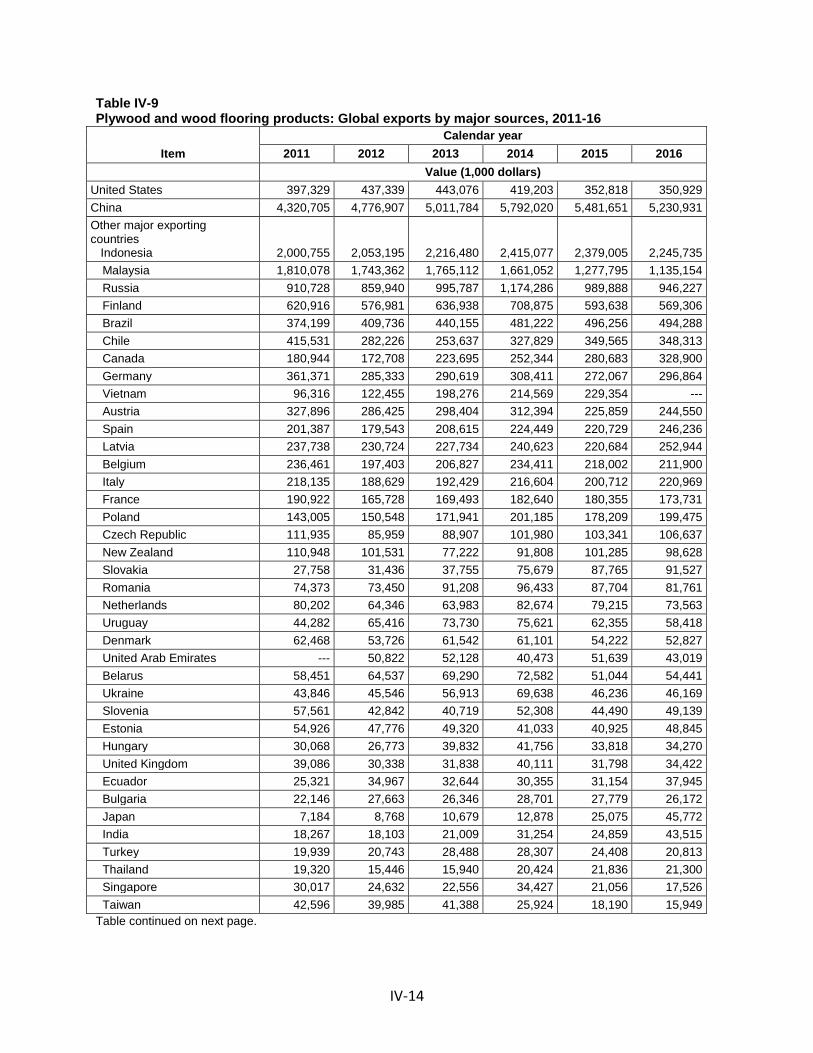
IV-14
Table IV-9 Plywood and wood flooring products: Global exports by major sources, 2011-16
Item Calendar year
2011 2012 2013 2014 2015 2016 Value (1,000 dollars) United States 397,329 437,339 443,076 419,203 352,818 350,929 China 4,320,705 4,776,907 5,011,784 5,792,020 5,481,651 5,230,931 Other major exporting countries Indonesia 2,000,755 2,053,195 2,216,480 2,415,077 2,379,005 2,245,735
Malaysia 1,810,078 1,743,362 1,765,112 1,661,052 1,277,795 1,135,154 Russia 910,728 859,940 995,787 1,174,286 989,888 946,227 Finland 620,916 576,981 636,938 708,875 593,638 569,306 Brazil 374,199 409,736 440,155 481,222 496,256 494,288 Chile 415,531 282,226 253,637 327,829 349,565 348,313 Canada 180,944 172,708 223,695 252,344 280,683 328,900 Germany 361,371 285,333 290,619 308,411 272,067 296,864 Vietnam 96,316 122,455 198,276 214,569 229,354 --- Austria 327,896 286,425 298,404 312,394 225,859 244,550 Spain 201,387 179,543 208,615 224,449 220,729 246,236 Latvia 237,738 230,724 227,734 240,623 220,684 252,944 Belgium 236,461 197,403 206,827 234,411 218,002 211,900 Italy 218,135 188,629 192,429 216,604 200,712 220,969 France 190,922 165,728 169,493 182,640 180,355 173,731 Poland 143,005 150,548 171,941 201,185 178,209 199,475 Czech Republic 111,935 85,959 88,907 101,980 103,341 106,637 New Zealand 110,948 101,531 77,222 91,808 101,285 98,628 Slovakia 27,758 31,436 37,755 75,679 87,765 91,527 Romania 74,373 73,450 91,208 96,433 87,704 81,761 Netherlands 80,202 64,346 63,983 82,674 79,215 73,563 Uruguay 44,282 65,416 73,730 75,621 62,355 58,418 Denmark 62,468 53,726 61,542 61,101 54,222 52,827 United Arab Emirates --- 50,822 52,128 40,473 51,639 43,019 Belarus 58,451 64,537 69,290 72,582 51,044 54,441 Ukraine 43,846 45,546 56,913 69,638 46,236 46,169 Slovenia 57,561 42,842 40,719 52,308 44,490 49,139 Estonia 54,926 47,776 49,320 41,033 40,925 48,845 Hungary 30,068 26,773 39,832 41,756 33,818 34,270 United Kingdom 39,086 30,338 31,838 40,111 31,798 34,422 Ecuador 25,321 34,967 32,644 30,355 31,154 37,945 Bulgaria 22,146 27,663 26,346 28,701 27,779 26,172 Japan 7,184 8,768 10,679 12,878 25,075 45,772 India 18,267 18,103 21,009 31,254 24,859 43,515 Turkey 19,939 20,743 28,488 28,307 24,408 20,813 Thailand 19,320 15,446 15,940 20,424 21,836 21,300 Singapore 30,017 24,632 22,556 34,427 21,056 17,526 Taiwan 42,596 39,985 41,388 25,924 18,190 15,949
Table continued on next page.
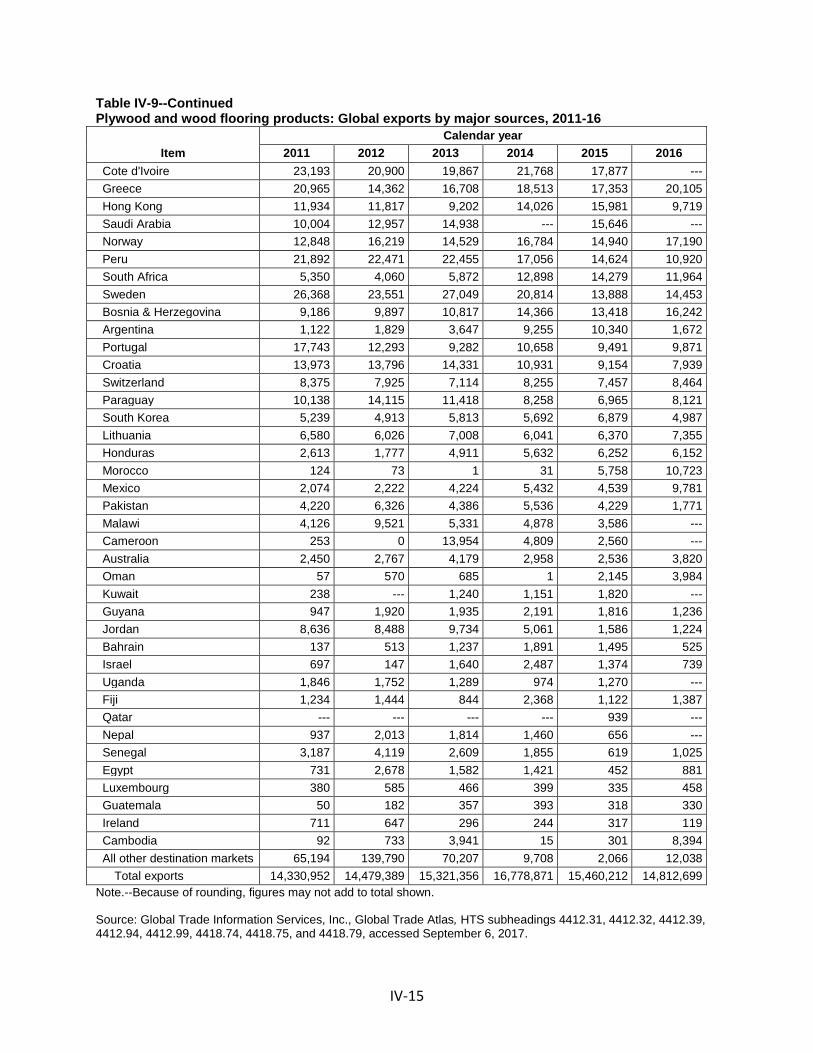
IV-15
Table IV-9--Continued Plywood and wood flooring products: Global exports by major sources, 2011-16
Item Calendar year
2011 2012 2013 2014 2015 2016 Cote d'Ivoire 23,193 20,900 19,867 21,768 17,877 --- Greece 20,965 14,362 16,708 18,513 17,353 20,105 Hong Kong 11,934 11,817 9,202 14,026 15,981 9,719 Saudi Arabia 10,004 12,957 14,938 --- 15,646 --- Norway 12,848 16,219 14,529 16,784 14,940 17,190 Peru 21,892 22,471 22,455 17,056 14,624 10,920 South Africa 5,350 4,060 5,872 12,898 14,279 11,964 Sweden 26,368 23,551 27,049 20,814 13,888 14,453 Bosnia & Herzegovina 9,186 9,897 10,817 14,366 13,418 16,242 Argentina 1,122 1,829 3,647 9,255 10,340 1,672 Portugal 17,743 12,293 9,282 10,658 9,491 9,871 Croatia 13,973 13,796 14,331 10,931 9,154 7,939 Switzerland 8,375 7,925 7,114 8,255 7,457 8,464 Paraguay 10,138 14,115 11,418 8,258 6,965 8,121 South Korea 5,239 4,913 5,813 5,692 6,879 4,987 Lithuania 6,580 6,026 7,008 6,041 6,370 7,355 Honduras 2,613 1,777 4,911 5,632 6,252 6,152 Morocco 124 73 1 31 5,758 10,723 Mexico 2,074 2,222 4,224 5,432 4,539 9,781 Pakistan 4,220 6,326 4,386 5,536 4,229 1,771 Malawi 4,126 9,521 5,331 4,878 3,586 --- Cameroon 253 0 13,954 4,809 2,560 --- Australia 2,450 2,767 4,179 2,958 2,536 3,820 Oman 57 570 685 1 2,145 3,984 Kuwait 238 --- 1,240 1,151 1,820 --- Guyana 947 1,920 1,935 2,191 1,816 1,236 Jordan 8,636 8,488 9,734 5,061 1,586 1,224 Bahrain 137 513 1,237 1,891 1,495 525 Israel 697 147 1,640 2,487 1,374 739 Uganda 1,846 1,752 1,289 974 1,270 --- Fiji 1,234 1,444 844 2,368 1,122 1,387 Qatar --- --- --- --- 939 --- Nepal 937 2,013 1,814 1,460 656 --- Senegal 3,187 4,119 2,609 1,855 619 1,025 Egypt 731 2,678 1,582 1,421 452 881 Luxembourg 380 585 466 399 335 458 Guatemala 50 182 357 393 318 330 Ireland 711 647 296 244 317 119 Cambodia 92 733 3,941 15 301 8,394 All other destination markets 65,194 139,790 70,207 9,708 2,066 12,038
Total exports 14,330,952 14,479,389 15,321,356 16,778,871 15,460,212 14,812,699 Note.--Because of rounding, figures may not add to total shown. Source: Global Trade Information Services, Inc., Global Trade Atlas, HTS subheadings 4412.31, 4412.32, 4412.39, 4412.94, 4412.99, 4418.74, 4418.75, and 4418.79, accessed September 6, 2017.
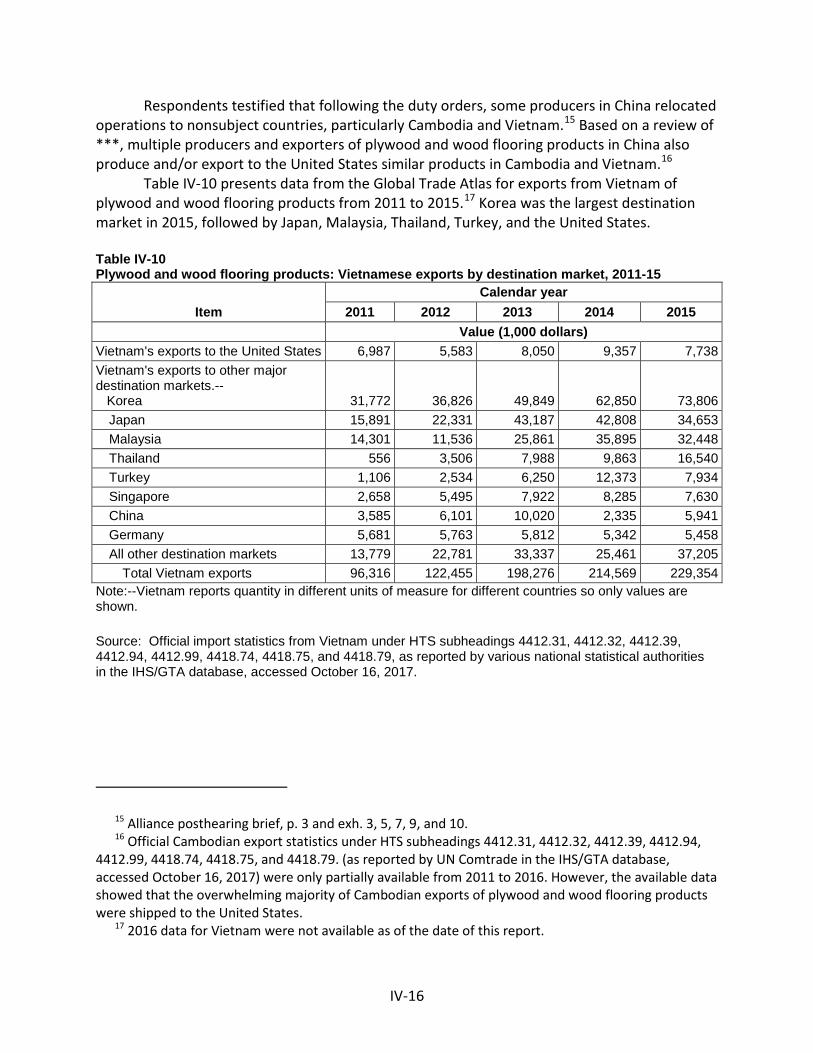
IV-16
Respondents testified that following the duty orders, some producers in China relocated operations to nonsubject countries, particularly Cambodia and Vietnam.15 Based on a review of ***, multiple producers and exporters of plywood and wood flooring products in China also produce and/or export to the United States similar products in Cambodia and Vietnam.16
Table IV-10 presents data from the Global Trade Atlas for exports from Vietnam of plywood and wood flooring products from 2011 to 2015.17 Korea was the largest destination market in 2015, followed by Japan, Malaysia, Thailand, Turkey, and the United States.
Table IV-10 Plywood and wood flooring products: Vietnamese exports by destination market, 2011-15
Item Calendar year
2011 2012 2013 2014 2015 Value (1,000 dollars) Vietnam's exports to the United States 6,987 5,583 8,050 9,357 7,738 Vietnam's exports to other major destination markets.-- Korea 31,772 36,826 49,849 62,850 73,806
Japan 15,891 22,331 43,187 42,808 34,653 Malaysia 14,301 11,536 25,861 35,895 32,448 Thailand 556 3,506 7,988 9,863 16,540 Turkey 1,106 2,534 6,250 12,373 7,934 Singapore 2,658 5,495 7,922 8,285 7,630 China 3,585 6,101 10,020 2,335 5,941 Germany 5,681 5,763 5,812 5,342 5,458 All other destination markets 13,779 22,781 33,337 25,461 37,205
Total Vietnam exports 96,316 122,455 198,276 214,569 229,354 Note:--Vietnam reports quantity in different units of measure for different countries so only values are shown. Source: Official import statistics from Vietnam under HTS subheadings 4412.31, 4412.32, 4412.39, 4412.94, 4412.99, 4418.74, 4418.75, and 4418.79, as reported by various national statistical authorities in the IHS/GTA database, accessed October 16, 2017.
15 Alliance posthearing brief, p. 3 and exh. 3, 5, 7, 9, and 10. 16 Official Cambodian export statistics under HTS subheadings 4412.31, 4412.32, 4412.39, 4412.94,
4412.99, 4418.74, 4418.75, and 4418.79. (as reported by UN Comtrade in the IHS/GTA database, accessed October 16, 2017) were only partially available from 2011 to 2016. However, the available data showed that the overwhelming majority of Cambodian exports of plywood and wood flooring products were shipped to the United States.
17 2016 data for Vietnam were not available as of the date of this report.
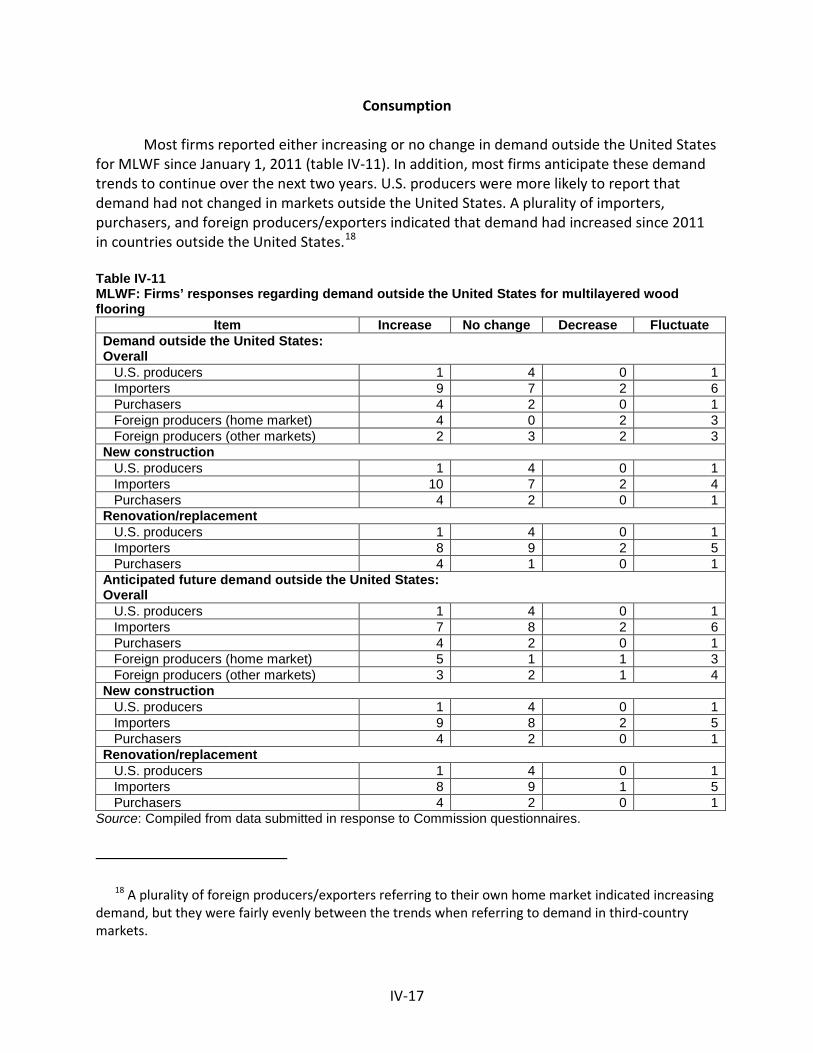
IV-17
Consumption
Most firms reported either increasing or no change in demand outside the United States for MLWF since January 1, 2011 (table IV-11). In addition, most firms anticipate these demand trends to continue over the next two years. U.S. producers were more likely to report that demand had not changed in markets outside the United States. A plurality of importers, purchasers, and foreign producers/exporters indicated that demand had increased since 2011 in countries outside the United States.18
Table IV-11 MLWF: Firms’ responses regarding demand outside the United States for multilayered wood flooring
Item Increase No change Decrease Fluctuate Demand outside the United States: Overall U.S. producers 1 4 0 1 Importers 9 7 2 6 Purchasers 4 2 0 1 Foreign producers (home market) 4 0 2 3 Foreign producers (other markets) 2 3 2 3 New construction U.S. producers 1 4 0 1 Importers 10 7 2 4 Purchasers 4 2 0 1 Renovation/replacement U.S. producers 1 4 0 1 Importers 8 9 2 5 Purchasers 4 1 0 1 Anticipated future demand outside the United States: Overall U.S. producers 1 4 0 1 Importers 7 8 2 6 Purchasers 4 2 0 1 Foreign producers (home market) 5 1 1 3 Foreign producers (other markets) 3 2 1 4 New construction U.S. producers 1 4 0 1 Importers 9 8 2 5 Purchasers 4 2 0 1 Renovation/replacement U.S. producers 1 4 0 1 Importers 8 9 1 5 Purchasers 4 2 0 1
Source: Compiled from data submitted in response to Commission questionnaires.
18 A plurality of foreign producers/exporters referring to their own home market indicated increasing demand, but they were fairly evenly between the trends when referring to demand in third-country markets.
IV-18
Prices
Most producers and importers had no knowledge of prices in non-U.S. markets. Producer *** stated that prices in Canada are the same, and producer *** stated that price in Canada are slightly lower, noting that the current duties may account for the discrepancy. Of the importers that had knowledge of price differences, three reported prices in Canada are lower than in the United States, two reported similar pricing (with one specifying Europe as a point of comparison), and one each stated that prices are higher in Europe, lower in Europe, lower in Japan, and lower in “non-U.S.” markets. Most foreign producers reported that prices for MLWF in China and the United States were the same or similar.
As a part of Alliance’s posthearing brief to the Commission, certain producers in China certified that in general, the U.S. market commands lower prices for MLWF than do the Canadian, Chinese, and European markets. Regarding certain *** engineered flooring, pricing sheets provided by these producers showed that compared to the United States, prices in Canada are approximately *** percent higher, prices in China are approximately *** percent higher, and prices in Europe are approximately *** percent higher.19
19 Alliance posthearing brief, “Response to question on China export price comparisons,” pp. 1-2 and exh. 2-4.
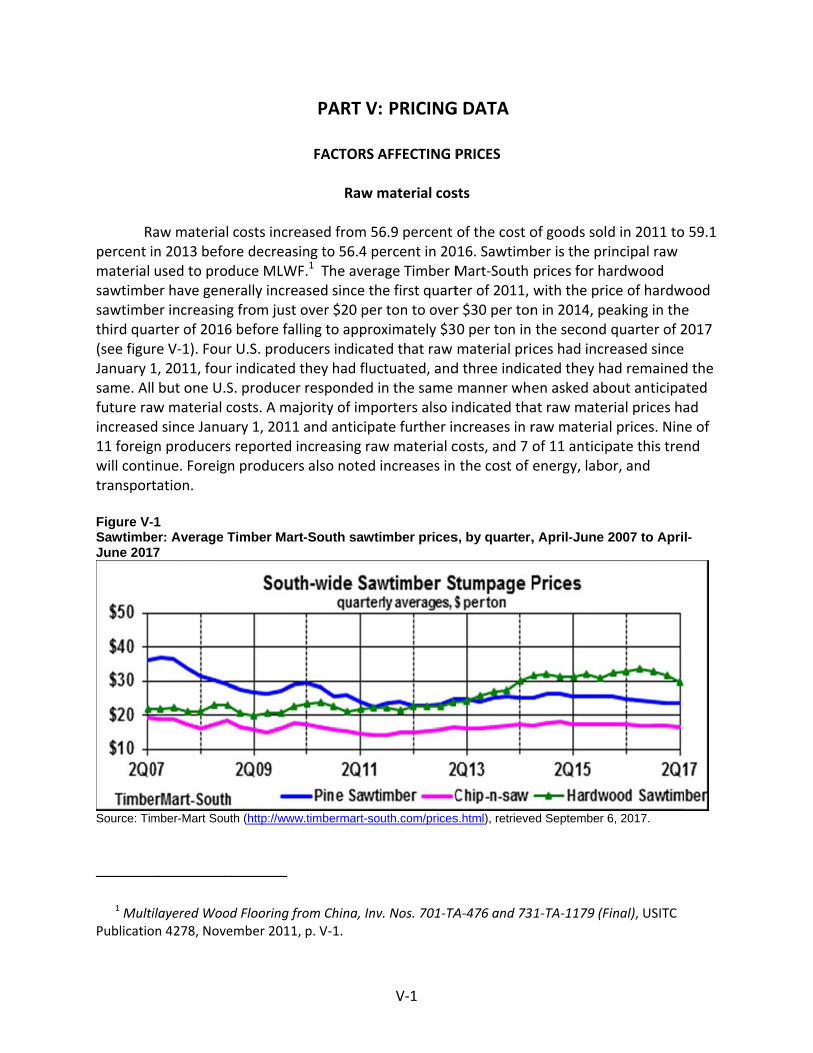
R
percent imaterial sawtimbsawtimbthird qua(see figuJanuary 1same. Alfuture raincreased11 foreigwill contitransport
Figure V-SawtimbeJune 201
Source: Tim
1 MultiPublicatio
aw materialin 2013 befoused to proer have geneer increasingarter of 2016re V‐1). Four1, 2011, fourl but one U.Sw material cd since Janugn producersinue. Foreigtation.
-1 er: Average T7
mber-Mart Sou
ilayered Wooon 4278, Nove
costs increaore decreasinduce MLWFerally increag from just o6 before fallir U.S. produr indicated tS. producer costs. A majoary 1, 2011 as reported inn producers
Timber Mart-
uth (http://www.
od Flooring froember 2011,
PART V:
FACTORS A
Raw m
ased from 56ng to 56.4 pe.1 The averaased since thover $20 pering to approcers indicatethey had flucresponded iority of impoand anticipancreasing raw also noted
-South sawti
.timbermart-so
om China, Invp. V‐1.
V‐1
: PRICING
AFFECTING P
material cos
6.9 percent ercent in 20age Timber Mhe first quartr ton to overoximately $3ed that raw ctuated, andn the same orters also inate further inw material cincreases in
imber prices
uth.com/prices
v. Nos. 701‐TA
G DATA
PRICES
sts
of the cost o16. SawtimbMart‐South ter of 2011, r $30 per ton0 per ton in material prid three indicmanner whendicated thancreases in rcosts, and 7 the cost of
s, by quarter,
s.html), retrieve
A‐476 and 73
of goods soldber is the prprices for hawith the prin in 2014, pethe second ces had incrated they haen asked abat raw materaw materiaof 11 anticipenergy, labo
, April-June 2
ed September 6
1‐TA‐1179 (F
d in 2011 toincipal raw ardwood ce of hardweaking in thequarter of 2reased since ad remainedout anticiparial prices hal prices. Ninpate this treor, and
2007 to Apri
6, 2017.
Final), USITC
59.1
wood e 2017
d the ated ad e of nd
l-
V‐2
Transportation costs to the U.S. market
Transportation costs for MLWF shipped from China to the United States averaged 7.8 percent during 2016. These estimates were derived from official import data and represent the transportation and other charges on imports.2
U.S. inland transportation costs
Six of 11 responding U.S. producers and 35 of 43 responding importers reported that
they typically arrange transportation to their customers. Most U.S. producers reported that their U.S. inland transportation costs ranged from 1 to 10 percent, averaging slightly more than 5 percent, while most (30) responding importers reported costs ranging from less than 1 percent to 15 percent, averaging slightly less than 5 percent.3
PRICING PRACTICES
Pricing methods
As presented in table V‐1, all U.S. producers reported using price lists to help determine
prices for MLWF, while some U.S. producers also reported using transaction‐by‐transaction negotiations and contracts. A majority of responding importers (30 of 46) also reported selling MLWF using price lists; nearly half reported using transaction‐by‐transaction negotiations (22 of 46). Twenty of 30 responding purchasers indicated that their purchases involve negotiations. Contracts were slightly less prevalent among importers (22 percent) than among producers (27 percent). A number of firms reported that the price list offer a starting point with various direct or indirect discounts applied to the price.
2 The estimated transportation costs were obtained by subtracting the customs value from the c.i.f. value of the imports for 2016 and then dividing by the customs value based on the HTS statistical reporting numbers 4412.31.0520; 4412.31.0540; 4412.31.0560; 4412.31.2510; 4412.31.2520; 4412.31.4040; 4412.31.4050; 4412.31.4060; 4412.31.4070; 4412.31.5125; 4412.31.5135; 4412.31.5155; 4412.31.5165; 4412.31.3175; 4412.31.6000; 4412.31.9100; 4412.32.0520; 4412.32.0540; 4412.32.0560; 4412.32.2510; 4412.32.2520; 4412.32.3125; 4412.32.3135; 4412.32.3155; 4412.32.3165; 4412.32.3175; 4412.32.3185; 4412.32.5600; 4412.39.1000; 4412.39.3000; 4412.39.4011; 4412.39.4012; 4412.39.4019; 4412.39.4031; 4412.39.4032; 4412.39.4039; 4412.39.4051; 4412.39.4052; 4412.39.4059; 4412.39.4061; 4412.39.4062; 4412.39.4069; 4412.39.5010; 4412.39.5030; 4412.39.5050; 4412.94.1030; 4412.94.1050; 4412.94.3105; 4412.94.3111; 4412.94.3121; 4412.94.3131; 4412.94.3141; 4412.94.3160; 4412.94.3171; 4412.94.4100; 4412.94.5100; 4412.94.6000; 4412.94.7000; 4412.94.8000; 4412.94.9000; 4412.94.9500; 4412.99.0600; 4412.99.1020; 4412.99.1030; 4412.99.1040; 4412.99.3110; 4412.99.3120; 4412.99.3130; 4412.99.3140; 4412.99.3150; 4412.99.3160; 4412.99.3170; 4412.99.4100; 4412.99.5100; 4412.99.5710; 4412.99.6000; 4412.99.7000; 4412.99.8000; 4412.99.9000; 4412.99.9500; 4418.71.2000; 4418.71.9000; 4418.72.2000; and 4418.72.9500.
3 These data exclude those of ***.
V‐3
Table V-1 MLWF: U.S. producers and importers reported price setting methods, by number of responding firms1
Method U.S. producers Importers Transaction-by-transaction 4 22 Contract 3 10 Set price list 11 30 Other 0 6 Responding firms 11 46
1 The sum of responses down does not add up to the total number of responding firms as each firm was instructed to check all applicable price setting methods employed. Source: Compiled from data submitted in response to Commission questionnaires.
Table V‐2 presents U.S. producers’ and importers’ U.S. 2016 commercial shipments of MLWF by type of sale. Nearly 70 percent of U.S. producers’ shipments of MLWF were sold on the spot market. Importers’ spot market shipments accounted for a plurality of shipments. Although 22 percent of importers reported using contracts to determine pricing, slightly less than half of the volume of imported MLWF from China was sold via contracts. This indicates that higher‐volume importers account for a greater share of importers’ contract sales. Among domestic producers, all the largest producers (except ***) reported using either short‐term or long‐term contracts for at least a portion of their sales, and there were no clear trends regarding characteristics of these contracts. The majority of importers’ contracts fix prices (with nearly half also fixing quantity) and do not allow for price renegotiation; approximately half contain meet‐or‐release provisions.
Table V-2 MLWF: U.S. producers’ and importers’ shares of U.S. commercial shipments by type of sale, 2016
Type of sale U.S. producers Importers Long-term contracts 27.0 10.5Annual contracts 0.0 28.3Short-term contracts 3.6 9.8Spot sales 69.4 51.4
Total 100.0 100.0Note.--Because of rounding, figures may not add to the totals shown. Source: Compiled from data submitted in response to Commission questionnaires.
Seven purchasers reported that they purchase MLWF daily, 15 purchase weekly, 5 purchase monthly, 2 purchase quarterly, and 3 purchase with some other frequency. Twenty‐seven of 30 responding purchasers reported that they did not expect their purchasing patterns to change in the next two years. Most (24 of 30) responding purchasers contact 5 or fewer suppliers before making a purchase, however two purchasers (*** and ***) contact at least 10 suppliers before making any purchases.

V‐4
Sales terms and discounts
Most U.S. producers (8 of 11) and importers (26 of 46) typically quote prices on an f.o.b. basis. Approximately half (6 of 11) of producers offer an early payment discount of 1 to 2 percent if paid within a week to 10 days. Approximately one‐quarter of responding importers offer early payment discounts, and some require prepayment or cash on delivery. Net 30 days was most frequently reported by both producers and importer for non‐discounted payments.
Both producers and importers utilize a variety of discount methods (table V‐3). Direct discounts, direct rebates, and promotional support were the most frequently offered tools employed by U.S. producers to reduce the final price paid by purchasers. Additionally, purchaser *** stated that *** “offer buying groups heavy rebates on purchases. They also offer trips and getaway{s} as incentives to key employees. Some are selling direct to buying groups, passing distribution totally, in order to give larger rebates.” Direct discounts, consumer rebates, indirect discounts, and promotional support were those used most frequently by importers. Seven of 11 producers, but only 10 of 47 responding importers (***), reported that the discount policies, rebates, or other incentives are made via written agreements with their customers.
Table V-3 MLWF: Number of U.S. producers and importers offering discounts, rebates, support, and allowances, 2016
Type of sale U.S. producers Importers Direct discounts 7 22 Indirect discounts 2 Direct rebates 6 17 Indirect rebates 3 8 Consumer rebates 2 2 Promotional support 5 20 Cooperative advertising allowances 4 8 No discount policy 1 5 Other 1 4
Note.--Importers were asked about discounts in general, instead of direct and indirect discounts. Source: Compiled from data submitted in response to Commission questionnaires.
In addition, purchasers were asked to characterize the impact of the various rebate/incentive programs in their purchasing decisions for each of the sources from which they bought MLWF (table V‐4).4 In most cases, the impact of these incentives was categorized as “minimal” by purchasers. The incentive that purchasers most often identified as having a “substantial” impact for each listed source of supply was the provision of promotional samples. Purchaser *** was the only purchaser to describe promotional samples as having a “substantial” impact for each source, stating “The product is its best {promotion} so samples
4 If a supplier offered a particular type of incentive program, purchasers were requested to choose between whether the impact of that incentive had a “minimal,” “moderate,” or “substantial” impact.
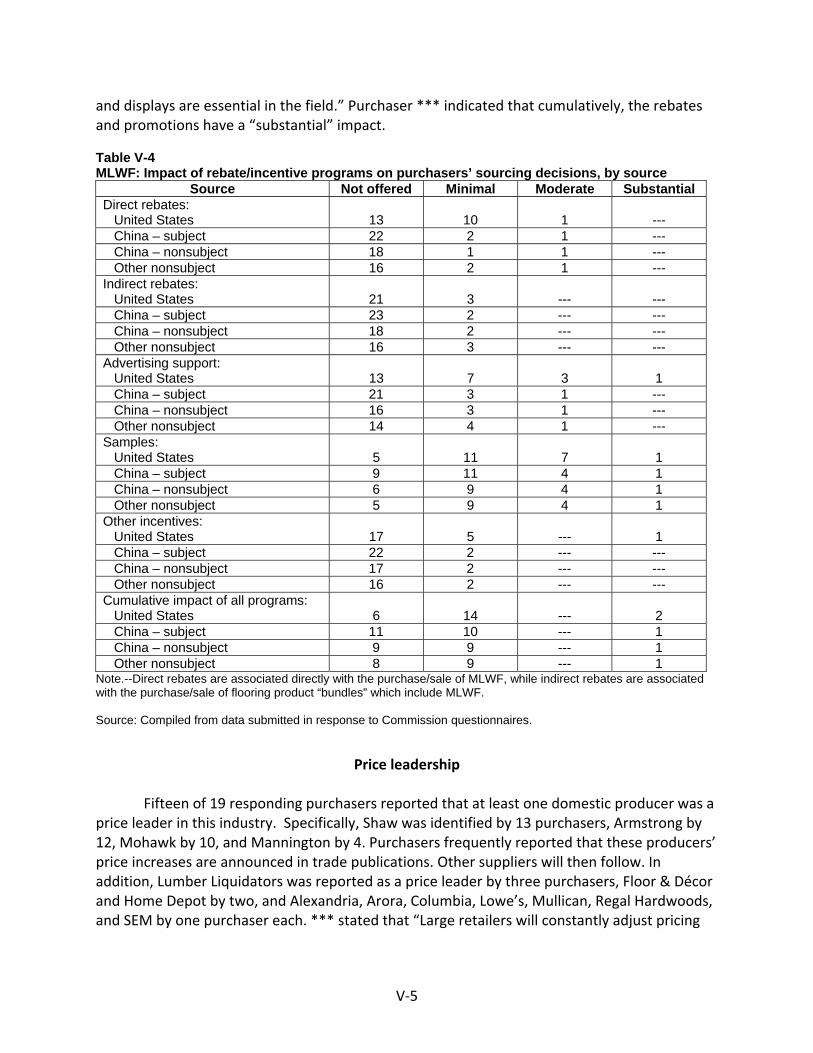
V‐5
and displays are essential in the field.” Purchaser *** indicated that cumulatively, the rebates and promotions have a “substantial” impact. Table V-4 MLWF: Impact of rebate/incentive programs on purchasers’ sourcing decisions, by source
Source Not offered Minimal Moderate Substantial Direct rebates: United States 13 10 1 --- China – subject 22 2 1 --- China – nonsubject 18 1 1 --- Other nonsubject 16 2 1 --- Indirect rebates: United States 21 3 --- --- China – subject 23 2 --- --- China – nonsubject 18 2 --- --- Other nonsubject 16 3 --- --- Advertising support: United States 13 7 3 1 China – subject 21 3 1 --- China – nonsubject 16 3 1 --- Other nonsubject 14 4 1 --- Samples: United States 5 11 7 1 China – subject 9 11 4 1 China – nonsubject 6 9 4 1 Other nonsubject 5 9 4 1 Other incentives: United States 17 5 --- 1 China – subject 22 2 --- --- China – nonsubject 17 2 --- --- Other nonsubject 16 2 --- --- Cumulative impact of all programs: United States 6 14 --- 2 China – subject 11 10 --- 1 China – nonsubject 9 9 --- 1 Other nonsubject 8 9 --- 1
Note.--Direct rebates are associated directly with the purchase/sale of MLWF, while indirect rebates are associated with the purchase/sale of flooring product “bundles” which include MLWF. Source: Compiled from data submitted in response to Commission questionnaires.
Price leadership
Fifteen of 19 responding purchasers reported that at least one domestic producer was a price leader in this industry. Specifically, Shaw was identified by 13 purchasers, Armstrong by 12, Mohawk by 10, and Mannington by 4. Purchasers frequently reported that these producers’ price increases are announced in trade publications. Other suppliers will then follow. In addition, Lumber Liquidators was reported as a price leader by three purchasers, Floor & Décor and Home Depot by two, and Alexandria, Arora, Columbia, Lowe’s, Mullican, Regal Hardwoods, and SEM by one purchaser each. *** stated that “Large retailers will constantly adjust pricing
V‐6
and product assortment to drive sales. They watch each other’s pricing closely and will respond accordingly.” Purchaser *** stated that “Large firms {are} relatively price competitive.“
PRICE DATA
The Commission requested U.S. producers and importers to provide quarterly data for the total quantity and f.o.b. value of the following MLWF products shipped to unrelated U.S. customers during January 2011‐June 2017.
Product 1.‐‐Multilayered wood flooring, non‐click, 12.5 mm (½ inch) thick, red oak‐face
product, prefinished (veneer core), "Select" or "Clear" grade, smooth finish, 125 mm (4 ¾ to 5 ½ inches) width, with a face thickness of 2 mm
Product 2.‐‐Multilayered wood flooring, non‐click, 9.5 mm (3/8 inch) thick, red oak‐face product, smooth finish, prefinished (veneer core), 76 mm (2 ¾ to 3 ½ inches) width, with a face thickness of 1.6 to 2 mm
Product 3.‐‐Multilayered wood flooring, non‐click, 9.5 mm (3/8 inch) thick, red oak‐face product, prefinished (veneer core), hand‐scraped, distressed, or wire‐brushed finish, 76 mm (4 ¾ to 5 ½ inches) width, with a face thickness of 1.6 to 2mm
Product 4.‐‐Multilayered wood flooring, non‐click, 9.5 mm (3/8 inch) thick, maple‐face product, smooth finish, prefinished (veneer core), "Select" or "Clear" grade, 125 mm (4 ¾ to 5 ½ inches) width, with a face thickness of 2mm
Product 5.‐‐Multilayered wood flooring, interlocking/click installation, 9.5 mm (3/8 inch) thick, red‐oak face product, smooth finish, prefinished (MDF, HDF, or similar core), 125 mm (4 ¾ to 5 ½ inches) width, with a face thickness of 1.6 to 2 mm, 121.92 cm to 182.88 cm
Product 6.‐‐Multilayered wood flooring, non‐click, 12.5 mm (½ inch) thick, rotary/sliced, hickory‐face, hand‐scraped, distressed, or wire‐brushed finish, prefinished, "Rustic" or "Country" grade, (veneer core), 125 mm (4 ¾ to 5 ½ inches) width, with a face thickness of 2 mm
Product 7.‐‐ Multilayered wood flooring, non‐click, 12.5 mm (½ inch) thick, birch face product, prefinished, smooth finish, veneer core, 125 mm (4 ¾ to 5 ½ inches) width, with a face thickness of 1.6 to 2 mm
Product 8.‐‐Multilayered wood flooring, non‐click, 12.5 mm (½ inch) thick, birch face product, prefinished, hand‐scraped, distressed, or wire‐brushed finish, veneer core, 125 mm (4 ¾ to 5 ½ inches) width, with a face thickness of 1.6 to 2 mm.
V‐7
Six U.S. producers and 24 importers provided usable pricing data for sales of the requested products, although not all firms reported pricing for all products for all quarters.5 Pricing data reported by these firms accounted for approximately 23 percent of U.S. producers’ shipments of MLWF and 19 percent of U.S. shipments of subject imports from China in 2016.6 With respect to the price data reported by U.S. importers, 29.4 percent of the total reported volume and 40.0 percent of the total reported valued was attributable to firms that are also U.S. producers.7
Price data for products 1‐8 are presented in tables V‐5 to V‐12 and figures V‐2 to V‐9.8
5 Per‐unit pricing data are calculated from total quantity and total value data provided by U.S. producers and importers. The precision and variation of these figures may be affected by rounding, limited quantities, and producer or importer estimates.
6 Domestic pricing data for 2011 are ***. 7 This total includes all data for ***. 8 Importer *** reported quarterly pricing data with product descriptions. None of its data matched
the product descriptions exactly. However, its reported data for ***. The pricing data of *** that was submitted is highly variable in a number of quarters. *** explained that “***.” ***.
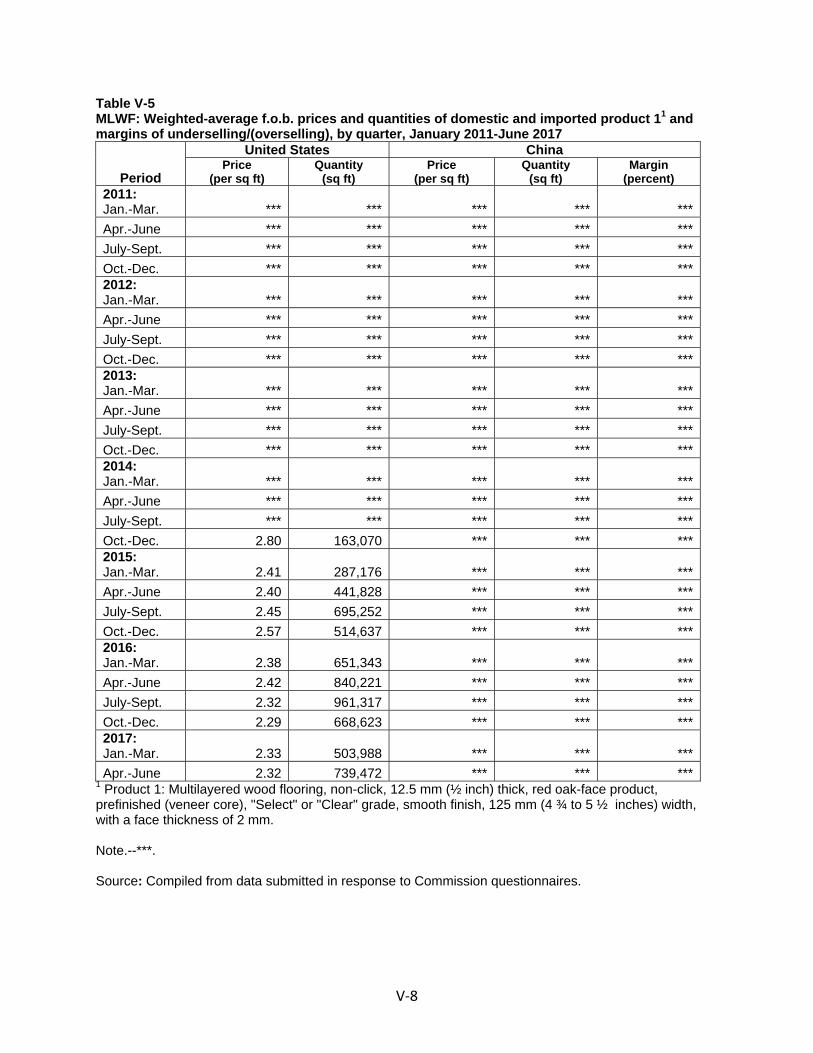
V‐8
Table V-5 MLWF: Weighted-average f.o.b. prices and quantities of domestic and imported product 11 and margins of underselling/(overselling), by quarter, January 2011-June 2017
Period
United States China Price
(per sq ft) Quantity
(sq ft) Price
(per sq ft) Quantity
(sq ft) Margin
(percent) 2011: Jan.-Mar. *** *** *** *** ***Apr.-June *** *** *** *** ***July-Sept. *** *** *** *** ***Oct.-Dec. *** *** *** *** ***2012: Jan.-Mar. *** *** *** *** ***Apr.-June *** *** *** *** ***July-Sept. *** *** *** *** ***Oct.-Dec. *** *** *** *** ***2013: Jan.-Mar. *** *** *** *** ***Apr.-June *** *** *** *** ***July-Sept. *** *** *** *** ***Oct.-Dec. *** *** *** *** ***2014: Jan.-Mar. *** *** *** *** ***Apr.-June *** *** *** *** ***July-Sept. *** *** *** *** ***Oct.-Dec. 2.80 163,070 *** *** ***2015: Jan.-Mar. 2.41 287,176 *** *** ***Apr.-June 2.40 441,828 *** *** ***July-Sept. 2.45 695,252 *** *** ***Oct.-Dec. 2.57 514,637 *** *** ***2016: Jan.-Mar. 2.38 651,343 *** *** ***Apr.-June 2.42 840,221 *** *** ***July-Sept. 2.32 961,317 *** *** ***Oct.-Dec. 2.29 668,623 *** *** ***2017: Jan.-Mar. 2.33 503,988 *** *** ***Apr.-June 2.32 739,472 *** *** ***
1 Product 1: Multilayered wood flooring, non-click, 12.5 mm (½ inch) thick, red oak-face product, prefinished (veneer core), "Select" or "Clear" grade, smooth finish, 125 mm (4 ¾ to 5 ½ inches) width, with a face thickness of 2 mm. Note.--***. Source: Compiled from data submitted in response to Commission questionnaires.
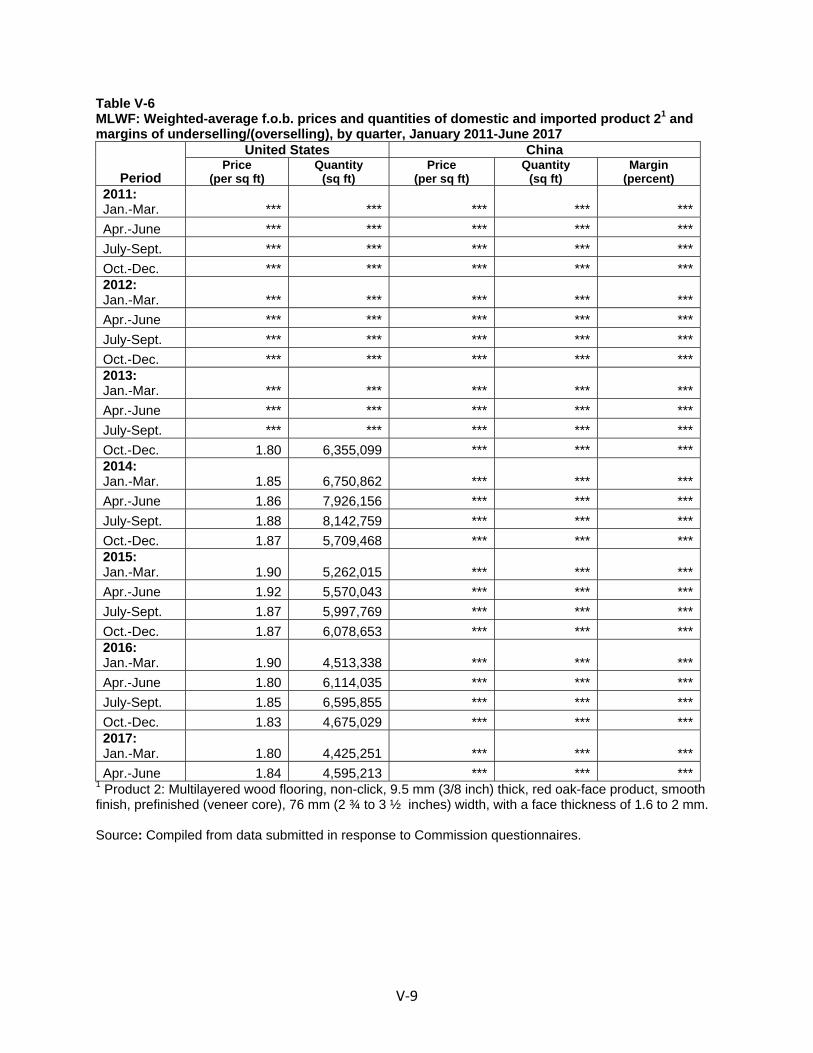
V‐9
Table V-6 MLWF: Weighted-average f.o.b. prices and quantities of domestic and imported product 21 and margins of underselling/(overselling), by quarter, January 2011-June 2017
Period
United States China Price
(per sq ft) Quantity
(sq ft) Price
(per sq ft) Quantity
(sq ft) Margin
(percent) 2011: Jan.-Mar. *** *** *** *** ***Apr.-June *** *** *** *** ***July-Sept. *** *** *** *** ***Oct.-Dec. *** *** *** *** ***2012: Jan.-Mar. *** *** *** *** ***Apr.-June *** *** *** *** ***July-Sept. *** *** *** *** ***Oct.-Dec. *** *** *** *** ***2013: Jan.-Mar. *** *** *** *** ***Apr.-June *** *** *** *** ***July-Sept. *** *** *** *** ***Oct.-Dec. 1.80 6,355,099 *** *** ***2014: Jan.-Mar. 1.85 6,750,862 *** *** ***Apr.-June 1.86 7,926,156 *** *** ***July-Sept. 1.88 8,142,759 *** *** ***Oct.-Dec. 1.87 5,709,468 *** *** ***2015: Jan.-Mar. 1.90 5,262,015 *** *** ***Apr.-June 1.92 5,570,043 *** *** ***July-Sept. 1.87 5,997,769 *** *** ***Oct.-Dec. 1.87 6,078,653 *** *** ***2016: Jan.-Mar. 1.90 4,513,338 *** *** ***Apr.-June 1.80 6,114,035 *** *** ***July-Sept. 1.85 6,595,855 *** *** ***Oct.-Dec. 1.83 4,675,029 *** *** ***2017: Jan.-Mar. 1.80 4,425,251 *** *** ***Apr.-June 1.84 4,595,213 *** *** ***
1 Product 2: Multilayered wood flooring, non-click, 9.5 mm (3/8 inch) thick, red oak-face product, smooth finish, prefinished (veneer core), 76 mm (2 ¾ to 3 ½ inches) width, with a face thickness of 1.6 to 2 mm. Source: Compiled from data submitted in response to Commission questionnaires.
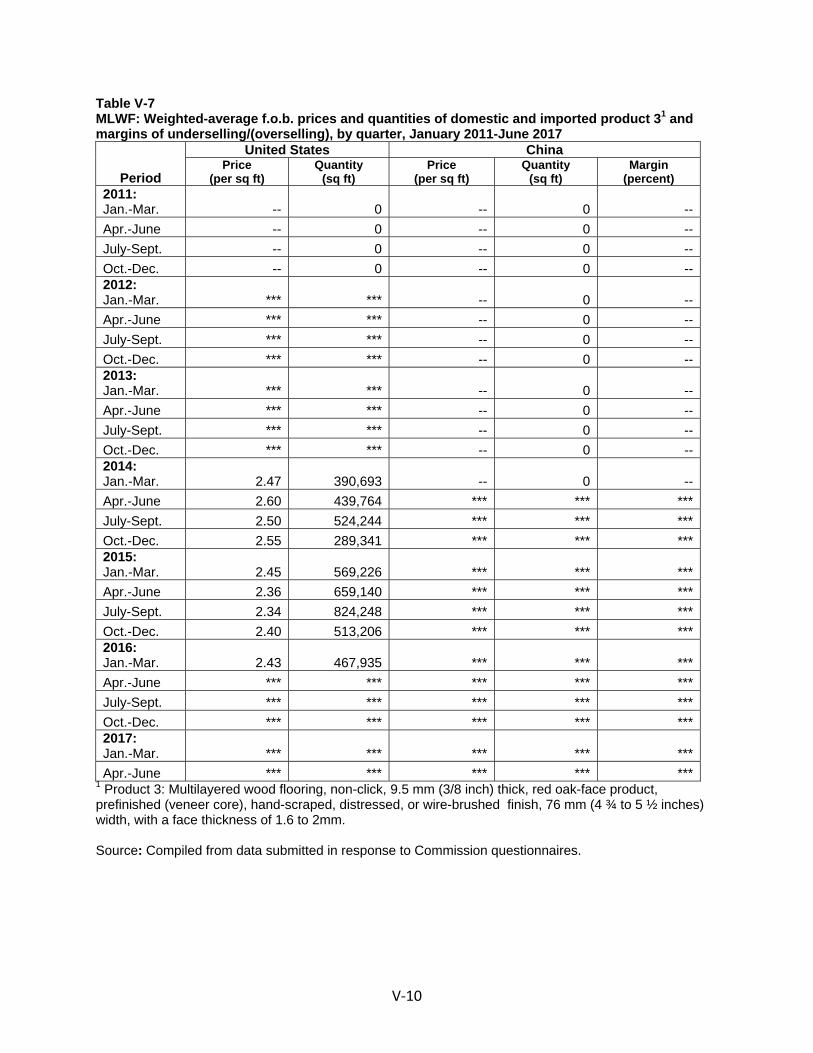
V‐10
Table V-7 MLWF: Weighted-average f.o.b. prices and quantities of domestic and imported product 31 and margins of underselling/(overselling), by quarter, January 2011-June 2017
Period
United States China Price
(per sq ft) Quantity
(sq ft) Price
(per sq ft) Quantity
(sq ft) Margin
(percent) 2011: Jan.-Mar. -- 0 -- 0 --Apr.-June -- 0 -- 0 --July-Sept. -- 0 -- 0 --Oct.-Dec. -- 0 -- 0 --2012: Jan.-Mar. *** *** -- 0 --Apr.-June *** *** -- 0 --July-Sept. *** *** -- 0 --Oct.-Dec. *** *** -- 0 --2013: Jan.-Mar. *** *** -- 0 --Apr.-June *** *** -- 0 --July-Sept. *** *** -- 0 --Oct.-Dec. *** *** -- 0 --2014: Jan.-Mar. 2.47 390,693 -- 0 --Apr.-June 2.60 439,764 *** *** ***July-Sept. 2.50 524,244 *** *** ***Oct.-Dec. 2.55 289,341 *** *** ***2015: Jan.-Mar. 2.45 569,226 *** *** ***Apr.-June 2.36 659,140 *** *** ***July-Sept. 2.34 824,248 *** *** ***Oct.-Dec. 2.40 513,206 *** *** ***2016: Jan.-Mar. 2.43 467,935 *** *** ***Apr.-June *** *** *** *** ***July-Sept. *** *** *** *** ***Oct.-Dec. *** *** *** *** ***2017: Jan.-Mar. *** *** *** *** ***Apr.-June *** *** *** *** ***
1 Product 3: Multilayered wood flooring, non-click, 9.5 mm (3/8 inch) thick, red oak-face product, prefinished (veneer core), hand-scraped, distressed, or wire-brushed finish, 76 mm (4 ¾ to 5 ½ inches) width, with a face thickness of 1.6 to 2mm. Source: Compiled from data submitted in response to Commission questionnaires.
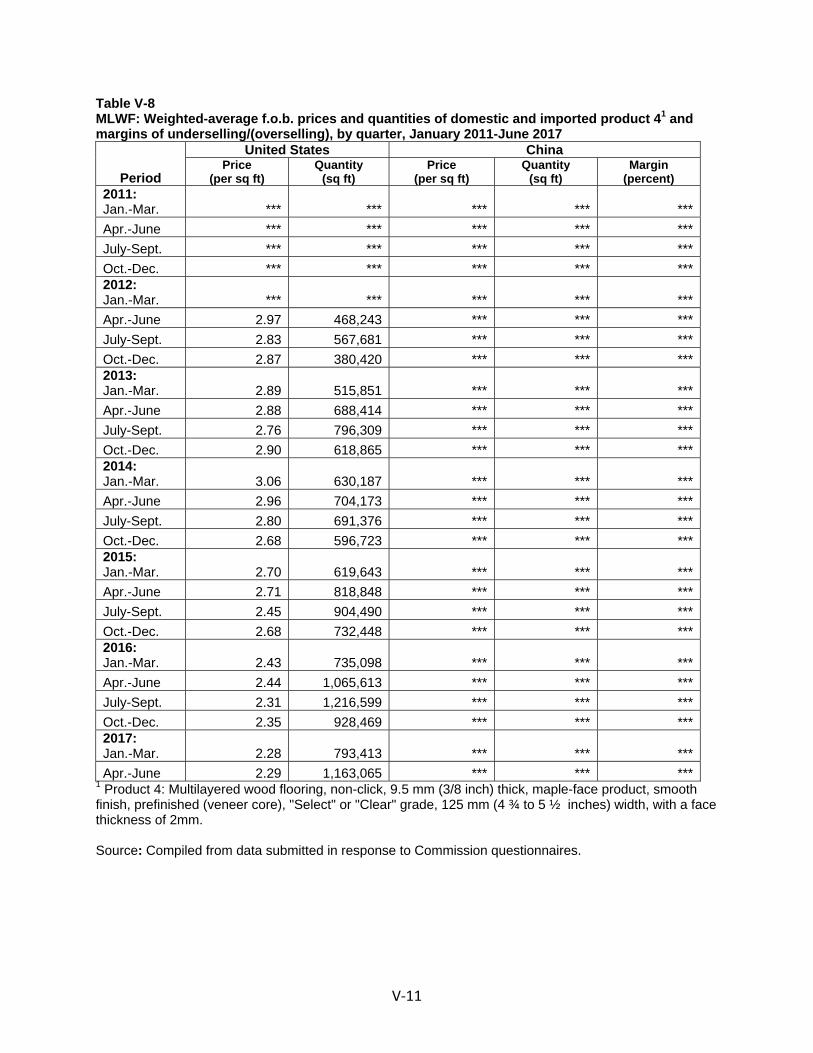
V‐11
Table V-8 MLWF: Weighted-average f.o.b. prices and quantities of domestic and imported product 41 and margins of underselling/(overselling), by quarter, January 2011-June 2017
Period
United States China Price
(per sq ft) Quantity
(sq ft) Price
(per sq ft) Quantity
(sq ft) Margin
(percent) 2011: Jan.-Mar. *** *** *** *** ***Apr.-June *** *** *** *** ***July-Sept. *** *** *** *** ***Oct.-Dec. *** *** *** *** ***2012: Jan.-Mar. *** *** *** *** ***Apr.-June 2.97 468,243 *** *** ***July-Sept. 2.83 567,681 *** *** ***Oct.-Dec. 2.87 380,420 *** *** ***2013: Jan.-Mar. 2.89 515,851 *** *** ***Apr.-June 2.88 688,414 *** *** ***July-Sept. 2.76 796,309 *** *** ***Oct.-Dec. 2.90 618,865 *** *** ***2014: Jan.-Mar. 3.06 630,187 *** *** ***Apr.-June 2.96 704,173 *** *** ***July-Sept. 2.80 691,376 *** *** ***Oct.-Dec. 2.68 596,723 *** *** ***2015: Jan.-Mar. 2.70 619,643 *** *** ***Apr.-June 2.71 818,848 *** *** ***July-Sept. 2.45 904,490 *** *** ***Oct.-Dec. 2.68 732,448 *** *** ***2016: Jan.-Mar. 2.43 735,098 *** *** ***Apr.-June 2.44 1,065,613 *** *** ***July-Sept. 2.31 1,216,599 *** *** ***Oct.-Dec. 2.35 928,469 *** *** ***2017: Jan.-Mar. 2.28 793,413 *** *** ***Apr.-June 2.29 1,163,065 *** *** ***
1 Product 4: Multilayered wood flooring, non-click, 9.5 mm (3/8 inch) thick, maple-face product, smooth finish, prefinished (veneer core), "Select" or "Clear" grade, 125 mm (4 ¾ to 5 ½ inches) width, with a face thickness of 2mm. Source: Compiled from data submitted in response to Commission questionnaires.
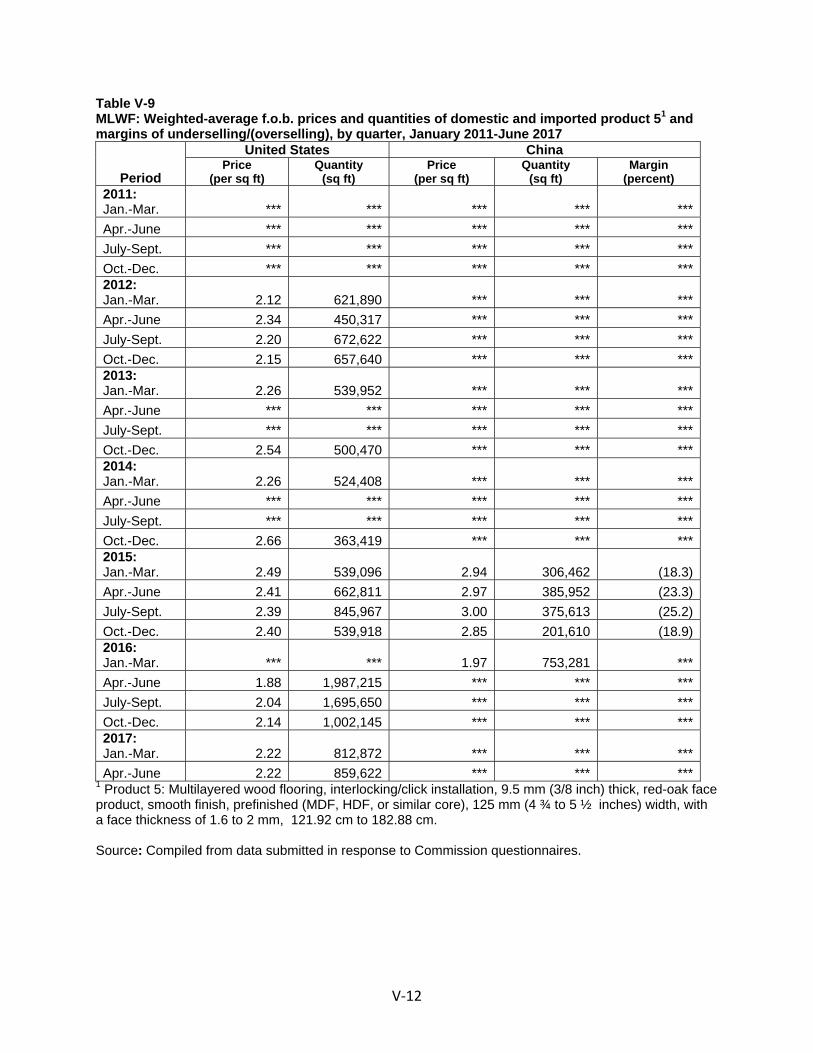
V‐12
Table V-9 MLWF: Weighted-average f.o.b. prices and quantities of domestic and imported product 51 and margins of underselling/(overselling), by quarter, January 2011-June 2017
Period
United States China Price
(per sq ft) Quantity
(sq ft) Price
(per sq ft) Quantity
(sq ft) Margin
(percent) 2011: Jan.-Mar. *** *** *** *** ***Apr.-June *** *** *** *** ***July-Sept. *** *** *** *** ***Oct.-Dec. *** *** *** *** ***2012: Jan.-Mar. 2.12 621,890 *** *** ***Apr.-June 2.34 450,317 *** *** ***July-Sept. 2.20 672,622 *** *** ***Oct.-Dec. 2.15 657,640 *** *** ***2013: Jan.-Mar. 2.26 539,952 *** *** ***Apr.-June *** *** *** *** ***July-Sept. *** *** *** *** ***Oct.-Dec. 2.54 500,470 *** *** ***2014: Jan.-Mar. 2.26 524,408 *** *** ***Apr.-June *** *** *** *** ***July-Sept. *** *** *** *** ***Oct.-Dec. 2.66 363,419 *** *** ***2015: Jan.-Mar. 2.49 539,096 2.94 306,462 (18.3)Apr.-June 2.41 662,811 2.97 385,952 (23.3)July-Sept. 2.39 845,967 3.00 375,613 (25.2)Oct.-Dec. 2.40 539,918 2.85 201,610 (18.9)2016: Jan.-Mar. *** *** 1.97 753,281 ***Apr.-June 1.88 1,987,215 *** *** ***July-Sept. 2.04 1,695,650 *** *** ***Oct.-Dec. 2.14 1,002,145 *** *** ***2017: Jan.-Mar. 2.22 812,872 *** *** ***Apr.-June 2.22 859,622 *** *** ***
1 Product 5: Multilayered wood flooring, interlocking/click installation, 9.5 mm (3/8 inch) thick, red-oak face product, smooth finish, prefinished (MDF, HDF, or similar core), 125 mm (4 ¾ to 5 ½ inches) width, with a face thickness of 1.6 to 2 mm, 121.92 cm to 182.88 cm. Source: Compiled from data submitted in response to Commission questionnaires.
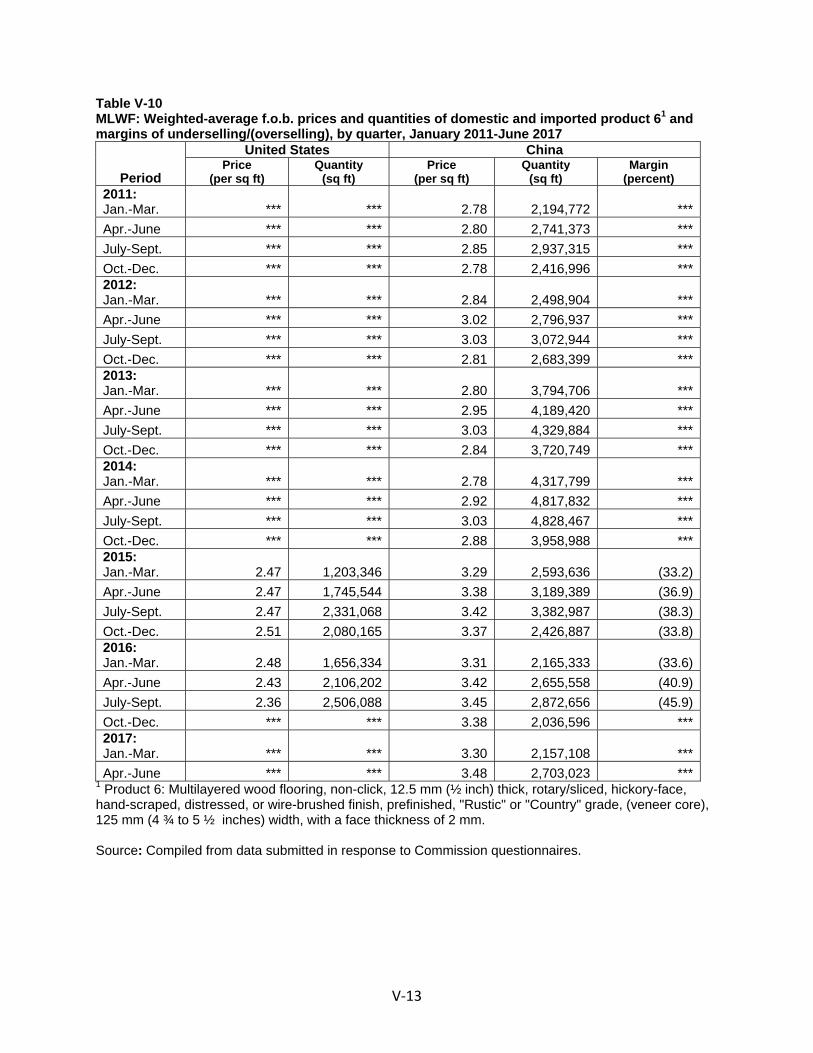
V‐13
Table V-10 MLWF: Weighted-average f.o.b. prices and quantities of domestic and imported product 61 and margins of underselling/(overselling), by quarter, January 2011-June 2017
Period
United States China Price
(per sq ft) Quantity
(sq ft) Price
(per sq ft) Quantity
(sq ft) Margin
(percent) 2011: Jan.-Mar. *** *** 2.78 2,194,772 ***Apr.-June *** *** 2.80 2,741,373 ***July-Sept. *** *** 2.85 2,937,315 ***Oct.-Dec. *** *** 2.78 2,416,996 ***2012: Jan.-Mar. *** *** 2.84 2,498,904 ***Apr.-June *** *** 3.02 2,796,937 ***July-Sept. *** *** 3.03 3,072,944 ***Oct.-Dec. *** *** 2.81 2,683,399 ***2013: Jan.-Mar. *** *** 2.80 3,794,706 ***Apr.-June *** *** 2.95 4,189,420 ***July-Sept. *** *** 3.03 4,329,884 ***Oct.-Dec. *** *** 2.84 3,720,749 ***2014: Jan.-Mar. *** *** 2.78 4,317,799 ***Apr.-June *** *** 2.92 4,817,832 ***July-Sept. *** *** 3.03 4,828,467 ***Oct.-Dec. *** *** 2.88 3,958,988 ***2015: Jan.-Mar. 2.47 1,203,346 3.29 2,593,636 (33.2)Apr.-June 2.47 1,745,544 3.38 3,189,389 (36.9)July-Sept. 2.47 2,331,068 3.42 3,382,987 (38.3)Oct.-Dec. 2.51 2,080,165 3.37 2,426,887 (33.8)2016: Jan.-Mar. 2.48 1,656,334 3.31 2,165,333 (33.6)Apr.-June 2.43 2,106,202 3.42 2,655,558 (40.9)July-Sept. 2.36 2,506,088 3.45 2,872,656 (45.9)Oct.-Dec. *** *** 3.38 2,036,596 ***2017: Jan.-Mar. *** *** 3.30 2,157,108 ***Apr.-June *** *** 3.48 2,703,023 ***
1 Product 6: Multilayered wood flooring, non-click, 12.5 mm (½ inch) thick, rotary/sliced, hickory-face, hand-scraped, distressed, or wire-brushed finish, prefinished, "Rustic" or "Country" grade, (veneer core), 125 mm (4 ¾ to 5 ½ inches) width, with a face thickness of 2 mm. Source: Compiled from data submitted in response to Commission questionnaires.
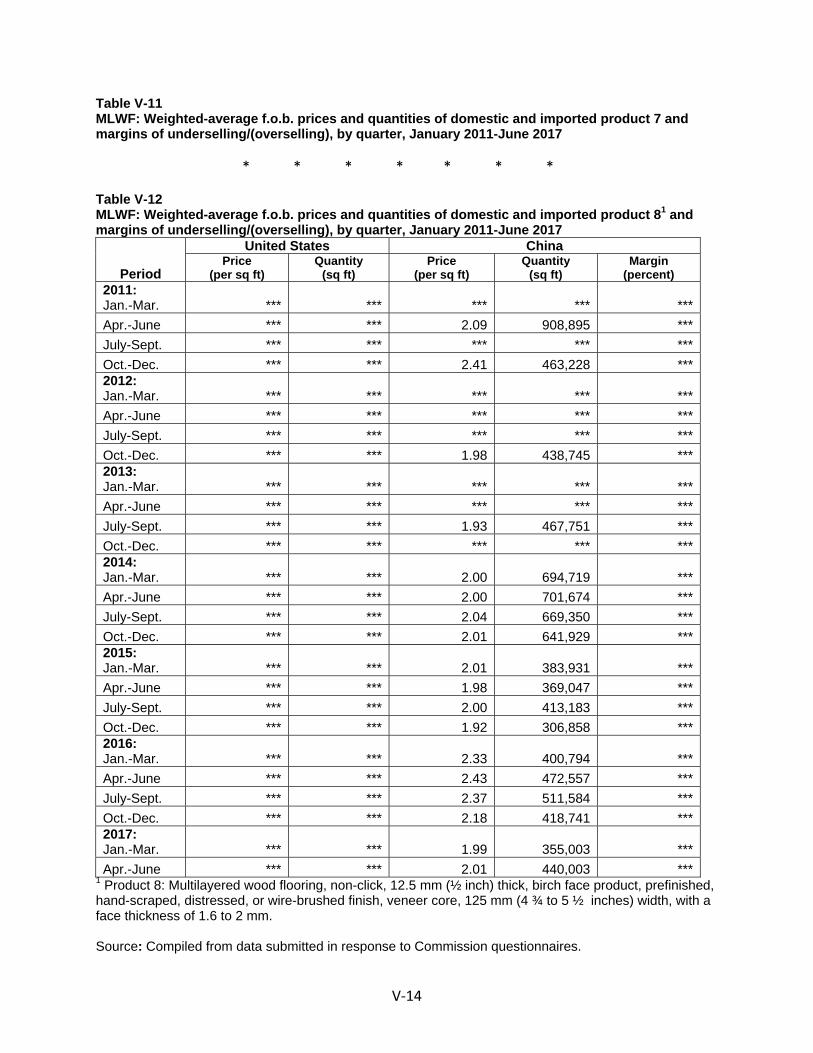
V‐14
Table V-11 MLWF: Weighted-average f.o.b. prices and quantities of domestic and imported product 7 and margins of underselling/(overselling), by quarter, January 2011-June 2017
* * * * * * * Table V-12 MLWF: Weighted-average f.o.b. prices and quantities of domestic and imported product 81 and margins of underselling/(overselling), by quarter, January 2011-June 2017
Period
United States China Price
(per sq ft) Quantity
(sq ft) Price
(per sq ft) Quantity
(sq ft) Margin
(percent) 2011: Jan.-Mar. *** *** *** *** ***Apr.-June *** *** 2.09 908,895 ***July-Sept. *** *** *** *** ***Oct.-Dec. *** *** 2.41 463,228 ***2012: Jan.-Mar. *** *** *** *** ***Apr.-June *** *** *** *** ***July-Sept. *** *** *** *** ***Oct.-Dec. *** *** 1.98 438,745 ***2013: Jan.-Mar. *** *** *** *** ***Apr.-June *** *** *** *** ***July-Sept. *** *** 1.93 467,751 ***Oct.-Dec. *** *** *** *** ***2014: Jan.-Mar. *** *** 2.00 694,719 ***Apr.-June *** *** 2.00 701,674 ***July-Sept. *** *** 2.04 669,350 ***Oct.-Dec. *** *** 2.01 641,929 ***2015: Jan.-Mar. *** *** 2.01 383,931 ***Apr.-June *** *** 1.98 369,047 ***July-Sept. *** *** 2.00 413,183 ***Oct.-Dec. *** *** 1.92 306,858 ***2016: Jan.-Mar. *** *** 2.33 400,794 ***Apr.-June *** *** 2.43 472,557 ***July-Sept. *** *** 2.37 511,584 ***Oct.-Dec. *** *** 2.18 418,741 ***2017: Jan.-Mar. *** *** 1.99 355,003 ***Apr.-June *** *** 2.01 440,003 ***
1 Product 8: Multilayered wood flooring, non-click, 12.5 mm (½ inch) thick, birch face product, prefinished, hand-scraped, distressed, or wire-brushed finish, veneer core, 125 mm (4 ¾ to 5 ½ inches) width, with a face thickness of 1.6 to 2 mm. Source: Compiled from data submitted in response to Commission questionnaires.
V‐15
Figure V-2 MLWF: Weighted-average prices and quantities of domestic and imported product 1, by quarter, January 2011-June 2017
* * * * * * * Figure V-3 MLWF: Weighted-average prices and quantities of domestic and imported product 2, by quarter, January 2011-June 2017
* * * * * * *
Figure V-4 MLWF: Weighted-average prices and quantities of domestic and imported product 3, by quarter, January 2011-June 2017
* * * * * * *
Figure V-5 MLWF: Weighted-average prices and quantities of domestic and imported product 4, by quarter, January 2011-June 2017
* * * * * * *
Figure V-6 MLWF: Weighted-average prices and quantities of domestic and imported product 5, by quarter, January 2011-June 2017
* * * * * * *
Figure V-7 MLWF: Weighted-average prices and quantities of domestic and imported product 6, by quarter, January 2011-June 2017
* * * * * * *
Figure V-8 MLWF: Weighted-average prices and quantities of domestic and imported product 7, by quarter, January 2011-June 2017
* * * * * * * Figure V-9 MLWF: Weighted-average prices and quantities of domestic and imported product 8, by quarter, January 2011-June 2017
* * * * * * *
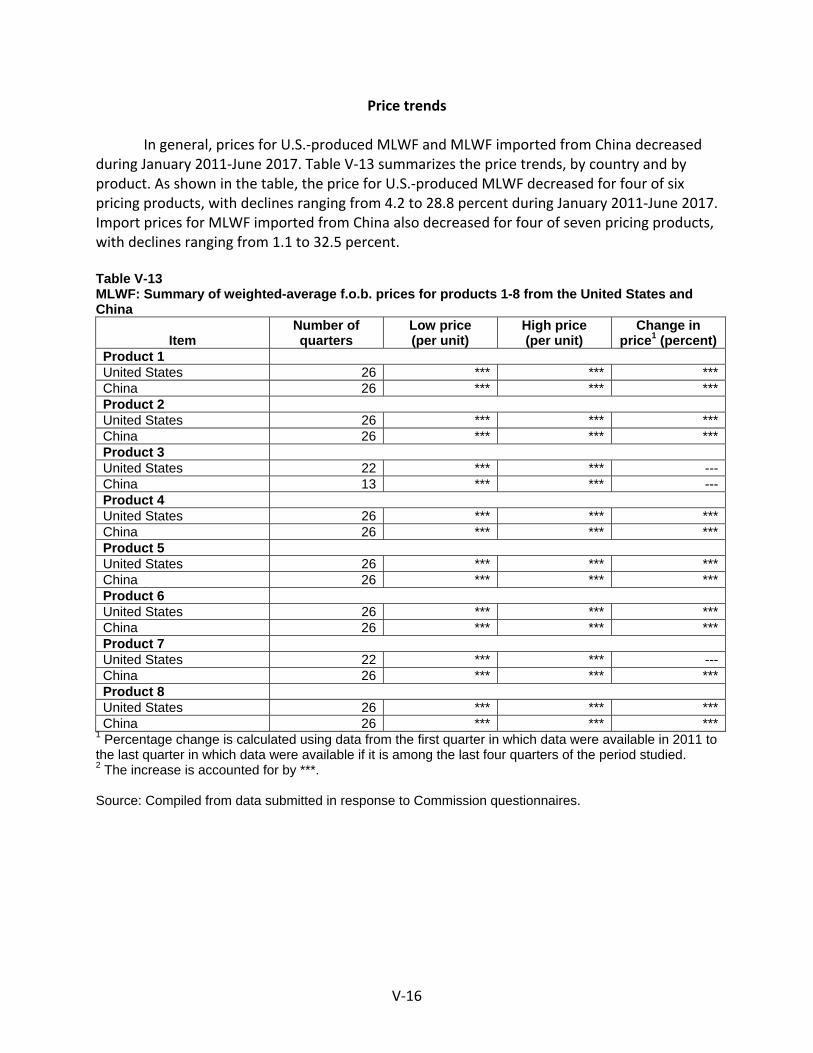
V‐16
Price trends
In general, prices for U.S.‐produced MLWF and MLWF imported from China decreased during January 2011‐June 2017. Table V‐13 summarizes the price trends, by country and by product. As shown in the table, the price for U.S.‐produced MLWF decreased for four of six pricing products, with declines ranging from 4.2 to 28.8 percent during January 2011‐June 2017. Import prices for MLWF imported from China also decreased for four of seven pricing products, with declines ranging from 1.1 to 32.5 percent.
Table V-13 MLWF: Summary of weighted-average f.o.b. prices for products 1-8 from the United States and China
Item Number of quarters
Low price (per unit)
High price (per unit)
Change in price1 (percent)
Product 1 United States 26 *** *** ***China 26 *** *** ***Product 2 United States 26 *** *** ***China 26 *** *** ***Product 3 United States 22 *** *** ---China 13 *** *** ---Product 4 United States 26 *** *** ***China 26 *** *** ***Product 5 United States 26 *** *** ***China 26 *** *** ***Product 6 United States 26 *** *** ***China 26 *** *** ***Product 7 United States 22 *** *** ---China 26 *** *** ***Product 8 United States 26 *** *** ***China 26 *** *** ***
1 Percentage change is calculated using data from the first quarter in which data were available in 2011 to the last quarter in which data were available if it is among the last four quarters of the period studied. 2 The increase is accounted for by ***. Source: Compiled from data submitted in response to Commission questionnaires.
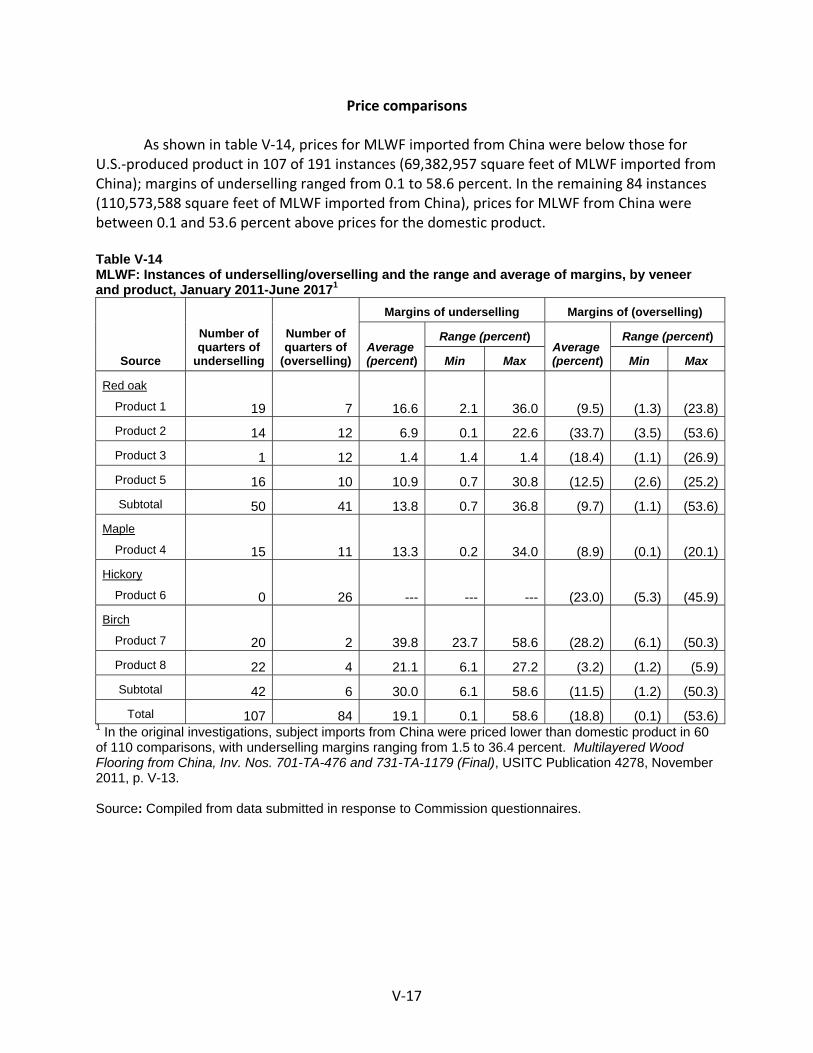
V‐17
Price comparisons
As shown in table V‐14, prices for MLWF imported from China were below those for U.S.‐produced product in 107 of 191 instances (69,382,957 square feet of MLWF imported from China); margins of underselling ranged from 0.1 to 58.6 percent. In the remaining 84 instances (110,573,588 square feet of MLWF imported from China), prices for MLWF from China were between 0.1 and 53.6 percent above prices for the domestic product.
Table V-14 MLWF: Instances of underselling/overselling and the range and average of margins, by veneer and product, January 2011-June 20171
Source
Number of quarters of
underselling
Number of quarters of
(overselling)
Margins of underselling Margins of (overselling)
Average (percent)
Range (percent) Average (percent)
Range (percent)
Min Max Min Max
Red oak
Product 1 19 7 16.6 2.1 36.0 (9.5) (1.3) (23.8)Product 2 14 12 6.9 0.1 22.6 (33.7) (3.5) (53.6)Product 3 1 12 1.4 1.4 1.4 (18.4) (1.1) (26.9)Product 5 16 10 10.9 0.7 30.8 (12.5) (2.6) (25.2)Subtotal 50 41 13.8 0.7 36.8 (9.7) (1.1) (53.6)
Maple
Product 4 15 11 13.3 0.2 34.0 (8.9) (0.1) (20.1)Hickory
Product 6 0 26 --- --- --- (23.0) (5.3) (45.9)Birch
Product 7 20 2 39.8 23.7 58.6 (28.2) (6.1) (50.3)Product 8 22 4 21.1 6.1 27.2 (3.2) (1.2) (5.9)Subtotal 42 6 30.0 6.1 58.6 (11.5) (1.2) (50.3)
Total 107 84 19.1 0.1 58.6 (18.8) (0.1) (53.6)1 In the original investigations, subject imports from China were priced lower than domestic product in 60 of 110 comparisons, with underselling margins ranging from 1.5 to 36.4 percent. Multilayered Wood Flooring from China, Inv. Nos. 701-TA-476 and 731-TA-1179 (Final), USITC Publication 4278, November 2011, p. V-13. Source: Compiled from data submitted in response to Commission questionnaires.
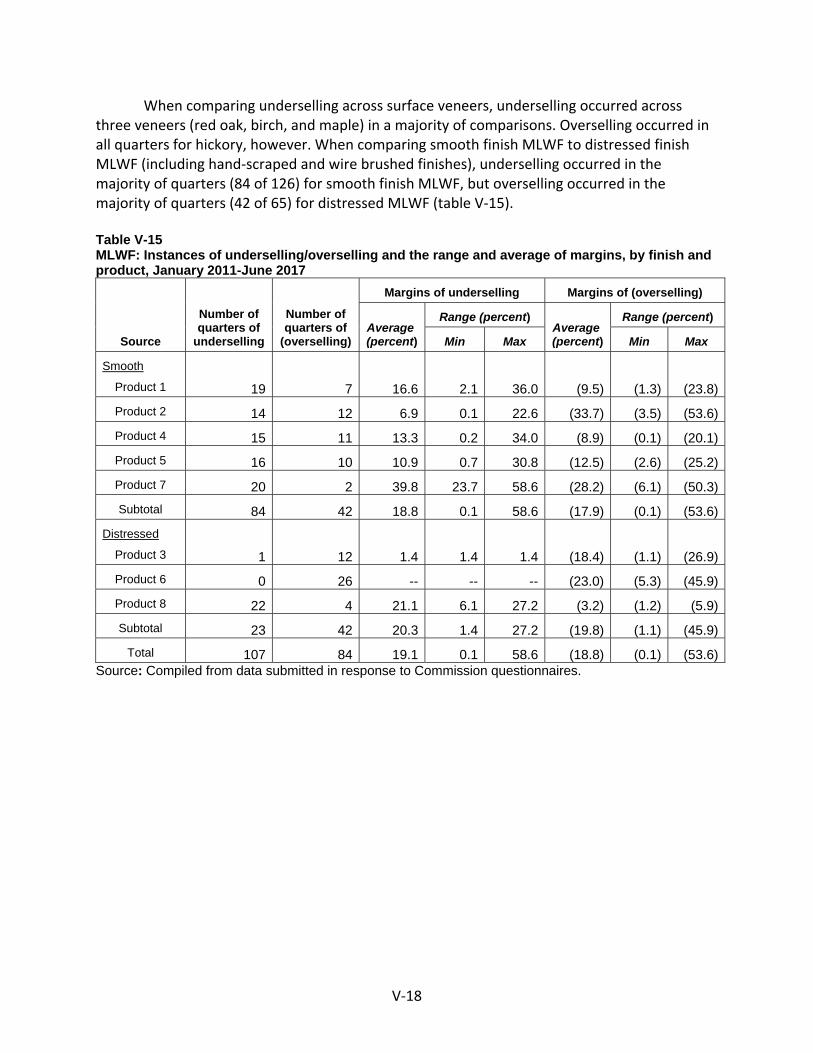
V‐18
When comparing underselling across surface veneers, underselling occurred across three veneers (red oak, birch, and maple) in a majority of comparisons. Overselling occurred in all quarters for hickory, however. When comparing smooth finish MLWF to distressed finish MLWF (including hand‐scraped and wire brushed finishes), underselling occurred in the majority of quarters (84 of 126) for smooth finish MLWF, but overselling occurred in the majority of quarters (42 of 65) for distressed MLWF (table V‐15).
Table V-15 MLWF: Instances of underselling/overselling and the range and average of margins, by finish and product, January 2011-June 2017
Source
Number of quarters of
underselling
Number of quarters of
(overselling)
Margins of underselling Margins of (overselling)
Average (percent)
Range (percent) Average (percent)
Range (percent)
Min Max Min Max
Smooth
Product 1 19 7 16.6 2.1 36.0 (9.5) (1.3) (23.8)Product 2 14 12 6.9 0.1 22.6 (33.7) (3.5) (53.6)Product 4 15 11 13.3 0.2 34.0 (8.9) (0.1) (20.1)Product 5 16 10 10.9 0.7 30.8 (12.5) (2.6) (25.2)Product 7 20 2 39.8 23.7 58.6 (28.2) (6.1) (50.3)Subtotal 84 42 18.8 0.1 58.6 (17.9) (0.1) (53.6)
Distressed
Product 3 1 12 1.4 1.4 1.4 (18.4) (1.1) (26.9)Product 6 0 26 -- -- -- (23.0) (5.3) (45.9)Product 8 22 4 21.1 6.1 27.2 (3.2) (1.2) (5.9)Subtotal 23 42 20.3 1.4 27.2 (19.8) (1.1) (45.9)
Total 107 84 19.1 0.1 58.6 (18.8) (0.1) (53.6)Source: Compiled from data submitted in response to Commission questionnaires.
V‐19
Purchasers’ perceptions of relative price trends
Purchasers were asked how the prices of MLWF from the United States had changed relative to the prices of MLWF from China since 2011. A slight majority (15 of 26) of the responding purchasers indicated that relative prices had changed: 11 stated that the U.S. prices have become relatively higher, compared with 4 purchasers that stated that U.S. prices have become relatively lower. Only three of 26 responding purchasers reported that there had been no change in price, while eight reported that domestic prices and prices of MLWF imported from China changed by the same amount.
Foreign producers’ perceptions of home market and relative prices
Foreign producers were asked how the prices of MLWF in the United States compare to
those in China. Five foreign producers reported that prices in the two countries are the same or similar, one reported that its home market prices were higher, one reported that its home market prices were lower, and one reported there was no clear trend.
When asked to describe their home market, including the number of and competition between firms, foreign producers reported highly variable perspectives. Responses ranged from “We have just developed the home market. There is no competition,” to “There are thousands of producers, and competition is fierce for new products or price.” Another foreign producer reported that there are numerous producers, but the market is mostly controlled by mid‐end local players and high‐end importers.9 In their home market, the foreign producers reported facing competition in MLWF from product imported from European countries (including Denmark, France, Germany, Italy, and Switzerland), Southeast Asian countries, and the United States.
9 Responses to USITC’s foreign producer questionnaires of ***.

A-1
APPENDIX A
FEDERAL REGISTER NOTICES

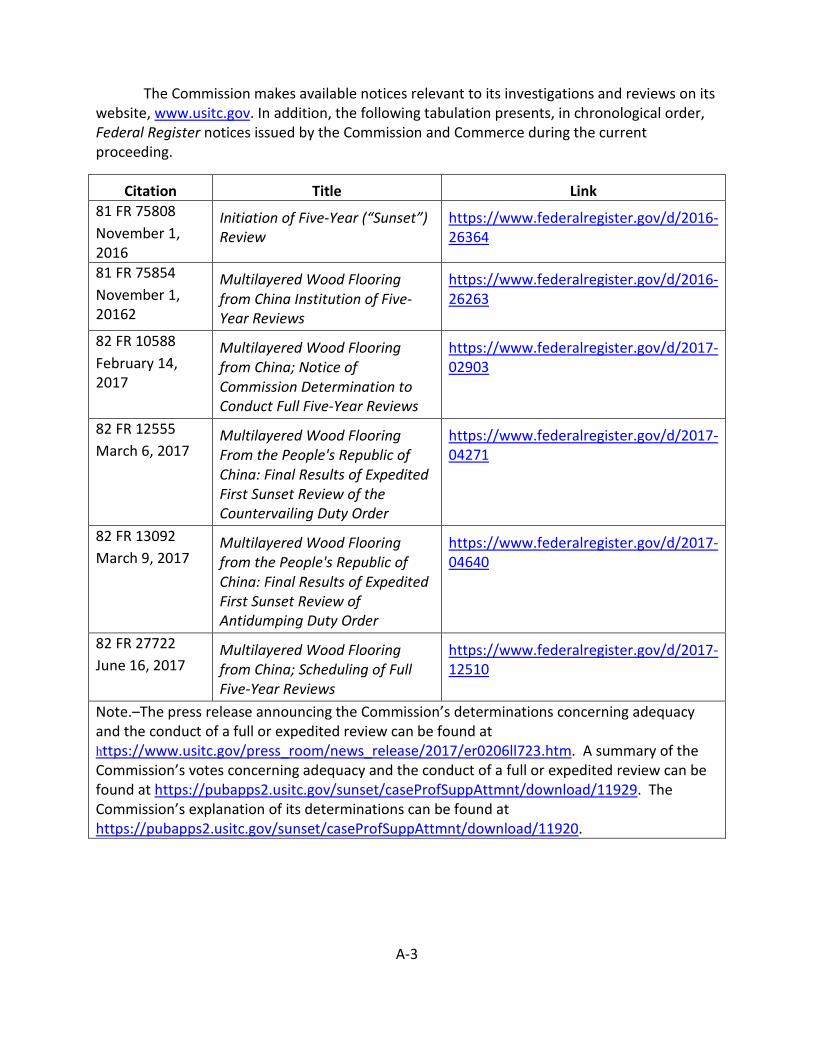
A-3
The Commission makes available notices relevant to its investigations and reviews on its website, www.usitc.gov. In addition, the following tabulation presents, in chronological order, Federal Register notices issued by the Commission and Commerce during the current proceeding.
Citation Title Link 81 FR 75808 November 1, 2016
Initiation of Five-Year (“Sunset”) Review
https://www.federalregister.gov/d/2016-26364
81 FR 75854 November 1, 20162
Multilayered Wood Flooring from China Institution of Five-Year Reviews
https://www.federalregister.gov/d/2016-26263
82 FR 10588 February 14, 2017
Multilayered Wood Flooring from China; Notice of Commission Determination to Conduct Full Five-Year Reviews
https://www.federalregister.gov/d/2017-02903
82 FR 12555 March 6, 2017
Multilayered Wood Flooring From the People's Republic of China: Final Results of Expedited First Sunset Review of the Countervailing Duty Order
https://www.federalregister.gov/d/2017-04271
82 FR 13092 March 9, 2017
Multilayered Wood Flooring from the People's Republic of China: Final Results of Expedited First Sunset Review of Antidumping Duty Order
https://www.federalregister.gov/d/2017-04640
82 FR 27722 June 16, 2017
Multilayered Wood Flooring from China; Scheduling of Full Five-Year Reviews
https://www.federalregister.gov/d/2017-12510
Note.–The press release announcing the Commission’s determinations concerning adequacy and the conduct of a full or expedited review can be found at https://www.usitc.gov/press_room/news_release/2017/er0206ll723.htm. A summary of the Commission’s votes concerning adequacy and the conduct of a full or expedited review can be found at https://pubapps2.usitc.gov/sunset/caseProfSuppAttmnt/download/11929. The Commission’s explanation of its determinations can be found at https://pubapps2.usitc.gov/sunset/caseProfSuppAttmnt/download/11920.

B-1
APPENDIX B
LIST OF HEARING WITNESSES

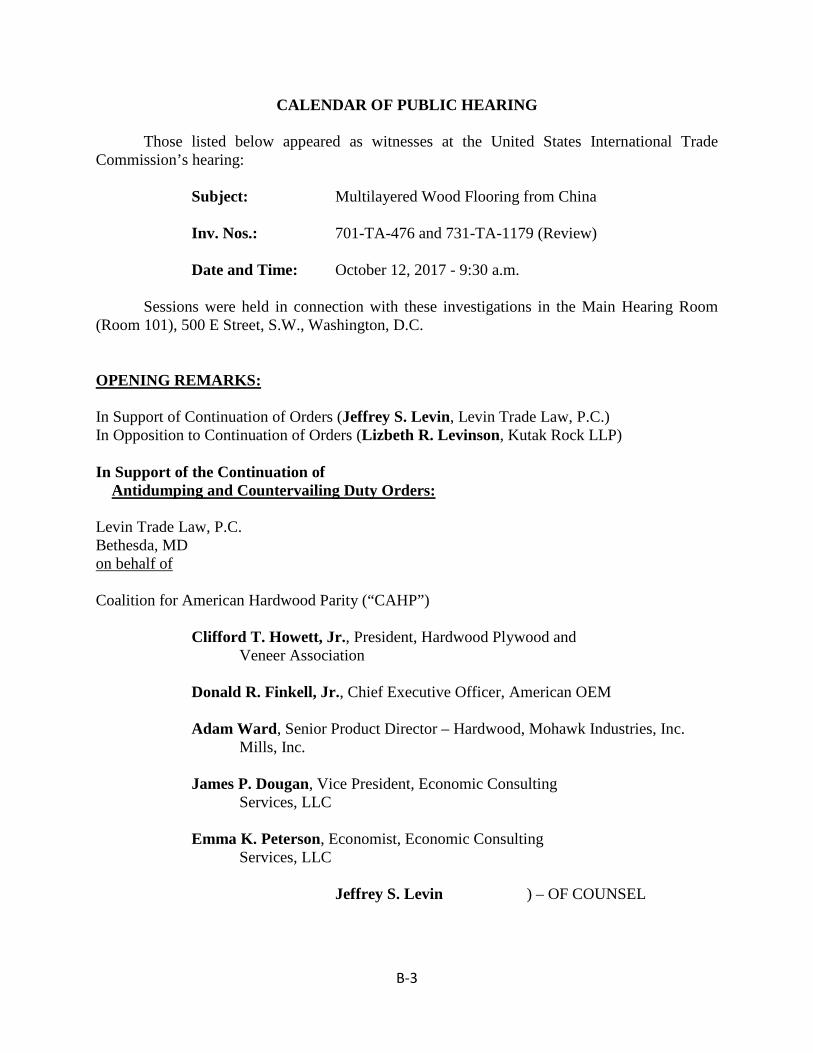
B-3
CALENDAR OF PUBLIC HEARING Those listed below appeared as witnesses at the United States International Trade Commission’s hearing: Subject: Multilayered Wood Flooring from China Inv. Nos.: 701-TA-476 and 731-TA-1179 (Review) Date and Time: October 12, 2017 - 9:30 a.m. Sessions were held in connection with these investigations in the Main Hearing Room (Room 101), 500 E Street, S.W., Washington, D.C. OPENING REMARKS: In Support of Continuation of Orders (Jeffrey S. Levin, Levin Trade Law, P.C.) In Opposition to Continuation of Orders (Lizbeth R. Levinson, Kutak Rock LLP) In Support of the Continuation of Antidumping and Countervailing Duty Orders: Levin Trade Law, P.C. Bethesda, MD on behalf of Coalition for American Hardwood Parity (“CAHP”) Clifford T. Howett, Jr., President, Hardwood Plywood and Veneer Association Donald R. Finkell, Jr., Chief Executive Officer, American OEM Adam Ward, Senior Product Director – Hardwood, Mohawk Industries, Inc. Mills, Inc. James P. Dougan, Vice President, Economic Consulting Services, LLC Emma K. Peterson, Economist, Economic Consulting Services, LLC Jeffrey S. Levin ) – OF COUNSEL
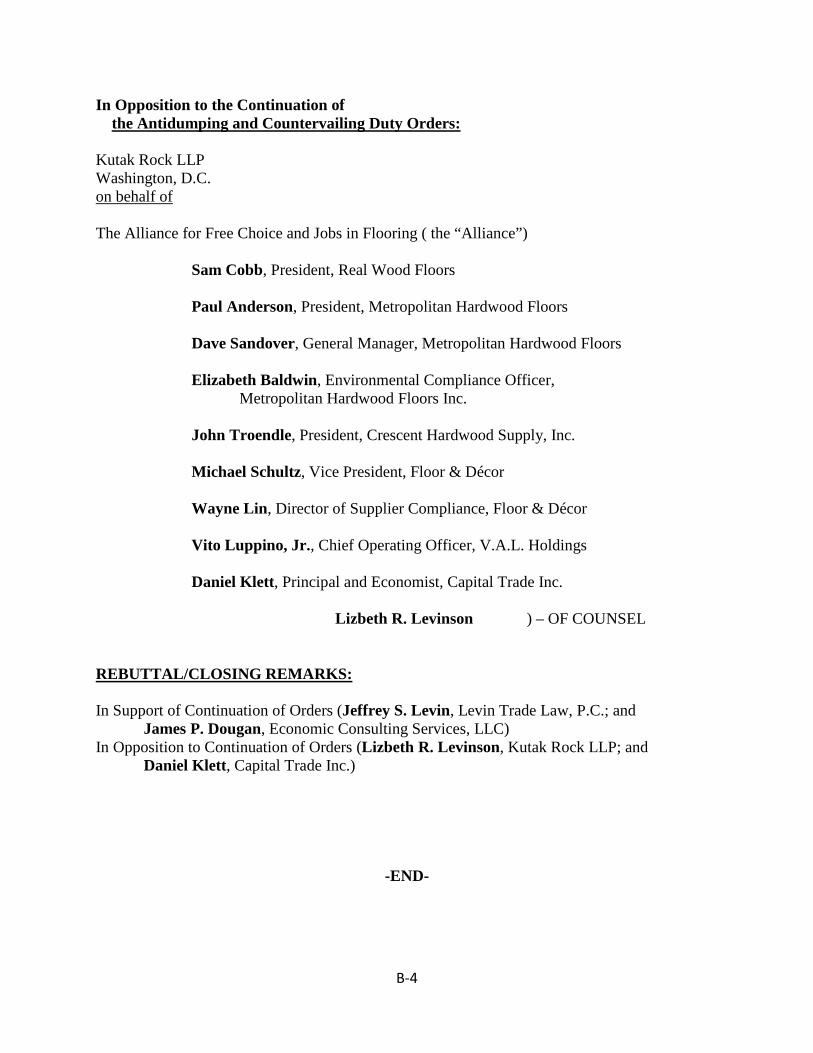
B-4
In Opposition to the Continuation of the Antidumping and Countervailing Duty Orders: Kutak Rock LLP Washington, D.C. on behalf of The Alliance for Free Choice and Jobs in Flooring ( the “Alliance”) Sam Cobb, President, Real Wood Floors Paul Anderson, President, Metropolitan Hardwood Floors
Dave Sandover, General Manager, Metropolitan Hardwood Floors Elizabeth Baldwin, Environmental Compliance Officer, Metropolitan Hardwood Floors Inc. John Troendle, President, Crescent Hardwood Supply, Inc.
Michael Schultz, Vice President, Floor & Décor Wayne Lin, Director of Supplier Compliance, Floor & Décor
Vito Luppino, Jr., Chief Operating Officer, V.A.L. Holdings
Daniel Klett, Principal and Economist, Capital Trade Inc. Lizbeth R. Levinson ) – OF COUNSEL REBUTTAL/CLOSING REMARKS: In Support of Continuation of Orders (Jeffrey S. Levin, Levin Trade Law, P.C.; and James P. Dougan, Economic Consulting Services, LLC) In Opposition to Continuation of Orders (Lizbeth R. Levinson, Kutak Rock LLP; and Daniel Klett, Capital Trade Inc.)
-END-
C-1
APPENDIX C
SUMMARY DATA

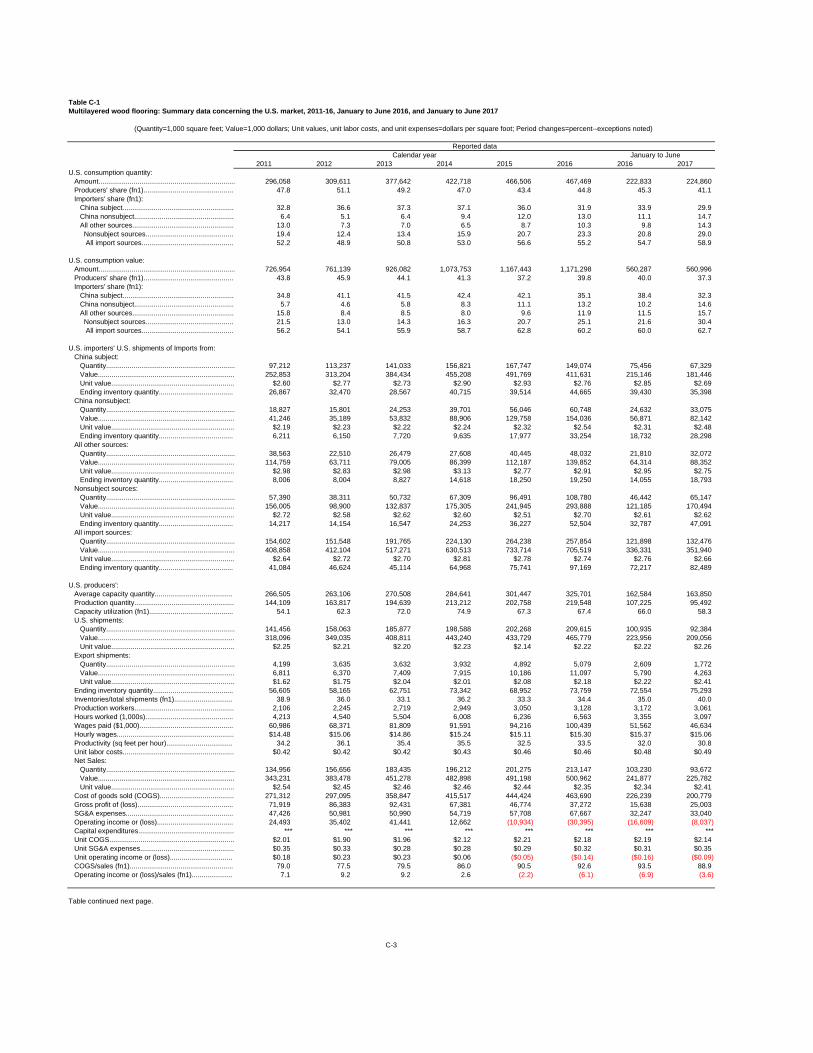
Table C-1Multilayered wood flooring: Summary data concerning the U.S. market, 2011-16, January to June 2016, and January to June 2017
2011 2012 2013 2014 2015 2016 2016 2017U.S. consumption quantity:
Amount...................................................................... 296,058 309,611 377,642 422,718 466,506 467,469 222,833 224,860Producers' share (fn1).............................................. 47.8 51.1 49.2 47.0 43.4 44.8 45.3 41.1Importers' share (fn1):
China subject......................................................... 32.8 36.6 37.3 37.1 36.0 31.9 33.9 29.9China nonsubject................................................... 6.4 5.1 6.4 9.4 12.0 13.0 11.1 14.7All other sources.................................................... 13.0 7.3 7.0 6.5 8.7 10.3 9.8 14.3 Nonsubject sources............................................. 19.4 12.4 13.4 15.9 20.7 23.3 20.8 29.0
All import sources............................................... 52.2 48.9 50.8 53.0 56.6 55.2 54.7 58.9
U.S. consumption value:Amount...................................................................... 726,954 761,139 926,082 1,073,753 1,167,443 1,171,298 560,287 560,996Producers' share (fn1).............................................. 43.8 45.9 44.1 41.3 37.2 39.8 40.0 37.3Importers' share (fn1):
China subject......................................................... 34.8 41.1 41.5 42.4 42.1 35.1 38.4 32.3China nonsubject................................................... 5.7 4.6 5.8 8.3 11.1 13.2 10.2 14.6All other sources.................................................... 15.8 8.4 8.5 8.0 9.6 11.9 11.5 15.7 Nonsubject sources............................................. 21.5 13.0 14.3 16.3 20.7 25.1 21.6 30.4
All import sources............................................... 56.2 54.1 55.9 58.7 62.8 60.2 60.0 62.7
U.S. importers' U.S. shipments of Imports from:China subject:
Quantity.................................................................. 97,212 113,237 141,033 156,821 167,747 149,074 75,456 67,329Value...................................................................... 252,853 313,204 384,434 455,208 491,769 411,631 215,146 181,446Unit value............................................................... $2.60 $2.77 $2.73 $2.90 $2.93 $2.76 $2.85 $2.69Ending inventory quantity...................................... 26,867 32,470 28,567 40,715 39,514 44,665 39,430 35,398
China nonsubject:Quantity.................................................................. 18,827 15,801 24,253 39,701 56,046 60,748 24,632 33,075Value...................................................................... 41,246 35,189 53,832 88,906 129,758 154,036 56,871 82,142Unit value............................................................... $2.19 $2.23 $2.22 $2.24 $2.32 $2.54 $2.31 $2.48Ending inventory quantity...................................... 6,211 6,150 7,720 9,635 17,977 33,254 18,732 28,298
All other sources:Quantity.................................................................. 38,563 22,510 26,479 27,608 40,445 48,032 21,810 32,072Value...................................................................... 114,759 63,711 79,005 86,399 112,187 139,852 64,314 88,352Unit value............................................................... $2.98 $2.83 $2.98 $3.13 $2.77 $2.91 $2.95 $2.75Ending inventory quantity...................................... 8,006 8,004 8,827 14,618 18,250 19,250 14,055 18,793
Nonsubject sources:Quantity.................................................................. 57,390 38,311 50,732 67,309 96,491 108,780 46,442 65,147Value...................................................................... 156,005 98,900 132,837 175,305 241,945 293,888 121,185 170,494Unit value............................................................... $2.72 $2.58 $2.62 $2.60 $2.51 $2.70 $2.61 $2.62Ending inventory quantity...................................... 14,217 14,154 16,547 24,253 36,227 52,504 32,787 47,091
All import sources:Quantity.................................................................. 154,602 151,548 191,765 224,130 264,238 257,854 121,898 132,476Value...................................................................... 408,858 412,104 517,271 630,513 733,714 705,519 336,331 351,940Unit value............................................................... $2.64 $2.72 $2.70 $2.81 $2.78 $2.74 $2.76 $2.66Ending inventory quantity...................................... 41,084 46,624 45,114 64,968 75,741 97,169 72,217 82,489
U.S. producers':Average capacity quantity........................................ 266,505 263,106 270,508 284,641 301,447 325,701 162,584 163,850Production quantity................................................... 144,109 163,817 194,639 213,212 202,758 219,548 107,225 95,492Capacity utilization (fn1)........................................... 54.1 62.3 72.0 74.9 67.3 67.4 66.0 58.3U.S. shipments:
Quantity.................................................................. 141,456 158,063 185,877 198,588 202,268 209,615 100,935 92,384Value...................................................................... 318,096 349,035 408,811 443,240 433,729 465,779 223,956 209,056Unit value............................................................... $2.25 $2.21 $2.20 $2.23 $2.14 $2.22 $2.22 $2.26
Export shipments:Quantity.................................................................. 4,199 3,635 3,632 3,932 4,892 5,079 2,609 1,772Value...................................................................... 6,811 6,370 7,409 7,915 10,186 11,097 5,790 4,263Unit value............................................................... $1.62 $1.75 $2.04 $2.01 $2.08 $2.18 $2.22 $2.41
Ending inventory quantity......................................... 56,605 58,165 62,751 73,342 68,952 73,759 72,554 75,293Inventories/total shipments (fn1).............................. 38.9 36.0 33.1 36.2 33.3 34.4 35.0 40.0Production workers................................................... 2,106 2,245 2,719 2,949 3,050 3,128 3,172 3,061Hours worked (1,000s)............................................. 4,213 4,540 5,504 6,008 6,236 6,563 3,355 3,097Wages paid ($1,000)................................................ 60,986 68,371 81,809 91,591 94,216 100,439 51,562 46,634Hourly wages............................................................ $14.48 $15.06 $14.86 $15.24 $15.11 $15.30 $15.37 $15.06Productivity (sq feet per hour).................................. 34.2 36.1 35.4 35.5 32.5 33.5 32.0 30.8Unit labor costs......................................................... $0.42 $0.42 $0.42 $0.43 $0.46 $0.46 $0.48 $0.49Net Sales:
Quantity.................................................................. 134,956 156,656 183,435 196,212 201,275 213,147 103,230 93,672Value...................................................................... 343,231 383,478 451,278 482,898 491,198 500,962 241,877 225,782Unit value............................................................... $2.54 $2.45 $2.46 $2.46 $2.44 $2.35 $2.34 $2.41
Cost of goods sold (COGS)...................................... 271,312 297,095 358,847 415,517 444,424 463,690 226,239 200,779Gross profit of (loss)................................................. 71,919 86,383 92,431 67,381 46,774 37,272 15,638 25,003SG&A expenses....................................................... 47,426 50,981 50,990 54,719 57,708 67,667 32,247 33,040Operating income or (loss)....................................... 24,493 35,402 41,441 12,662 (10,934) (30,395) (16,609) (8,037)Capital expenditures................................................. *** *** *** *** *** *** *** ***Unit COGS................................................................ $2.01 $1.90 $1.96 $2.12 $2.21 $2.18 $2.19 $2.14Unit SG&A expenses................................................ $0.35 $0.33 $0.28 $0.28 $0.29 $0.32 $0.31 $0.35Unit operating income or (loss)................................ $0.18 $0.23 $0.23 $0.06 ($0.05) ($0.14) ($0.16) ($0.09)COGS/sales (fn1)..................................................... 79.0 77.5 79.5 86.0 90.5 92.6 93.5 88.9Operating income or (loss)/sales (fn1)..................... 7.1 9.2 9.2 2.6 (2.2) (6.1) (6.9) (3.6)
Table continued next page.
C-3
(Quantity=1,000 square feet; Value=1,000 dollars; Unit values, unit labor costs, and unit expenses=dollars per square foot; Period changes=percent--exceptions noted)
Reported dataCalendar year January to June
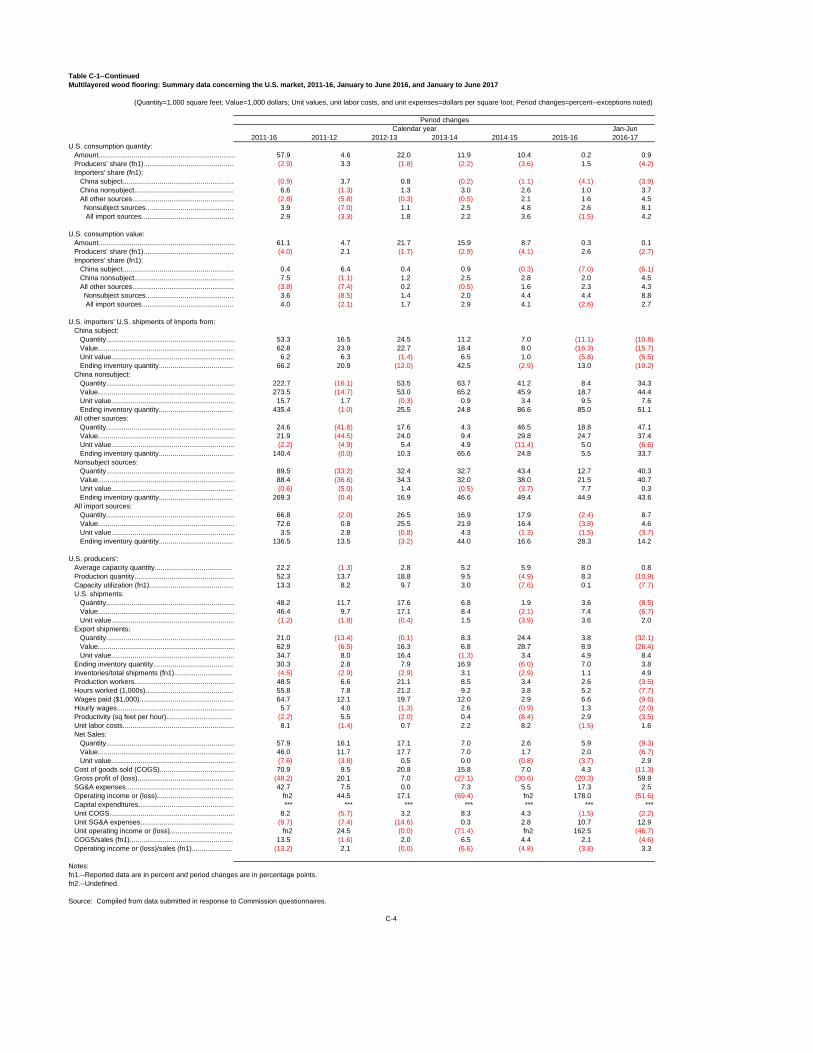
Table C-1--ContinuedMultilayered wood flooring: Summary data concerning the U.S. market, 2011-16, January to June 2016, and January to June 2017
Jan-Jun2011-16 2011-12 2012-13 2013-14 2014-15 2015-16 2016-17
U.S. consumption quantity:Amount...................................................................... 57.9 4.6 22.0 11.9 10.4 0.2 0.9Producers' share (fn1).............................................. (2.9) 3.3 (1.8) (2.2) (3.6) 1.5 (4.2)Importers' share (fn1):
China subject......................................................... (0.9) 3.7 0.8 (0.2) (1.1) (4.1) (3.9)China nonsubject................................................... 6.6 (1.3) 1.3 3.0 2.6 1.0 3.7All other sources.................................................... (2.8) (5.8) (0.3) (0.5) 2.1 1.6 4.5 Nonsubject sources............................................. 3.9 (7.0) 1.1 2.5 4.8 2.6 8.1
All import sources............................................... 2.9 (3.3) 1.8 2.2 3.6 (1.5) 4.2
U.S. consumption value:Amount...................................................................... 61.1 4.7 21.7 15.9 8.7 0.3 0.1Producers' share (fn1).............................................. (4.0) 2.1 (1.7) (2.9) (4.1) 2.6 (2.7)Importers' share (fn1):
China subject......................................................... 0.4 6.4 0.4 0.9 (0.3) (7.0) (6.1)China nonsubject................................................... 7.5 (1.1) 1.2 2.5 2.8 2.0 4.5All other sources.................................................... (3.8) (7.4) 0.2 (0.5) 1.6 2.3 4.3 Nonsubject sources............................................. 3.6 (8.5) 1.4 2.0 4.4 4.4 8.8
All import sources............................................... 4.0 (2.1) 1.7 2.9 4.1 (2.6) 2.7
U.S. importers' U.S. shipments of Imports from:China subject:
Quantity.................................................................. 53.3 16.5 24.5 11.2 7.0 (11.1) (10.8)Value...................................................................... 62.8 23.9 22.7 18.4 8.0 (16.3) (15.7)Unit value............................................................... 6.2 6.3 (1.4) 6.5 1.0 (5.8) (5.5)Ending inventory quantity...................................... 66.2 20.9 (12.0) 42.5 (2.9) 13.0 (10.2)
China nonsubject:Quantity.................................................................. 222.7 (16.1) 53.5 63.7 41.2 8.4 34.3Value...................................................................... 273.5 (14.7) 53.0 65.2 45.9 18.7 44.4Unit value............................................................... 15.7 1.7 (0.3) 0.9 3.4 9.5 7.6Ending inventory quantity...................................... 435.4 (1.0) 25.5 24.8 86.6 85.0 51.1
All other sources:Quantity.................................................................. 24.6 (41.6) 17.6 4.3 46.5 18.8 47.1Value...................................................................... 21.9 (44.5) 24.0 9.4 29.8 24.7 37.4Unit value............................................................... (2.2) (4.9) 5.4 4.9 (11.4) 5.0 (6.6)Ending inventory quantity...................................... 140.4 (0.0) 10.3 65.6 24.8 5.5 33.7
Nonsubject sources:Quantity.................................................................. 89.5 (33.2) 32.4 32.7 43.4 12.7 40.3Value...................................................................... 88.4 (36.6) 34.3 32.0 38.0 21.5 40.7Unit value............................................................... (0.6) (5.0) 1.4 (0.5) (3.7) 7.7 0.3Ending inventory quantity...................................... 269.3 (0.4) 16.9 46.6 49.4 44.9 43.6
All import sources:Quantity.................................................................. 66.8 (2.0) 26.5 16.9 17.9 (2.4) 8.7Value...................................................................... 72.6 0.8 25.5 21.9 16.4 (3.8) 4.6Unit value............................................................... 3.5 2.8 (0.8) 4.3 (1.3) (1.5) (3.7)Ending inventory quantity...................................... 136.5 13.5 (3.2) 44.0 16.6 28.3 14.2
U.S. producers':Average capacity quantity........................................ 22.2 (1.3) 2.8 5.2 5.9 8.0 0.8Production quantity................................................... 52.3 13.7 18.8 9.5 (4.9) 8.3 (10.9)Capacity utilization (fn1)........................................... 13.3 8.2 9.7 3.0 (7.6) 0.1 (7.7)U.S. shipments:
Quantity.................................................................. 48.2 11.7 17.6 6.8 1.9 3.6 (8.5)Value...................................................................... 46.4 9.7 17.1 8.4 (2.1) 7.4 (6.7)Unit value............................................................... (1.2) (1.8) (0.4) 1.5 (3.9) 3.6 2.0
Export shipments:Quantity.................................................................. 21.0 (13.4) (0.1) 8.3 24.4 3.8 (32.1)Value...................................................................... 62.9 (6.5) 16.3 6.8 28.7 8.9 (26.4)Unit value............................................................... 34.7 8.0 16.4 (1.3) 3.4 4.9 8.4
Ending inventory quantity......................................... 30.3 2.8 7.9 16.9 (6.0) 7.0 3.8Inventories/total shipments (fn1).............................. (4.5) (2.9) (2.9) 3.1 (2.9) 1.1 4.9Production workers................................................... 48.5 6.6 21.1 8.5 3.4 2.6 (3.5)Hours worked (1,000s)............................................. 55.8 7.8 21.2 9.2 3.8 5.2 (7.7)Wages paid ($1,000)................................................ 64.7 12.1 19.7 12.0 2.9 6.6 (9.6)Hourly wages............................................................ 5.7 4.0 (1.3) 2.6 (0.9) 1.3 (2.0)Productivity (sq feet per hour).................................. (2.2) 5.5 (2.0) 0.4 (8.4) 2.9 (3.5)Unit labor costs......................................................... 8.1 (1.4) 0.7 2.2 8.2 (1.5) 1.6Net Sales:
Quantity.................................................................. 57.9 16.1 17.1 7.0 2.6 5.9 (9.3)Value...................................................................... 46.0 11.7 17.7 7.0 1.7 2.0 (6.7)Unit value............................................................... (7.6) (3.8) 0.5 0.0 (0.8) (3.7) 2.9
Cost of goods sold (COGS)...................................... 70.9 9.5 20.8 15.8 7.0 4.3 (11.3)Gross profit of (loss)................................................. (48.2) 20.1 7.0 (27.1) (30.6) (20.3) 59.9SG&A expenses....................................................... 42.7 7.5 0.0 7.3 5.5 17.3 2.5Operating income or (loss)....................................... fn2 44.5 17.1 (69.4) fn2 178.0 (51.6)Capital expenditures................................................. *** *** *** *** *** *** ***Unit COGS................................................................ 8.2 (5.7) 3.2 8.3 4.3 (1.5) (2.2)Unit SG&A expenses................................................ (9.7) (7.4) (14.6) 0.3 2.8 10.7 12.9Unit operating income or (loss)................................ fn2 24.5 (0.0) (71.4) fn2 162.5 (46.7)COGS/sales (fn1)..................................................... 13.5 (1.6) 2.0 6.5 4.4 2.1 (4.6)Operating income or (loss)/sales (fn1)..................... (13.2) 2.1 (0.0) (6.6) (4.8) (3.8) 3.3
Notes:fn1.--Reported data are in percent and period changes are in percentage points.fn2.--Undefined.
Source: Compiled from data submitted in response to Commission questionnaires.
C-4
(Quantity=1,000 square feet; Value=1,000 dollars; Unit values, unit labor costs, and unit expenses=dollars per square foot; Period changes=percent--exceptions noted)
Period changesCalendar year
C-5
SUMMARY DATA FROM ORIGINAL INVESTIGATIONS

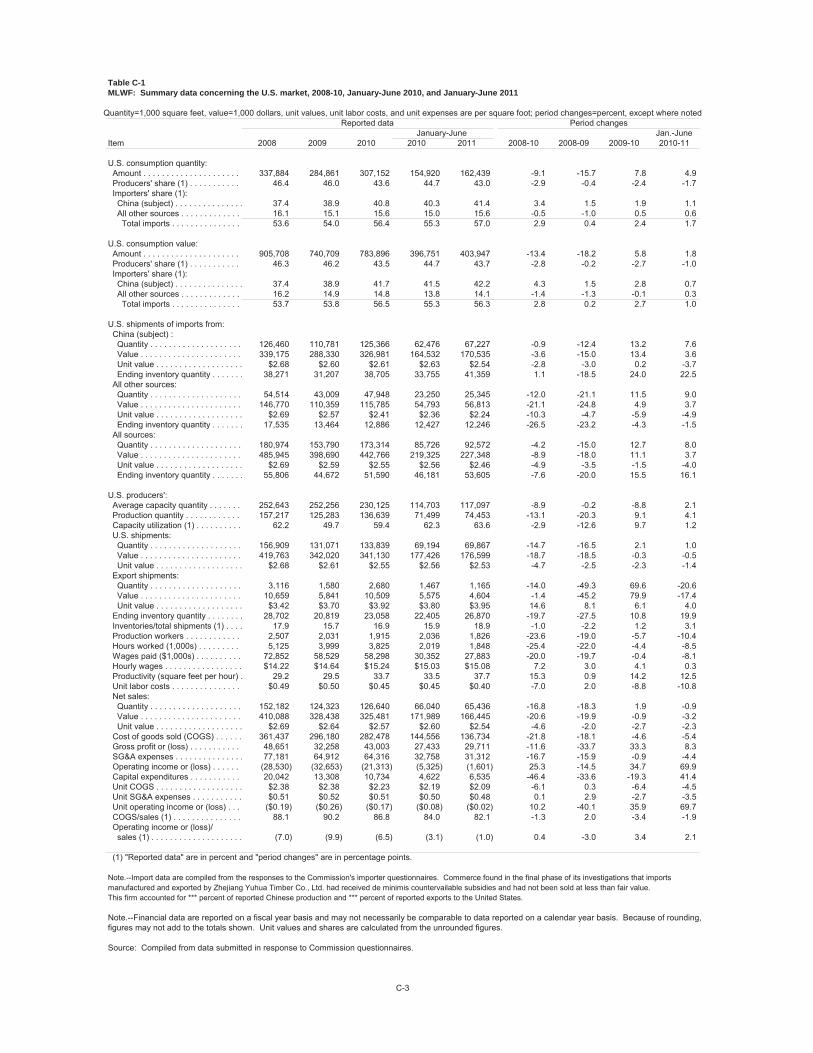
Table C-1MLWF: Summary data concerning the U.S. market, 2008-10, January-June 2010, and January-June 2011
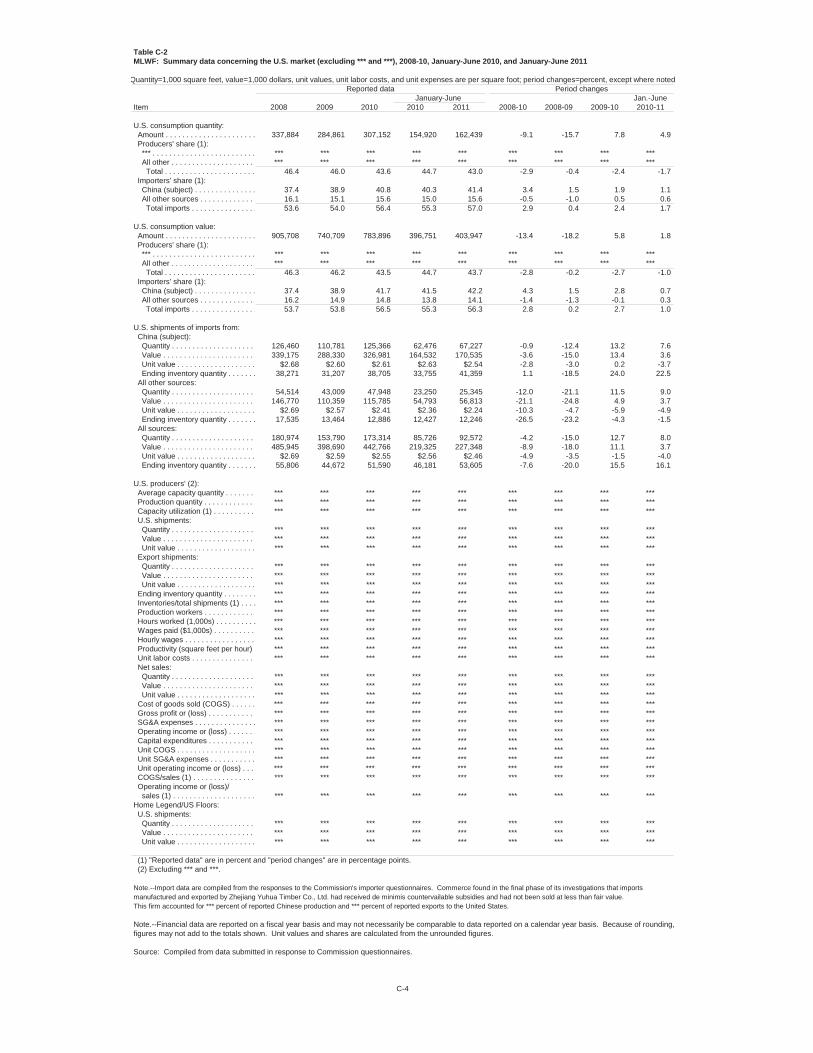
Table C-2MLWF: Summary data concerning the U.S. market (excluding *** and ***), 2008-10, January-June 2010, and January-June 2011
Quantity=1,000 square feet, value=1,000 dollars, unit values, unit labor costs, and unit expenses are per square foot; period changes=percent, except where notedReported data Period changes
January-June Jan.-JuneItem 2008 2009 2010 2010 2011 2008-10 2008-09 2009-10 2010-11
U.S. consumption quantity: Amount . . . . . . . . . . . . . . . . . . . . . . 337,884 284,861 307,152 154,920 162,439 -9.1 -15.7 7.8 4.9 Producers' share (1): *** . . . . . . . . . . . . . . . . . . . . . . . . . *** *** *** *** *** *** *** *** *** All other . . . . . . . . . . . . . . . . . . . . . *** *** *** *** *** *** *** *** *** Total . . . . . . . . . . . . . . . . . . . . . . 46.4 46.0 43.6 44.7 43.0 -2.9 -0.4 -2.4 -1.7 Importers' share (1): China (subject) . . . . . . . . . . . . . . . 37.4 38.9 40.8 40.3 41.4 3.4 1.5 1.9 1.1 All other sources . . . . . . . . . . . . . . 16.1 15.1 15.6 15.0 15.6 -0.5 -1.0 0.5 0.6 Total imports . . . . . . . . . . . . . . . . 53.6 54.0 56.4 55.3 57.0 2.9 0.4 2.4 1.7
U.S. consumption value: Amount . . . . . . . . . . . . . . . . . . . . . . 905,708 740,709 783,896 396,751 403,947 -13.4 -18.2 5.8 1.8 Producers' share (1): *** . . . . . . . . . . . . . . . . . . . . . . . . . *** *** *** *** *** *** *** *** *** All other . . . . . . . . . . . . . . . . . . . . . *** *** *** *** *** *** *** *** *** Total . . . . . . . . . . . . . . . . . . . . . . 46.3 46.2 43.5 44.7 43.7 -2.8 -0.2 -2.7 -1.0 Importers' share (1): China (subject) . . . . . . . . . . . . . . . 37.4 38.9 41.7 41.5 42.2 4.3 1.5 2.8 0.7 All other sources . . . . . . . . . . . . . . 16.2 14.9 14.8 13.8 14.1 -1.4 -1.3 -0.1 0.3 Total imports . . . . . . . . . . . . . . . . 53.7 53.8 56.5 55.3 56.3 2.8 0.2 2.7 1.0
U.S. shipments of imports from: China (subject): Quantity . . . . . . . . . . . . . . . . . . . . 126,460 110,781 125,366 62,476 67,227 -0.9 -12.4 13.2 7.6 Value . . . . . . . . . . . . . . . . . . . . . . . 339,175 288,330 326,981 164,532 170,535 -3.6 -15.0 13.4 3.6 Unit value . . . . . . . . . . . . . . . . . . . $2.68 $2.60 $2.61 $2.63 $2.54 -2.8 -3.0 0.2 -3.7 Ending inventory quantity . . . . . . . 38,271 31,207 38,705 33,755 41,359 1.1 -18.5 24.0 22.5 All other sources: Quantity . . . . . . . . . . . . . . . . . . . . 54,514 43,009 47,948 23,250 25,345 -12.0 -21.1 11.5 9.0 Value . . . . . . . . . . . . . . . . . . . . . . . 146,770 110,359 115,785 54,793 56,813 -21.1 -24.8 4.9 3.7 Unit value . . . . . . . . . . . . . . . . . . . $2.69 $2.57 $2.41 $2.36 $2.24 -10.3 -4.7 -5.9 -4.9 Ending inventory quantity . . . . . . . 17,535 13,464 12,886 12,427 12,246 -26.5 -23.2 -4.3 -1.5 All sources: Quantity . . . . . . . . . . . . . . . . . . . . 180,974 153,790 173,314 85,726 92,572 -4.2 -15.0 12.7 8.0 Value . . . . . . . . . . . . . . . . . . . . . . . 485,945 398,690 442,766 219,325 227,348 -8.9 -18.0 11.1 3.7 Unit value . . . . . . . . . . . . . . . . . . . $2.69 $2.59 $2.55 $2.56 $2.46 -4.9 -3.5 -1.5 -4.0 Ending inventory quantity . . . . . . . 55,806 44,672 51,590 46,181 53,605 -7.6 -20.0 15.5 16.1
U.S. producers' (2): Average capacity quantity . . . . . . . *** *** *** *** *** *** *** *** *** Production quantity . . . . . . . . . . . . . *** *** *** *** *** *** *** *** *** Capacity utilization (1) . . . . . . . . . . *** *** *** *** *** *** *** *** *** U.S. shipments: Quantity . . . . . . . . . . . . . . . . . . . . *** *** *** *** *** *** *** *** *** Value . . . . . . . . . . . . . . . . . . . . . . . *** *** *** *** *** *** *** *** *** Unit value . . . . . . . . . . . . . . . . . . . *** *** *** *** *** *** *** *** *** Export shipments: Quantity . . . . . . . . . . . . . . . . . . . . *** *** *** *** *** *** *** *** *** Value . . . . . . . . . . . . . . . . . . . . . . . *** *** *** *** *** *** *** *** *** Unit value . . . . . . . . . . . . . . . . . . . *** *** *** *** *** *** *** *** *** Ending inventory quantity . . . . . . . . *** *** *** *** *** *** *** *** *** Inventories/total shipments (1) . . . . *** *** *** *** *** *** *** *** *** Production workers . . . . . . . . . . . . . *** *** *** *** *** *** *** *** *** Hours worked (1,000s) . . . . . . . . . . *** *** *** *** *** *** *** *** *** Wages paid ($1,000s) . . . . . . . . . . *** *** *** *** *** *** *** *** *** Hourly wages . . . . . . . . . . . . . . . . . *** *** *** *** *** *** *** *** *** Productivity (square feet per hour) . *** *** *** *** *** *** *** *** *** Unit labor costs . . . . . . . . . . . . . . . . *** *** *** *** *** *** *** *** *** Net sales: Quantity . . . . . . . . . . . . . . . . . . . . *** *** *** *** *** *** *** *** *** Value . . . . . . . . . . . . . . . . . . . . . . . *** *** *** *** *** *** *** *** *** Unit value . . . . . . . . . . . . . . . . . . . *** *** *** *** *** *** *** *** *** Cost of goods sold (COGS) . . . . . . *** *** *** *** *** *** *** *** *** Gross profit or (loss) . . . . . . . . . . . . *** *** *** *** *** *** *** *** *** SG&A expenses . . . . . . . . . . . . . . . *** *** *** *** *** *** *** *** *** Operating income or (loss) . . . . . . . *** *** *** *** *** *** *** *** *** Capital expenditures . . . . . . . . . . . . *** *** *** *** *** *** *** *** *** Unit COGS . . . . . . . . . . . . . . . . . . . *** *** *** *** *** *** *** *** *** Unit SG&A expenses . . . . . . . . . . . *** *** *** *** *** *** *** *** *** Unit operating income or (loss) . . . *** *** *** *** *** *** *** *** *** COGS/sales (1) . . . . . . . . . . . . . . . *** *** *** *** *** *** *** *** *** Operating income or (loss)/ sales (1) . . . . . . . . . . . . . . . . . . . . *** *** *** *** *** *** *** *** ***Home Legend/US Floors: U.S. shipments: Quantity . . . . . . . . . . . . . . . . . . . . *** *** *** *** *** *** *** *** *** Value . . . . . . . . . . . . . . . . . . . . . . . *** *** *** *** *** *** *** *** *** Unit value . . . . . . . . . . . . . . . . . . . *** *** *** *** *** *** *** *** ***
(1) "Reported data" are in percent and "period changes" are in percentage points. (2) Excluding *** and ***.
Note.--Import data are compiled from the responses to the Commission's importer questionnaires. Commerce found in the final phase of its investigations that importsmanufactured and exported by Zhejiang Yuhua Timber Co., Ltd. had received de minimis countervailable subsidies and had not been sold at less than fair value.This firm accounted for *** percent of reported Chinese production and *** percent of reported exports to the United States.
Note.--Financial data are reported on a fiscal year basis and may not necessarily be comparable to data reported on a calendar year basis. Because of rounding,figures may not add to the totals shown. Unit values and shares are calculated from the unrounded figures.
Source: Compiled from data submitted in response to Commission questionnaires.
C-4
D-1
APPENDIX D
COMMENTS ON THE EFFECTS OF THE ORDERS AND THE LIKELY EFFECTS OF REVOCATION

D-3
Table D-1 MLWF: U.S. producers', U.S. importers', and foreign producers' narrative responses to the impact of the orders
* * * * * * *
Table D-2 MLWF: U.S. producers', U.S. importers', and foreign producers' narrative responses to the likely impact of the revocation of the orders
* * * * * * *

E‐1
APPENDIX E
PURCHASERS’ COMMENTS REGARDING CHANGES IN THE U.S. INDUSTRY SINCE JANUARY 1, 2011 AND ANTICIPATED CHANGES

E‐3
Table E-1 MLWF: U.S. purchasers' narrative responses to the changes in the U.S. industry since January 1, 2011
* * * * * * * Table E-2 MLWF: U.S. purchasers' narrative anticipated changes in the U.S. industry
* * * * * * *

F-1
APPENDIX F
DATA CONCERNING U.S. PRODUCERS’ U.S. IMPORTS

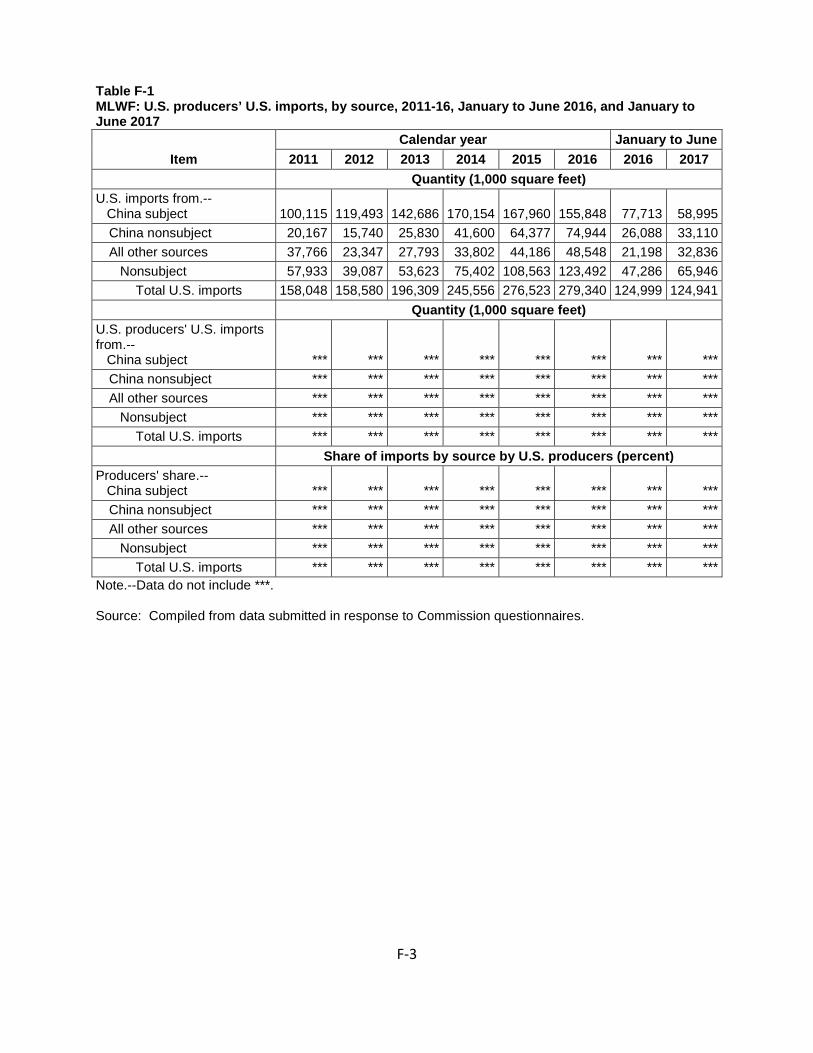
F-3
Table F-1 MLWF: U.S. producers’ U.S. imports, by source, 2011-16, January to June 2016, and January to June 2017
Item Calendar year January to June
2011 2012 2013 2014 2015 2016 2016 2017 Quantity (1,000 square feet) U.S. imports from.-- China subject 100,115 119,493 142,686 170,154 167,960 155,848 77,713 58,995
China nonsubject 20,167 15,740 25,830 41,600 64,377 74,944 26,088 33,110 All other sources 37,766 23,347 27,793 33,802 44,186 48,548 21,198 32,836 Nonsubject 57,933 39,087 53,623 75,402 108,563 123,492 47,286 65,946
Total U.S. imports 158,048 158,580 196,309 245,556 276,523 279,340 124,999 124,941 Quantity (1,000 square feet) U.S. producers' U.S. imports from.-- China subject *** *** *** *** *** *** *** ***
China nonsubject *** *** *** *** *** *** *** *** All other sources *** *** *** *** *** *** *** *** Nonsubject *** *** *** *** *** *** *** ***
Total U.S. imports *** *** *** *** *** *** *** *** Share of imports by source by U.S. producers (percent) Producers' share.-- China subject *** *** *** *** *** *** *** ***
China nonsubject *** *** *** *** *** *** *** *** All other sources *** *** *** *** *** *** *** *** Nonsubject *** *** *** *** *** *** *** ***
Total U.S. imports *** *** *** *** *** *** *** *** Note.--Data do not include ***. Source: Compiled from data submitted in response to Commission questionnaires.