Embed Size (px)
Citation preview
Multifunctional Base Unknowns in the Introductory Analytical Chemistry Lab
Jonathan A. Werner and T. C. Werner Union College, Schenectady, NY 12308
A thorough understanding of acid-base equilibria is a fundamental goal of introductory courses in analytical chemistry. Most texts in this field do a reasonahly good joh of introducing the student to both simplified and complete mathematical descriptions of various acid-base equilibria. We have chosen to focus almost exclusively on the use of the simplest mathematical relations to solve acid-base equilib- ria, which apply when the extent of acid or base dissociation is negligible, since these relations are probably sufficient for over 90% of all practical needs. In our approach, we choose to emphasize the nature of the assumptions that are being made to simplify the mathematics and to get students to recognize the species, existing a t equilibrium in a given solu- tion, that determine solution pH.
An excellent tool for our apvroach is the titration of a multifunctional base, like carbnate or phosphate, with a strong acid (HC1). At various points along the curve for this titration the p~-determiningspecies can be a weak base, a buffer, an amphiprotic species, a weak acid or a strong acid. While virtually all quantitative analysis texts have several homework problems involving the calculation of acid-base titration curves, we helieve it is far more effective pedagogy to have students compare calculated pH values to their own experimentally generated titration curve. As a consequence, we have designed an experiment in which students deter- mine the titration curve of an unknown base or mixture of bases with standard HC1 solution. The unknowns can be one of the followine: (1) pure sodium carbonate. (2) a mixture of sodium carbon& &d sodium hicarbonate; (3) pure trisodi-
rnL HCI
Figure 1. Titration curves for pure Na2C03 (0.1962 g) and a midure of Na2C03 (0.1524 g) and NaHC03 (0.1163 g) with 0.1675 M HCI.
600 Journal of Chemical Education
urn phosphate, or (4) a mixrure of trisodium phosphate and disodium phosphate. We ask students to determine whether their unknownk a carhonate or phosphate by comparing pH values a t selected points on the experimental titration curve with calculated p H values at these points for the different unknowns. Once their unknown type is identified, students can use the titration curve to decide if the unknown is a Dure (1 or 3 above) or mixed base (2 or 4 above) and deterkine auantitativelv the amount of each basic comnonent in the unknown. If the unknown is a pure base, students can deter- mine whether the base is hydrated, and, if so, they can estimate the number of waters of hydration. Finally, we can give a series of optional questions for the lab write-up that probe the solution equilibria a t a more sophisticated level, including the use of more complete pH calculations where activity effectsand the extent of dissociation are not negled- ed.
Experlmenial All chemicals were ACS reagent grade or better. Titration pH
values were obtained using Orion Model 701ADigital Ionalyzers equipped with pencil-type combination pH electrodes. Students enter their titration data into a Macintosh computer and plot it using Cricket Graph. Detailed experimental instructions can be obtained by writing the authors.
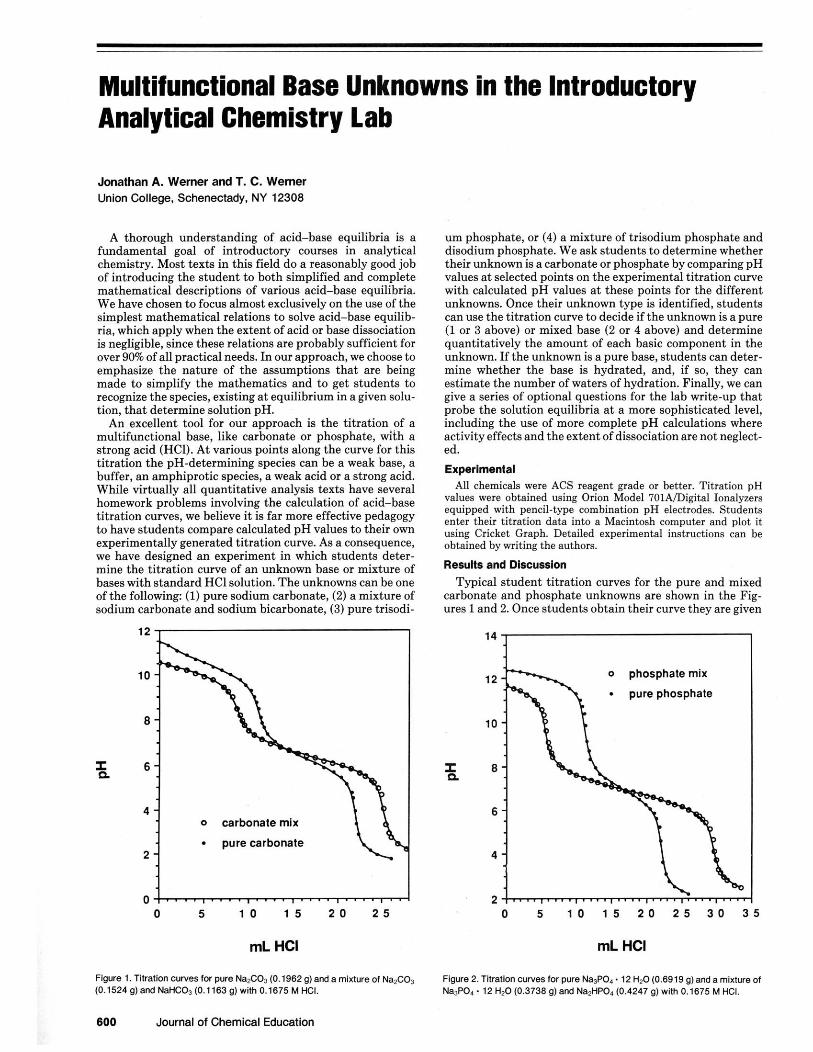
Results and Dlscuoslon Typical student titration curves for the pure and mixed
carbonate and phosphate unknowns are shown in the Fig- ures 1 and 2. Once students obtain their curve they are given
12 o phosphate mix . pure phosphate
10
8
6
4
2
rnL HCI
Figure 2. Tination curves for pure Na3POd. 12 H20 (0.6919 g) and a mixture of Na3P0,. 12 H20 (0.3738 g) and Na2HP04 (0.4247 g) with 0.1675 M HCI.
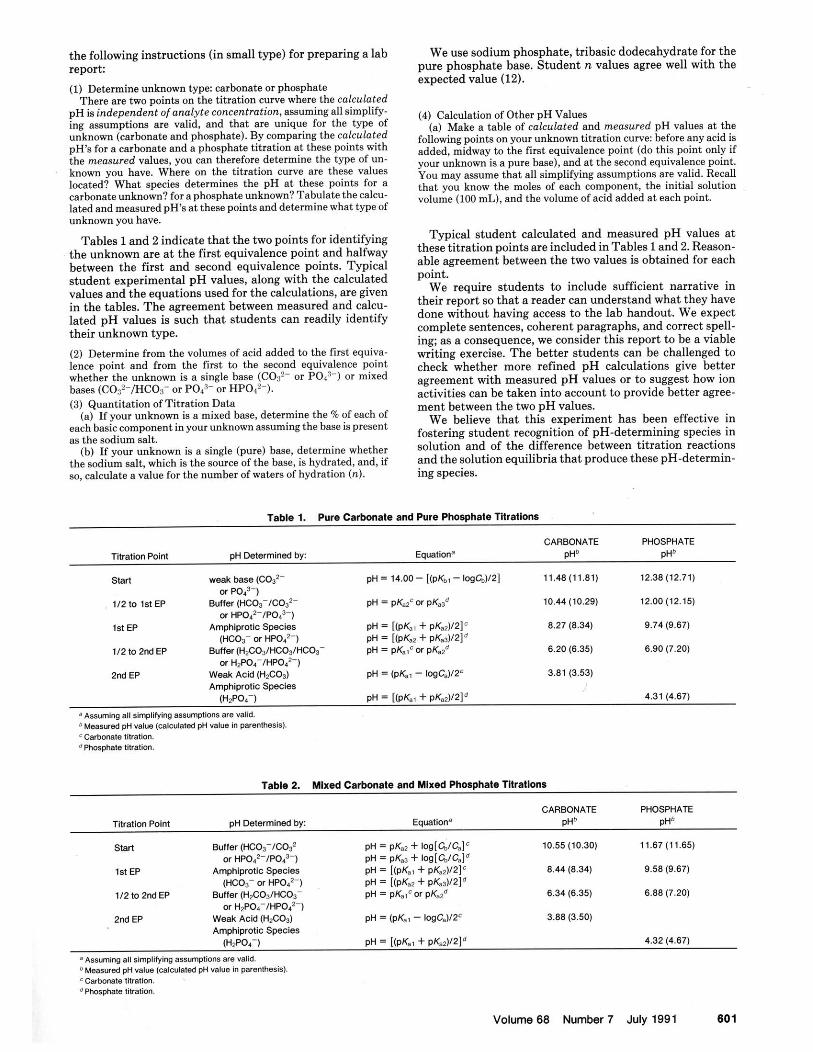
the following instructions (in small type) for preparing a lab report:
(1) Determine unknown type: carhonate or phosphate There are two points on the titration curve where the calculated
pH is independent ofanalyte concentration, assuming all simplify- ing assumptions are valid, and that are unique for the type of unknown (carhonate and phosphate). By comparing the cnlculoted pH's for s carbonate and a phosphate titration at these points with the measured values, you can therefore determine the type of un- known you have. Where on the titration curve are these values located? What species determines the pH at these points for a carhonate unknown? for aphosphate unknown? Tabulate the caleu- lated and measured pH's at these points and determine what type of unknown you have.
Tables 1 and 2 indicate that the two points for identifying the unknown are at the first equivalence point and halfway between the first and second equivalence points. Typical student experimental pH values, along with the calculated values andthe eauations used for the calculations, are given in the tables. ~ d e agreement between measured and calcu- lated o H values is such that students can readily identify their inknown type.
(2) Determine from the volumes of acid added to the first equiva- lence point and from the first to the second equivalence point whether the unknown is a single hase (C0s2- or P049-) or mixed bases (C032-/HCO~- or P O P or HPOn2-). (3) Quantitation of Titration Data
(a) If your unknown is a mixed hase, determine the 9% of each of each basic component in your unknown assuming the hase is present as the sodium salt.
(h) If your unknown is a single (pure) hnae, determine whether the sodium salt, which is the source of the haw, i* hydrnted, and, if ro, calculate n value for the number of watersof hydration ( n , .
We use sodium phosphate, tribasic dodecahydrate for the pure phosphate base. Student n values agree well with the expected value (12).
(4) Calculation of Other pH Values (a) Make a table of calculated and measured pH values at the
following points on your unknown titration curve: before any acid is added, midway to the first equivalence point (do this point only if your unknown is a pure base), and at the second equivalence point. You may assume that all simplifying assumptions are valid. Recall that you know the moles of each component, the initial solution volume (100 mL), and the volume of acid added at each paint.
Typical student calculated and measured pH values a t these titration ~ o i n t s are included in Tables 1 and 2. Reason- able agreement between the two values is obtained for each point.
We require students to include sufficient narrative in their report so that a reader can understand what they have done without having access to the lab handout. We expect complete sentences, coherent paragraphs, and correct spell- ing; as a consequence, we consider this report to be a viable writing exercise. The better students can be challenged to check whether more refined pH calculations give better agreement with measured pH values or to suggest how ion activities can be taken into account to provide better agree- ment between the two pH values.
We believe that this experiment has been effective in fostering student recognitinn of pH-determining species in solution and of the difference between titration reactions and the solution equilibria that produce these pH-determin- ing species.
Table 1. Pure Carbonate and Pure Phosphate THratlons
CARBONATE PHOSPHATE Titration Point pH Determined by: Equatione pH" pH"
Stan weak base ( C O F pH = 14.00- [(pKbt - IogCa)12] 11.48(11.81) 12.38 (12.71) or POZ-)
112 to 1st EP Buffer (HC037C0a2- pH = P K ~ or p&sd 10.44 (10.29) 12.00 (12.15) or HP0,2-lP04")
1st EP Amphiprotic Species PH = [(pfG + p&2)/2I5 8.27 (8.34) 9.74 (9.67) (HCOJ- or HPOa2-) PH = [(PK.~ + ~ K d 2 1 ~
112 to 2nd EP Buffer (H&031HCOdHC03~ pH = PKJo~ p K d 6.20 (6.35) 6.90 (7.20) or HzPOli/HP0427
2nd EP Weak Acid ( H P 0 3 pH = (pK,, - iogC,)12' 3.81 (3.53) Amphiprotic Species
(H2P017 PH = [(P& + p f W 2 l d 4.31 (4.67)
Assuming all oimpllfylng assumptions are valid. M ~ s s ~ r e d pH value (calculated pH value In parenthesis). Carbonate titration.
'Phosphate fibation.
Table 2. Mlxed Carbonate and Mlxed Phosphate Tltrattonr
CARBONATE PHOSPHATE ~ibation Poim pH Determined by: Equatione pH" pHb
Start Buffer (HC03- lC0~~ pH = pKa2 + i 0g [~ /CS1 ' 10.55 (10.30) 11.67 (11.65) or HP0,2-/P043-) pH = pK.3 + iog[GICaIa
1st EP Amphiprotic Species pH = [(PK., + p K d 2 I r 8.44 (8.34) 9.58 (9.67) (HCOa- or HP04'-) pH = I(pK.2 + ~ K d 2 1 ~
112 to 2nd EP Buffer (H2CO3/HC03- pH = pK,,'or pKJ 6.34 (6.35) 6.88 (7.20) or H2P047HP012-)
2nd EP Weak Acid (HCOd pH = (p&, - i0gCJ12~ 3.88 (3.50) Amphiprotic Species
(H~POI-) PH = [(PK~T + ~ K d 2 1 ' 4.32 (4.67)
~ssuming ail simpliving assumptions are valid. Measured pH value l~alculakd pH value In parenthesis).
'Carbonate tiwatim. dPho~phate fitration.
Volume 68 Number 7 July 1991 601