Embed Size (px)
Citation preview
1
Multidimensional poverty in immigrant households: a comparative analysis within the Europe 2020 framework
(Preliminary version)
Paper prepared to be presented to the X Jornadas de Economía Laboral
Universidad Autónoma de Madrid
11th and 12th July 2013
Rosa Martínez*
Jesús Ruiz-Huerta*
* Universidad Rey Juan Carlos, Madrid.
2
Multidimensional poverty in immigrant households: a comparative analysis within
the Europe 2020 framework1
Rosa Martínez (Universidad Rey Juan Carlos, Madrid) e-mail: [email protected] Departamento de Economía Aplicada II Facultad de Ciencias Jurídicas y Sociales Pº de los Artilleros S/N 28032, Madrid
Jesús Ruiz-Huerta (Universidad Rey Juan Carlos, Madrid) e-mail: [email protected] Departamento de Economía Aplicada II Facultad de Ciencias Jurídicas y Sociales Pº de los Artilleros S/N 28032, Madrid
Keywords: poverty, deprivation, social exclusion, unemployment, immigration. JEL codes: J15, D31, I32 Abstract
The multidimensional approach to poverty and well-being has become increasingly
influential in recent decades, in both developed and less developed countries. At the
European level, it is now widely recognized that conventional low-income indicators have
some important drawbacks as benchmarks for monitoring progress in combating poverty,
especially in the context of an enlarged European Union. Accordingly, the European 2020
strategy has taken a big leap forward in proposing a novel headline indicator for monitoring
poverty reduction over the current decade, taking into account simultaneously low income,
material deprivation and low work intensity. The present paper uses this new indicator as a
springboard for a discussion of the advantages and disadvantages of a multidimensional
measure, based on these three domains, in analyzing the risk of poverty and social
exclusion affecting immigrant households in Spain and other highly developed countries.
We show that the analytical insight and internal consistency of the new Europe 2020
indicator can be enhanced by a more structured methodological approach, relying on the
latest advances generated by multidimensional poverty measurement. We then use the
adjusted measures proposed to analyze the multidimensional poverty profiles of immigrant
households in the countries selected, as well as the changes occurring since the beginning
of the economic downturn. We find that the Europe 2020 indicator alone may not be
sufficient to reflect the growing intensity of multidimensional deprivation among
immigrants in some countries. The Alkire-Foster measures provide a natural extension to
the Europe 2020 framework, which can usefully complement the picture emerged from the
at-risk-of-poverty or social exclusion indicator.
1The authors wish to acknowledge financial support from the Ministerio de Ciencia e Innovación (ECO2010-21668-C03-01). This paper is based on work carried out during our visit to the Centre Interuniversitaire de Recherche en Analyse des Organisations (CIRANO), Montreal, Canada, for whose hospitality and assistance we are extremely grateful.
3
1. Introduction
Developed countries increasingly perceive immigration as a structural phenomenon
in an increasingly globalized world. Over the last period of economic expansion, 2000-
2005/06, migrant flows to OECD countries rose by over 33%, which has led to an increase
of about 16 million persons in the migrant population living in the OECD in a very short
period of time2. Many of these newcomers chose Spain as their final destination, making it
the country with the largest relative increase in the migrant population in the years prior to
the onset of the crisis. Ireland, Italy and Finland also faced huge rises in migrant flows
during the same years. Although the economic downturn has significantly slowed down
such inward flows, especially in certain countries, it does not seem that migration to the
OECD countries will become much less important in the near future.
This awareness has contributed to increasing discussion of the factors affecting the
social and economic inclusion of immigrants in developed countries. In the European
Union, the incorporation of third-country nationals has generated a lively debate in recent
years, especially since the introduction, first in the Netherlands and then in other countries,
of a new civic integration approach that constitutes in some ways a clear departure from
previous policies3. In the United States4 and Canada, which have traditionally hosted large
numbers of immigrants, growing attention has also been paid to the integration of the new
waves of immigrants, under the argument that such integration appears to be progressing
less successfully than in the past, as the increasing conflicts in some European capitals,
such as Paris, London or, more recently, Stockholm show.
The concern about disadvantages related to migrant status has given rise to an
extensive literature on the factors affecting the socioeconomic integration of immigrants in
developed countries. One important feature of this literature has been the move from the
analysis of earnings assimilation that dominated initial studies, especially since the
important contributions made by Chiswick (1978) and Borjas (1985), to a more
comprehensive evaluation framework that incorporates other variables important to
2 Widmaier and Dumont (2011). 3 For a recent review of this issue, see Zimmermann et al. (2012) or Goodam (2010). 4As the present discussions (May 2013) in the USA Senate seems to indicate.

4
determine economic well-being from a multidimensional perspective5. Some recent studies
of this topic highlight the multidimensional nature of deprivation suffered by immigrants,
extending the classical approach focused on earnings assimilation to the analysis of
disadvantages faced by immigrants in a number of relevant dimensions, such as education,
employment, income, housing, access to public services or social relations6. The results
obtained confirm the diversity of deprivation levels and profiles in different European
countries, even when the analysis is restricted to homogeneous ethnic groups. The
investigation of the factors explaining these differences has generated a lively discussion in
Europe, with the relative role of (and the relationship between) migrant integration policies
and general redistributive welfare state policies being at the core of many debates7.
At the European Union level, the integration of third country nationals has also
become an increasingly important priority. Although migrant integration programs remain
under the national jurisdiction of the member states, important efforts have been made
since 1999, when the Tampere program was adopted, to strengthen cooperation by
defining common goals and basic principles for integration policies, as well as by
identifying and sharing good practices in a variety of relevant domains. In accordance with
the recommendation made by the 2010 Zaragoza Declaration and the new social targets
established by the Europe 2020 Strategy, a great deal of attention is currently being paid to
the agreement of a common set of indicators to monitor progress towards the integration
of migrant households8.
Migrant integration is defined in the European context as “a dynamic, two-way
process of mutual accommodation by all immigrants and residents of Member States” that
5See, for example, Aleksynka and Algan (2010) or Hildebrandt et al. (2012). 6See Boubtane et al. (2011), Giulietti et el. (2011), IDEAS (2009), Bhalla and McCormick (2009), Hickman et al. (2009), Pi Alperin (2008), Deutsch and Silber (2006). 7On this question see, among others, Zimmermann et al. (2012), Joppke (2010, 2007), Kraal et al. [eds.] (2009), Causa and Jean (2007), Jacobs and Rea (2007), Büchel and Frick (2005), Penninx (2004). In a highly controversial paper Koopmans (2008) argued, using data for eight countries (Sweden, Belgium, the Netherlands, France, Germany, Austria, Switzerland and the United Kingdom), that the combination of active multicultural integration policies with generous Welfare States have generated the deepest biggest integration gaps in Europe. In contrast, countries with smaller welfare states and/or more assimilative integration policies tend to obtain better integration outcomes. Other studies have called into question these results, as they rely on data that are not genuinely comparable: see for example Jacobs and alt. (2009). 8An initial pilot study has already been released, in an attempt to assess to what extent the Zaragoza Declaration’s set of common indicators of integration in four key areas (employment, education, social inclusion and active citizenship) can be derived from existing harmonized data sources, mainly Labor Force Surveys and EU-SILC microdata; see Kraszewska (2011) for more detail.
5
involves at the same time economic, political and cultural aspects9. However there appears
to be strong consensus on the central role of economic achievements in overall integration
outcomes. This key role, clearly suggested by the wording of the eleven common basic
principles for immigrant integration policies adopted in 200410, has been further vindicated
since the launching of the Europe 2020 Strategy, whose employment and social inclusion
targets are held to be closely interrelated with migrant integration policies (European
Commission, 2010b: 10, 18-19). In this regard, the new headline poverty indicator included
in the Europe 2020 framework appears to be particularly suitable for monitoring progress
towards the socioeconomic incorporation of migrant households, since it permits joint
consideration of the risks arising from weak integration into the labor market and from low
levels of income or material well-being. However, the particular indicators and thresholds
employed to summarize each dimension, as well as the aggregation strategy chosen to
identify the official target group (a simple headcount union approach), require yet more
research, since they may not necessarily represent the best choices to adequately monitor
the risk of poverty and social exclusion of immigrant households (or other vulnerable
groups) in every European country.
This paper directly addresses this issue by examining the applicability of the Europe
2020 approach to the analysis of the multidimensional poverty profile of immigrants in
Spain, in comparison with a group of highly developed countries with a strong tradition of
immigration (Italy, France, Germany, the United Kingdom, and Canada). In the first part
of the paper, we will use the advances produced in the recent multidimensional poverty
literature to discuss the strengths and weaknesses of the new Europe 2020 headline poverty
indicator and to suggest some modifications that could enhance its internal consistency and
analytical insight in the context of highly developed countries. Taking for granted the three
dimensions included in the new Europe 2020 indicator, but neither the particular indicators
chosen to summarize them nor the aggregation methodology followed, a revised
multidimensional poverty index is derived following the Alkire-Foster (2011a,b) approach,
taking as its starting point the three dimensions currently included in the new Europe 2020
poverty indicator. This index is then used to analyze multidimensional poverty levels and
profiles of immigrant households in the selected group of old and new immigrant countries
9 European Commission (2010a), p. 160. 10 See http://ec.europa.eu/ewsi/en/EU_actions_integration.cfm for the listing of the eleven Common Basic Principles.
6
for different threshold levels, using EUSILC data. In the case of Canada, a non-EUSILC
country, we use microdata from the 2009 Survey of Labor and Income Dynamics in order
to build up the multidimensional poverty index, taking advantage of the new material
deprivation module collected since the year 2008 for Ontario residents. Finally, the paper
provides new evidence on how the current economic crisis is affecting the
multidimensional poverty risk of immigrants in Spain and other countries, using EUSILC
data for the period 2008-2011. To that end, we analyze the impact of changes in each
domain on the overall poverty level during the economic downturn, both in immigrant and
native households. The paper concludes with some final remarks on the policy implications
of our findings and some possible routes for further research.
2. Analyzing poverty within the Europe 2020 framework: the principal issues
The multidimensional approach to poverty and well-being has become increasingly
influential over the last few decades in both developed and less developed countries. At the
European level, it is now widely recognized that conventional low-income indicators have
some important drawbacks as benchmarks to monitor progress in combating poverty, for a
number of reasons which range from the purely relative nature of conventional thresholds
to the well-known limitations of income, as currently measured by household surveys, to
adequately capture poverty. Consistent empirical evidence on the limited overlap between
income poverty and material deprivation, whatever the procedure chosen to summarize the
two phenomena, has contributed to highlight the necessity of a new approach to analyze
poverty and social inclusion at the European level11.
In this context, the new EU strategy for jobs and smart, sustainable and inclusive
growth, known as the Europe 2020 strategy12, has taken a large step forward by proposing
a novel indicator for monitoring poverty reduction over the current decade, as one of the
five measurable headline targets established in the five key areas of employment, research
and development, climate change and energy sustainability, education, and poverty and
social exclusion. It is worth noting that the poverty reduction goal was initially defined on
11 See among others Fusco, Guio and Marlier (2013, 2010a, 2010b), Alkire and Apablaza (2012), de Neubourg et al. (2012), Nolan and Whelan (2011, 2010), Berthoud and Bryan (2010). 12 In June 2010, the European Council approved this strategy, designed to be the successor to the 2000 Lisbon Strategy, as representative of the direction that Europe should take to “emerge stronger from the economic and financial crisis”, see European Commission (2010b), p.2.
7
the basis of the at-risk-of poverty indicator alone13, but the target was finally agreed in
terms of the new and wider “at-risk of poverty or social exclusion” (AROPE) indicator,
defined on a multidimensional basis and simultaneously taking into account low income,
material deprivation and employment deprivation, three arguably significant facets of the
European concept of social inclusion. The final formulation of the target has been
criticized by some experts, who consider the final proposal to be less ambitious and
“fuzzier” than the original 14 ; however, it is generally seen as progress towards a
multidimensional perspective of poverty, and one more consistent with the social inclusion
policy approach prevalent in the EU. In any case, it is useful to think of the new headline
indicator as a flexible benchmark agreed within the context of the so-called European open
method of coordination, which Member States are free to adapt to national circumstances
and priorities when setting their national targets.
We examine below in greater detail the indicator through the lens of the
multidimensional poverty measurement literature, while still keeping in mind the
restrictions derived from the origin, context and intended use of the “at-risk-of-poverty or
social inclusion” indicator15 . To that end, we review the features of the new headline
indicator regarding each of the different steps involved in multidimensional poverty
measurement, from the selection of dimensions to the indicators and thresholds used and
the aggregation method finally applied to obtain a summary overall measure.
a) Dimensional structure
As explained before, the new measure is based on three principal facets (low
income, material deprivation and low work intensity), in contrast to the standard only-
income approach used since the first European programs to fight poverty were launched in
the eighties. It is worth underlining that the new index is intended to capture not only
poverty, but also the much wider concept of “social exclusion”. This new approach is in
13 The exact wording of the initial formulation of Europe 2020 Strategy was that “the number of Europeans living below national poverty lines should be reduced by 25%, lifting over 20 million people out of poverty”, European Commission (2010b: 32). 14 Nolan and Whelan (2011), for instance, argue that the new headline indicator increases the size of the target group by 50%, thus dropping the reduction aimed for from a quarter to a sixth. 15 This means taking into account that measures used to monitor poverty trends in a policy oriented framework, such as the Europe 2020 Strategy, have a number of desirable properties that preclude the use of excessively data intensive and overly technical approaches. See Atkinson and Marlier (2010) for a detailed discussion of this issue.
8
line, as mentioned before, with the growing emphasis of European social policy on the
“social inclusion” concept, which covers dimensions that go well beyond income or
economic poverty, although specialists are in no agreement as to the relevant domains and
indicators. At the same time, the new measure is not addressed to determine the precise
levels of “poverty” or “social exclusion”, but rather the “risk” of falling into these
situations. This change of emphasis can be read as a certain loss of confidence in the
capacity of income alone to adequately reflect poverty in the European Union, especially
when combined with purely relative income thresholds set at the national level.
Furthermore, it must be linked to the growing interest in material deprivation indicators as
a complementary strategy to identify the poor both inside each country and across
countries, given their closer relationship with differences in living standards in an enlarged
and much more heterogeneous EU.
Given the broad scope of the targeted concept, the use of only three dimensions is a
remarkably parsimonious choice. Thus, the new index has wisely avoided the “explosion of
concern” of many indiscriminate listings of problems which, as Sen has indicated, have
contributed to keeping some experts on poverty and deprivation removed from the social
exclusion debate (Sen, 2000: 2), while at the same time offering poor guidance to
policymakers 16 . However, as happens with other composite indicators developed to
monitor social trends at the international level, such as the Human Development Indicator,
the Economic Welfare Index or the Multidimensional Poverty Index, the proposal also
stimulates close scrutiny and a wide range of criticisms. Atkinson and Marlier (2010: 32)
have stressed this fact, pointing out that “(t)he adoption of the social inclusion headline
target puts the EU social indicators under the spotlight”.
In our view, the choice of the three dimensions selected could make sense if we
considered the new index as an adaptation of the traditional risk of poverty indicator,
which tries to adjust the poverty concept to the wider notion of social exclusion without
totally departing from the conventional low income indicator. In that context, the use of
income and deprivation indicators would confirm the trend, increasing over the last decade,
towards combining the two approaches when analysing poverty. On the other hand, the
16As stressed by Burstein (2005: 13), when analyzing the groups at risk of social exclusion in Canada: “The range of policies engaged by the less “abstemious” descriptions of exclusion are daunting. At their widest, they cannot be distinguished– except in their targeting – from social policy in general”.
9
introduction of the work intensity dimension contributes to increased visibility and gives
political priority to the unemployment problem, which is fully consistent with the first
objective of the EU 2020 Strategy and with the shared view that jobs are crucial to
minimize the risk of poverty and facilitate social inclusion. Furthermore, taking the
household as the unit of analysis to evaluate the indicator helps to emphasize the
importance of the family distribution of unemployment, which has been shown to play a
decisive role in explaining the relationship between unemployment and poverty17.
The three considered dimensions can also be seen as especially important for the
immigrant’s integration. Employment is in fact regarded as “a key part of the integration
process” in the Common Basic Principles for Immigrant Integration Policy adopted by the
abovementioned Justice and Home Affairs Council, in 2004. On the other hand, the sixth
basic principle highlights the importance of access for immigrants “to public and private
goods and services, on a basis equal to national citizens” as “a critical foundation for better
integration”18. Although the integration of immigrants is a long-term process involving
other aspects that go beyond income and jobs, the ability to avoid poverty and achieve a
minimum standard of living can be easily seen as vital for facilitating integration in the
remaining domains. While the new “at-risk-of-poverty or social exclusion indicator“ had
not yet been included in the initial list of indicators held to monitor the migrant integration
process, as proposed in the 2010 Zaragoza Declaration, it should be noted that it was
added to results presented in the first pilot study carried in that field (Kraszewska, 2011:
11).
Nevertheless, the dimensional structure of the new poverty headline indicator has
been questioned by authors as Nolan and Whelan (2011), who point out that the inclusion
of low work intensity households in the target population results in a more imprecise and
less internationally differentiated poverty profile19. From their view, combining low income
17 For Spain, see among others Ayala, Cantó and Rodríguez (2011) or García Serrano and Malo (2008). 18 European Commission (2007). 19 As Nolan and Whelan (2011: 18) put it “At a conceptual level, the argument for including in the target population persons living in households that are jobless but are neither on low income (relative to their own country’s median income) not materially deprived (relative to a common EU wide standard) is unclear. Joblessness might be better thought of as a factor leading to income poverty or material deprivation than as an indicator of poverty. Empirical analysis then shows that the group added to the target population by the inclusion of the joblessness/low work intensity criterion has a relatively high proportion from the professional and managerial classes and a
10
and material deprivation constitutes a step in the right direction when trying to enhance the
poverty measure, while adding the work intensity indicator weakens the final indicator.
Although this point deserves careful consideration (and possibly deeper country studies), it
is worth noting that, as stated above, the new measure is aimed at assessing the risk of
poverty and social exclusion, rather than quantifying the actual number of poor. In that
sense, it could be argued that the inclusion of the employment indicator would allow
policymakers to identify those households which, despite not having low income nor
material deprivation at present (because they are receiving temporary transfers or are
relying on savings), do in fact have a problem of lack of economic autonomy and a
pronounced vulnerability to poverty and social exclusion, if the low work intensity situation
persists.
b) Indicators and thresholds
Having selected the relevant dimensions, any multidimensional measure must
decide which specific indicators and thresholds should be used to identify the poor, as well
as the weights and identification function used to combine the results obtained in each
domain. Table 1 shows the variables and cut-offs chosen to summarize each dimension in
the Europe 2020 “at risk-of-poverty or social exclusion” indicator. Low income is
measured through the conventional at-risk-of-poverty rate based on each country’s median
income, so that the target population is defined within each country as those falling below
national income standards, which can differ considerably among countries in the current
enlarged EU. Taking the EUSILC data for 2011, the average low income ratio was 16.9%
for the EU-27 area, and the lowest values were around 10 and 11% in the Czech Republic
and the Netherlands, and the highest close to 22% (in Romania, Bulgaria, Spain and
Greece).
This traditional European way of setting income poverty lines has become
increasingly controversial within the EU, due both to its low sensitivity to changes in
median income over time and to geographical differences in real levels of living across the
enlarged EU. The current economic recession has shown to what extent poverty statistics
can exhibit paradoxical results, as observed in Latvia where the index changed from 25.6%
in 2008 to 19.3% in 2011, while the median income with regard to purchasing power fell
relatively low proportion from the working class, and that being in this group is not associated with high levels of economic stress”.
11
from 7.257 to 5.666 over the same period. Furthermore, it is far from clear that national
boundaries still provide the most pertinent context to assess the average standard of living
for poverty comparison within the European Union. As Berthoud (2012: 3) has argued, an
alternative view is that “(…) people all over Europe are aware of, and implicitly compare
themselves with, the living standards prevalent across the union”. Nevertheless, no
consensus has emerged so far on the most adequate reference group for poverty
assessment at the European level, with some experts favoring national (and even regional)
relativities whilst others support EU-wide poverty lines or even intermediate approaches20.
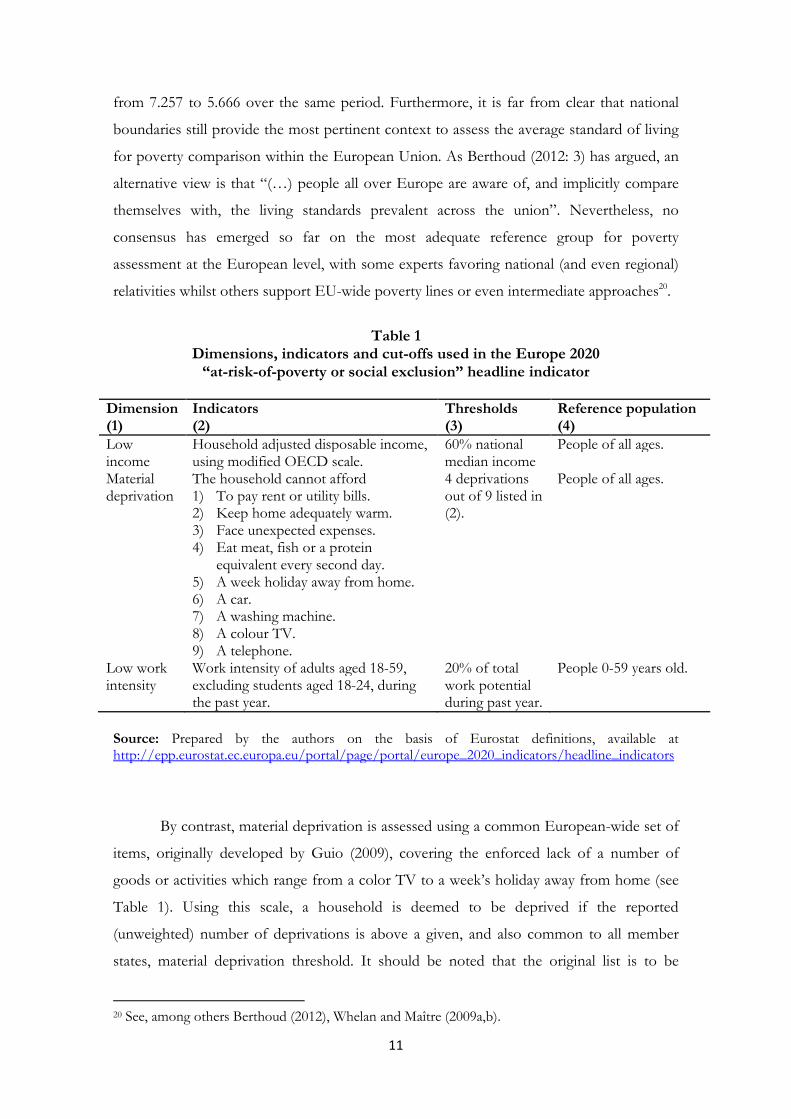
Table 1
Dimensions, indicators and cut-offs used in the Europe 2020 “at-risk-of-poverty or social exclusion” headline indicator
Dimension (1)
Indicators (2)
Thresholds (3)
Reference population (4)
Low income
Household adjusted disposable income, using modified OECD scale.
60% national median income
People of all ages.
Material deprivation
The household cannot afford 1) To pay rent or utility bills. 2) Keep home adequately warm. 3) Face unexpected expenses. 4) Eat meat, fish or a protein
equivalent every second day. 5) A week holiday away from home. 6) A car. 7) A washing machine. 8) A colour TV. 9) A telephone.
4 deprivations out of 9 listed in (2).
People of all ages.
Low work intensity
Work intensity of adults aged 18-59, excluding students aged 18-24, during the past year.
20% of total work potential during past year.
People 0-59 years old.
Source: Prepared by the authors on the basis of Eurostat definitions, available at http://epp.eurostat.ec.europa.eu/portal/page/portal/europe_2020_indicators/headline_indicators
By contrast, material deprivation is assessed using a common European-wide set of
items, originally developed by Guio (2009), covering the enforced lack of a number of
goods or activities which range from a color TV to a week’s holiday away from home (see
Table 1). Using this scale, a household is deemed to be deprived if the reported
(unweighted) number of deprivations is above a given, and also common to all member
states, material deprivation threshold. It should be noted that the original list is to be
20 See, among others Berthoud (2012), Whelan and Maître (2009a,b).
12
updated from 2013 onwards as a result of the in-depth analysis of the 2009 special material
deprivation module undertaken under European sponsorship (Guio, Gordon and Marlier,
2012), which showed that some of the items currently included in the European material
deprivation indicator did not pass the validity and reliability tests in many countries21. The
chosen cut-off of four or more items out of the set of nine listed in Table 1 is intended to
capture severe material deprivation according to the Eurostat concept, yielding an overall
rate of 8.8% in year 2011 for the EU-27 area. National rates are strongly related to median
income, a proxy to an EU wide measure of poverty22, and as such exhibit a huge variation
among countries, with values over 20% in most of the poorer new member states (with a
maximum of 43.6% in Bulgaria), but below 3% in Luxembourg or the Scandinavian area.
The description above should serve to highlight that the inclusion of the two
abovementioned poverty indicators in the new measure, in their present form, is not merely
a way of combining an income and a material deprivation approach to poverty (or an
indirect and a direct method to identify the poor, to use the well-known Ringen’s (1987)
distinction), but also a sort of mixture of relative and absolute considerations when delimiting
the target population. Whether this should be seen as an “encouraging” development of
the traditional European analytical framework (Fusco, Guio and Marlier, 201023), as a
partial advance still needing further adjustments (Nolan and Whelan, 2011: 2924), or as an
“anomaly” leading to “a confusing discourse” and puzzling implications for policymaking
21As a result of this wide-ranging study, a new list of 13 indicators (18 for children) has been proposed to be collected since the 2013 wave. The list for the whole population excludes the items related to the enforced lack of a television set, a washing machine and a telephone, and adds seven new deprivation questions, five of them to be asked at the individual level. See Guio, Gordon and Marlier (2012) for more details on this question. 22Fusco, Guio and Marlier (2010: 138) have shown that the correlation between national material deprivation rates and EU-wide based income poverty rates is close to 0.80, compared with approximately 0.31 for standard national income poverty rates. 23 Fusco, Guio and Marlier (2010), p. 37: “In terms of national and EU reporting, the chapter clearly shows the complementarity of income poverty and material deprivation measures. So, to provide a much better picture of a country’s situation with regard to ‘poverty’ (especially in the context of international comparisons), it is important that national income poverty rates be systematically published with the related national income poverty thresholds (in PPS) and that they be systematically accompanied with national material deprivation rates. This should be kept in mind when monitoring the social dimension of the new Europe 2020 Strategy, which is to replace the 2000-2010 Lisbon Strategy. In this respect, the new EU target on social inclusion adopted in June 2010 is quite encouraging”. 24 Nolan and Whelan, 2011, p. 29 “(…) combination of low income and deprivation can contribute to the development of appropriate targets. While looking at those who are either on low income or reporting significant deprivation has a value, we have argued that it would also be valuable to identify the sub-set of persons and households meeting appropriate income and deprivation criteria: this could serve to identify a priority group as countries frame their individual contributions to meeting the overall EU target”.
13
(Gilbert, 2012: 39125) is open to debate. For now, it should be enough to draw attention to
the fact that, given the indicators and thresholds chosen to summarize these two
dimensions, many older EU member countries will tend to show large groups of people
receiving low incomes (according to national standards) but not reporting material
deprivation, whilst the opposite will be true in poorer new EU member countries.
Regarding the analysis of migrant integration in rich western European countries, such as
Germany, France or even Spain, the material deprivation threshold used in the new Europe
2020 measure is most probably too strict to serve as a meaningful benchmark in the
analysis of groups at risk of poverty and exclusion.
Finally, low work intensity status is measured on the basis of the time worked
during the previous year by all adults aged 18 to 59 (excluding students aged 18-24), divided
by the potential working time of the same working age household members. A cutoff is
then employed to identify as deprived all individuals under 60 who live in households with
a working intensity below 0.20 for those of adult working age. On average, the low work
intensity rate reached a value of 10% of EU-27 in 2011, ranging between values of 6% for
Cyprus and Luxembourg to ratios above 12% in Belgium, Spain, Hungary, Latvia and
Lithuania. It must be stressed that the low work intensity indicator is not defined for
people aged sixty or above, who are not taken into consideration in the computation of this
figure. This can pose a problem when attempting to check the robustness of results to
different identification and aggregation strategies, since the number of dimensions
effectively considered is not the same for those below and above 60. For this reason, we
restrict the empirical analysis to people aged 60 or less, which on the other hand makes
sense when analyzing immigrant integration in different countries. But it would be worth to
explore variants of this indicator that can be extended to the whole population.
c) Identification approach
An important feature of any multidimensional measure, which do not arise in the
unidimensional framework, is the need to decide the identification approach used to
determine who are the multidimensionally poor, once identified those individuals or
25 Gilbert (2012), p. 391: “Findings that show that a fair proportion of the EU countries have lower levels (or risks) of poverty, yet higher levels of material deprivation than many other countries, present policy makers with a confusing discourse on the relationship between poverty and material deprivation –as these terms are commonly understood.
14
household that are considered “poor” or “deprived” regarding separately to each
dimension. Should we identify the poor as those being deprived in at least one dimension,
following what the literature has called a “union approach”? Or, by contrast, only those
falling below the threshold in each of the k dimensions should be deemed to be poor –an
“intersection approach”? As many authors have stressed, the adequacy of a union versus an
intersection identification strategy, or some intermediate method lying in between these
two extremes, depends ultimately on the dimensions selected and the nature of their
interrelationships26.
The identification method used when constructing the “at-risk-of-poverty or social
exclusion” is clearly based on a union approach, since an individual is considered to be at
risk as long as he/she is identified has low income, or suffers material deprivation, or lives in
a very low work intensity household. The implicit assumption behind this approach is that
it is necessary to reach a minimum level in each of the three dimensions to avoid the risk of
poverty and exclusion, or to put it in other words, that having, say, high work intensity
cannot compensate for having low income or living in material deprivation. As rightly
expressed by Tsui (2002: 74), “(t)his formulation, in a sense, emphasizes the essentiality of
each attribute. (…) In the final analysis, how reasonable the identification rule is depends,
inter alia, on the attributes included and how imperative these attributes are to leading a
meaningful life”. In the AROPE construct, the rational for this union approach can be
arguably found in the purpose of evaluating the notion of “risk”, rather than actual poverty
or exclusion situation. Nevertheless, it is immediate to ask about the extent to which these
risk factors overlap in different social groups and how this should affect the final
assessment. From the point of view of a policy maker, a rate of poverty or social exclusion
among immigrants of, say, a 33%, may have very different implications depending on
whether that figure describes a group suffering simultaneously joblessness, low income and
material deprivation, or three 11% non-overlapping groups, each of them deprived in one
dimension but getting along in the other two.
Thus, even if we accept that a simple union approach serves well the objective of
providing an estimate of the size of the “at risk” population, other complementary
measures based on an intermediate or even an intersection approach would be needed to
26 And in particular, to what extent the different attributes can be considered to be substitutes or complements in determining the poverty status. See among others Duclos, Sahn and Younger (2006), Atkinson (2003), or Bourguignon and Chakravarty (2003).
15
analyze differences in intensity or deprivation profiles. Although Eurostat offers data on
the breakdowns according to the intersections between sub-populations of the Europe
2020 indicator of poverty and social exclusion, the question on how differences among
countries in the extent to which these three dimensions overlap should be interpreted
remains unsolved. Moreover, the severity of the material deprivation threshold currently
used leads to identify very small groups as deprived in that domain in old member
countries, thus undermining the usefulness of intersecting the three dimensions.
d) Aggregation approach
Following the classical distinction established by Sen, the aggregation step refers to the
function used to summarize the overall poverty level in a given society or group, once
those qualifying as poor or deprived have been adequately identified. Although a number
of commonly accepted desirable properties and the corresponding axiomatically
characterized measures have been proposed both in the unidimensional and the
multidimensional poverty literatures, “counting the poor” remains by far the procedure
most widely used when constructing poverty indices, both in policy oriented reports and in
applied empirical work. The main advantages of such a counting approach, which Atkinson
compared to its social welfare counterpart in a much quoted article27 , are of course its
simplicity and ease of interpretation, compared to other alternatives. However, the
headcount measures have also well-known limitations when making comparisons among
groups or over time, since they are not able to reflect the depth of the shortfalls suffered by
those below the threshold, nor the inequality among the poor. In the multidimensional
framework, the headcount ratio also involves implicitly assigning equal weights to the
various dimensions, which can be a questionable assumption when the including domains
with very different impact in the measured concept.
The Europe 2020 poverty indicator provides a simple headcount measure based on
the three dimensions described above, since it shows simply the number of people at risk
of poverty or social exclusion (defined as those who fall below at least one of the three
dimensional cut-offs, as seen above) as a percentage of the total population. Thus, it is not
sensitive to the number of deprived dimensions of those identified as the poor or to the
size of the gaps within each domain. It means that the index does not change if, for
27 See Atkinson (2003).
16
instance, a household having only low income in year t starts suffering material deprivation
in year t+1, since it has been already “counted” as an at risk household. The same happens
if a redistribution occurs among the poor, so that income –or work– is transferred from
the least deprived to those situated at the very bottom of the scale.
To sum up, although the new poverty headline indicator adopted by the Europe
2020 Strategy clearly represents a step forward in the direction of measuring a broader
concept of social inclusion, more consistent with the European policy making framework,
there is still room to complement or adapt the basic indicator so that more insight can be
obtained when analyzing vulnerability to poverty and social exclusion in a particular subset
of European Union countries. A productive way to do it might come from inserting the
Europe 2020 indicator into a more general class of multidimensional poverty indices,
flexible enough to permit robustness of conclusions to be checked when a set of basic
parameters are modified. The Alkire-Foster family of measures provides in our view the
most suitable approach to support this generalization within the Europe 2020 framework.
Although some other interesting multidimensional measures exist in the literature, the A-F
measures have some properties that make them a good choice to analyze poverty and social
exclusion in the European context: they can be used with union, intersection or
intermediate identification approaches, as well as with equal or different dimensional
weights, show the intensity, and not only the extension, of multidimensional poverty, fulfill
a number of useful axioms, including subgroup decomposability, and, last but not least, can
be applied to categorical, and not only to continuous, variables, thus widening the range of
indicators that can be included in the measure. The Alkire-Foster measures have been
envisaged under the inspiration of the Sen’s capability approach with a special focus in
measuring poverty in developing countries, but have also been used in the context of rich
countries in some recent empirical work28.
3. Methodology and data description
In this section we summarize and explain the basic data, measures and
methodological choices used in the empirical analysis. We first describe briefly the Alkire-
28 See for example Whelan, Nolan and Maître (2012), or work in progress by Alkire and Apablaza (2012). For developing countries, a well-known application of this methodology is the Multidimensional Poverty Index developed by the Oxford Poverty & Human Development Initiative to substitute the Human Poverty Index; see Alkire and Santos (2010) for a detailed explanation of the MPI structure and indicators.
17
Foster measures following Alkire and Foster’s (2011a,b) notation. Then we explain the
options taken and the features and limitations of the datasets used.
a) The Alkire-Foster family of multidimensional measures
The Alkire-Foster class of multidimensional measures can be described as a
parametric set of indices that, as many other developed in recent literature, represent in
some way a generalization to the multidimensional context of the original Foster, Greer
and Thorbecke (1984) poverty measures, given the role assigned to the concept of
normalized poverty gap.
In formal terms, let we consider a population of 1, 2, …, n individuals, whose
achievements are measured across 1, 2, …, d different dimensions. Each dimension is
represented by an indicator (or a composite index of various indicators) that can be either
cardinal or categorical variables. In that context, let y=[yij] be the n×d matrix of
achievements of a given population, where each row shows the values corresponding to
individual i across the d dimensions, and each column contains the marginal distribution of
a specific dimension j across the entire population. Each of the elements yij in the matrix
represents the achievement of individual i in dimension j. In the most general case, a vector
of dimensional weights intended to allow different weighting schemes can be defined as �
= (��, ��, …, ��), so that � ���
��� = d29.
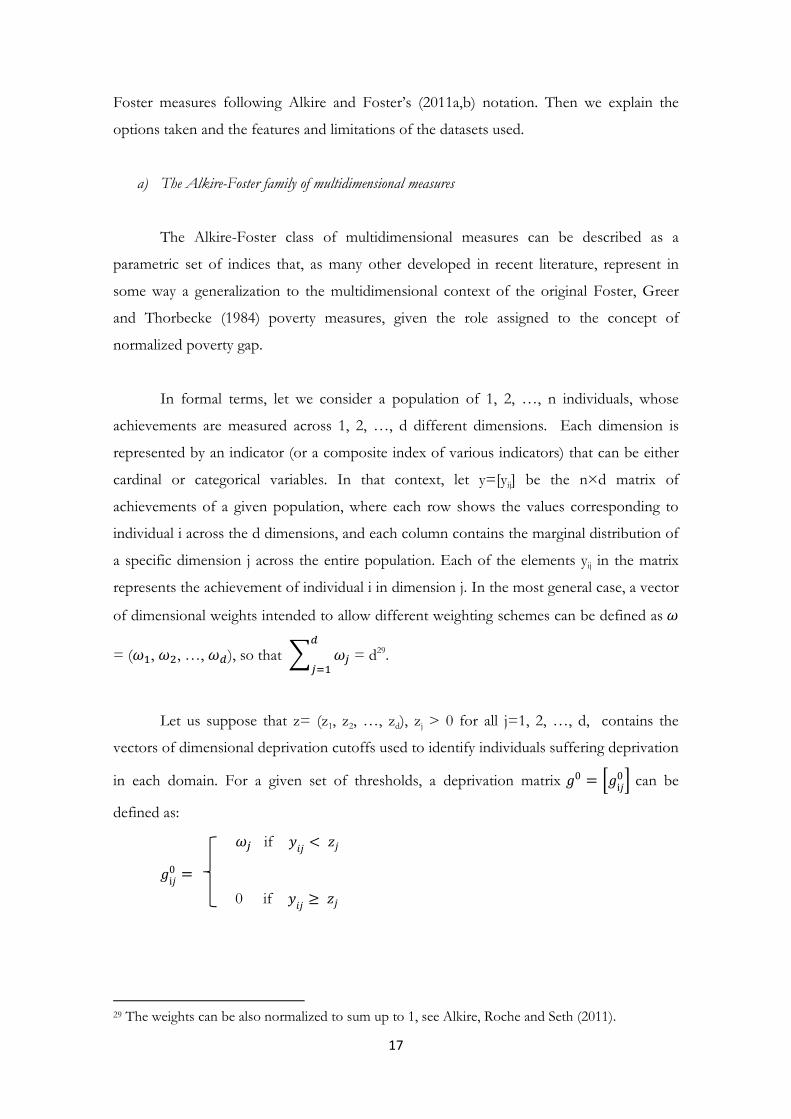
Let us suppose that z= (z1, z2, …, zd), zj > 0 for all j=1, 2, …, d, contains the
vectors of dimensional deprivation cutoffs used to identify individuals suffering deprivation
in each domain. For a given set of thresholds, a deprivation matrix 0 = �i�0� can be
defined as:
�� if ��� < ��
i�0 =
0 if ��� ≥ ��
29 The weights can be also normalized to sum up to 1, see Alkire, Roche and Seth (2011).
18
From 0 a column deprivation score vector � is then derived where each entry
summarizes the weighted number of deprivations, or capability failures, suffered by the i-th
individual, �� = � i�0
�
�=1.
To identify who are multidimensionally poor, a poverty cut-off �, 0 <� ≤ 1, has to
be applied to the column vector 0, so that the i-th individual is identified as poor if �� ≥ �.
Alkire and Foster (2011a,b) refer to the former as a dual cutoff identification method, since
it combines the use of within dimensional deprivation cut-offs z first, to decide whether a
person is deprived or not in a given dimension, and a poverty cutoff then to determine
who is deemed to suffer multidimensional poverty. It is straightforward to see that the
value of �will determine if a union, an intersection or an intermediate approach is used to
identify the poor.
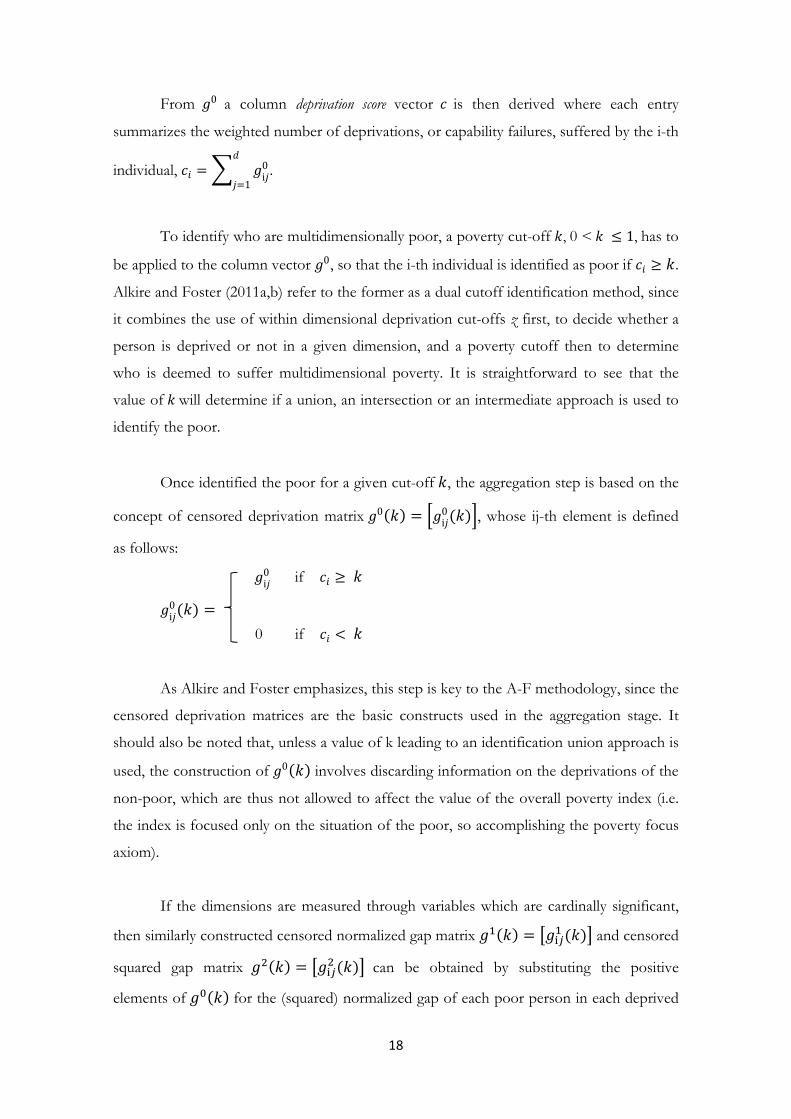
Once identified the poor for a given cut-off �, the aggregation step is based on the
concept of censored deprivation matrix 0��� = �i�0����, whose ij-th element is defined
as follows:
i�0 if �� ≥ �
i�0��� =
0 if �� < �
As Alkire and Foster emphasizes, this step is key to the A-F methodology, since the
censored deprivation matrices are the basic constructs used in the aggregation stage. It
should also be noted that, unless a value of k leading to an identification union approach is
used, the construction of 0��� involves discarding information on the deprivations of the
non-poor, which are thus not allowed to affect the value of the overall poverty index (i.e.
the index is focused only on the situation of the poor, so accomplishing the poverty focus
axiom).
If the dimensions are measured through variables which are cardinally significant,
then similarly constructed censored normalized gap matrix ���� = ���� ���� and censored
squared gap matrix ���� = ���� ���� can be obtained by substituting the positive
elements of ���� for the (squared) normalized gap of each poor person in each deprived
19
dimension, defined, as in the unidimensional case, as the difference between the
deprivation cut-off �� and the person’s achievement in each deprived dimension � � ,
� � <�� ,expresed as a proportion of the dimensional deprivation cut-off �� .
As stated before, the A-F multidimensional poverty index is based on the standard
FGT framework, thus providing a parametric class of measures Mα(y,z) that can be seen as
the mean of a vector whose entries summarize at the individual level the extent of
multidimensional deprivation, censored using the poverty line. The general form of the A-F
adjusted FGT class of multidimensional poverty measures is hence given by:
Mα(y,z) = µ(gα(k)), for α≥0
This expression equals the sum of the α powers of the normalized gaps of the poor,
|gα(k)|, divided by the highest possible value for this sum, given by nd.
For α=0 the above expression gives rise to the Adjusted Headcount Ratio M0(y,z),
which equals the mean of the censored deprivation matrix
M0(y,z)= µ(g0(k))
and can be expressed as the product of the multidimensional headcount H and the
normalized average deprivation score among the poor A, where
H(y,z)=q/n
A(y,z)=�"� ∑ � ���
It is worth noting that this decomposition is similar in many ways to the one
existing for the FGT1 index in the unidimensional framework, as the product of H and the
income gap ratio I. In comparison to the simple headcount measure, M0 satisfies a number
of useful axioms including symmetry, non-triviality, replication invariance, poverty focus,
deprivation focus, weak monotonicity, normalization, dimensional monotonicity, subgroup
decomposability and weak re-arrangement (Alkire and Foster 2011a). Moreover, this index
20
can be used with ordinal data, as useful property when analysis poverty and social
exclusion.
For α=1 we get the Adjusted Poverty Gap M1(y,z), which equals the mean of the
censored normalized gap matrix 1���, and can also be expressed as the product of the
adjusted headcount ratio M0(y,z) and the average poverty gap G(y,z).
M1(y,z) =HAG= µ(g1(k))
The adjusted poverty gap is the sum of the normalised gaps of the poor, or |g1(k)|
divided by the highest possible sum of normalized gaps, nd.
For α=2 we obtain the adjusted FGT measure M2(y,z), defined as the sum of the
squared normalized gaps of the poor, or |g2(k)|, divided by the highest possible sum of the
squared normalized gaps, nd. M2 can also be expressed as the product of the adjusted
headcount ratio M0 and the average severity index S(y,z).
M2(y,z)= µ(g2(k)) = HAS
As Alkire and Apablaza (2012) show, these α>0 measures can reflect the depth and
severity of multidimensional poverty, and satisfy stronger axioms related to monotonicity
and transfer. However, they cannot be easily applied when variables are not cardinally
significant. In our analysis, we have relied mainly on the M0, but have also computed the
M1 index using the normalized poverty gaps in the income and work intensity dimensions.
b) Sources of data
The five European countries entering the comparison (Germany, France, the
United Kingdom, Spain and Italy) account for 63% of total EU-27 population, and they are
by far the countries that host the largest numbers of non-EU-27-born residents, around 25
million people in year 2012 (a 7,8% of the total population of this countries). Third-country
immigrants are in turn the majority (two out of three) of the total foreign-born persons
residing in these countries30. In relative terms, non-EU27 immigrants account for around
30 Eurostat, http://appsso.eurostat.ec.europa.eu/nui/show.do?dataset=migr_pop3ctb&lang=en.
21
8% of total population in UK, Germany and France, 6% in Italy, and 9% in Spain (2012
data). On the other hand, Canada is, together with Australia, New Zealand and the United
States, one of the most important classical immigration countries outside Europe, with a
share of foreign-born residents around 25% (Widmaier and Dumont, 2011) and one of the
highest per-capita immigration rates in the world. It has been also considered for long one
of the most successful countries in the field of migrant integration, which makes interesting
the comparison with the selected five old and new European immigration countries.
We restrict the analysis to population aged 59 or less. On the one hand, that helps
to define more homogeneous socio-demographic groups, leaving aside migration related to
non-labor reasons such as retirement. On the other hand, narrowing the scope in that way
allows us to analyze a group for which the three relevant dimensions covered in the at-risk-
of-poverty or social exclusion indicator are fully defined.
The data employed come from the four latest EUSILC cross-sectional waves for
European countries, covering the period 2008-2011. For Canada, the 2009 wave of the
Survey of Labour and Income Dynamics (SLID) is used, as it represents the most similar
survey to EUSILC data, and the only one containing to date (though only for Ontario)
material deprivation questions similar to those collected in EU countries. In order to obtain
indicators as comparable as possible for Canada and the rest of the countries, European
definitions have been applied to the Canadian micro-data to build the low income and the
work intensity variables. To that end, the total amount of social contributions has been
deducted from the after tax income concept included in the SLID 31 and the OECD
modified equivalence scale has been applied to obtain the adjusted disposable income at
the household level. The work intensity indicator has been computed using information
about the total number of weeks worked during the reference period by the household
members, adjusting for part-time jobs and excluding students aged 18-24 and all people
over 60 years old, as in Eurostat statistics. Finally, the material deprivation measure has
been defined using the list of ten variables included in the Ontario’s Material Deprivation
Index, which is not fully comparable with the EUSILC scale (see Table A.1 in the Annex).
For this reason, comparisons involving material deprivation levels should be treated with
caution.
31 These include the employment insurance contributions, the Canadian & Quebec pension plan contributions and the public health insurance premiums paid off by the households.
22
Finally, immigrants are defined in this paper as people foreign-born, without
further differentiating between EU-27 or third-country nationals for EUSILC countries32.
For Canada, the country of birth is not provided in the Public Use Microdata File, so the
migrant status has to be derived from a direct question33. The answers to this question
show that 17,5% of people aged 16 or more defined themselves as immigrants, while
33,7% said there were not and almost 49% declared not to know. Children aged 15 or less,
for whom migrant status is not available, are considered to be immigrants as long as they
live in a household headed by an immigrant, both in Canada and in EUSILC countries. The
resulting figures for the different countries are shown in Table A.2 (see Annex).
4. Empirical results
a) International comparison
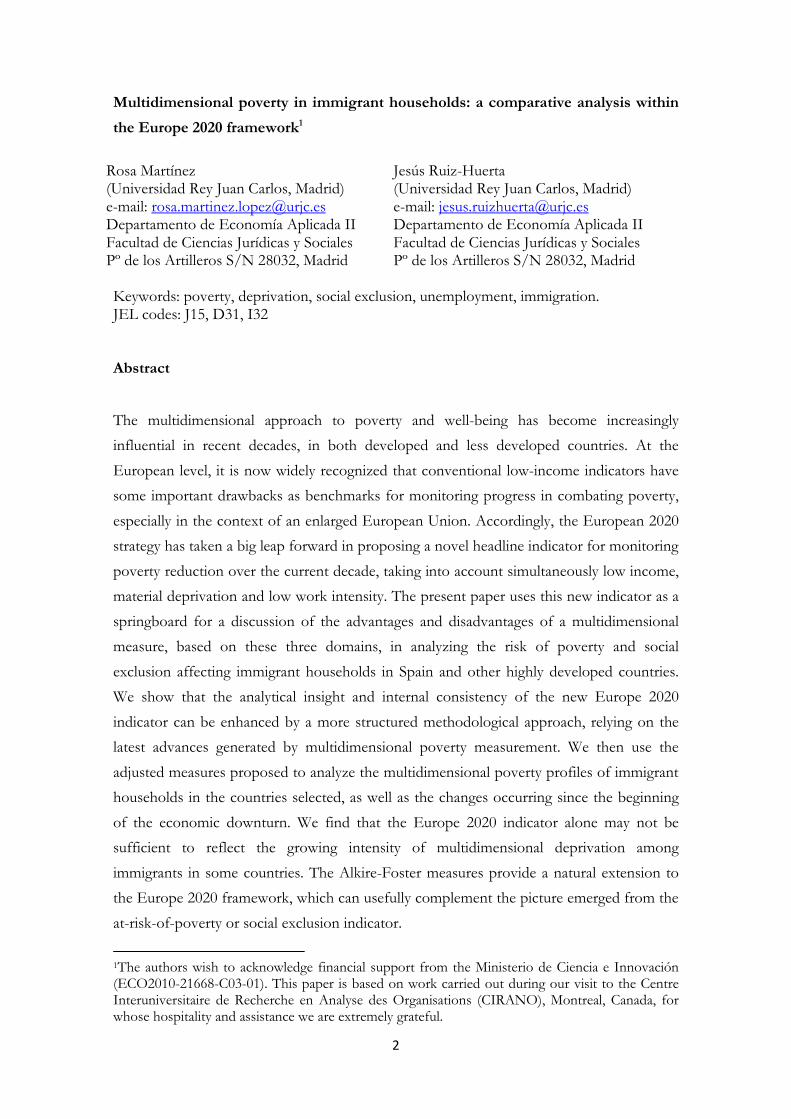
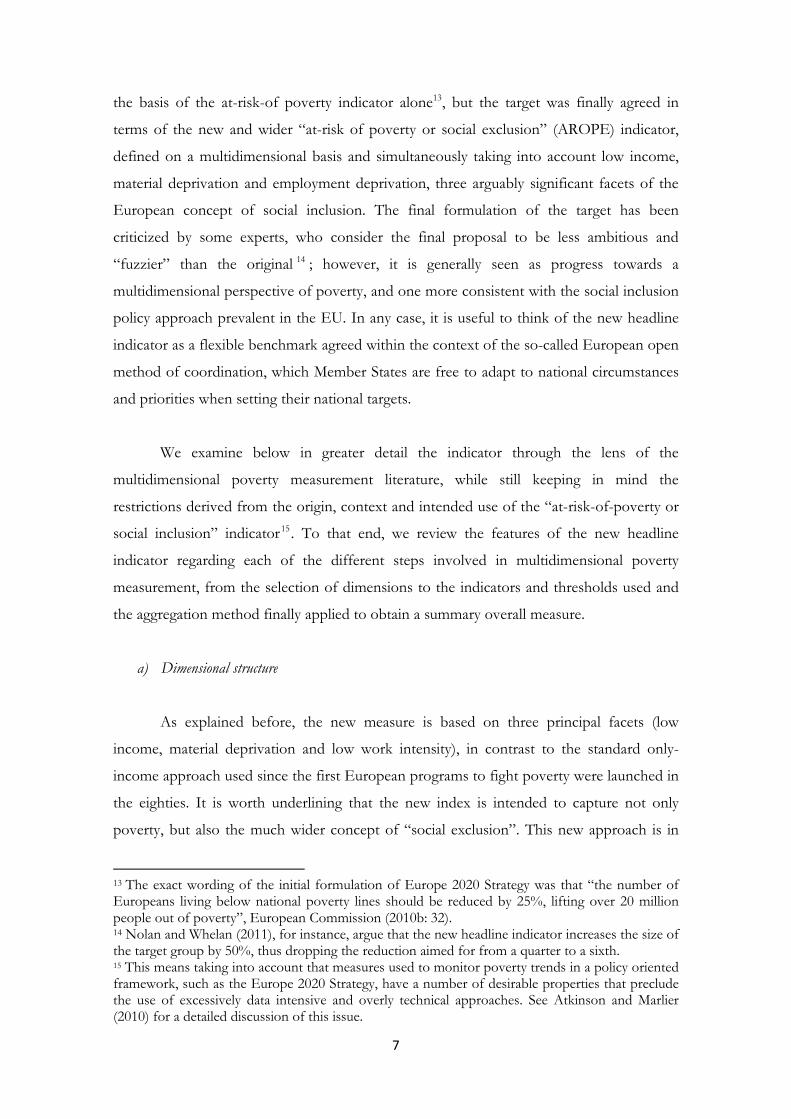
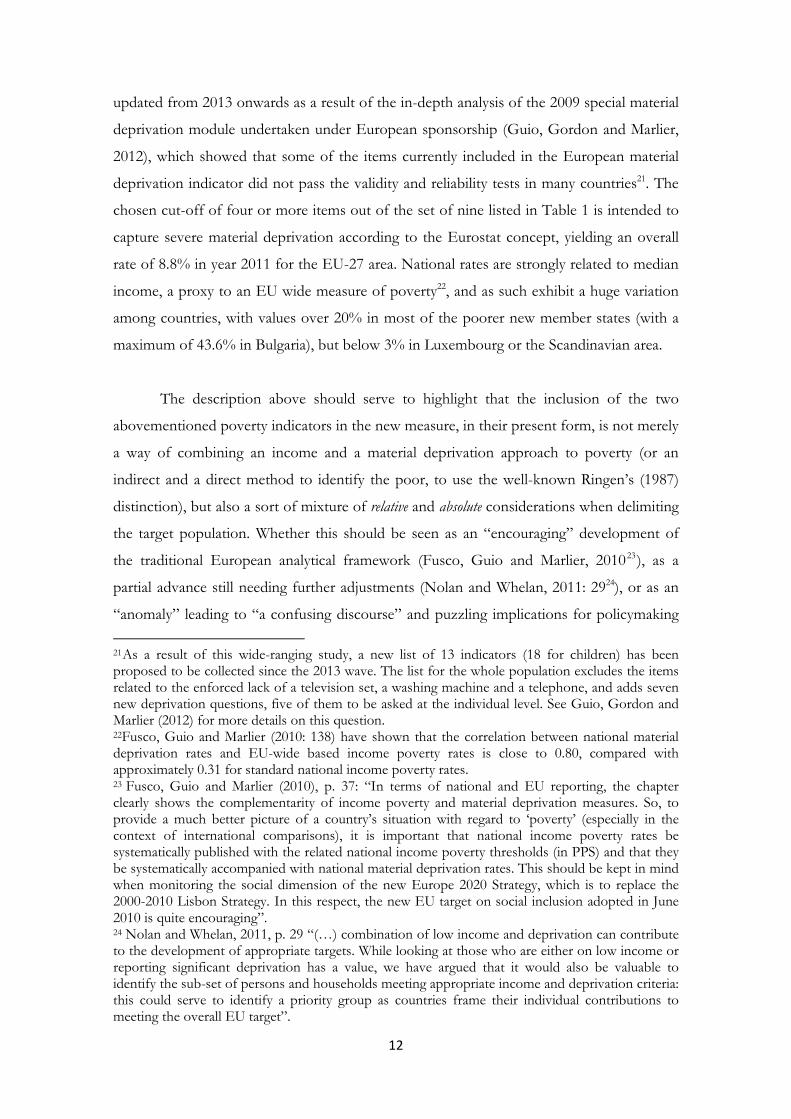
Graph 1 shows the average risk-of-poverty or social exclusion rates for the total
population under the age of sixty, differentiating between natives and immigrants, in the six
countries and Ontario, using current Europe 2020 definitions and thresholds. For Canada,
this rates have been estimated adjusting upwards the values obtained when taking into
account low income and very low work intensity ratios, and then assuming the same
material deprivation rate (and the same degree of overlap with the other two dimensions)
observed in the case of Ontario. This province accounts for the largest part of Canadian
population (almost 40%) and has economic and social indicators that can in many fields be
taken as good proxies to the overall values for the country. It also hosts the largest share of
immigrants residing in Canada. Using SLID-2009 data, 55% of the self-declared
immigrants were living in this province.
According this indicator, France and Germany are the countries that had the lowest
overall risk of poverty or exclusion, about 20%, and Italy and Canada the highest, above
25%, with Spain and the United Kingdom lying in between. As it can be easily seen in
Table A.2, this order is exactly the same that would emerge from using only low income
rates except for Spain, which had high low income rates but scored better than the average
32 Since this breakdown is not available in the case of Germany. 33 The wording of this question is as follows: “Are you now, or have you ever been, a landed immigrant? A "landed immigrant" is a person who has been granted the right to live in Canada permanently by immigration authorities”. See Statistics Canada http://www23.statcan.gc.ca/imdb-bmdi/instrument/3889_Q6_V5-eng.pdf.
23
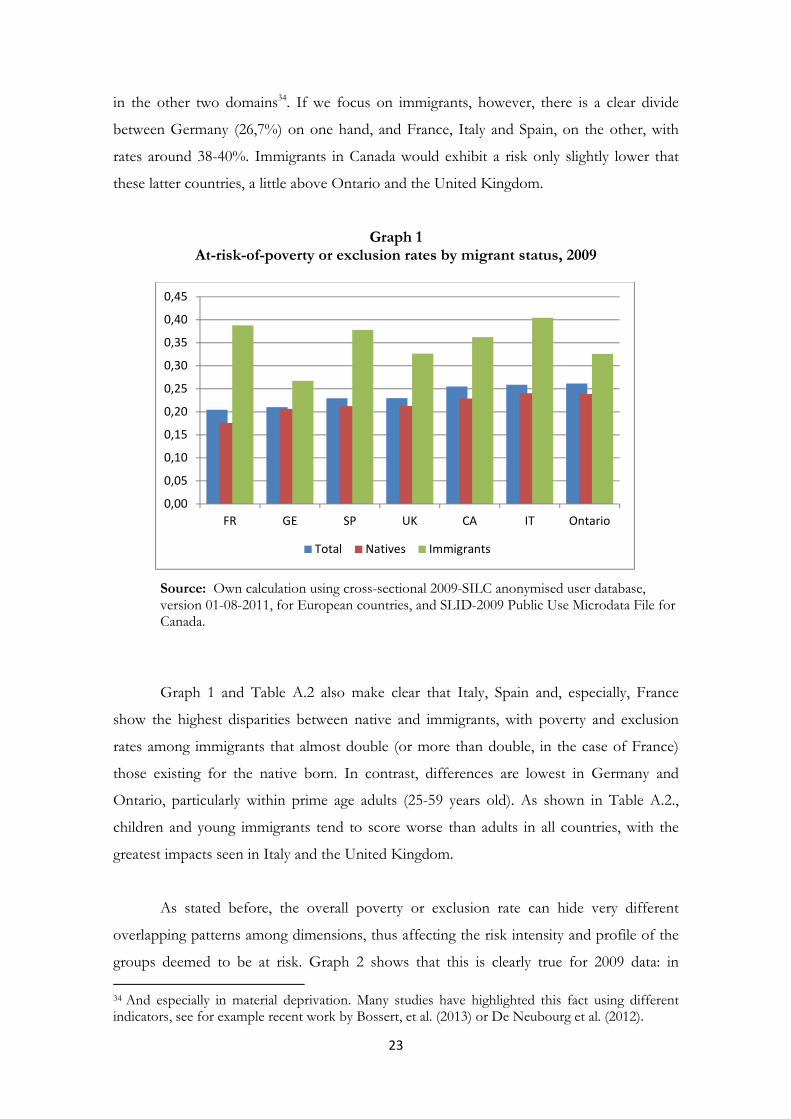
in the other two domains34. If we focus on immigrants, however, there is a clear divide
between Germany (26,7%) on one hand, and France, Italy and Spain, on the other, with
rates around 38-40%. Immigrants in Canada would exhibit a risk only slightly lower that
these latter countries, a little above Ontario and the United Kingdom.
Graph 1 At-risk-of-poverty or exclusion rates by migrant status, 2009
Source: Own calculation using cross-sectional 2009-SILC anonymised user database, version 01-08-2011, for European countries, and SLID-2009 Public Use Microdata File for Canada.
Graph 1 and Table A.2 also make clear that Italy, Spain and, especially, France
show the highest disparities between native and immigrants, with poverty and exclusion
rates among immigrants that almost double (or more than double, in the case of France)
those existing for the native born. In contrast, differences are lowest in Germany and
Ontario, particularly within prime age adults (25-59 years old). As shown in Table A.2.,
children and young immigrants tend to score worse than adults in all countries, with the
greatest impacts seen in Italy and the United Kingdom.
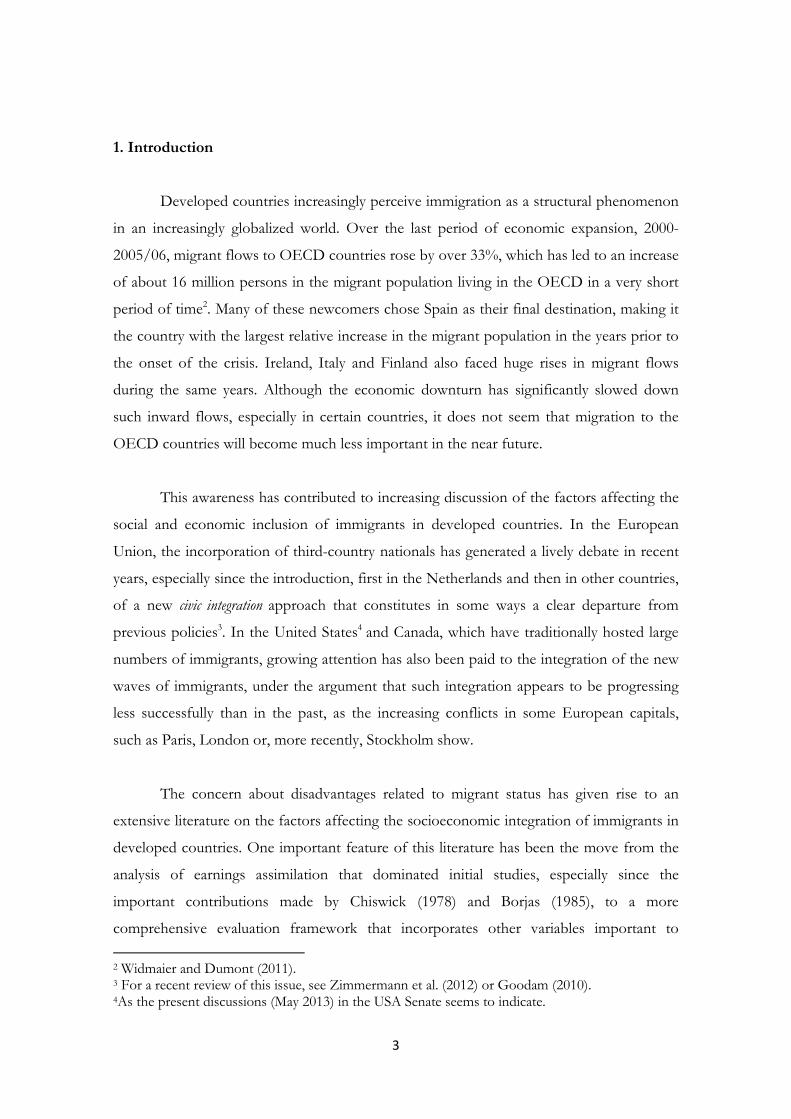
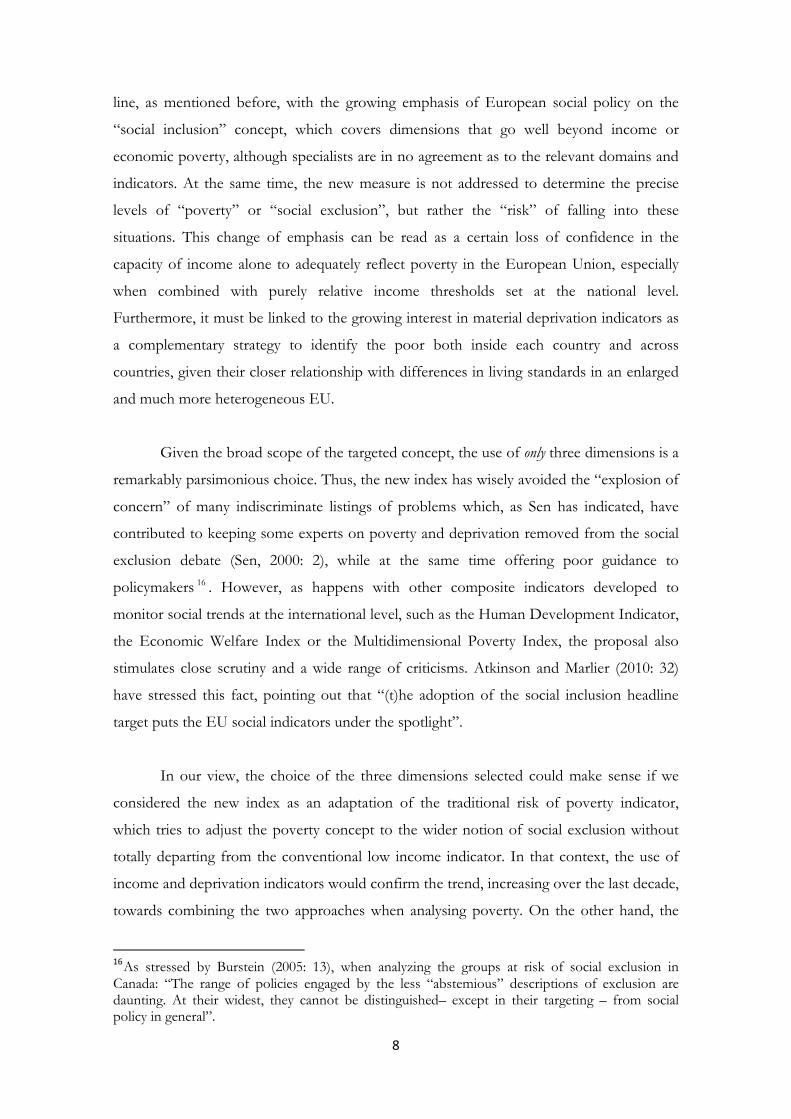
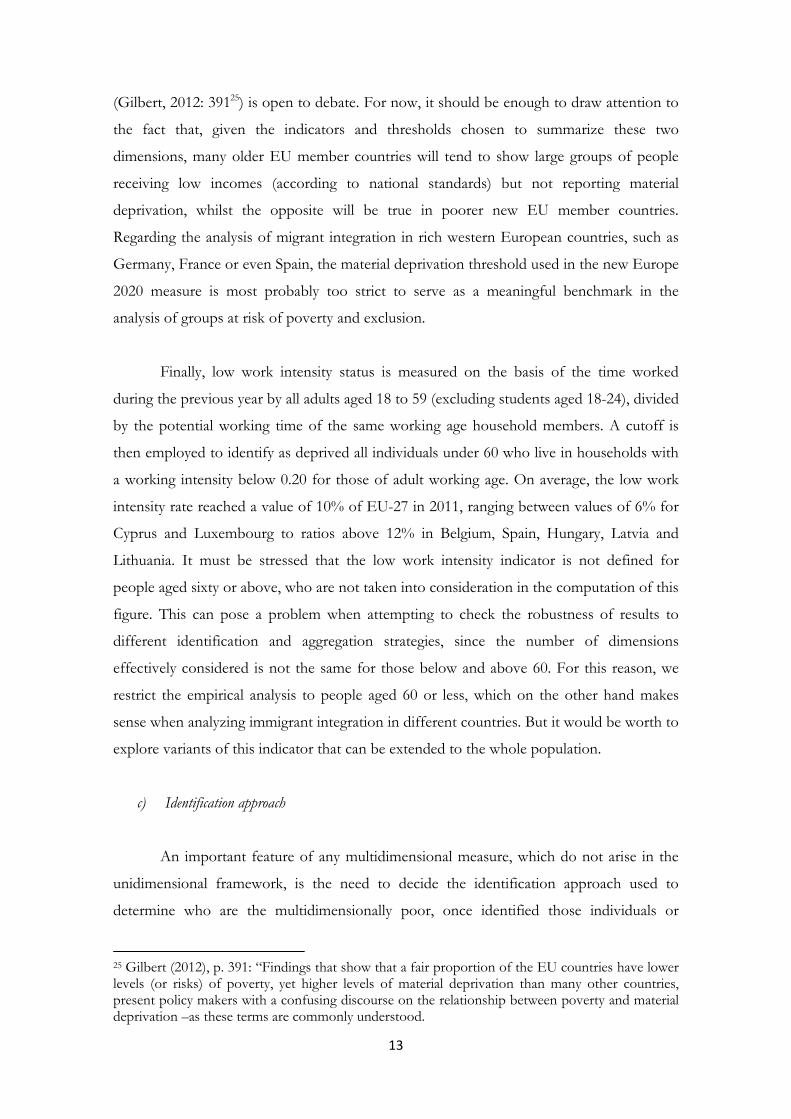
As stated before, the overall poverty or exclusion rate can hide very different
overlapping patterns among dimensions, thus affecting the risk intensity and profile of the
groups deemed to be at risk. Graph 2 shows that this is clearly true for 2009 data: in 34 And especially in material deprivation. Many studies have highlighted this fact using different indicators, see for example recent work by Bossert, et al. (2013) or De Neubourg et al. (2012).
0,00
0,05
0,10
0,15
0,20
0,25
0,30
0,35
0,40
0,45
FR GE SP UK CA IT Ontario
Total Natives Immigrants
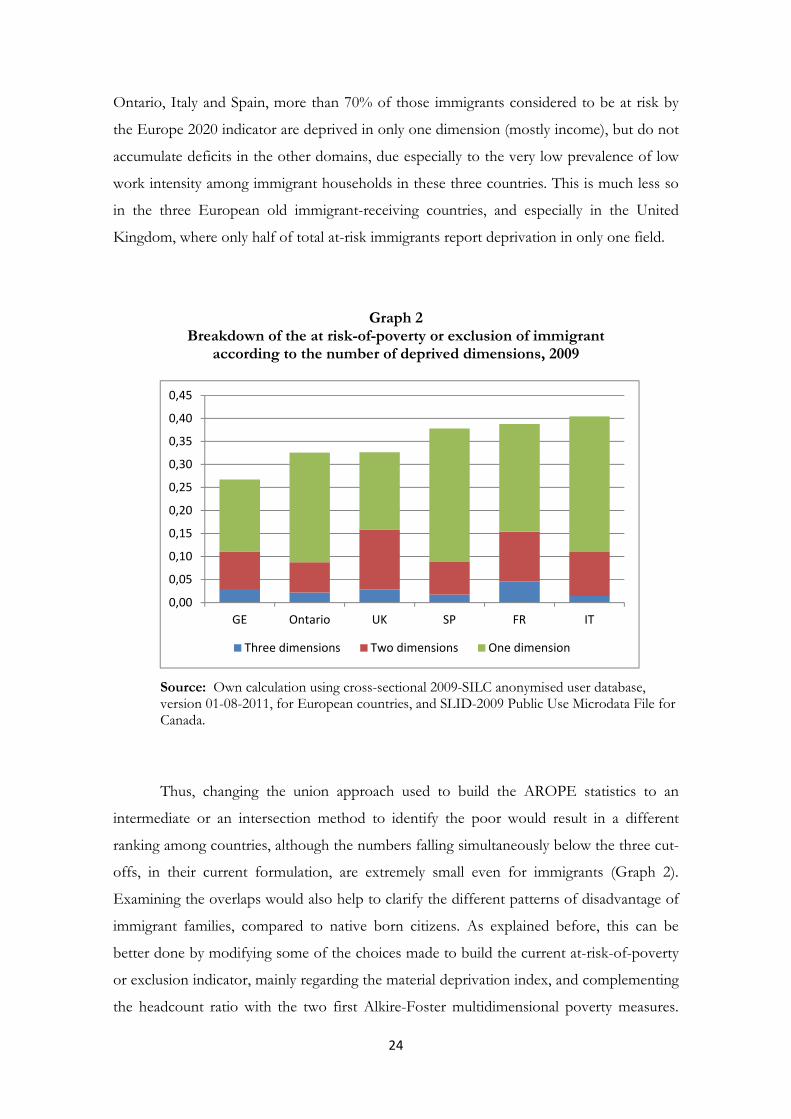
24
Ontario, Italy and Spain, more than 70% of those immigrants considered to be at risk by
the Europe 2020 indicator are deprived in only one dimension (mostly income), but do not
accumulate deficits in the other domains, due especially to the very low prevalence of low
work intensity among immigrant households in these three countries. This is much less so
in the three European old immigrant-receiving countries, and especially in the United
Kingdom, where only half of total at-risk immigrants report deprivation in only one field.
Graph 2 Breakdown of the at risk-of-poverty or exclusion of immigrant
according to the number of deprived dimensions, 2009
Source: Own calculation using cross-sectional 2009-SILC anonymised user database, version 01-08-2011, for European countries, and SLID-2009 Public Use Microdata File for Canada.
Thus, changing the union approach used to build the AROPE statistics to an
intermediate or an intersection method to identify the poor would result in a different
ranking among countries, although the numbers falling simultaneously below the three cut-
offs, in their current formulation, are extremely small even for immigrants (Graph 2).
Examining the overlaps would also help to clarify the different patterns of disadvantage of
immigrant families, compared to native born citizens. As explained before, this can be
better done by modifying some of the choices made to build the current at-risk-of-poverty
or exclusion indicator, mainly regarding the material deprivation index, and complementing
the headcount ratio with the two first Alkire-Foster multidimensional poverty measures.
0,00
0,05
0,10
0,15
0,20
0,25
0,30
0,35
0,40
0,45
GE Ontario UK SP FR IT
Three dimensions Two dimensions One dimension
25
The adjustments in the material deprivation index are intended to increase the level of
consistency and comparability of the scale currently used, checking the sensitivity of results
when a different list of indicators is used and also when the threshold is changed so that
not only “severe” material deprivation situations are considered to be risk-generating. At
the same time, computing Alkire-Foster M0 and M1 measures will provide us with
alternative summary estimates of the risk of poverty and exclusion which, unlike the
headcount ratio, are able to reflect the intensity, and not only the extension, of the
disadvantages suffered by the households.
Table A.4 shows the material deprivation rates resulting from two alternative, less
severe, measures, which can be obtained from the set of deprivation indicators currently
collected in EUSILC. The first one relies on the same list of nine indicators, but changes
the dimensional threshold, so that households are considered deprived if they cannot
afford three or more goods or activities, instead or four or more. The second one also
replaces the items on basic commodities which are not retained in the updated list to be
collected since 2013 on (television, telephone, washing machine) with three indicators
related to the difficulty to make ends meet, the affordability of dental care when needed,
and the enforced lack of a computer at home. For Ontario, the three definitions
correspond to applying respectively the thresholds of three or more items, two or more
items (official cut-off in the Ontario’s Poverty Reduction Strategy) and one or more items out
of the list of 10 indicators included in the Ontario Material Deprivation Index. As it can be
easily seen in the Table, Spain stands out as being the country most affected by these
changes, especially among immigrants (Graph A.1). Using the third definition, almost one
in two foreign born persons would suffer material deprivation in 2009, as opposed to only
11,6% in the first column. Using the second concept, which gives rise to results that lie in
between the former for all the countries, the material deprivation rate of Spanish
immigrants would be 31,9%, the highest, together with Italy, among the six countries.
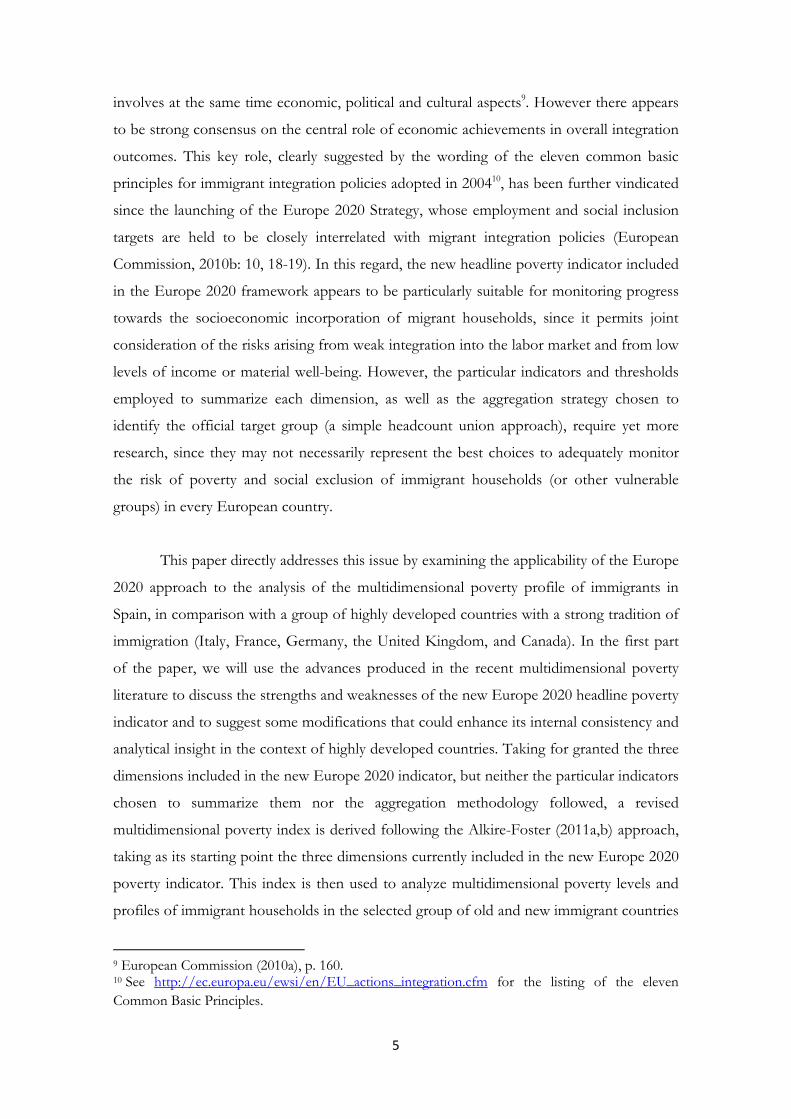
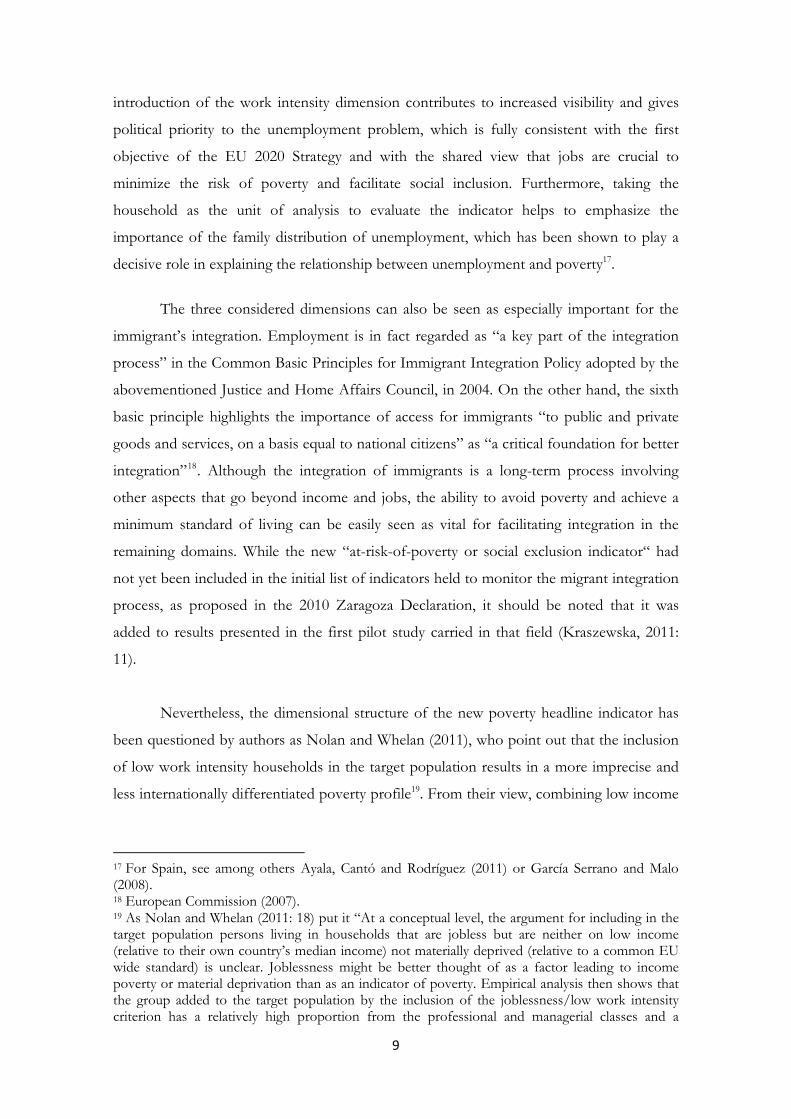
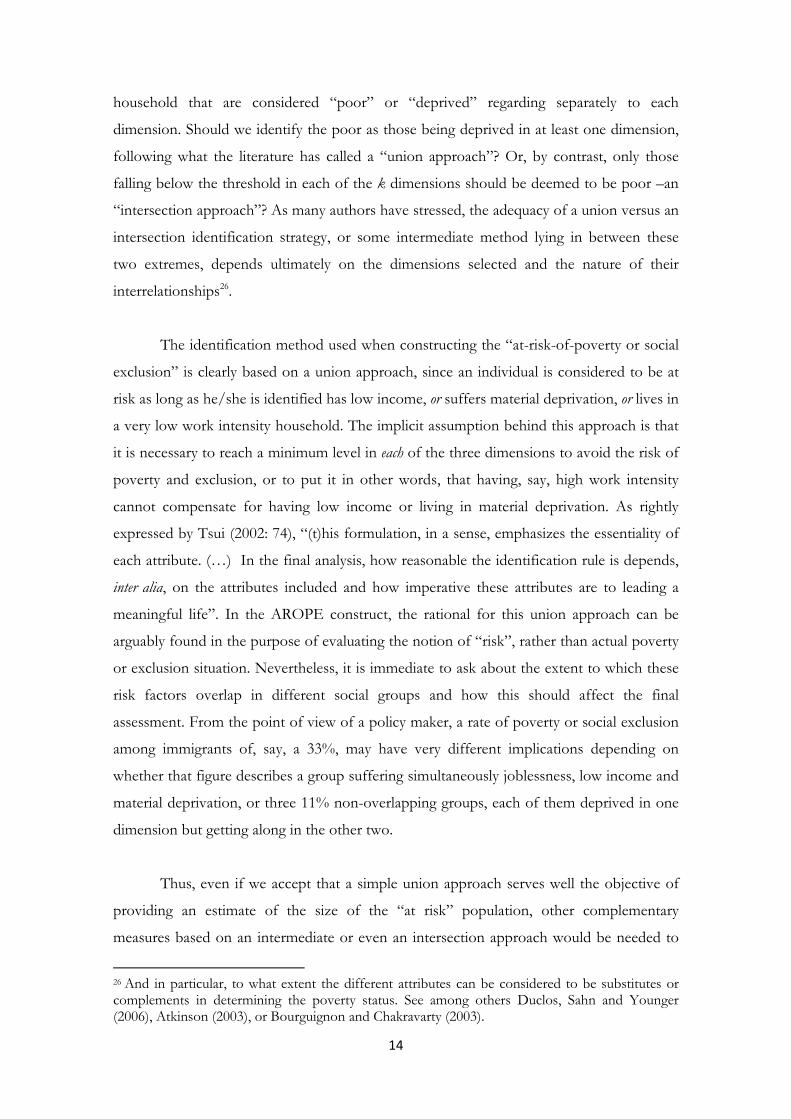
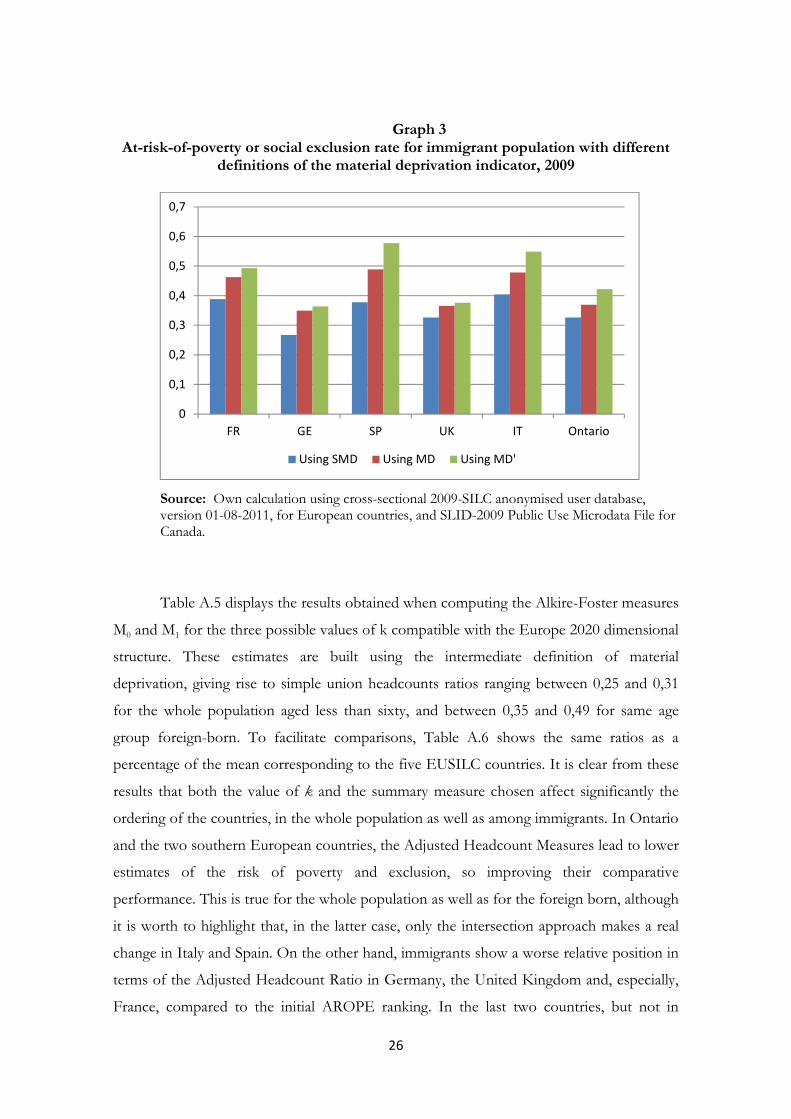
Graph 3 below shows how changing the material deprivation index would affect
the overall at-risk-of-poverty or exclusion rates for immigrant population in Spain and the
other countries, keeping constant the remaining AROPE measurement assumptions. Both
alternatives produce a more differentiated pattern across countries, with overall rates well
above 50% in Spain and Italy when the second list of indicators is used.
26
Graph 3 At-risk-of-poverty or social exclusion rate for immigrant population with different
definitions of the material deprivation indicator, 2009
Source: Own calculation using cross-sectional 2009-SILC anonymised user database, version 01-08-2011, for European countries, and SLID-2009 Public Use Microdata File for Canada.
Table A.5 displays the results obtained when computing the Alkire-Foster measures
M0 and M1 for the three possible values of k compatible with the Europe 2020 dimensional
structure. These estimates are built using the intermediate definition of material
deprivation, giving rise to simple union headcounts ratios ranging between 0,25 and 0,31
for the whole population aged less than sixty, and between 0,35 and 0,49 for same age
group foreign-born. To facilitate comparisons, Table A.6 shows the same ratios as a
percentage of the mean corresponding to the five EUSILC countries. It is clear from these
results that both the value of k and the summary measure chosen affect significantly the
ordering of the countries, in the whole population as well as among immigrants. In Ontario
and the two southern European countries, the Adjusted Headcount Measures lead to lower
estimates of the risk of poverty and exclusion, so improving their comparative
performance. This is true for the whole population as well as for the foreign born, although
it is worth to highlight that, in the latter case, only the intersection approach makes a real
change in Italy and Spain. On the other hand, immigrants show a worse relative position in
terms of the Adjusted Headcount Ratio in Germany, the United Kingdom and, especially,
France, compared to the initial AROPE ranking. In the last two countries, but not in
0
0,1
0,2
0,3
0,4
0,5
0,6
0,7
FR GE SP UK IT Ontario
Using SMD Using MD Using MD'
27
Germany, this worsening is much greater than for the native-born, so suggesting the
existence of a bigger origin-related gap at the bottom of the multidimensional poverty
scale. A similar picture emerges from the use of the Adjusted Poverty Gap, also included in
Table A.5.
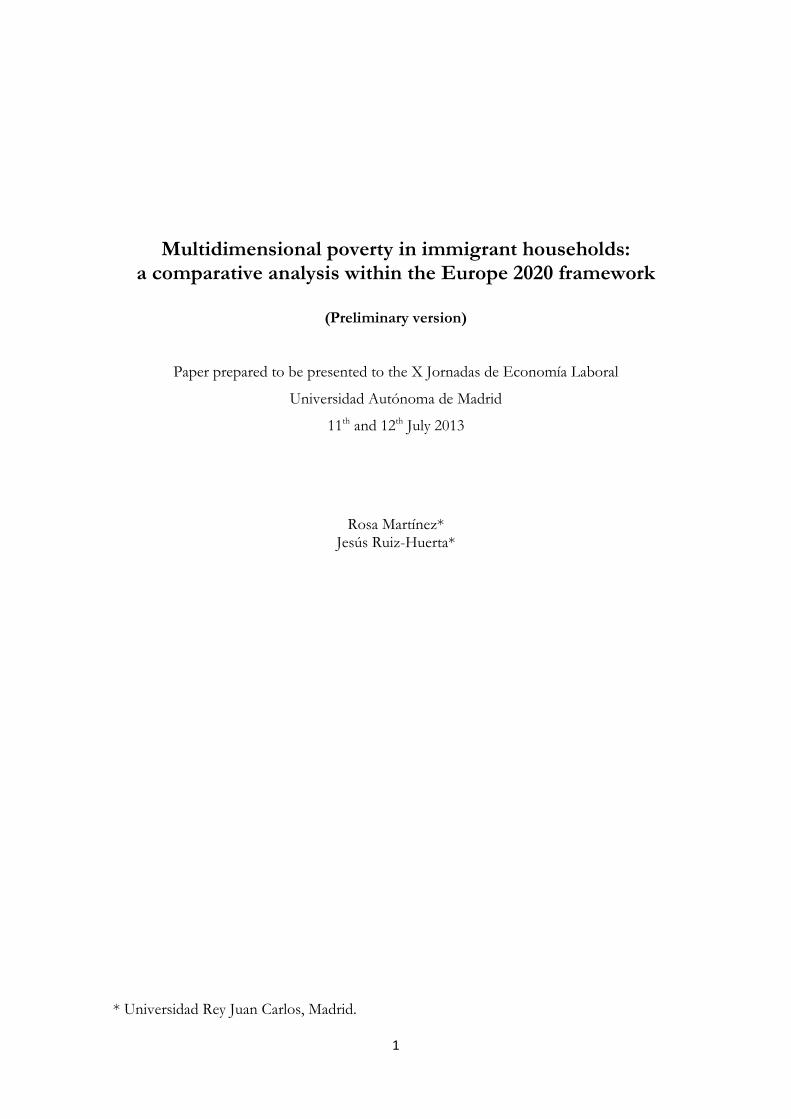
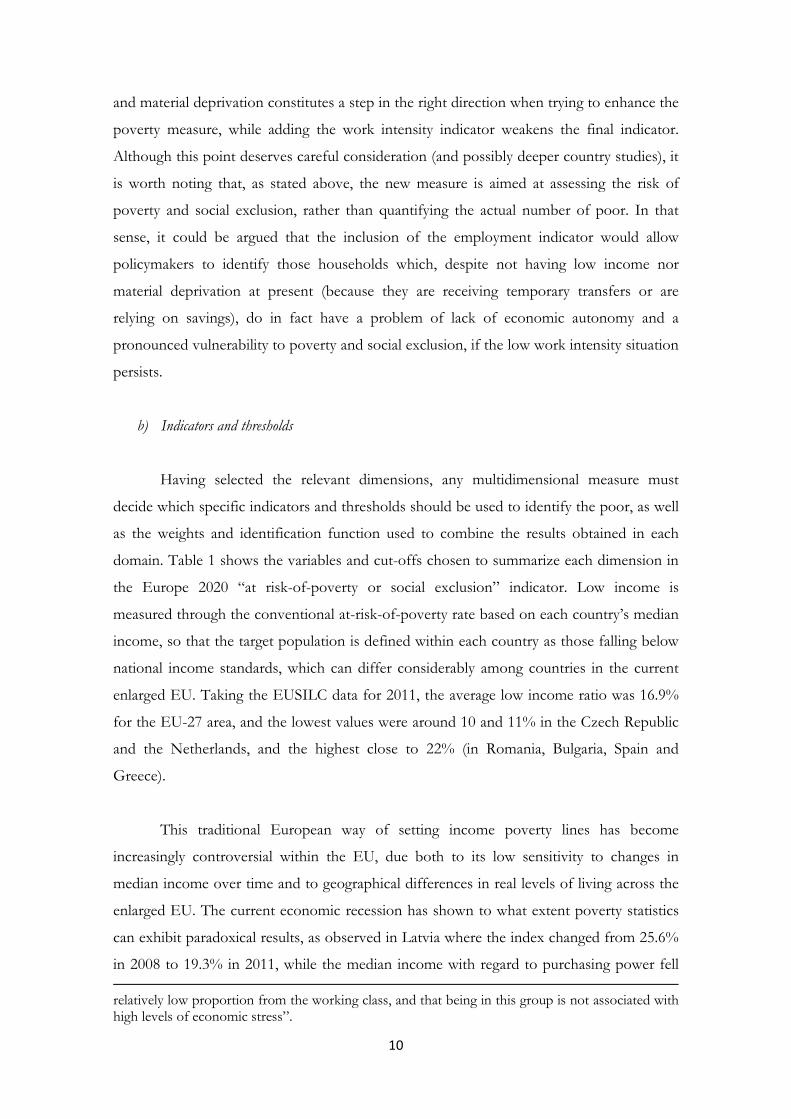
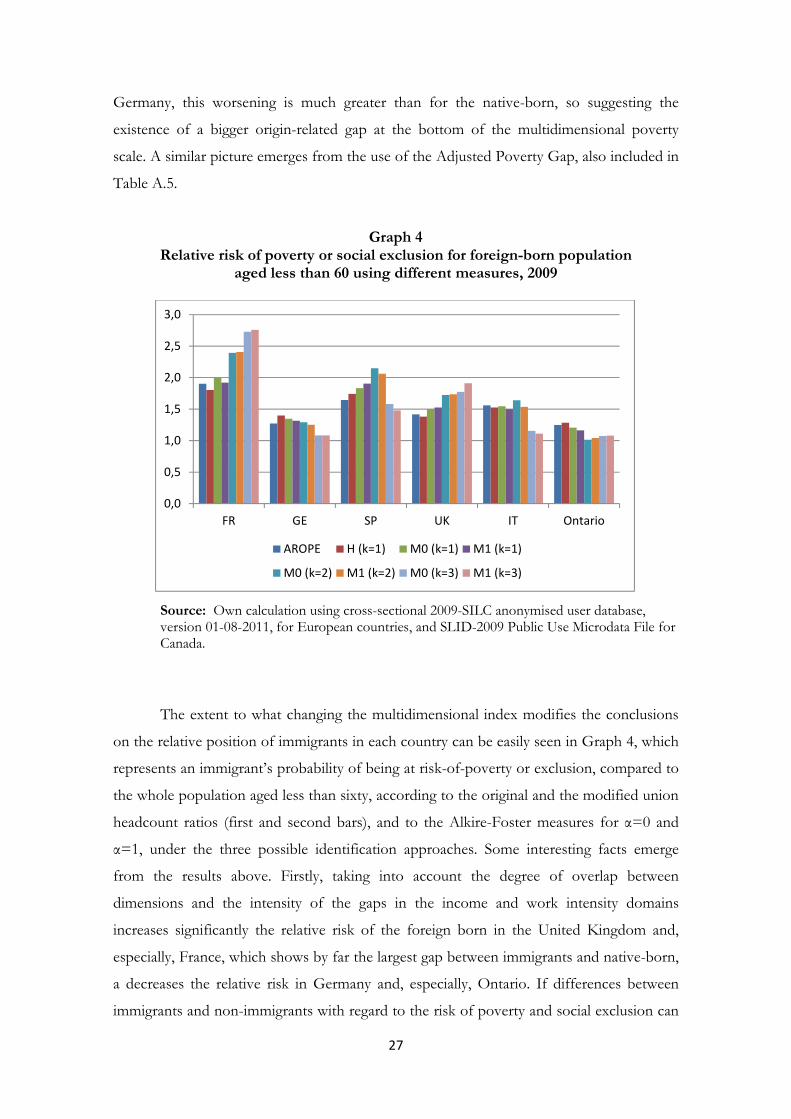
Graph 4 Relative risk of poverty or social exclusion for foreign-born population
aged less than 60 using different measures, 2009
Source: Own calculation using cross-sectional 2009-SILC anonymised user database, version 01-08-2011, for European countries, and SLID-2009 Public Use Microdata File for Canada.
The extent to what changing the multidimensional index modifies the conclusions
on the relative position of immigrants in each country can be easily seen in Graph 4, which
represents an immigrant’s probability of being at risk-of-poverty or exclusion, compared to
the whole population aged less than sixty, according to the original and the modified union
headcount ratios (first and second bars), and to the Alkire-Foster measures for α=0 and
α=1, under the three possible identification approaches. Some interesting facts emerge
from the results above. Firstly, taking into account the degree of overlap between
dimensions and the intensity of the gaps in the income and work intensity domains
increases significantly the relative risk of the foreign born in the United Kingdom and,
especially, France, which shows by far the largest gap between immigrants and native-born,
a decreases the relative risk in Germany and, especially, Ontario. If differences between
immigrants and non-immigrants with regard to the risk of poverty and social exclusion can
0,0
0,5
1,0
1,5
2,0
2,5
3,0
FR GE SP UK IT Ontario
AROPE H (k=1) M0 (k=1) M1 (k=1)
M0 (k=2) M1 (k=2) M0 (k=3) M1 (k=3)
28
be taken as a proxy to the success of the integration process, this Canadian region would
yields the best results, and France the worst. For Spain and Italy, the results are mixed:
compared to the initial AROPE picture, the relative risk faced by the foreign born tends to
grow (Spain) or remain stable (Italy) for both M0 and M1 when using the union or the
intermediate identification approach, but drops sharply for k=3 measures. With these latter
indicators, Italy would exhibit nearly inexistent gaps, like Germany and Ontario. In the case
of Spain, the risk would remain well above general population values, but below levels
suggested by the original union headcount measure.
On the other hand, in all countries, but especially in Spain and France, the change
in the identification approach (choice of k) has far more impact in the gap between national
and immigrant’s risk of poverty or exclusion than the particular measure used (H, M0 or
M1). This result is not surprising given the short number of total dimensions involved and
the fact that the normalized gaps are taken into account for only two of them, but raises
important issues regarding the policy implications of different identification thresholds.
The fact that only very few immigrant households have low work intensity in these
countries contributes importantly to the fall of risk rates when employing an intersection
approach, and can obviously be read as indicating a good degree of integration in the labor
market. But this pattern has also a troubling reading, since it means that jobs and high work
intensity are not necessarily enough to lift many immigrants out of poverty and material
deprivation. Moreover, as many studies have emphasized, labor integration of migrants has
been comparatively high, but also extremely precarious, in Spain and some of the other
new Mediterranean immigration countries35. In next section we examine to what extent the
deep economic crisis started in 2008 has changed the risk of poverty and social exclusion in
the case of Spain, both for immigrants and for the native born.
b) Changes over the economic downturn
The current economic recession has put under pressure the social agenda in
European countries, due to stagnating real income, rising unemployment and higher low
income rates among the working age population in many countries. Spain stands up in this
context as one of the countries where the overall risk of poverty and social exclusion has
increased most markedly since the mid-00, from around 23% through the period 2005- 35See among others Gradín and Del Río (2013), Cachón (2009), Fernández and Ortega (2008), Calderón and Hidalgo (2007), Amuedo-Dorantes and De la Rica (2007), Hipólito et al.(2010).
29
2009 to 27% in 2011. Generally speaking, the worsening has been bigger for active age
adults than for retired people, due to the negative impact of the recession in the
employment rates in most of the countries. Graph A.2 shows that this is particularly the
case in Spain, with a clear upsurge of low income, low work intensity and at-risk-of-poverty
or exclusion rates both among native and foreign prime age workers over the latest years.
Severe material deprivation has also tended to increase, although maintaining low absolute
values, due partly to the high weight attached to widely owned durables in the current 9-
items Eurostat list.
Table A.8 shows how the three dimensions and the above summary measures have
evolved in Spain throughout the period 2008-2011, for immigrants and for the entire
population. The ratio in last column indicates the proportional change between the first
and the last years considered. It is easy to see from this table that work intensity is by far
the dimension which has contributed the most to the worsening risk of poverty and
exclusion, with values that have almost doubled in only four years. This indicator has
deteriorated most for immigrant population, whose very low work intensity rates have
grown from below 4% in 2008 to above 17% in 2011.
Data in Table A.8 also make it clear that the recession’s impact on the risk of
poverty and exclusion is higher when using the Adjusted Headcount Ratio and the
Adjusted Poverty Gap, especially among immigrants. According to the Europe 2020
indicator, the overall poverty or exclusion rate has risen by about 30% for the total
population aged sixty or less (20% in the case of immigrants). By contrast, the increase
would amount to 40% to 150% for the A-F measures, with growing impacts as the value of
k changes from 1 to 3. This means that the multiple deprived population has expanded at a
quicker pace than the at-risk population, as measured by the Europe 2020 indicator.
This is especially true for immigrants when focusing on the k=3 measures. The
group suffering simultaneously low income, material deprivation and very low work
intensity is 6 times higher in 2011 than in 2008, and the increase has been even more
noticeable for children (whose M0 and M1 measures based in the intersection approach
have multiplied by 8 in only four years). According to the latest available data, almost one
in ten immigrant children lives in households deprived on the three dimensions, compared
to a value of 3% (not shown in Table) for children in native born headed households. This
30
growing gap, if not corrected, could seriously undermine not only current but also future
integration achievement of migrant minorities in Spain, given the strong influence,
suggested by a wide literature, of children economic well-being in adult outcomes.
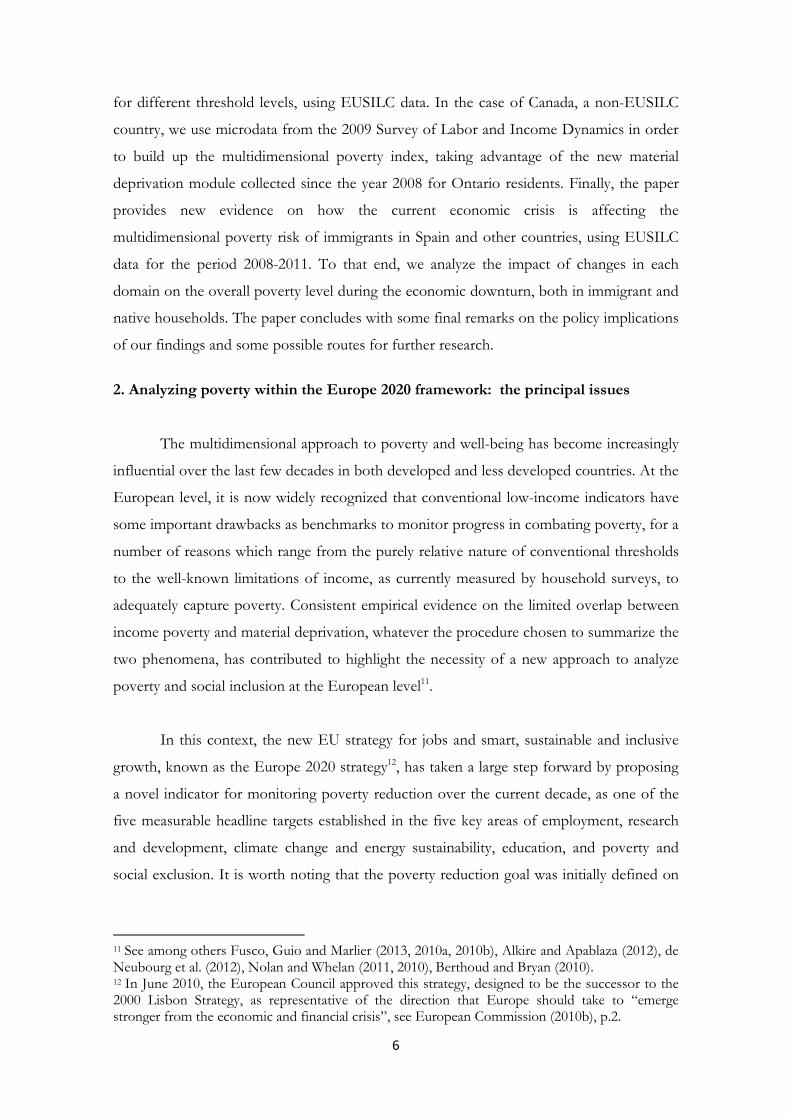
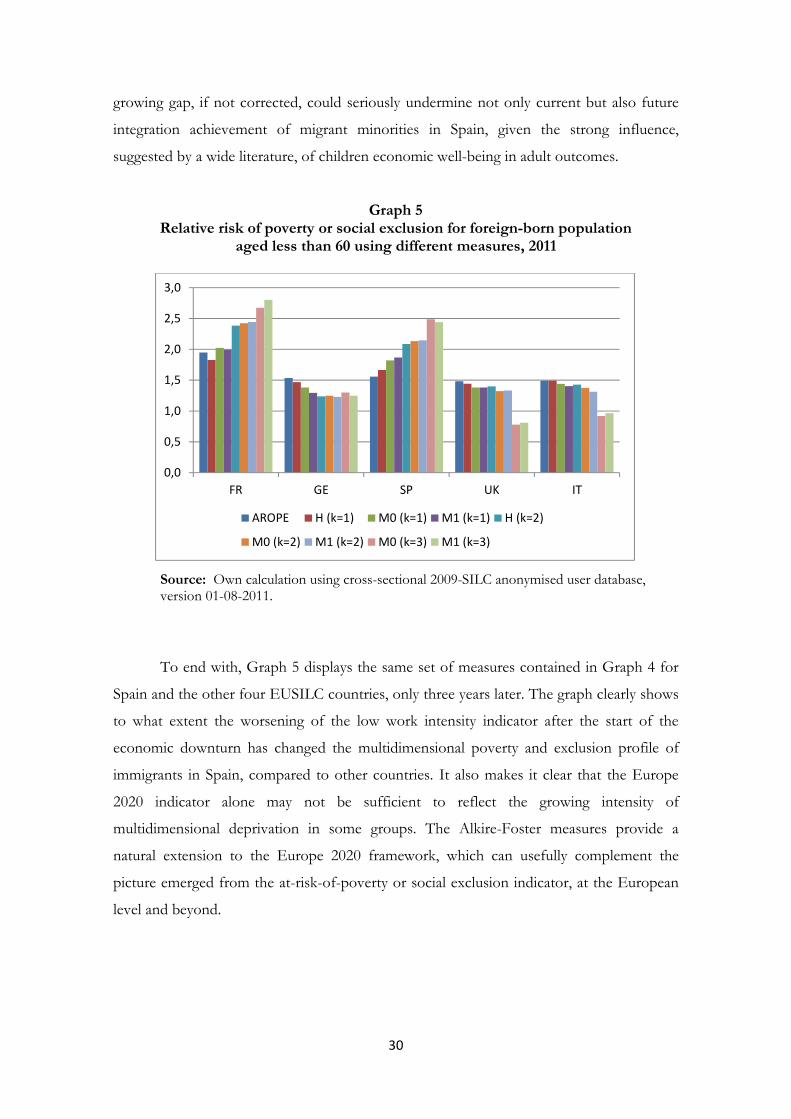
Graph 5 Relative risk of poverty or social exclusion for foreign-born population
aged less than 60 using different measures, 2011
Source: Own calculation using cross-sectional 2009-SILC anonymised user database, version 01-08-2011.
To end with, Graph 5 displays the same set of measures contained in Graph 4 for
Spain and the other four EUSILC countries, only three years later. The graph clearly shows
to what extent the worsening of the low work intensity indicator after the start of the
economic downturn has changed the multidimensional poverty and exclusion profile of
immigrants in Spain, compared to other countries. It also makes it clear that the Europe
2020 indicator alone may not be sufficient to reflect the growing intensity of
multidimensional deprivation in some groups. The Alkire-Foster measures provide a
natural extension to the Europe 2020 framework, which can usefully complement the
picture emerged from the at-risk-of-poverty or social exclusion indicator, at the European
level and beyond.
0,0
0,5
1,0
1,5
2,0
2,5
3,0
FR GE SP UK IT
AROPE H (k=1) M0 (k=1) M1 (k=1) H (k=2)
M0 (k=2) M1 (k=2) M0 (k=3) M1 (k=3)
31
References Aleksynka, M; Algan, Y. (2010): “Assimilation and Integration of Immigrants in Europe”, IZA Discussion Paper Nº 5185, Institute for the Study of Labour, Bonn. Alkire, S. and Apablaza, M. (2012), “Multidimensional poverty measurement for EU-SILC countries”, Paper presented at the 2012 EU-SILC International Conference, Vienna, 6-7 December 2012. Alkire, S., Roche, J.M.; Seth, S. (2011): “Sub-national disparities and inter-temporal evolution of multidimensional poverty across developing countries”, OPHI Working Papers. Alkire, S. and Foster, J. (2011a): “Counting and Multidimensional Poverty”, Journal of Public Economics, 95: 476-487. Alkire, S. and Foster, J. (2011b): “Understandings and misunderstandings of multidimensional poverty measurement”, Journal of Economic Inequality, 9, 289-314. Alkire, S. and E.M. Santos (2010): “Acute Multidimensional Poverty: A New Index for Developing Countries”. OPHI Working Paper 38, July 2010. Amuedo-Dorantes, C.; De la Rica, S. (2007): “Labour Market Assimilation of Recent Immigrants in Spain”, British Journal of Industrial Relations, n.º 45(2), pp. 257-284. Atkinson, A.B. and Marlier, E. (2010): “Analysing and Measuring Social Inclusion in a Global Context”, New York: United Nations. Atkinson, A.B., and E. Marlier [eds.] (2010), Income and living conditions in Europe. Luxembourg: Publications Office of the European Union, 2010. Atkinson, A.B. (2003), "Multidimensional Deprivation: Contrasting Social Welfare and Counting Approaches", Journal of Economic Inequality, 1, 51--65. Ayala, L., Cantó, O. and Rodríguez, J.G. (2011): “Poverty and the business cycle: The role of intra-household distribution of unemployment”, ECINEQ Working Paper nº222, 2011. Bhalla, A.S. and Mc Cormick, P. (2009) Poverty among Immigrant Children in Europe, Houndsmills: Palgrave, McMillan. Berthoud, R. and Bryan, M. (2010): “Income, deprivation and poverty: a longitudinal analysis”, Journal of Social Policy, 40(1), 135-156. Bibi, S. (2005): “Measuring Poverty in a multidimensional perspective: A Review of literature”, PMMA Working Papers 2005-07. Borjas, G.J. (1985): Assimilation, Changes in Cohort Quality, and the Earnings of Immigrants, Journal of Labor Economics, n.º 3(4), pp. 463-89. Boubtane, E., Coulibaly, D. and Rault, C. (2011): “Immigration, unemployment and growth
32
in the host country: Bootstrap Panel Granger Causality Analysis on OECD countries”, IZA Discussion Paper 5853. Bourguignon, F. and S.R. Chakravarty (2003): “The measurement of multidimensional poverty”. Journal of Economic Inequality. (p. 25-49) Bossert, W., Chakravarty, S.R. and D’Ambrosio, C. (2013): “Multidimensional poverty and material deprivation with discrete data”, Review of Income and Wealth, 59(1), pp. 29-43. Bossert, W., Chakravarty, S.R., D’Ambrosio, C. (2009): “Measuring Multidimensional Poverty: the Generalized Counting Approach”, ECINEQ Working Papers, 2009. Büchel, F. y Frick, J. (2005): “Immigrants’ economic performance across Europe –does immigration policy matter?”, Population Research and Policy Review, 24(2), pp. 175-212. Burstein, M. (2005): “Combatting the Social Exclusion of At-Risk Groups”, Research Paper, November 2005, Ottawa: Policy Research Initiative (PRI). Cachón, L. (2007): “La inmigración y el mercado de trabajo en la Unión Europea”, Cuadernos Europeos de Deusto, nº 36/2007, pp. 77-106. Calderón, M.J.; Hidalgo, A. (2007): “La segregación sectorial y ocupacional de los inmigrantes en España: Identificación de los espacios laborales prioritarios en los países de origen”, VII Jornadas de Economía Laboral, 12-13 julio 2007, Las Palmas de Gran Canaria. Carrasco, C. y García Serrano, C. (2012): Inmigración y mercado de trabajo. Informe 2011, Madrid: Ministerio de Empleo y Seguridad Social.
Carrasco, R. and García Pérez, J.I. (2008): "Unemployment duration among immigrants and natives: unobserved heterogeneity in a multi-spell duration model," Economics Working Papers we086933, Universidad Carlos III. Causa, O.; Jean, S. (2007), "Integration of Immigrants in OECD Countries: Do Policies Matter?", OECD Economics Department Working Papers, No. 564, OECD Publishing. Chiswick, B.R. (1978): The Effect of Americanization on the Earnings of Foreign-born Men, Journal of Political Economy, n.º 86(5), pp. 897-921. de Giorgi, G. and Pellizzari, M. (2009). ‘Welfare migration in Europe’, Labour Economics, 16(4), 353-363. de Neubourg, C., Bradshaw, J., Chzhen, Y., Main, G., Martorano, B. and Menchini, L. (2012): “Child deprivation, multidimensional poverty and monetary poverty in Europe”, UNICEF Innocenti Working Paper 2012/02, Background paper 2 for UNICEF Innocenti Report Card 10. Deutsch, J. ; Silber, J. (2006): “Ethnic origin and multidimensional relative poverty in Israel: a study based on the 1995 Israeli census”, Research in Labor Economics, vol. 24, pp. 235-264. Dickes P., Fusco A., Marlier E. (2008), Socially perceived necessities of life across EU
33
countries: Structures and consensus, Paper presented at the 30th IARIW General Conference, Slovenia, 24-30 August. Duclos, J.Y., D. Sahn y S. D. Younger (2006): “Robust Multidimensional Poverty Comparisons with Discrete Indicators of Well-being”, CIRPÉE Working Paper, 06-28. European Commission (2010a): Handbook on Integration for policy-makers and practitioners, 3rd edition, April 2010, Directorate-General for Justice, Freedom and Security, European Communities. European Commission (2010b): “Europe 2020. A strategy for smart, sustainable and inclusive growth”, Communication from the Commission, COM (2010) 2020 final, Brussels, 3.3.2010. European Commission (2007): Handbook on Integration for Policy-Makers and Practitioners, 2nd ed., Directorate- General for Justice, Freedom and Security, European Communities, Brussels, 2007. Facchini, G. and Mayda, A.M. (2009): ‘Does the welfare state affect individual attitudes toward immigrants? Evidence across countries’, Review of Economics and Statistics, 91(2), 295–314. Fernández, C.; Ortega, A.C. (2008): “Labor Market Assimilation of Immigrants in Spain: Employment at the Expense of Bad Job-Matches?”, Spanish Economic Review, n.º 10(2), pp. 83-107. Fix, M.E. [ed.] (2009). Immigrants and Welfare: The impact of welfare reform on America’s newcomers, New York: Russell Sage Foundation. Fusco, A., Guio, A-C. and Marlier, E. (2013): “Building a Material Deprivation Index in a Multinational Context: Lessons from the EU Experience”, in V. Bérenger and F. Bresson (eds.), Poverty and Social Exclusion Around the Mediterranean Sea, Economic Studies in Inequality, Social Exclusion and Well-Being, Vol.9. New York: Springer. Fusco, A, Guio, A-C and Marlier, E. (2010a): “Characterizing the income poor and the materially deprived in European Countries”, in A. B. Atkinson and E. Marlier [eds.], Income and Living Conditions in Europe. Luxembourg: Publications Office of the European Union. Fusco, A, Guio, A-C and Marlier, E.: (2010b): “Income poverty and material deprivation in European countries”, Eurostat Methodologies and Working Papers, Luxembourg. García Serrano, C. and Malo, M.A. (2008): “Mercado de trabajo”. In Arriba, A. (coord..): Políticas y bienes sociales. Procesos de vulnerabilidad y exclusión social. Madrid: Fundación FOESSA. Giulietti, C., Guzi, M., Kahanec, M. and K.F. Zimmermann (2011) “Unemployment Benefits and Immigration: Evidence from the EU”, IZA Discussion Papers, 6075. Gómez-Salvador and Leiner-Killinger (2008), An Analysis of Youth Unemployment in the Euro Area, Occasional Paper Series, 89, European Central Bank, Frankfurt am Main.
34
Goodam, S.W. (2010): “Integration Requirements for Integration’s Sake? Identifying, Categorising and Comparing Civic Integration Policies”, Journal of Ethnic and Migration Studies, 36(5), 753-772. Gradín, C. y C. del Río (2013): “El desempleo de inmigrantes, mujeres y jóvenes”. En, Fundación Alternativas: Informe sobre la Desigualdad 2013. Pp.135-192 Guio, A.-C. (2005): ‘Material Deprivation in the EU’, Statistics in Focus, Eurostat, Statistics in Focus 21/2005, European Communities: Luxembourg. Guio, A.-C. and I. Engsted-Maquet (2007): Non-Income dimension in EU-SILC: Material deprivation and poor housing, in Comparative EU statistics on Income and Living Conditions: Issues and Challenges, Helsinki, Guio, A.-C. (2009), ‘What can be learned from deprivation indicators in Europe?’, Eurostat methodologies and working papers, Eurostat, Luxembourg. Hickman, M.; Crowley, H.; Mai, N. (2009): Immigration and social cohesion in the UK, York: Joseph Rowntree Foundation. Hildebrandt, V.; Pi Alperin, M.N.; Van Kerm, P. (2012): “Measuring and accounting for the deprivation gap of Portuguese immigrants in Luxembourg”, CEPS/INSTEAD Working Paper 2102-13. Luxembourg. Hipólito, S.; Ramos-Lobo, R.; Sanromá, E. (2010): "Movilidad ocupacional de los inmigrantes en una economía de bajas cualificaciones. El caso de España", Xarxa de Referència en Economia Aplicada (XREAP), 2010-6. IDEA (2009) “Europe: the continent of immigrants: Trends, structures and policy implications”, IDEA Working Papers, 13, Centre of Migration Research, Varsovia. Jacobs, D. y A. Rea (2007): “The end of national models? Integration courses and citizenship trajectories in Europe”, International Journal on Multicultural Societies, 9(2), pp.264-283. Joppke, C. (2007): “Beyond National Models: Civic Integration Policies for Immigrants in Western Europe”, West European Politics, 30(1), pp. 1—22. Joppke, C. (2010): Citizenship and Immigration, Cambridge: The Polity Press. Kahanec, M. , Zimmermann, K.F. (2009): ‘Migration in an enlarged EU: A challenging solution?’, in F. Keereman and I. Székely (eds), Five Years of an Enlarged EU: A positive sum game, Berlin: Springer, 63–94. Kahanec, M., Zimmermann, K.F. (2010): EU labour markets after post-enlargement migration, Berlin: Springer Kakawani, N. and J. Silber, eds. (2007): The Many Dimensions of Poverty, Palgrave Macmillan: Basingstoke
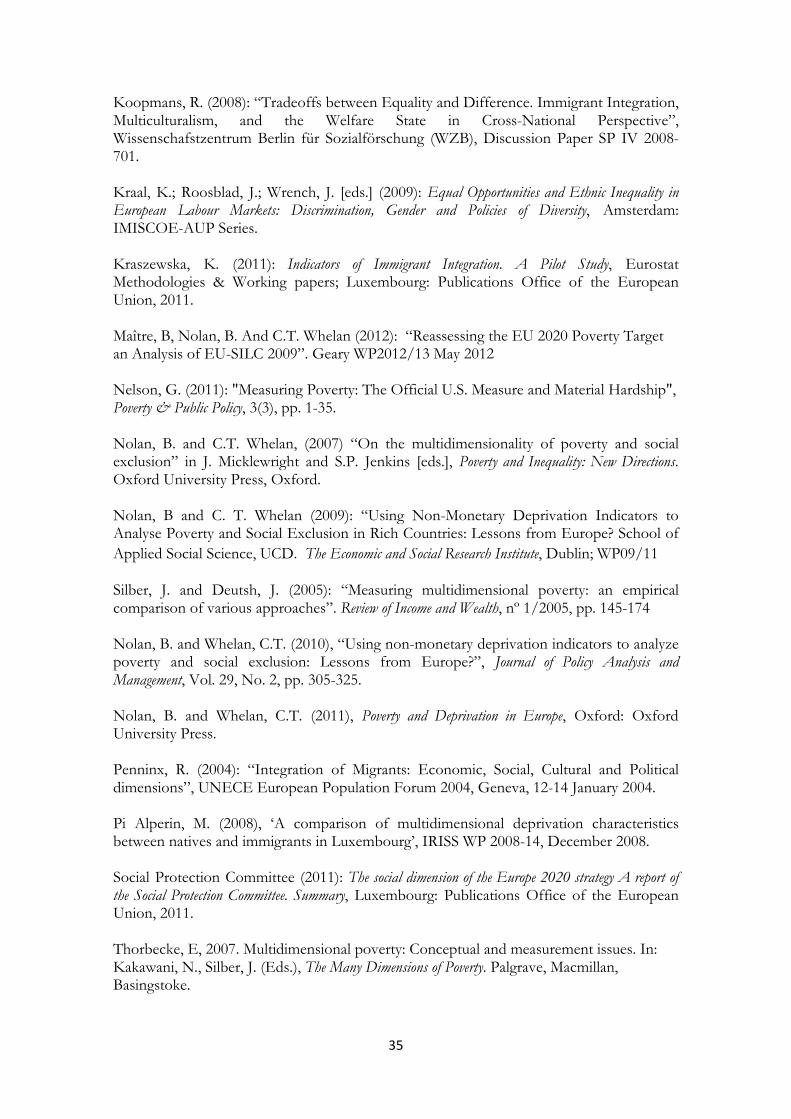
35
Koopmans, R. (2008): “Tradeoffs between Equality and Difference. Immigrant Integration, Multiculturalism, and the Welfare State in Cross-National Perspective”, Wissenschafstzentrum Berlin für Sozialförschung (WZB), Discussion Paper SP IV 2008-701. Kraal, K.; Roosblad, J.; Wrench, J. [eds.] (2009): Equal Opportunities and Ethnic Inequality in European Labour Markets: Discrimination, Gender and Policies of Diversity, Amsterdam: IMISCOE-AUP Series. Kraszewska, K. (2011): Indicators of Immigrant Integration. A Pilot Study, Eurostat Methodologies & Working papers; Luxembourg: Publications Office of the European Union, 2011. Maître, B, Nolan, B. And C.T. Whelan (2012): “Reassessing the EU 2020 Poverty Target an Analysis of EU-SILC 2009”. Geary WP2012/13 May 2012 Nelson, G. (2011): "Measuring Poverty: The Official U.S. Measure and Material Hardship", Poverty & Public Policy, 3(3), pp. 1-35. Nolan, B. and C.T. Whelan, (2007) “On the multidimensionality of poverty and social exclusion” in J. Micklewright and S.P. Jenkins [eds.], Poverty and Inequality: New Directions. Oxford University Press, Oxford. Nolan, B and C. T. Whelan (2009): “Using Non-Monetary Deprivation Indicators to Analyse Poverty and Social Exclusion in Rich Countries: Lessons from Europe? School of Applied Social Science, UCD.The Economic and Social Research Institute, Dublin; WP09/11 Silber, J. and Deutsh, J. (2005): “Measuring multidimensional poverty: an empirical comparison of various approaches”. Review of Income and Wealth, nº 1/2005, pp. 145-174 Nolan, B. and Whelan, C.T. (2010), “Using non-monetary deprivation indicators to analyze poverty and social exclusion: Lessons from Europe?”, Journal of Policy Analysis and Management, Vol. 29, No. 2, pp. 305-325. Nolan, B. and Whelan, C.T. (2011), Poverty and Deprivation in Europe, Oxford: Oxford University Press. Penninx, R. (2004): “Integration of Migrants: Economic, Social, Cultural and Political dimensions”, UNECE European Population Forum 2004, Geneva, 12-14 January 2004. Pi Alperin, M. (2008), ‘A comparison of multidimensional deprivation characteristics between natives and immigrants in Luxembourg’, IRISS WP 2008-14, December 2008. Social Protection Committee (2011): The social dimension of the Europe 2020 strategy A report of the Social Protection Committee. Summary, Luxembourg: Publications Office of the European Union, 2011. Thorbecke, E, 2007. Multidimensional poverty: Conceptual and measurement issues. In: Kakawani, N., Silber, J. (Eds.), The Many Dimensions of Poverty. Palgrave, Macmillan, Basingstoke.
36
Tsui, K.Y. (2002), "Multidimensional Poverty Indices," Social Choice and Welfare, 19, 69--93. Whelan, C.T., B. Nolan and B. Maître, (2008), "Measuring Material Deprivation in the Enlarged EU," ESRI Working Paper No.249. Widmaier, S.; Dumont, J-C. (2011), “Are recent immigrants different? A new profile of immigrants in the OECD based on DIOC 2005/06”, OECD Social, Employment and Migration Working Papers Nº 126, Directorate for Employment, Labour and Social Affairs, OECD. Zimmermann, K., Barrett, A., Kahanec, M., Maître, B. Giulietti, C., and M. Guzi (2012): “Study on Active Inclusion of Migrants”, IZA Research Report No. 43
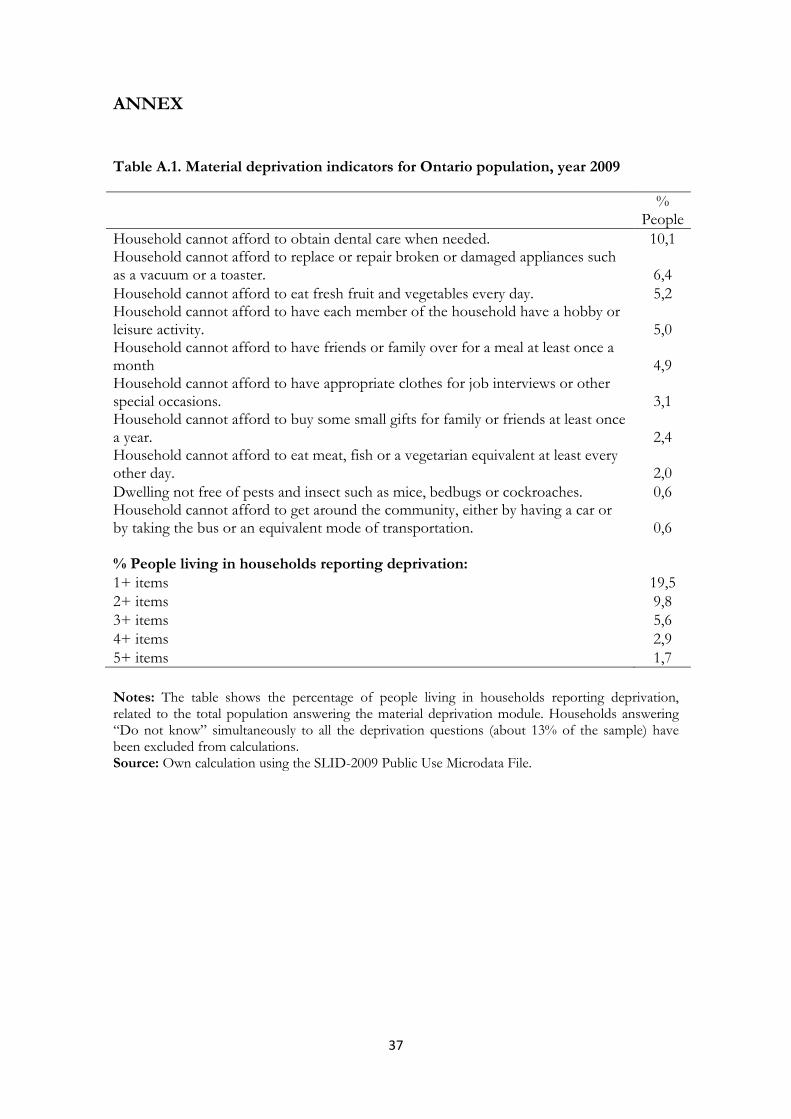
37
ANNEX
Table A.1. Material deprivation indicators for Ontario population, year 2009
%
People Household cannot afford to obtain dental care when needed. 10,1 Household cannot afford to replace or repair broken or damaged appliances such as a vacuum or a toaster. 6,4 Household cannot afford to eat fresh fruit and vegetables every day. 5,2 Household cannot afford to have each member of the household have a hobby or leisure activity. 5,0 Household cannot afford to have friends or family over for a meal at least once a month 4,9 Household cannot afford to have appropriate clothes for job interviews or other special occasions. 3,1 Household cannot afford to buy some small gifts for family or friends at least once a year. 2,4 Household cannot afford to eat meat, fish or a vegetarian equivalent at least every other day. 2,0 Dwelling not free of pests and insect such as mice, bedbugs or cockroaches. 0,6 Household cannot afford to get around the community, either by having a car or by taking the bus or an equivalent mode of transportation. 0,6 % People living in households reporting deprivation: 1+ items 19,5 2+ items 9,8 3+ items 5,6 4+ items 2,9 5+ items 1,7 Notes: The table shows the percentage of people living in households reporting deprivation, related to the total population answering the material deprivation module. Households answering “Do not know” simultaneously to all the deprivation questions (about 13% of the sample) have been excluded from calculations. Source: Own calculation using the SLID-2009 Public Use Microdata File.
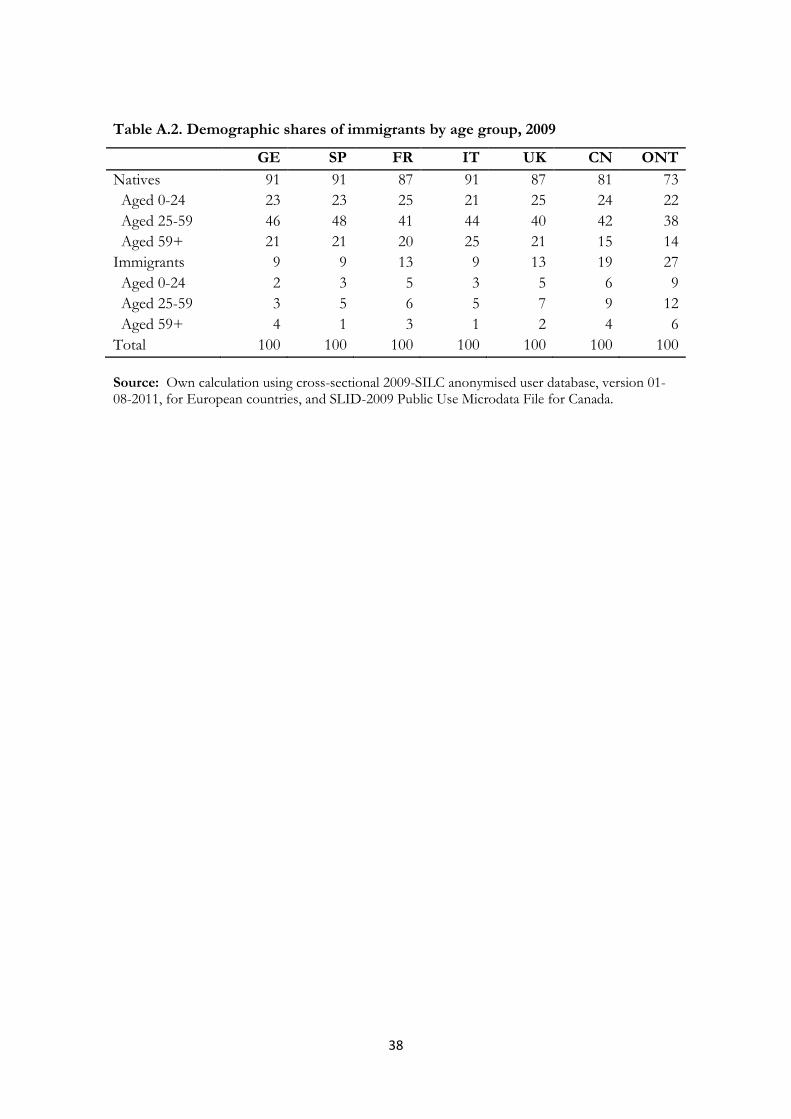
38
Table A.2. Demographic shares of immigrants by age group, 2009
GE SP FR IT UK CN ONT
Natives 91 91 87 91 87 81 73 Aged 0-24 23 23 25 21 25 24 22 Aged 25-59 46 48 41 44 40 42 38 Aged 59+ 21 21 20 25 21 15 14 Immigrants 9 9 13 9 13 19 27 Aged 0-24 2 3 5 3 5 6 9 Aged 25-59 3 5 6 5 7 9 12 Aged 59+ 4 1 3 1 2 4 6 Total 100 100 100 100 100 100 100 Source: Own calculation using cross-sectional 2009-SILC anonymised user database, version 01-08-2011, for European countries, and SLID-2009 Public Use Microdata File for Canada.
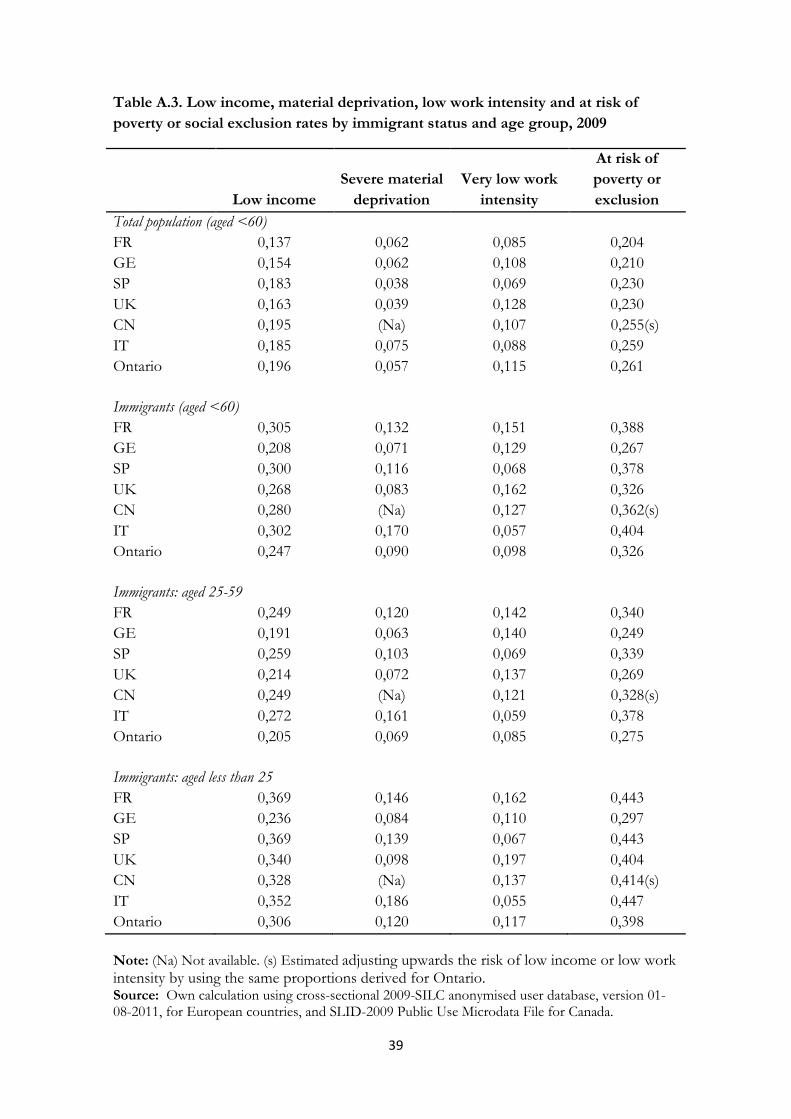
39
Table A.3. Low income, material deprivation, low work intensity and at risk of
poverty or social exclusion rates by immigrant status and age group, 2009
Low income
Severe material
deprivation
Very low work
intensity
At risk of
poverty or
exclusion
Total population (aged <60)
FR 0,137 0,062 0,085 0,204 GE 0,154 0,062 0,108 0,210 SP 0,183 0,038 0,069 0,230 UK 0,163 0,039 0,128 0,230 CN 0,195 (Na) 0,107 0,255(s) IT 0,185 0,075 0,088 0,259 Ontario 0,196 0,057 0,115 0,261
Immigrants (aged <60)
FR 0,305 0,132 0,151 0,388 GE 0,208 0,071 0,129 0,267 SP 0,300 0,116 0,068 0,378 UK 0,268 0,083 0,162 0,326 CN 0,280 (Na) 0,127 0,362(s) IT 0,302 0,170 0,057 0,404 Ontario 0,247 0,090 0,098 0,326
Immigrants: aged 25-59 FR 0,249 0,120 0,142 0,340 GE 0,191 0,063 0,140 0,249 SP 0,259 0,103 0,069 0,339 UK 0,214 0,072 0,137 0,269 CN 0,249 (Na) 0,121 0,328(s) IT 0,272 0,161 0,059 0,378 Ontario 0,205 0,069 0,085 0,275
Immigrants: aged less than 25 FR 0,369 0,146 0,162 0,443 GE 0,236 0,084 0,110 0,297 SP 0,369 0,139 0,067 0,443 UK 0,340 0,098 0,197 0,404 CN 0,328 (Na) 0,137 0,414(s) IT 0,352 0,186 0,055 0,447 Ontario 0,306 0,120 0,117 0,398
Note: (Na) Not available. (s) Estimated adjusting upwards the risk of low income or low work intensity by using the same proportions derived for Ontario. Source: Own calculation using cross-sectional 2009-SILC anonymised user database, version 01-08-2011, for European countries, and SLID-2009 Public Use Microdata File for Canada.
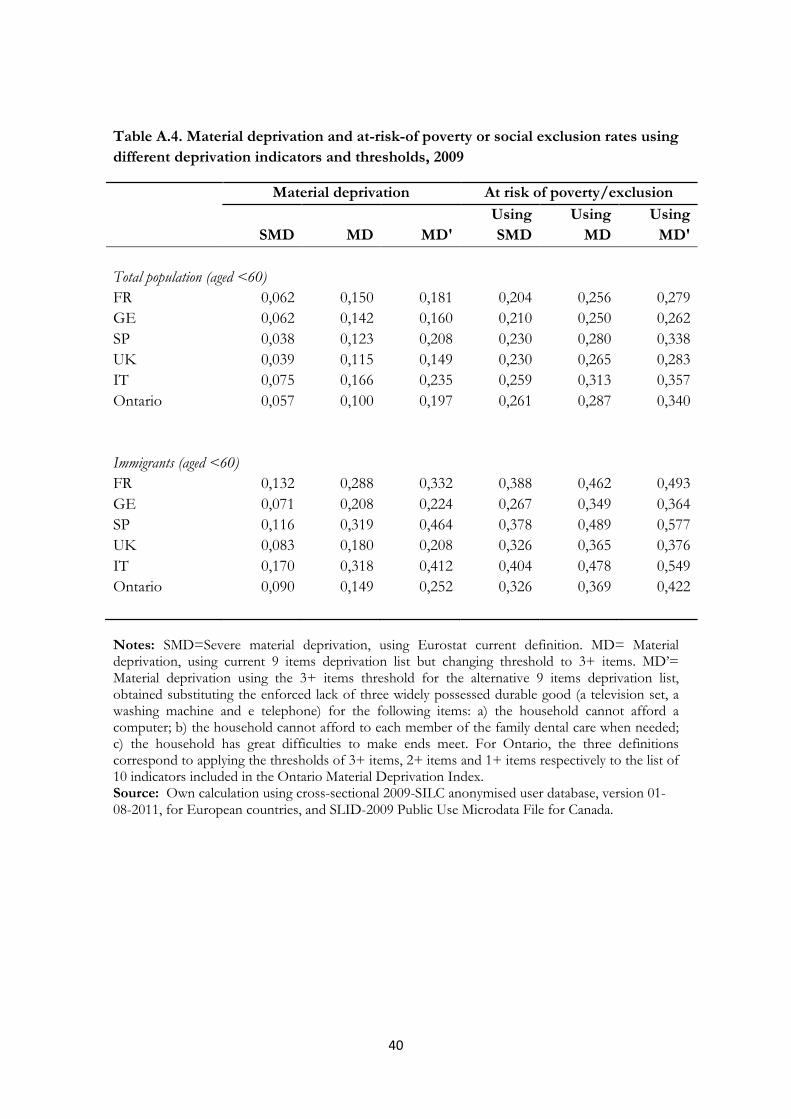
40
Table A.4. Material deprivation and at-risk-of poverty or social exclusion rates using
different deprivation indicators and thresholds, 2009
Material deprivation At risk of poverty/exclusion
SMD MD MD'
Using
SMD
Using
MD
Using
MD'
Total population (aged <60)
FR 0,062 0,150 0,181 0,204 0,256 0,279 GE 0,062 0,142 0,160 0,210 0,250 0,262 SP 0,038 0,123 0,208 0,230 0,280 0,338 UK 0,039 0,115 0,149 0,230 0,265 0,283 IT 0,075 0,166 0,235 0,259 0,313 0,357 Ontario 0,057 0,100 0,197 0,261 0,287 0,340
Immigrants (aged <60) FR 0,132 0,288 0,332 0,388 0,462 0,493 GE 0,071 0,208 0,224 0,267 0,349 0,364 SP 0,116 0,319 0,464 0,378 0,489 0,577 UK 0,083 0,180 0,208 0,326 0,365 0,376 IT 0,170 0,318 0,412 0,404 0,478 0,549 Ontario 0,090 0,149 0,252 0,326 0,369 0,422
Notes: SMD=Severe material deprivation, using Eurostat current definition. MD= Material deprivation, using current 9 items deprivation list but changing threshold to 3+ items. MD’= Material deprivation using the 3+ items threshold for the alternative 9 items deprivation list, obtained substituting the enforced lack of three widely possessed durable good (a television set, a washing machine and e telephone) for the following items: a) the household cannot afford a computer; b) the household cannot afford to each member of the family dental care when needed; c) the household has great difficulties to make ends meet. For Ontario, the three definitions correspond to applying the thresholds of 3+ items, 2+ items and 1+ items respectively to the list of 10 indicators included in the Ontario Material Deprivation Index. Source: Own calculation using cross-sectional 2009-SILC anonymised user database, version 01-08-2011, for European countries, and SLID-2009 Public Use Microdata File for Canada.
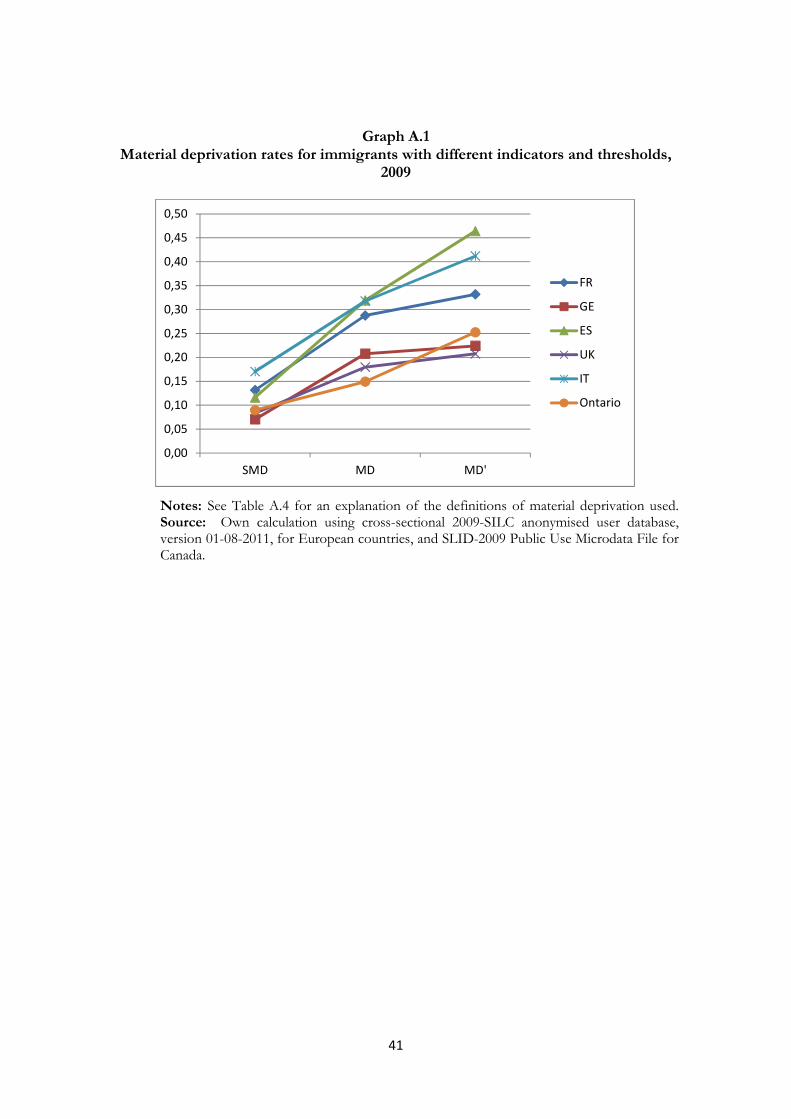
41
Graph A.1 Material deprivation rates for immigrants with different indicators and thresholds,
2009
Notes: See Table A.4 for an explanation of the definitions of material deprivation used. Source: Own calculation using cross-sectional 2009-SILC anonymised user database, version 01-08-2011, for European countries, and SLID-2009 Public Use Microdata File for Canada.
0,00
0,05
0,10
0,15
0,20
0,25
0,30
0,35
0,40
0,45
0,50
SMD MD MD'
FR
GE
ES
UK
IT
Ontario
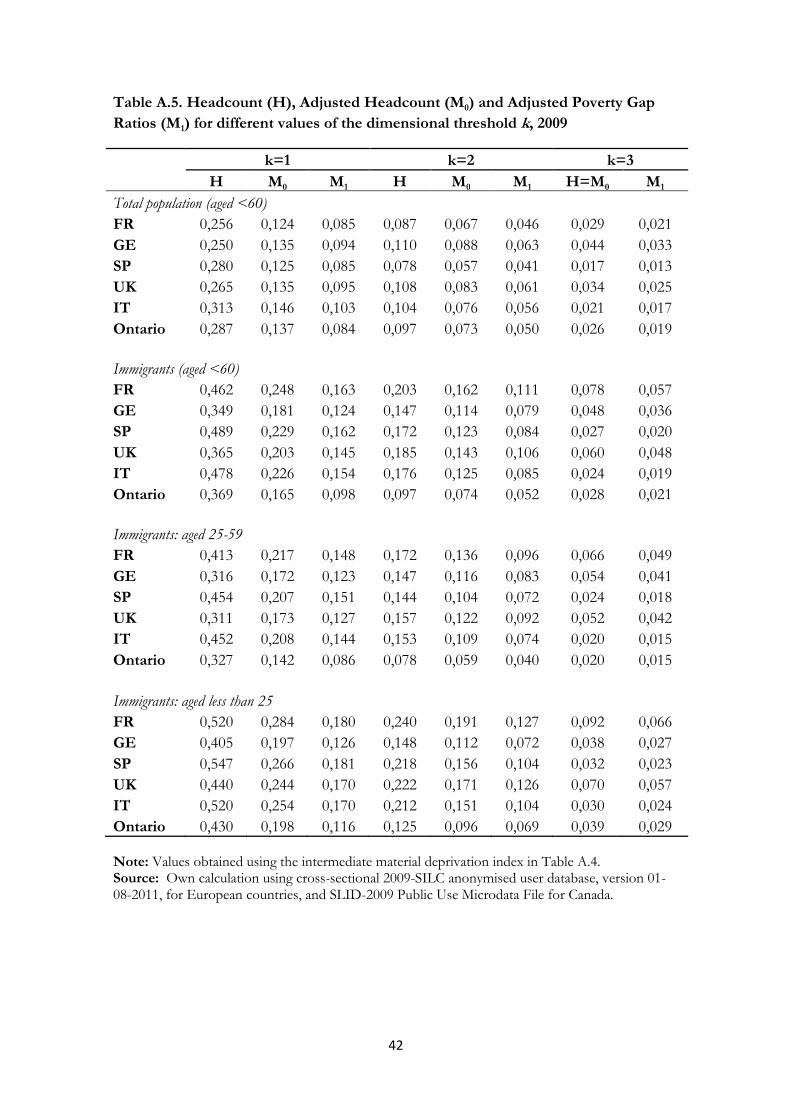
42
Table A.5. Headcount (H), Adjusted Headcount (M0) and Adjusted Poverty Gap
Ratios (M1) for different values of the dimensional threshold k, 2009
k=1 k=2 k=3
H M0 M1 H M0 M1 H=M0 M1
Total population (aged <60)
FR 0,256 0,124 0,085 0,087 0,067 0,046 0,029 0,021 GE 0,250 0,135 0,094 0,110 0,088 0,063 0,044 0,033 SP 0,280 0,125 0,085 0,078 0,057 0,041 0,017 0,013 UK 0,265 0,135 0,095 0,108 0,083 0,061 0,034 0,025 IT 0,313 0,146 0,103 0,104 0,076 0,056 0,021 0,017 Ontario 0,287 0,137 0,084 0,097 0,073 0,050 0,026 0,019
Immigrants (aged <60)
FR 0,462 0,248 0,163 0,203 0,162 0,111 0,078 0,057 GE 0,349 0,181 0,124 0,147 0,114 0,079 0,048 0,036 SP 0,489 0,229 0,162 0,172 0,123 0,084 0,027 0,020 UK 0,365 0,203 0,145 0,185 0,143 0,106 0,060 0,048 IT 0,478 0,226 0,154 0,176 0,125 0,085 0,024 0,019 Ontario 0,369 0,165 0,098 0,097 0,074 0,052 0,028 0,021
Immigrants: aged 25-59
FR 0,413 0,217 0,148 0,172 0,136 0,096 0,066 0,049 GE 0,316 0,172 0,123 0,147 0,116 0,083 0,054 0,041 SP 0,454 0,207 0,151 0,144 0,104 0,072 0,024 0,018 UK 0,311 0,173 0,127 0,157 0,122 0,092 0,052 0,042 IT 0,452 0,208 0,144 0,153 0,109 0,074 0,020 0,015 Ontario 0,327 0,142 0,086 0,078 0,059 0,040 0,020 0,015
Immigrants: aged less than 25
FR 0,520 0,284 0,180 0,240 0,191 0,127 0,092 0,066 GE 0,405 0,197 0,126 0,148 0,112 0,072 0,038 0,027 SP 0,547 0,266 0,181 0,218 0,156 0,104 0,032 0,023 UK 0,440 0,244 0,170 0,222 0,171 0,126 0,070 0,057 IT 0,520 0,254 0,170 0,212 0,151 0,104 0,030 0,024 Ontario 0,430 0,198 0,116 0,125 0,096 0,069 0,039 0,029 Note: Values obtained using the intermediate material deprivation index in Table A.4. Source: Own calculation using cross-sectional 2009-SILC anonymised user database, version 01-08-2011, for European countries, and SLID-2009 Public Use Microdata File for Canada.
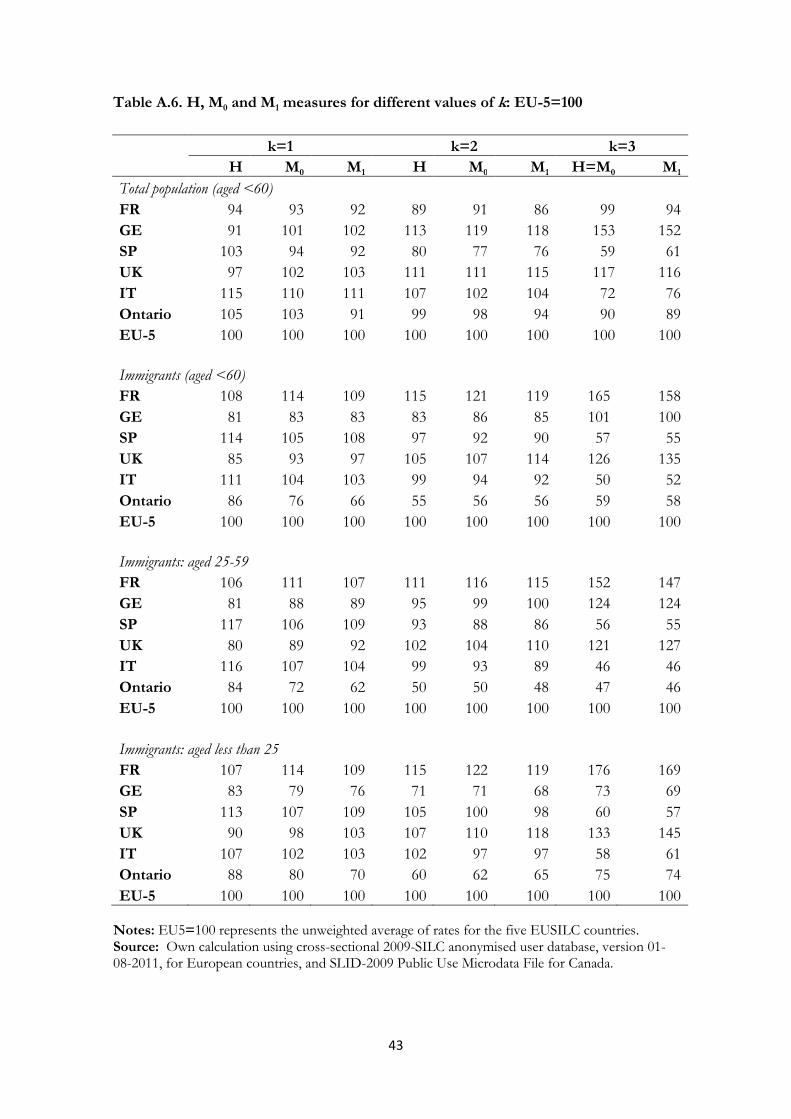
43
Table A.6. H, M0 and M1 measures for different values of k: EU-5=100
k=1 k=2 k=3
H M0 M1 H M0 M1 H=M0 M1
Total population (aged <60) FR 94 93 92 89 91 86 99 94 GE 91 101 102 113 119 118 153 152 SP 103 94 92 80 77 76 59 61 UK 97 102 103 111 111 115 117 116 IT 115 110 111 107 102 104 72 76 Ontario 105 103 91 99 98 94 90 89 EU-5 100 100 100 100 100 100 100 100
Immigrants (aged <60) FR 108 114 109 115 121 119 165 158 GE 81 83 83 83 86 85 101 100 SP 114 105 108 97 92 90 57 55 UK 85 93 97 105 107 114 126 135 IT 111 104 103 99 94 92 50 52 Ontario 86 76 66 55 56 56 59 58 EU-5 100 100 100 100 100 100 100 100
Immigrants: aged 25-59 FR 106 111 107 111 116 115 152 147 GE 81 88 89 95 99 100 124 124 SP 117 106 109 93 88 86 56 55 UK 80 89 92 102 104 110 121 127 IT 116 107 104 99 93 89 46 46 Ontario 84 72 62 50 50 48 47 46 EU-5 100 100 100 100 100 100 100 100
Immigrants: aged less than 25 FR 107 114 109 115 122 119 176 169 GE 83 79 76 71 71 68 73 69 SP 113 107 109 105 100 98 60 57 UK 90 98 103 107 110 118 133 145 IT 107 102 103 102 97 97 58 61 Ontario 88 80 70 60 62 65 75 74 EU-5 100 100 100 100 100 100 100 100
Notes: EU5=100 represents the unweighted average of rates for the five EUSILC countries. Source: Own calculation using cross-sectional 2009-SILC anonymised user database, version 01-08-2011, for European countries, and SLID-2009 Public Use Microdata File for Canada.

44
Table A.7. H, M0 and M1 measures for different values of k: Relative risk for immigrants in the different countries
k=1 k=2 k=3
H M0 M1 H M0 M1 H=M0 M1
Immigrants: total FR 1,8 2,0 1,9 2,3 2,4 2,4 2,7 2,8 GE 1,4 1,3 1,3 1,3 1,3 1,3 1,1 1,1 SP 1,7 1,8 1,9 2,2 2,1 2,1 1,6 1,5 UK 1,4 1,5 1,5 1,7 1,7 1,7 1,8 1,9 IT 1,5 1,5 1,5 1,7 1,6 1,5 1,2 1,1 Ontario 1,3 1,2 1,2 1,0 1,0 1,0 1,1 1,1
Immigrants: aged 25-59 FR 1,6 1,7 1,7 2,0 2,0 2,1 2,3 2,4 GE 1,3 1,3 1,3 1,3 1,3 1,3 1,2 1,2 SP 1,6 1,7 1,8 1,8 1,8 1,8 1,4 1,4 UK 1,2 1,3 1,3 1,5 1,5 1,5 1,6 1,7 IT 1,4 1,4 1,4 1,5 1,4 1,3 1,0 0,9 Ontario 1,4 1,5 1,5 1,6 1,6 1,6 1,5 1,5
Immigrants: aged less than 25 FR 2,0 2,3 2,1 2,8 2,8 2,8 3,2 3,2 GE 1,6 1,5 1,3 1,3 1,3 1,1 0,9 0,8 SP 2,0 2,1 2,1 2,8 2,7 2,6 1,9 1,7 UK 1,7 1,8 1,8 2,1 2,1 2,1 2,1 2,2 IT 1,7 1,7 1,7 2,0 2,0 1,9 1,5 1,4 Ontario 1,8 1,9 1,8 2,1 2,1 2,0 1,8 1,8
Notes: The relative risk ratios are obtained dividing each group’s rate by the values for the whole population aged 60 or less. Source: Own calculation using cross-sectional 2009-SILC anonymised user database, version 01-08-2011, for European countries, and SLID-2009 Public Use Microdata File for Canada.
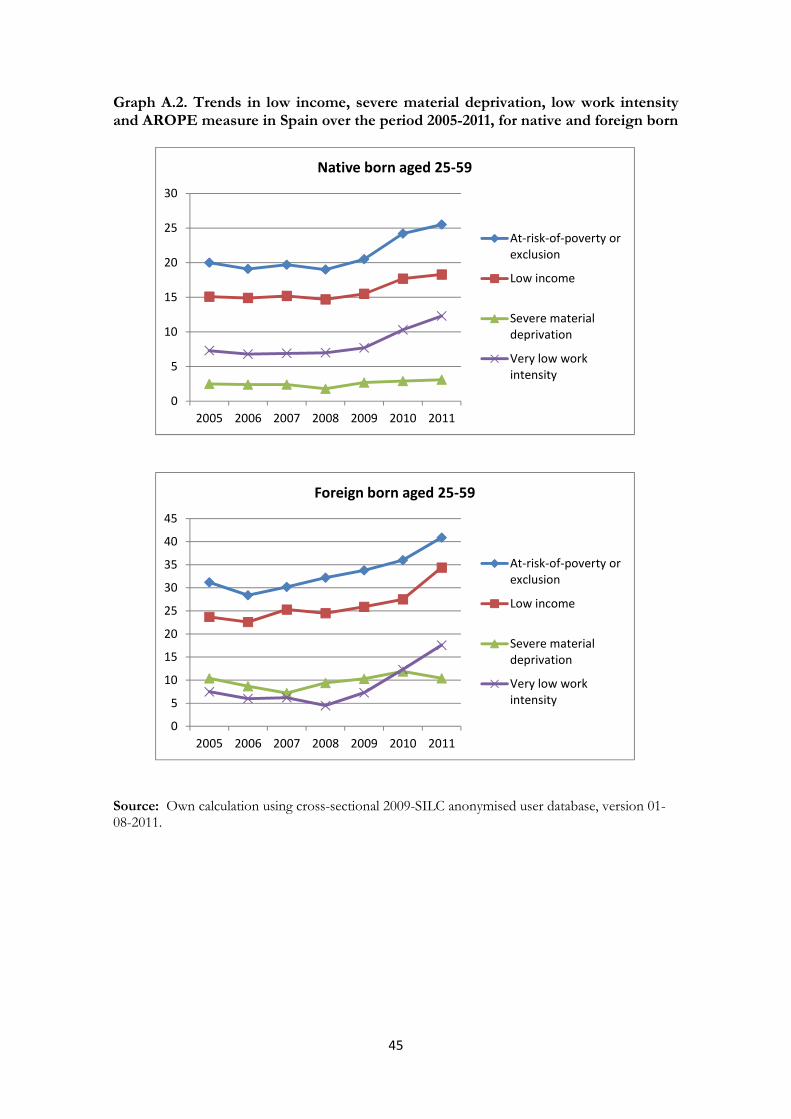
45
Graph A.2. Trends in low income, severe material deprivation, low work intensity and AROPE measure in Spain over the period 2005-2011, for native and foreign born
Source: Own calculation using cross-sectional 2009-SILC anonymised user database, version 01-08-2011.
0
5
10
15
20
25
30
2005 2006 2007 2008 2009 2010 2011
Native born aged 25-59
At-risk-of-poverty or
exclusion
Low income
Severe material
deprivation
Very low work
intensity
0
5
10
15
20
25
30
35
40
45
2005 2006 2007 2008 2009 2010 2011
Foreign born aged 25-59
At-risk-of-poverty or
exclusion
Low income
Severe material
deprivation
Very low work
intensity
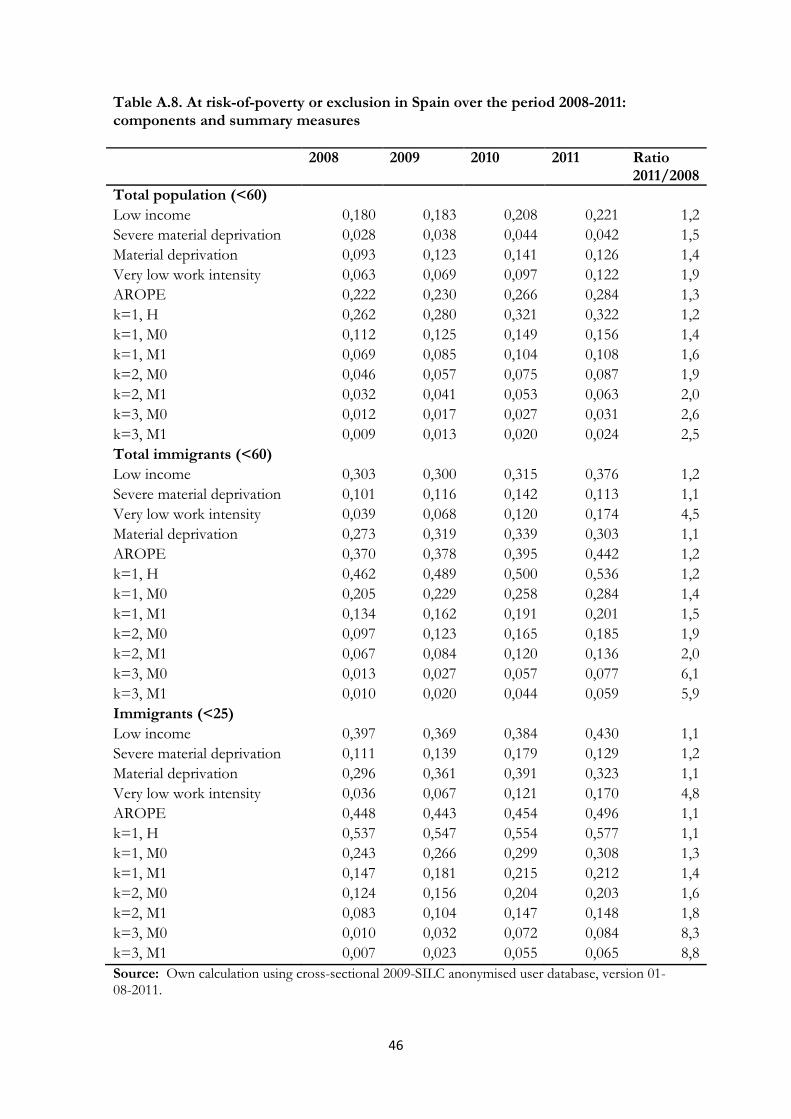
46
Table A.8. At risk-of-poverty or exclusion in Spain over the period 2008-2011: components and summary measures
2008 2009 2010 2011 Ratio 2011/2008
Total population (<60) Low income 0,180 0,183 0,208 0,221 1,2 Severe material deprivation 0,028 0,038 0,044 0,042 1,5 Material deprivation 0,093 0,123 0,141 0,126 1,4 Very low work intensity 0,063 0,069 0,097 0,122 1,9 AROPE 0,222 0,230 0,266 0,284 1,3 k=1, H 0,262 0,280 0,321 0,322 1,2 k=1, M0 0,112 0,125 0,149 0,156 1,4 k=1, M1 0,069 0,085 0,104 0,108 1,6 k=2, M0 0,046 0,057 0,075 0,087 1,9 k=2, M1 0,032 0,041 0,053 0,063 2,0 k=3, M0 0,012 0,017 0,027 0,031 2,6 k=3, M1 0,009 0,013 0,020 0,024 2,5 Total immigrants (<60) Low income 0,303 0,300 0,315 0,376 1,2 Severe material deprivation 0,101 0,116 0,142 0,113 1,1 Very low work intensity 0,039 0,068 0,120 0,174 4,5 Material deprivation 0,273 0,319 0,339 0,303 1,1 AROPE 0,370 0,378 0,395 0,442 1,2 k=1, H 0,462 0,489 0,500 0,536 1,2 k=1, M0 0,205 0,229 0,258 0,284 1,4 k=1, M1 0,134 0,162 0,191 0,201 1,5 k=2, M0 0,097 0,123 0,165 0,185 1,9 k=2, M1 0,067 0,084 0,120 0,136 2,0 k=3, M0 0,013 0,027 0,057 0,077 6,1 k=3, M1 0,010 0,020 0,044 0,059 5,9 Immigrants (<25)
Low income 0,397 0,369 0,384 0,430 1,1 Severe material deprivation 0,111 0,139 0,179 0,129 1,2 Material deprivation 0,296 0,361 0,391 0,323 1,1 Very low work intensity 0,036 0,067 0,121 0,170 4,8 AROPE 0,448 0,443 0,454 0,496 1,1 k=1, H 0,537 0,547 0,554 0,577 1,1 k=1, M0 0,243 0,266 0,299 0,308 1,3 k=1, M1 0,147 0,181 0,215 0,212 1,4 k=2, M0 0,124 0,156 0,204 0,203 1,6 k=2, M1 0,083 0,104 0,147 0,148 1,8 k=3, M0 0,010 0,032 0,072 0,084 8,3 k=3, M1 0,007 0,023 0,055 0,065 8,8 Source: Own calculation using cross-sectional 2009-SILC anonymised user database, version 01-08-2011.