Embed Size (px)
Citation preview
Journal of Pharmaceutical Analysis 5 (2015) 249–255
H O S T E D B Y Contents lists available at ScienceDirect
journal homepage: www.elsevier.com/locate/jpa
Journal of Pharmaceutical Analysis
http://d2095-17(http://c
☆Peern CorrE-m
www.sciencedirect.com
Original Article
Multi-spectroscopic investigation of the binding interaction offosfomycin with bovine serum albumin$
Manjunath D. Meti a, Sharanappa T. Nandibewoor a, Shrinivas D. Joshi b, Uttam A. More b,Shivamurti A. Chimatadar a,n
a Post Graduate Department of Studies in Chemistry, Karnatak University, Pavate Nagar, Dharwad 580003, Karnataka, Indiab Novel Drug Design and Discovery Laboratory, Department of Pharmaceutical Chemistry, S.E.T’s College of Pharmacy, Sangolli Rayanna Nagar,Dharwad 580002, Karnataka, India
a r t i c l e i n f o
Article history:Received 13 July 2014Received in revised form20 January 2015Accepted 26 January 2015Available online 14 February 2015
Keywords:FosfomycinSerum albuminSpectroscopic methodsSynchronous fluorescence3D spectra
x.doi.org/10.1016/j.jpha.2015.01.00479/& 2015 Xi'an Jiaotong University. Productireativecommons.org/licenses/by-nc-nd/4.0/).
review under responsibility of Xi'an Jiaotongesponding author. Tel.: þ91 836 2215286; faxail address: [email protected] (S.A. Chim
a b s t r a c t
The interaction between fosfomycin (FOS) and bovine serum albumin (BSA) has been investigated ef-fectively by multi-spectroscopic techniques under physiological pH 7.4. FOS quenched the intrinsicfluorescence of BSA via static quenching. The number of binding sites n and observed binding constant KA
were measured by the fluorescence quenching method. The thermodynamic parameters ΔG0, ΔH0 andΔS0 were calculated at different temperatures according to the van’t Hoff equation. The site of binding ofFOS in the protein was proposed to be Sudlow’s site I based on displacement experiments using sitemarkers viz. warfarin, ibuprofen and digitoxin. The distance r between the donor (BSA) and acceptor(FOS) molecules was obtained according to the Förster theory. The effect of FOS on the conformation ofBSA was analyzed using synchronous fluorescence spectra (SFS), circular dichroism (CD) and 3D fluor-escence spectra. A molecular modeling study further confirmed the binding mode obtained by the ex-perimental studies.& 2015 Xi'an Jiaotong University. Production and hosting by Elsevier B.V. All rights reserved. This is anopen access article under the CC BY-NC-ND license (http://creativecommons.org/licenses/by-nc-nd/4.0/).
1. Introduction
Serum albumins (52%–60% of the total amount of plasma pro-teins) are the major soluble protein constituents of the circulatorysystem, and they have many physiological functions, such ascombination with many endogenous and exogenous compounds.They also play an important role in storage and transport of energy[1]. BSA solution is stable and homogeneous; the 3D structure ofBSA is believed to be similar to that of human serum albumin(HSA). BSA has two tryptophan residues (Trp 134 and Trp 212)located in sub-domains IA and IIA, respectively [2].
Fosfomycin (FOS) is a naturally occurring antibiotic that wasdescribed originally under the name fosfonomycin in 1969 [3]. FOSis a clinically useful antibiotic for the treatment of limb-threa-tening diabetic foot infections and lower urinary tract infections[4]. It is reasonably soluble in water [5] and the drug substance isstable under normal storage conditions (2–3 years). Chemicalstructures of BSA and FOS are shown in Supplementary Fig. S1.
The literature survey revealed that attempts have not beenmade so far to investigate the binding mechanism of FOS with BSAby spectroscopic techniques like synchronous fluorescence spectra
on and hosting by Elsevier B.V. All
University.: þ91 836 2747884.atadar).
(SFS), circular dichroism (CD) and 3D spectra. We further in-vestigated the effect of fluorescence resonance energy transfer(FRET) and the conformational change of BSA. In the present studyof the binding mechanism between FOS and BSA regarding thebinding parameters, the thermodynamic functions and the effectof FOS on the protein conformation were investigated in detail.
2. Experimental
2.1. Materials and methods
Fosfomycin disodium salt was obtained from HIMEDIA (India).Protease-free and essentially globulin-free BSA (Fraction V) waspurchased from Sigma Chemical Co. (St. Louis, USA). The stocksolution of BSA (65,000) and FOS was prepared in 0.1 M phosphatebuffer of pH 7.4 containing 0.15 M NaCl. All other materials were ofanalytical reagent grade and millipore water (resistivity of milli-pore water is 20 MΩ) was used throughout the experiment.
2.2. Instruments
Fluorescence measurements were recorded using an RF-5301PC Hitachi spectrofluorometer Model F-2000 (Hitachi, Tokyo, Ja-pan) equipped with a 150 W Xenon lamp and a slit width of 5 nm.
rights reserved. This is an open access article under the CC BY-NC-ND license
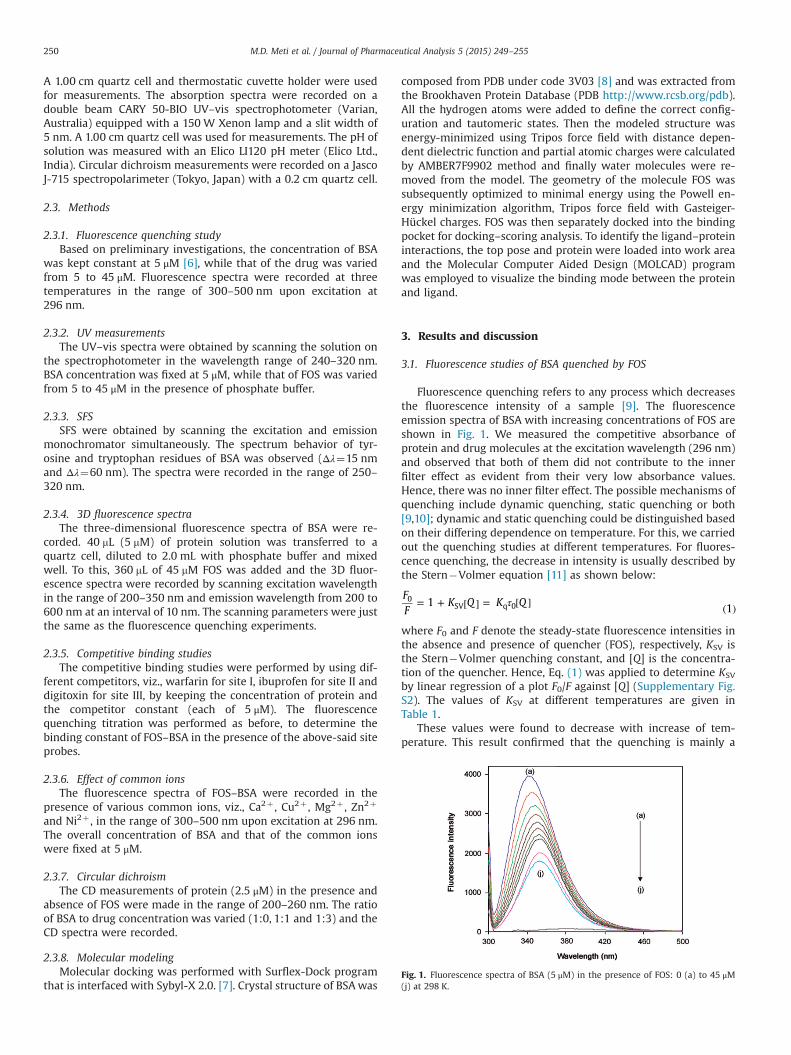
Fig. 1. Fluorescence spectra of BSA (5 μM) in the presence of FOS: 0 (a) to 45 μM(j) at 298 K.
M.D. Meti et al. / Journal of Pharmaceutical Analysis 5 (2015) 249–255250
A 1.00 cm quartz cell and thermostatic cuvette holder were usedfor measurements. The absorption spectra were recorded on adouble beam CARY 50-BIO UV–vis spectrophotometer (Varian,Australia) equipped with a 150 W Xenon lamp and a slit width of5 nm. A 1.00 cm quartz cell was used for measurements. The pH ofsolution was measured with an Elico LI120 pH meter (Elico Ltd.,India). Circular dichroism measurements were recorded on a JascoJ-715 spectropolarimeter (Tokyo, Japan) with a 0.2 cm quartz cell.
2.3. Methods
2.3.1. Fluorescence quenching studyBased on preliminary investigations, the concentration of BSA
was kept constant at 5 μM [6], while that of the drug was variedfrom 5 to 45 μM. Fluorescence spectra were recorded at threetemperatures in the range of 300–500 nm upon excitation at296 nm.
2.3.2. UV measurementsThe UV–vis spectra were obtained by scanning the solution on
the spectrophotometer in the wavelength range of 240–320 nm.BSA concentration was fixed at 5 μM, while that of FOS was variedfrom 5 to 45 μM in the presence of phosphate buffer.
2.3.3. SFSSFS were obtained by scanning the excitation and emission
monochromator simultaneously. The spectrum behavior of tyr-osine and tryptophan residues of BSA was observed (Δλ¼15 nmand Δλ¼60 nm). The spectra were recorded in the range of 250–320 nm.
2.3.4. 3D fluorescence spectraThe three-dimensional fluorescence spectra of BSA were re-
corded. 40 mL (5 mM) of protein solution was transferred to aquartz cell, diluted to 2.0 mL with phosphate buffer and mixedwell. To this, 360 mL of 45 mM FOS was added and the 3D fluor-escence spectra were recorded by scanning excitation wavelengthin the range of 200–350 nm and emission wavelength from 200 to600 nm at an interval of 10 nm. The scanning parameters were justthe same as the fluorescence quenching experiments.
2.3.5. Competitive binding studiesThe competitive binding studies were performed by using dif-
ferent competitors, viz., warfarin for site I, ibuprofen for site II anddigitoxin for site III, by keeping the concentration of protein andthe competitor constant (each of 5 μM). The fluorescencequenching titration was performed as before, to determine thebinding constant of FOS–BSA in the presence of the above-said siteprobes.
2.3.6. Effect of common ionsThe fluorescence spectra of FOS–BSA were recorded in the
presence of various common ions, viz., Ca2þ , Cu2þ , Mg2þ , Zn2þ
and Ni2þ , in the range of 300–500 nm upon excitation at 296 nm.The overall concentration of BSA and that of the common ionswere fixed at 5 μM.
2.3.7. Circular dichroismThe CD measurements of protein (2.5 μM) in the presence and
absence of FOS were made in the range of 200–260 nm. The ratioof BSA to drug concentration was varied (1:0, 1:1 and 1:3) and theCD spectra were recorded.
2.3.8. Molecular modelingMolecular docking was performed with Surflex-Dock program
that is interfaced with Sybyl-X 2.0. [7]. Crystal structure of BSAwas
composed from PDB under code 3V03 [8] and was extracted fromthe Brookhaven Protein Database (PDB http://www.rcsb.org/pdb).All the hydrogen atoms were added to define the correct config-uration and tautomeric states. Then the modeled structure wasenergy-minimized using Tripos force field with distance depen-dent dielectric function and partial atomic charges were calculatedby AMBER7F9902 method and finally water molecules were re-moved from the model. The geometry of the molecule FOS wassubsequently optimized to minimal energy using the Powell en-ergy minimization algorithm, Tripos force field with Gasteiger-Hückel charges. FOS was then separately docked into the bindingpocket for docking–scoring analysis. To identify the ligand–proteininteractions, the top pose and protein were loaded into work areaand the Molecular Computer Aided Design (MOLCAD) programwas employed to visualize the binding mode between the proteinand ligand.
3. Results and discussion
3.1. Fluorescence studies of BSA quenched by FOS
Fluorescence quenching refers to any process which decreasesthe fluorescence intensity of a sample [9]. The fluorescenceemission spectra of BSA with increasing concentrations of FOS areshown in Fig. 1. We measured the competitive absorbance ofprotein and drug molecules at the excitation wavelength (296 nm)and observed that both of them did not contribute to the innerfilter effect as evident from their very low absorbance values.Hence, there was no inner filter effect. The possible mechanisms ofquenching include dynamic quenching, static quenching or both[9,10]; dynamic and static quenching could be distinguished basedon their differing dependence on temperature. For this, we carriedout the quenching studies at different temperatures. For fluores-cence quenching, the decrease in intensity is usually described bythe Stern�Volmer equation [11] as shown below:
FF
K Q K Q1 10
SV q 0τ= + [ ] = [ ] ( )
where F0 and F denote the steady-state fluorescence intensities inthe absence and presence of quencher (FOS), respectively, KSV isthe Stern�Volmer quenching constant, and [Q] is the concentra-tion of the quencher. Hence, Eq. (1) was applied to determine KSV
by linear regression of a plot F0/F against [Q] (Supplementary Fig.S2). The values of KSV at different temperatures are given inTable 1.
These values were found to decrease with increase of tem-perature. This result confirmed that the quenching is mainly a
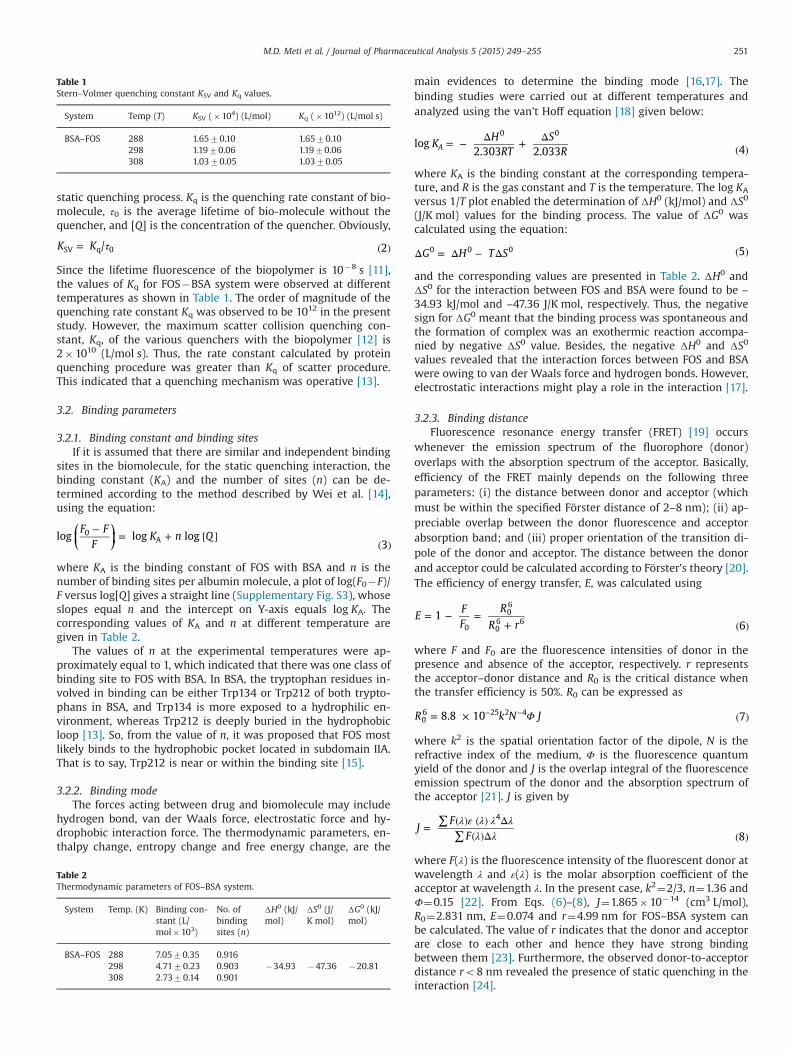
Table 1Stern–Volmer quenching constant KSV and Kq values.
System Temp (T) KSV (�104) (L/mol) Kq (�1012) (L/mol s)
BSA–FOS 288 1.6570.10 1.6570.10298 1.1970.06 1.1970.06308 1.0370.05 1.0370.05
M.D. Meti et al. / Journal of Pharmaceutical Analysis 5 (2015) 249–255 251
static quenching process. Kq is the quenching rate constant of bio-molecule, τ0 is the average lifetime of bio-molecule without thequencher, and [Q] is the concentration of the quencher. Obviously,
K K / 2SV q 0τ= ( )
Since the lifetime fluorescence of the biopolymer is 10�8 s [11],the values of Kq for FOS�BSA system were observed at differenttemperatures as shown in Table 1. The order of magnitude of thequenching rate constant Kq was observed to be 1012 in the presentstudy. However, the maximum scatter collision quenching con-stant, Kq, of the various quenchers with the biopolymer [12] is2�1010 (L/mol s). Thus, the rate constant calculated by proteinquenching procedure was greater than Kq of scatter procedure.This indicated that a quenching mechanism was operative [13].
3.2. Binding parameters
3.2.1. Binding constant and binding sitesIf it is assumed that there are similar and independent binding
sites in the biomolecule, for the static quenching interaction, thebinding constant (KA) and the number of sites (n) can be de-termined according to the method described by Wei et al. [14],using the equation:
⎛⎝⎜
⎞⎠⎟
F FF
K n Qlog log log3
0A
−= + [ ]
( )
where KA is the binding constant of FOS with BSA and n is thenumber of binding sites per albumin molecule, a plot of log(F0�F)/F versus log[Q] gives a straight line (Supplementary Fig. S3), whoseslopes equal n and the intercept on Y-axis equals log KA. Thecorresponding values of KA and n at different temperature aregiven in Table 2.
The values of n at the experimental temperatures were ap-proximately equal to 1, which indicated that there was one class ofbinding site to FOS with BSA. In BSA, the tryptophan residues in-volved in binding can be either Trp134 or Trp212 of both trypto-phans in BSA, and Trp134 is more exposed to a hydrophilic en-vironment, whereas Trp212 is deeply buried in the hydrophobicloop [13]. So, from the value of n, it was proposed that FOS mostlikely binds to the hydrophobic pocket located in subdomain IIA.That is to say, Trp212 is near or within the binding site [15].
3.2.2. Binding modeThe forces acting between drug and biomolecule may include
hydrogen bond, van der Waals force, electrostatic force and hy-drophobic interaction force. The thermodynamic parameters, en-thalpy change, entropy change and free energy change, are the
Table 2Thermodynamic parameters of FOS–BSA system.
System Temp. (K) Binding con-stant (L/mol�103)
No. ofbindingsites (n)
ΔH0 (kJ/mol)
ΔS0 (J/K mol)
ΔG0 (kJ/mol)
BSA–FOS 288 7.0570.35 0.916298 4.7170.23 0.903 �34.93 �47.36 �20.81308 2.7370.14 0.901
main evidences to determine the binding mode [16,17]. Thebinding studies were carried out at different temperatures andanalyzed using the van’t Hoff equation [18] given below:
KH
RTS
Rlog
2.303 2.033 4A
0 0= − Δ + Δ
( )
where KA is the binding constant at the corresponding tempera-ture, and R is the gas constant and T is the temperature. The log KA
versus 1/T plot enabled the determination of ΔH0 (kJ/mol) and ΔS0
(J/K mol) values for the binding process. The value of ΔG0 wascalculated using the equation:
G H T S 50 0 0Δ = Δ − Δ ( )
and the corresponding values are presented in Table 2. ΔH0 andΔS0 for the interaction between FOS and BSA were found to be –
34.93 kJ/mol and –47.36 J/K mol, respectively. Thus, the negativesign for ΔG0 meant that the binding process was spontaneous andthe formation of complex was an exothermic reaction accompa-nied by negative ΔS0 value. Besides, the negative ΔH0 and ΔS0
values revealed that the interaction forces between FOS and BSAwere owing to van der Waals force and hydrogen bonds. However,electrostatic interactions might play a role in the interaction [17].
3.2.3. Binding distanceFluorescence resonance energy transfer (FRET) [19] occurs
whenever the emission spectrum of the fluorophore (donor)overlaps with the absorption spectrum of the acceptor. Basically,efficiency of the FRET mainly depends on the following threeparameters: (i) the distance between donor and acceptor (whichmust be within the specified Förster distance of 2–8 nm); (ii) ap-preciable overlap between the donor fluorescence and acceptorabsorption band; and (iii) proper orientation of the transition di-pole of the donor and acceptor. The distance between the donorand acceptor could be calculated according to Förster’s theory [20].The efficiency of energy transfer, E, was calculated using
EFF
R
R r1
60
06
06 6
= − =+ ( )
where F and F0 are the fluorescence intensities of donor in thepresence and absence of the acceptor, respectively. r representsthe acceptor–donor distance and R0 is the critical distance whenthe transfer efficiency is 50%. R0 can be expressed as
R k N J8.8 10 706 25 2 4Φ= × ( )− −
where k2 is the spatial orientation factor of the dipole, N is therefractive index of the medium, Φ is the fluorescence quantumyield of the donor and J is the overlap integral of the fluorescenceemission spectrum of the donor and the absorption spectrum ofthe acceptor [21]. J is given by
JF
F 8
4λ ε λ λ λλ λ
=∑ ( ) ( ) Δ
∑ ( )Δ ( )
where F(λ) is the fluorescence intensity of the fluorescent donor atwavelength λ and ε(λ) is the molar absorption coefficient of theacceptor at wavelength λ. In the present case, k2¼2/3, n¼1.36 andФ¼0.15 [22]. From Eqs. (6)–(8), J¼1.865�10�14 (cm3 L/mol),R0¼2.831 nm, E¼0.074 and r¼4.99 nm for FOS–BSA system canbe calculated. The value of r indicates that the donor and acceptorare close to each other and hence they have strong bindingbetween them [23]. Furthermore, the observed donor-to-acceptordistance ro8 nm revealed the presence of static quenching in theinteraction [24].
Table 3Effect of common ions on binding constant of FOS–BSA.
Systems (cations) Binding constant (M�103)
BSAþFOS 4.714BSAþFOSþCa2þ 3.526BSAþFOSþCu2þ 3.068BSAþFOSþMg2þ 2.288BSAþFOSþNi2þ 1.806BSAþFOSþZn2þ 1.530
Fig. 2. Synchronous fluorescence spectrum of BSA–FOS (T¼298 K, pH 7.40): (A)Δλ¼15 nm and (B) Δλ¼60 nm. (a) [BSA]¼5 μM; (b)–(j) [FOS]¼5–45 μM.
M.D. Meti et al. / Journal of Pharmaceutical Analysis 5 (2015) 249–255252
3.2.4. Effect of metal ions on the interactions of FOS with BSASome common ions are widely distributed in humans and an-
imals, which can affect the interactions of compounds with serumalbumin. Therefore, we examined the effects of some cations(Ca2þ , Cu2þ , Mg2þ , Ni2þ and Zn2þ) on binding of FOS with pro-tein at 298 K. The binding constant values (Table 3) of FOS–proteinwere noticed to decrease in the presence of the above metal ions.This indicated that the drug would be quickly cleared from theblood [25]. In such an event, it necessitated to readjust the doselimits of the drug in the presence of these metal ions.
3.2.5. Binding studies using UV–visible absorption spectraUV–vis absorption measurement is a very simple method and
applicable to explore the structural change and know the complexformation [26]. The UV–vis absorption spectra of FOS, BSA and theFOS–BSA system were also investigated to confirm the probablequenching mechanism. The UV–vis absorbance intensity de-creased regularly with the increasing concentration of FOS [27],indicating that the BSA molecules were associated with FOS andformed a FOS–BSA complex. This confirmed again a staticquenching mechanism.
3.2.6. Site probe studiesSudlow et al. [28] suggested two main distinct binding sites
(sites I and II) in BSA. Site I of BSA has affinity for warfarin and siteII for ibuprofen. It was reported that the binding of digitoxin isindependent of sites I and II [29] and binds to site III. In order toestablish the binding site in the BSA for FOS, competitive bindingstudies were performed using site probes, warfarin, ibuprofen anddigitoxin, in connection with Sudlow’s classification of the bindingsites. Table 4 shows the binding constant of FOS–BSA in presenceof different site markers. As evident from Table 4, FOS was notsignificantly displaced by ibuprofen or digitoxin. However, war-farin (site I) showed a displacement of FOS, suggesting that FOSbound to site I of BSA, which is located in the hydrophobic pocketof subdomain II A [6].
3.3. Confirmation investigation
3.3.1. Synchronous fluorescence studyTo explore the structural change of BSA by the addition of FOS,
SFS (Fig. 2) of BSA were measured with various amounts of FOS.The SFS give information about the molecular environment in avicinity of the chromosphere molecules and have several
Table 4The comparison of binding constants of FOS–BSA before and after the addition ofsite probe.
Systems Binding constant (M)
BSAþFOS 4.714�103
BSAþFOSþWarfarin 1.397�102
BSAþFOSþ Ibuprofen 4.694�103
BSAþFOSþDigitoxin 4.348�103
advantages, such as sensitivity, spectral simplification, spectralbandwidth reduction as well as avoiding different perturbing ef-fects [30]. Yuan et al. [31] suggested a useful method to study theenvironment of amino acid residues by measuring the possibleshift in wavelength emission maximum λmax, the shift in positionof emission maximum corresponding to the changes of the po-larity around the chromophore molecule. When the D-value (Δλ)between excitation wavelength and emission wavelength wasstabilized at 15 or 60 nm, the SFS gave the characteristic in-formation of tyrosine residues or tryptophan residues, respec-tively. The effect of FOS on protein SFS is shown in Fig. 2(A) and(B).
In Fig. 2(A), it is observed that there is a gradual decrease of thefluorescence intensity of tyrosine residues and a blue shift at themaximum emission upon addition of FOS, which indicated thatthe binding between FOS and the protein is located in closeproximity to the tyrosine residues. The conformation of BSA waschanged, and it suggested a less polar (or more hydrophobic) en-vironment of tyrosine residue [32]. While in Fig. 2(B), the max-imum emission wavelength of tryptophan residues showed a blueshift, which indicates that the conformation of BSA was changedsuch that the polarity around the tryptophan residues decreasedand the hydrophobicity was increased [33].
3.3.2. 3D fluorescenceIt is well known that 3D fluorescence spectra can provide more
detailed information about the conformational changes of pro-teins. The maximum emission wavelength and the fluorescenceintensity of the residues have a close relation to the polarity oftheir micro-environment [34,31]. By comparing the 3D fluores-cence spectral changes of BSA in the absence and presence of FOS,we can investigate the conformational and micro-environmentalchanges of BSA. The 3D fluorescence spectra of BSA and the

Fig. 3. Three dimensional fluorescence spectra of (A) BSA and (B) the FOSþBSA system.
Table 5Three-dimensional fluorescence spectral characteristics of HSA and the HSA–FOSsystem.
System Peak a Peak b
BSA Peak position (Ex/Em) 250/250–360/360 290/340Relative intensity (F) 4.984–6617 5106
BSA–FOS Peak position (Ex/Em) 250/250–360/360 290/340Relative intensity (F) 9.4–6933 3793
M.D. Meti et al. / Journal of Pharmaceutical Analysis 5 (2015) 249–255 253
BSA�FOS system are shown in Fig. 3. The changes of three di-mension fluorescence spectra of BSA in the presence of differentvolumes of FOS are listed in Table 5.
In addition, the contour map provides bird’s eye view of 3Dfluorescence spectra. Peak ‘a’ denotes the Raleigh scattering peak(λex¼λem), whereas strong peak ‘b’ mainly reveals the spectralcharacteristics of Trp and Tyr residues on proteins, and anotherpeak ‘c’ is the second-order scattering peak (λem¼2λex).
In Fig. 3, the fluorescence intensity of peak ‘a’ increased with theaddition of FOS. The possible reason was FOS–BSA complex forma-tion after FOS was added. So the diameter of the macromoleculeincreased and resulted in the enhanced scattering effect [35]. Peak ‘b’mainly reflected the spectral behavior of Trp and Tyr residues. Thefluorescence intensity of peak ‘b’ decreased markedly and the max-imum emission wavelength of the peak was changed following theaddition of FOS. Peak ‘c’ was the second order scattering peak(λem¼2λex), analyzing from the intensity changes of peak ‘a’ and peak‘b’ revealed that the binding of FOS to BSA induced some con-formational and micro-environmental changes in BSA [36].
3.3.3. Circular dichroism spectraCD is a powerful tool in elucidating the modifications of the
secondary structure of biopolymers as a result of interaction withsmall molecules. The far UV�CD spectra of BSA exhibit a typicalshape of a α-helix-rich secondary structure (two minima at
approximately 208 and 222 nm). BSA has a high percentage of α-helical structure, which shows characteristic strong double mini-mum signals at 222 and 208 nm, which represents the transitionof π�π* and n–π* of α-helix structure [37]. The results of CD wereexpressed in terms of the mean residue ellipticity (MRE) in ac-cording to the following equation
C nlMRE
observed CD mdeg10 9P
= ( )× ( )
where Cp is the molar concentration of the protein, n is thenumber of amino acid residues and l is the path length. The α-helical contents of free and combined BSA were calculated fromMRE values at 208 nm using the following equation [38]
helix %MRE 4000
33, 000 4000100
10208[ ]α− ( ) =
− −[ − ]
×( )
where MRE208 is the observed MRE value at 208 nm, 4000 is theMRE of the β-form and random coil conformation cross at 208 nmand 33,000 is the MRE value of a pure α-helix at 208 nm. The CDspectra of BSA in the absence and presence of different con-centrations of FOS are shown in Fig. 4.
From the above equation, the percentage of helicity of BSA isfrom 62% in free BSA (Fig. 4) to 67% and 79% in the presence ofFOS–BSA, which showed that binding of FOS to BSA might inducesome conformational changes. However, the shape of peaks andthe peak maximum position remained almost the same. This in-dicated that BSA has predominantly α-helix nature even afterbinding to the drug. In the presence of FOS, no appreciable per-turbation of secondary and tertiary structures in the protein isobserved (Fig. 4). Thus, FOS, the aromatic and peptide regions donot show any appreciable change in the CD spectra.
3.3.4. Molecular modeling resultsSurflex-docking was employed to understand the interaction
between BSA and FOS and to ultimately elucidate the interaction

Fig. 4. The CD spectra of the FOS–BSA system: (a) free BSA, (b) and (c) BSAþFOSobtained at 298 K and at pH¼7.4.
M.D. Meti et al. / Journal of Pharmaceutical Analysis 5 (2015) 249–255254
mechanism. Results obtained by Surflex-docking tools presented20 conformations of FOS. We selected the best conformation forfurther analysis, owing to its higher binding affinity (4.50 kcal/mol) and the lowest molecular energy. Fig. 5(A) and (B) with bestconfirmation shows four H-bonds, oxygen at phosphate makingone H-bond with Trp213 (P¼O––HN–Trp213, 1.91 Å), that ofoxygen of OH making H-bond with Arg194 (HO––HN–Arg194,2.11 Å), hydrogen of same OH making two H-bonds with Asp450(OH––OC–Asp450, 2.02, 2.67 Å). FOS was surrounded with hy-drophobic amino acids (Leu197, Ala200, Phe205, Trp213, Ala216,
Fig. 5. (A) Details of the interactions between BSA and FOS in the docked model. (B)(D) hydrophilic amino acids surrounded to FOS. (E) and (F) Binding domain for FOS at
Ala296, Pro338, Val342, Leu454, Val461, Leu480) and hydrophilicamino acids (Arg194, Arg196, Ser201, Lys204, Glu293, Lys294, Asn457,Glu464) (Fig. 5(C) and (D)). Fig. 5(E) and (F) represents the bindingdomain for FOS at the active site of BSA chain A. The principal ligandbinding site on BSA is located in the hydrophobic cavities in sub-domains IIA and IIIA, which are consistent with sites I and II. It isimportant to note that Trp213 is in subdomain IIA, from theH-bonding interactions and surrounded amino acids, which indicatedthat the binding location was Sudlow’s site I in subdomain IIA.
4. Conclusions
In this work, we used different approaches to explore the in-teractions between FOS and BSA under physiological conditions.The experimental results clearly showed that FOS quenches thefluorescence of BSA by a static quenching mechanism. This workprovided a more comprehensive study on the distance betweenthe donor (protein) and acceptor (FOS) based on fluorescence re-sonance energy transfer. Experimental results from the quantita-tive analysis of circular dichroism, three dimensional fluorescencestudies and synchronous fluorescence spectrum demonstratedthat the binding of FOS to BSA induced some micro-environmentaland conformational change of serum albumin. Our study is ex-pected to provide important insights into the interactions of thephysiologically important protein with FOS, facilitating furtherinvestigation on the pharmacological behavior of FOS. This type of
2D schematic representation of hydrogen bond interactions. (C) Hydrophobic andBSA chain A.
M.D. Meti et al. / Journal of Pharmaceutical Analysis 5 (2015) 249–255 255
investigation on drug–protein interaction assumes importance inlife sciences, chemistry and clinical medicine.
Acknowledgments
One of the authors Manjunath D. Meti expresses gratitude toDST New Delhi for providing Innovation in Science Pursuit forInspired Research (INSPIRE) fellowship (IF110548).
Appendix A. Supporting information
Supplementary data associated with this article can be found inthe online version at http://dx.doi.org/10.1016/j.jpha.2015.01.004.
References
[1] J. Yua, B. Lib, P. Daia, et al., Molecular simulation of the interaction betweennovel type rhodanine derivative probe and bovine serum albumin, Spectro-chim. Acta A: Mol. Biomol. Spectrosc. 74 (2009) 277–281.
[2] H.W. Zhao, M. Ge, Z.X. Zhang, et al., Spectroscopic studies on the interactionbetween riboflavin and albumins, Spectrochim. Acta A: Mol. Biomol. Spec-trosc. 65 (2006) 811–817.
[3] D. Hendlin, E.O. Stapley, M. Jackson, et al., Phosphonomycin, a new antibioticproduced by strams of streptomyces, Science 166 (1969) 122–123.
[4] J.W. Munos, S. Moon, S.O. Mansoorabadi, et al., Purification and characteriza-tion of the epoxidase catalyzing the formation of fosfomycin from pseudo-monas syringae, Biochemistry 47 (2008) 8726–8735.
[5] E. Bergogne-Berezin, in: A. Bryskier (Ed.), Fosfomycin and Derivatives in An-timicrobial Agents, ASM Press, Washington, DC, 2005, pp. 972–982.
[6] P.B. Kandagal, J. Seetharamappa, S. Ashoka, et al., Study of the interactionbetween doxepin hydrochloride and bovine serum albumin by spectroscopictechniques, Int. J. Biol. Macromol. 39 (2006) 234–239.
[7] Tripos International, Sybyl-X 2.0, Tripos International, St. Louis, MO, USA, 2012.[8] K.A. Majorek, P.J. Porebski, A. Dayal, et al., Structural and immunologic char-
acterization of bovine, horse, and rabbit serum albumins, Mol. Immunol. 52(3–4) (2012) 174–182.
[9] D. Silva, C.M. Cortez, J. Cunha-Bastos, et al., Methyl parathion interaction withhuman and bovine serum albumin, Toxicol. Lett. 147 (2004) 53–61.
[10] S. Bi, L. Yan, B. Wang, et al., Spectroscopic and voltammetric characterizationsof the interaction of two local anesthetics with bovine serum albumin, J. Lu-min. 131 (2011) 866–873.
[11] J.R. Lakowicz, Principles of Fluorescence Spectroscopy, 3rd ed., Springer, NewYork, 2006.
[12] J.R. Lakowicz, G. Weber, Quenching of fluorescence by oxygen. Probe forstructural fluctuations in macromolecules, Biochemistry 12 (1973) 1461.
[13] S. Deepa, A.K. Mishra, Fluorescence spectroscopic study of serum albumin-bromadiolone interaction: fluorimetric determination of bromadiolone, J.Pharm. Biomed. Anal. 38 (2005) 556–563.
[14] Y.L. Wei, J.Q. Li, C. Dong, et al., Investigation of the association behaviors be-tween biliverdin and bovine serum albumin by fluorescence spectroscopy,Talanta 70 (2006) 377–382.
[15] Z. Cheng, Y. Zhang, Spectroscopic investigation on the interaction of salidro-side with bovine serum albumin, J. Mol. Struct. 889 (2008) 20–27.
[16] J. Xiao, J. Shi, H. Cao, et al., Analysis of binding interaction puererin and bovineserum albumin by multi-spectroscopic method, Pharm. Biomed. Anal. 45(2007) 609–615.
[17] P. Ju, H. Fan, T. Liu, et al., Probing the interaction of flower-like CdSe nanos-tructure particles targeted to bovine serum albumin using spectroscopictechniques, J. Lumin. 131 (2011) 1724–1730.
[18] Y.Z. Zhang, X. Xiang, P.M.J. Dai, et al., Spectroscopic studies on the interactionof congo red with bovine serum albumin, Spectrochim. Acta A: Mol. Biomol.Spectrosc. 72 (2009) 907–914.
[19] J.R. Lakowicz, Principles of Fluorescence Spectroscopy, Plenum, New York,2006, pp. 278, 281, 283.
[20] T. Förster, O. Sinanoglu, Modern Quantum Chemistry, Academic Press, New-York, USA, 1996, pp. 93–136.
[21] S. Bi, D. Song, Y. Tian, et al., Molecular spectroscopic study on the interaction oftetracyclines with serum albumins, Spectrochim. Acta A: Mol. Biomol. Spec-trosc. 61 (2005) 629–636.
[22] F.L. Cui, J. Fan, D.L. Ma, et al., A study of the interaction between a new reagentand serum albumin by fluorescence spectroscopy, Anal. Lett. 36 (2003)2151–2166.
[23] C.Q. Jiang, M.X. Gao, X.Z. Meng, et al., Study of the interaction between dau-norubicin and human serum albumin, and the determination of daunorubicinin blood serum samples, Spectrochim. Acta A: Mol. Biomol. Spectrosc. 59(2003) 1605–1610.
[24] F.L. Cui, J. Fan, J.P. Li, et al., Interactions between 1-benzoyl-4-p-chlorophenylthiosemicarbazide and serum albumin: investigation by fluorescence spec-troscopy, Bioorg. Med. Chem. 12 (2004) 151–157.
[25] Y. Li, W. He, J. Liu, et al., Binding of the bioactive component jatrorrhizineto human serum albumin, Biochim. Biophys. Acta 1722 (2005) 15–21.
[26] X.J. Guo, L. Zhang, X.D. Sun, et al., Spectroscopic studies on the interactionbetween sodium ozagrel and bovine serum albumin, J. Mol. Struct. 928 (2009)114–120.
[27] Y.Z. Zhang, X.P. Zhang, H.N. Hou, Study on the interaction between Cu(phen)23þ and bovine serum albumin by spectroscopic methods, Biol. TraceElem. Res. 121 (2008) 276–287.
[28] G. Sudlow, D.J. Birkett, D.N. Wade, et al., Further characterization of specificdrug binding sites on human serum albumin, Mol. Pharmacol. 12 (1976)1052–1061.
[29] I. Sjoholm, B. Ekman, A. Kober, et al., Binding of drugs to human serum al-bumin:XI. The specificity of three binding sites as studied with albumin im-mobilized in microparticles, Mol. Pharmacol. 16 (1979) 767–777.
[30] Y.J. Hu, Y. Liu, Z.B. Pi, et al., Interaction of cromolyn sodiumwith human serumalbumin: a fluorescence quenching study, Bioorg. Med. Chem. 13 (2005)6609–6614.
[31] T. Yuan, A.M. Weljie, H.J. Vogel, et al., Tryptophan fluorescence quenching bymethionine and selenomethionine residues of calmodulin: orientation ofpeptide and protein binding, Biochemistry 37 (1998) 3187–3195.
[32] L.L. He, X. Wang, B. Liu, et al., Interaction between ranitidine hydrochlorideand bovine serum albumin in aqueous solution, J. Solut. Chem. 39 (2010)654–664.
[33] Z. Chi, R. Liu, Y. Teng, et al., Binding of oxytetracycline to bovine serum al-bumin: spectroscopic and molecular modeling investigations, J. Agric. FoodChem. 58 (2010) 10262–10269.
[34] F. Ding, N. Li, B. Han, et al., The binding of C.I. acid red 2 to human serumalbumin: determination of binding mechanism and binding site using fluor-escence spectroscopy, Dyes Pigments 83 (2009) 249–257.
[35] F.F. Tian, F.L. Jiang, X.L. Han, et al., Synthesis of a novel hydrazone derivativeand biophysical studies of its interactions with bovine serum albumin byspectroscopic, electrochemical, and molecular docking methods, J. Phys.Chem. B 114 (2010) 14842–14853.
[36] J. Juarez, S.G. Lopez, A. Cambon, et al., Influence of electrostatic interactions onthe fibrillation process of human serum albumin, J. Phys. Chem. B 113 (2009)10521–10529.
[37] J. Zhang, Q. Yan, J. Liu, et al., Study of the interaction between 5-sulfosalicylicacid and bovine serum albumin by fluorescence spectroscopy, J. Lumin. 134(2013) 747–753.
[38] X.J. Guo, A.J. Hao, X.W. Han, et al., The Investigation of the interaction betweenribavirin and bovine serum albumin by spectroscopic methods, Mol. Biol. Rep.38 (2011) 4185–4192.


![Spectroscopic investigation (FT-IR, FT-Raman, UV, NMR ... · study, we report a detailed spectroscopic investigation of 2-[(acetyloxy)methyl]-4-(2-amino-9H-purin-9-yl)butyl acetate](https://img.dokumen.tips/doc/110x75/60df22b7b968a35a227444f1/spectroscopic-investigation-ft-ir-ft-raman-uv-nmr-study-we-report-a-detailed.jpg)