Embed Size (px)
Citation preview

© 2017 Interactive Advertising Bureau
MULTI-TOUCH ATTRIBUTION (MTA) IMPLEMENTATION AND
EVALUATION PRIMER
April 2017

© 2017 Interactive Advertising Bureau
This document has been developed by the IAB Advanced Attribution Working Group. The IAB Advanced Attribution Working Group is part of the IAB Measurement and Attribution Committee, whose mission is to develop and educate the market with perspectives, best practices, and guidelines regarding event and engagement measurement within the digital ecosystem, including how these events contribute incrementally to desired marketing outcomes. The committee examines matters across multiple platforms and devices. The Advanced Attribution Working Group aims to address the digital advertising community’s challenges around adoption of campaign measurement approaches beyond first/last touch methodologies, specifically: 1) the lack of education around the limitations of first/last touch, 2) awareness of alternatives to first/last touch models, 3) complexity of implementation of fractional attribution tools and counting methodologies, and 4) lack of clarity around how best to apply advanced attribution data within the reporting and optimization process. Find more information on our attribution hub at www.iab.com/attribution. IAB Advanced Attribution Working Group Roster
Abakus Flite Neustar Skimlinks Adform Foursquare NinthDecimal Snap, Inc. AdRoll GasBuddy.com NYIAX, Inc. StartApp Affinity X Google Pandora Tapad Amobee GumGum Pebble Post Tavant Technologies AOL / Convertro InMobi Phluid Media Tech Mpire BabyCenter Integral Ad Science Pinterest The Trade Desk Conversant Media iOPEX Technologies Placed The Weather Company Criteo IPONWEB Inc PubMatic TripAdvisor DashBid Jumpstart Media PulsePoint Turn Inc. DataXu Kochava Inc. Purch Twitter Drawbridge Leaf Group Qualia Media VisualIQ Dun & Bradstreet M&C Saatchi Mobile Quantcast WebbMason, Inc. Electronic Arts Madison Logic Rakuten Marketing WebMD Ernst & Young Matomy Media Research Now xAD Facebook Media iQ Digital Ltd ResponsiveAds YuMe Factual Medialets Rocket Fuel Zemanta Flipboard MediaMath Sizmek
About IAB The Interactive Advertising Bureau (IAB) empowers the media and marketing industries to thrive in the digital economy. It is comprised of more than 650 leading media and technology companies that are responsible for selling, delivering, and optimizing digital advertising or marketing campaigns. Together, they account for 86 percent of online advertising in the United States. Working with its member companies, IAB develops technical standards and best practices and fields critical research on interactive advertising, while also educating brands, agencies, and the wider business community on the importance of digital marketing. The organization is committed to professional development and elevating the knowledge, skills, expertise, and diversity of the workforce across the industry. Through the work of its public policy office in Washington, D.C., IAB advocates for its members and promotes the value of the interactive advertising industry to legislators and policymakers. Founded in 1996, IAB is headquartered in New York City and has a West Coast office in San Francisco.
IAB Contact Benjamin Dick Director, Data & Ad Effectiveness IAB Data Center of Excellence [email protected]
© 2017 Interactive Advertising Bureau
Table of Contents I. The Challenge of Attribution Paralysis ............................................................................... 1 II. Assembling a Path to Conversion ....................................................................................... 2
1. User Identity and Characteristics ........................................................................................ 3 2. Media Touchpoints ............................................................................................................. 4 3. Sales and Conversion Data .................................................................................................. 5
III. Data Platform Types and Roles in Multi-Touch Attribution (MTA) Analysis ....................... 6
IV. Organizational Readiness .................................................................................................. 8
V. Multi-Touch Attribution Platform Differentiation & Vetting .............................................. 9
1. Customer Service & Support ............................................................................................... 9 2. Technology Foundation .................................................................................................... 10 3. Planning and Optimization Integrations ........................................................................... 11 4. Platform Flexibility ........................................................................................................... 11
VI. The Role of Change Management ................................................................................... 12

© 2017 Interactive Advertising Bureau 1
I. The Challenge of Attribution Paralysis
Marketer and agency approaches to digital communications have matured tremendously in the years since digital media consumption first began to hit critical mass in the 90s. Facilitated by an influx of private investments in ad technology infrastructure and data collection tools, buy side constituents now have a robust and liquid marketplace in which to tell rich brand stories - across a variety of interactive formats - based on real time audience and inventory valuations. The increasing sophistication of buy side tools and processes is most notably apparent within decisioning, forecasting, transaction, and creative delivery functions.
However, a core buy side function that has not matured nearly as rapidly is that of campaign attribution - the process of determining the relative contribution of individual campaign impressions towards a pre-defined goal for the purpose of performance measurement and optimization. The dominant methodology known as last-touch attribution - which assigns credit to only the last ad that a consumer saw before taking some desired action - has remained the primary way value is assigned to individual campaign touch points since the early days of digital investment. More information about different types of attribution methodologies can be found in IAB’s Attribution Primer 2.0.
Last touch methodologies remain remarkably resilient despite well documented limitations and marketplace distortions. First, it philosophically runs counter to long standing consumer psychology research that long ago established the value and incremental gains to message recall associated with repeat exposure (originally codified in the reach / frequency strategies of the earliest TV buyers and researchers in the early 1950s). Additionally, because last touch remains the primary determinant of how media dollars get optimized over the life of a campaign, its widespread use creates a number of misaligned marketplace incentives that a) disproportionately skew marketer investment away from higher funnel channels, and b) makes it easier for fraudulent actors to enter the supply chain.
Many practitioners argue that last touch has persisted due to a combination of operational complexity associated with alternative approaches, as well as a degree of marketer apathy – sometimes colloquially described as “attribution paralysis” – when investigating and testing alternatives. Media buyerstend to describe it as a function of generalized assumptions about measurement limitations across devices and within “walled gardens.” While these limitations are legitimate and well-documented, their existence often a) obscures the availability of many innovative marketplace alternatives to last touch measurement & optimization, and b) more broadly contributes to a degree of comfort with the status quo that limits innovation. The better is generally sacrificed for the perfect.
One such alternative is a specialized class of data ingestion and analysis tools known as Multi-Touch Attribution (MTA) platforms, which are specifically designed to ease cross-device measurement and impression valuation challenges. While no MTA platform promises scientific exactness - they still rely on a degree of modelling and projection - these tools nonetheless paint a much more methodologically rigorous and complete picture of user-level media exposure across screens than past alternatives, and are widely regarded by practitioners as better proxies for measuring and optimizing campaign performance.
There is still confusion and operational complexity associated with MTA platforms that is limiting adoption - particularly when it comes to evaluation of marketplace options and implementation nuances. The goal of this document is to provide guidance on the role, function and key data inputs required of MTA platforms so as to ease operational complexity associated with implementation.

© 2017 Interactive Advertising Bureau 2
II. Assembling a Path to Conversion
Marketers want to use MTA analysis to uncover insights that will allow them to better allocate their advertising investment to improve marketing performance and grow their business. Many of the insights gleaned from MTA analysis can also be used to inform other functions like packaging, distribution, consumer research, or other business operations.
Meaningful MTA results are dependent upon two things: data and modelling. Data refers to tracking and normalizing all of the audience, device, media and sales/conversion data that go into media campaigns. Modelling speaks to how MTA providers interpret all this data to understand which factors - channel, creative, audience, etc. - most help a marketer grow their business. This document focuses specifically on the data ingestion aspects of MTA models.
To do so, let’s investigate how user-level data is generated over the course of a hypothetical advertising campaign for a big-box retailer’s new shirt line. Advertising and media touch points are generally organized chronologically from first to last event, a sequence known as a path to conversion. Let’s assume the retailer has a traditional storefront, a website, and an app, and plans to use both display and digital video ads.
Michelle is a 30-year-old woman who occasionally browses the retailer’s store during her lunch break at work, but has only purchased assorted household items - never shirts or other clothing. She nonetheless had signed up for the retailer’s loyalty card and supplied the store with her email address and phone number.
Although the retailer didn’t think Michelle would be interested in its new shirt line given her past purchase history, they noticed she created an account on their website - using the same loyalty card email address - and clicks on a link to the shirt collections on her iPad after work. The next morning Michelle logs in to her account from her work computer and views them again.

© 2017 Interactive Advertising Bureau 3
The retailer views this as a strong signal that Michelle is both aware of and potentially interested in the new shirt line, and also observes that, based on the information Michelle has supplied via her online registration and loyalty card information, that she has similar demographic and behavioral characteristics as other people who have bought the new shirts. Taken together, the retailer decides Michelle is a good prospect for its ad campaign.
Unfortunately for the retailer, Michelle gets distracted with vacation planning and doesn’t go back to their website for several weeks. The retailer tries to remind Michelle of the new shirt line when she’s on other websites, first by delivering a video ad to her iPad while she’s looking for hotel options, then follows up with a display ad on her work computer while she’s reading an article about possible restaurants and museums to visit on her trip. Ultimately neither are successful in getting her to return, so the retailer stops delivering ads given Michelle’s lack of response.
However, after Michelle finalizes all of her vacation details she decides to download and log into her account on the retailer’s Android application. The retailer immediately takes the opportunity to deliver an interstitial display ad when the app loads. Later that day Michelle finally adds a shirt to the app’s shopping cart from her phone, but doesn’t check out because she’s not sure which size is best. Instead she decides to go into the store after work the next day so she can try on the shirt first. Michelle ultimately buys two new shirts, just in time for her vacation, and gets 10% off the purchase price for having a loyalty card.
How can the retailer piece this story together in a chronological sequence? It starts with associating information from three different types of data sets: user attribute data sets, media touchpoint data sets, and sales / conversion data sets. These are generated from disparate advertising and marketing technology platforms – collectively known as the advertisers “technology stack” - that provide the infrastructure and executional tools that marketers use to implement and optimize digital media campaigns.
1. User Identity and Characteristics
At the most atomic level, identifying Michele as an individual with specific interests, preferences or prior relationships with the brand is central to a marketer’s interest in wanting to deliver certain messages that might be relevant to her, as well as measuring whether those messages were effective. While this might sound obvious, painting this picture requires that a marketer have a rigorous approach to linking available advertising/impression opportunities to anonymized information about the user’s characteristics. This information is generally obtained from either the marketer's’ own sales or CRM records or external 3rd party data partners, which together provide the marketer a more informed sense of a consumer’s demographics, past purchase history with the brand, web content and browsing behavior, or other types of information that might be important for a marketer to make an informed decision about the value of the advertising opportunity. This data can be categorized, or segmented, broadly as audience data and device data.
○ Audience Data: Audience data differentiates user characteristics for the purposes of 1) evaluating and/or bidding on impression opportunities, or 2) measuring the relative impact of media exposure on certain consumer cohorts relative to others. There are broadly two categories of audience data:
■ Data that is unique to the Marketer-Consumer interaction: helps marketers make determinations like, “Is this person a new customer or an existing

© 2017 Interactive Advertising Bureau 4
customer?” or “How frequently does this consumer buy my product?” In the example above, data collected from past marketer-consumer interactions would have been used to determine that Michelle was an existing, loyal customer. This type of data is almost exclusively collected directly by the marketer or advertiser (1st party data).
■ Data that is not unique to the Marketer-Consumer interaction: helps approximate audience demographics or behavioral characteristics. This type of data helps the marketer make a more informed decision about the person’s age, gender, income, geography, interests, in-market intent, or psychographic information. Generally, this type of audience information is made available by specialized syndicated services to any advertiser who might be interested in purchasing it (3rd party data).
When used individually or with other segments, audience data helps determine the relative value of an impression opportunity to an advertiser by establishing a foundation for understanding a consumer’s likelihood to be receptive to the brand or product being advertised.
○ Identity and Device Graphing Data: Device graphing data allows marketers to determine both direct or statistically significant associations between anonymized individuals and the various devices that they use. Device graphing data is considered a foundational input informing cross-device reach/frequency signals and the evaluation of the incrementality of repeat ad exposures across a path to conversion. There are two techniques used to assemble user-level device graphs - deterministic matching, which relies on persistent identifiers like email address logins across devices to make an association, or probabilistic matching which infers device relationships / correlation based on analysis of data points like IP address and location over time. Often times the two techniques are used simultaneously. For more information about deterministic and probabilistic techniques, please refer to IAB’s Attribution Primer 2.0.
Together, audience and device graphing data help MTA platforms create a story about who’s seeing the marketer’s ads, and how well that person’s behavioral and demographic characteristics align with the brand or product being advertised.
2. Media Touchpoints
After accounting for data that enables an understanding of user identity and characteristics, this information needs to be associated with paid media touch points that a consumer experiences from the start of the campaign through the end. In the example above, the media touch points in Michelle’s path to conversion first started with ad exposures on her iPad and work computer, followed by an in-app ad experience on her mobile phone. In addition to recording that these ads were delivered to devices associated with Michelle, media touchpoint data also usually indicate the format of the ad (display, video, rich media), the cost of the ad, and if the user engaged with the ad (clicked, shared, completed, hovered, etc). MTA models benefit by including as much information as possible about user engagement with the media, as engagement is considered to be an important proxy for whether the user was receptive to the message. Understanding the media journey will help getting an accurate read out on different

© 2017 Interactive Advertising Bureau 5
media channel’s effectiveness that were most important in influencing Michelle’s final in-store shirt purchase.
There are distinct boundaries around the universe within which these media touch points can be measured. Due to measurement limitations in both digital and offline channels, most practitioners acknowledge that the entire and complete truth of how the user consumes media can’t be captured in its entirety within an MTA model (see “Offline Media Touch Points” below). The awareness of this universe’s imperfections is important for marketers to thoroughly evaluate before finalizing a measurement strategy, as this will shape how the organization determines campaign performance indicators that the MTA model can work against.
There are two primary forms of media touch points: online and offline. Additionally, online touch points have several quality dimensions that are important to measure and account for when building an MTA model.
● Online Media Touch Points: These are paid media touchpoints delivered primarily on digital devices, including computers, phones, tablets, and smart TVs. They specify the kind of media asset the consumer is exposed to (video, native, banner, in-app), on what platform (desktop, mobile browser, tablet application, etc.), at what time, and at what cost. When evaluated in relation to each other in a chronological path to conversion, this information helps analysts construct “day in the life” scenarios that help illustrate how consumers are interacting with media and what elements of the campaign are working or not working.
○ Quality of Impression Opportunity: Not all online media touch points have the same opportunity to be seen by consumers. For example, an ad could be delivered to a consumer’s browser on a different tab than what’s being viewed, or to the bottom of a page that a consumer never sees. As such, it is important to use third parties to validate media touch points based on whether they had an opportunity to be seen by the user. Impressions that can’t be seen can have no impact on a marketing outcomes, and if they are not accounted for can skew the insights delivered by the MTA model.
● Offline Media Touch Points: Offline media - like TV, radio, billboards, or print ads - generally can’t be tied to individual exposure unless a significant degree of modelling is involved. Regardless, accounting for these offline media activities is a crucial step to ensure the accuracy of MTA platforms. In the scenario above, the statistical model would need to account for the possibility that Michelle responded to a billboard in the area or an ad on the radio that morning on her way to work. Offline media is usually provided via “schedules” by a marketer or agency, which indicate the time, location, target audience, and number of ads that have been purchased. There are generally different schedules for each of the offline channels.
3. Sales / Conversion Data After assembling information about consumer characteristics, devices, and whether they were exposed to ads, the next step is to measure whether those ads influenced consumer behavior via sales or conversion data. This data specifically supplies metrics indicative of campaign results, which are usually referred to as key performance indicators (KPIs). Most digital campaigns have a single, quantifiable KPI that all media are attempting to improve and optimize

© 2017 Interactive Advertising Bureau 6
over time. This actionability criteria is important to marketer KPI selection, but often overlooked. For example, the marketing goal of the campaign that Michelle saw was to sell more shirts, however the marketer cannot use in-store shirt sales as a KPI because those sales can’t be immediately trackable at a user level and associated with media campaign exposure. Instead, the marketer might use a proxy metric for this goal that can be immediately acted upon, like store visitation (measured via the lat / long information on a consumer's phone) or visits to the locator page on the store website. The KPI represents the optimization metric that enables marketers to take action on MTA insights by shifting budget across channels or within channels, as well as adjusting creative and offers in market to improve overall marketing performance.
While it's best practice for a marketer to always optimize against a single primary KPI, they may also track other secondary or tertiary metrics indicative of progress towards the primary KPI. For example, if Michelle were to visit the store’s homepage it might be a good indicator that she may buy a shirt in the future. Or signing up for a loyalty card may be a mid-funnel KPI that aligns with a business objective to deepen its relationship with Michelle and drive future sales. Other examples of mid- or upper-funnel KPIs might be content downloads or first-time visits to the website. Like media touchpoints and user attributes, these KPIs should be trackable at a user level either through an ad server, pixel-based tracking, API integration, or server-to-server integration.
By assembling information about user characteristics, media touch points, and sales/conversion data into an MTA solution, marketers can begin to understand which combination of channels, audience targets, publishers, devices, creatives, search keywords, or other marketing considerations are performing most effectively against their KPI. This analysis enables the marketer to not only make optimization decisions to improve individual campaigns performance over time, but also uncovers insights that can inform future campaign planning and non-advertising related aspects of the marketer’s business like packaging, distribution, or business operations.
III. Data Platform Types and Roles in Multi-Touch Attribution (MTA) Analysis
Organizing all of one’s data into a cohesive MTA narrative can be a daunting challenge given the variety of platforms that are necessary to execute a modern omni-channel campaign, as well as the varied and overlapping types of data that are generated across platforms. To make things even more complex, some data sources - like offline TV schedules or media mix models - are inherently not available at user level granularity. How can one make sense of and untangle this patchwork of information to see a more complete picture of users’ path the conversion?
The first step in constructing a complete analytical foundation for any given campaign or broader media strategy is to make sure there’s at least one input for each of the three primary data categories outlined above: user attributes, media touch points, and conversion data. Next - if there are two or more inputs within each category - practitioners must determine which of these data sources should be the de-facto source of data - also known as the platform of record - given that many common platforms like ad servers, DSPs, and CRM databases contain data that address multiple categories. This will avoid confusion when slight discrepancies undoubtedly crop up between data sets. Secondary data sources are still valuable reference points and should not be discarded, however some data sources are considered more accurate than others given their role in the supply chain. For example, many practitioners commonly use DSPs as the platform of record for programmatic media delivery (instead of,

© 2017 Interactive Advertising Bureau 7
say, ad servers) given that this media is often purchased in biddable environments where the DSP has sole access to information about the ultimate price paid for the ad.
Below is a list a of commonly used data inputs for MTA platforms, an overview of their role in the supply chain, and the types of data that they tend to provide. It’s important to note that this overview is not comprehensive, as the types and quality of data sets available in the marketplace are constantly evolving. Additionally - practitioners will rarely have access to all these options simultaneously. The types of data sources available will be completely dependent upon their specific marketing goals, media assets, budget, and technology stack being used by the marketer.
Data Platform Inputs
Definition User Attributes
Media Touchpoints
Conversion Data
Ad Servers Service that provides centralized storage, tracking, and delivery of media campaign assets
✔ ✔
Verification Platforms (On-target, Viewability, Fraud, Brand Safety)
Allows advertisers to evaluate the quality of individual impressions against certain criteria. Quality is evaluated largely against viewability, brand safety and/or fraud. Technology often offers option of blocking ad based on measurement or influencing bidding.
✔
Search Platforms Dedicated platforms intended to facilitate search campaign development, implementation, bid strategy optimization, and analysis / reporting within a dedicated search ecosystem.
✔ ✔
Demand-side Platforms (DSPs)
Software primarily used for access to and decisioning against exchange inventory and private marketplace inventory accessed through exchanges. Other functions usually include bundled bidding algorithms / optimization techniques, 3rd and 1st party data integrations, tagging and attribution functionality, and media delivery reporting
✔ ✔ ✔
Site analytics tools Dedicated website analytics tools that allows for robust tracking of website visitation, referral sources from outside media, content consumption patterns, and session duration.
✔
Social network marketing platforms
Dedicated platforms designed to facilitate social campaign development, implementation, tracking, and reporting within integrated social ecosystems. See also – sPMD.
✔ ✔ ✔
Customer Relationship Management (CRM) Platform
Business tool that consolidates and organizes customer interaction information like email addresses, sales history, home addresses, etc. so as to facilitate and automate workflow processes and tasks involved with sales, business development, and marketing.
✔ ✔
© 2017 Interactive Advertising Bureau 8
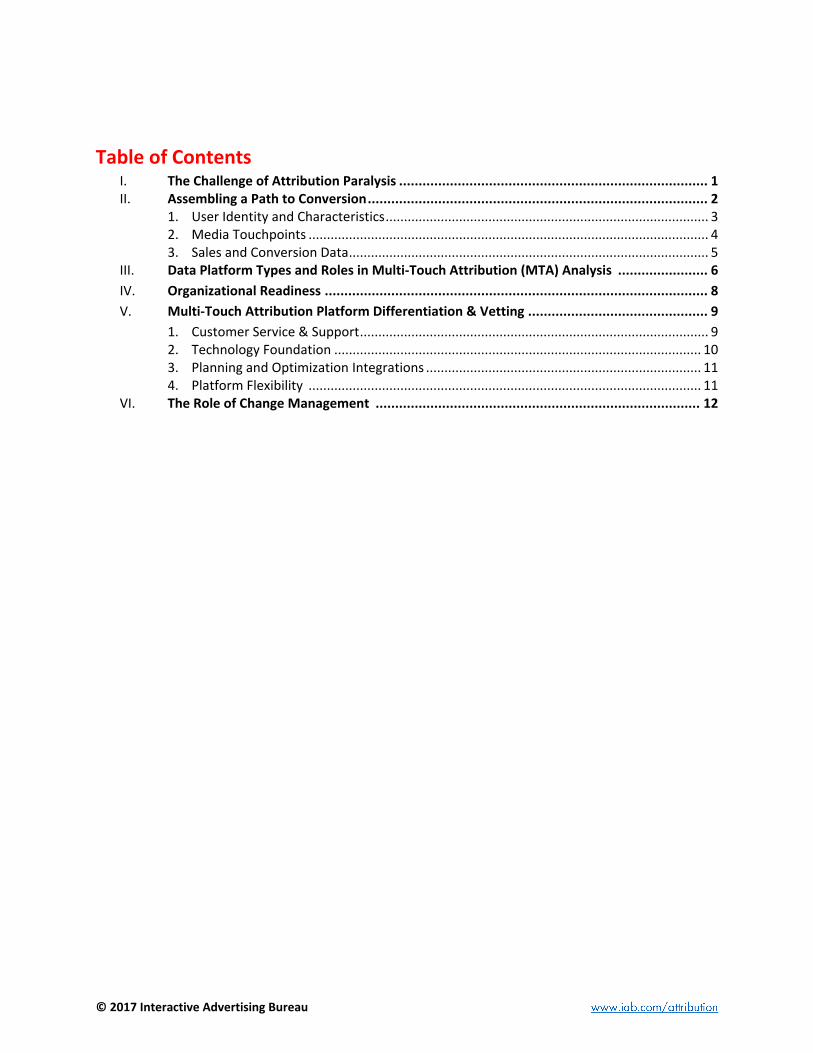
Data Management Platform (DMP)
Technology service that allows operators to aggregate and normalize disparate data sets for advanced campaign analytics/reporting
✔ ✔
Syndicated 3rd Party Audience Data
Information collected and sold by a third-party provider that segments consumers based on specific behavioral, demographic, or geographic characteristics that may be of interest to an advertiser.
✔
Offline - Marketing Mix Model
Marketing mix modeling is the use of statistical analysis to optimize future media mix and promotional tactics with respect to sales revenue or profit. It works by modeling large aggregate datasets, and does not require uniquely identified individuals.
✔
Offline – Point of Sale (POS) Data
Data collected or purchased from retailer POS systems or loyalty card databases that ties persistent marketing identifiers like email addresses, deviceIDs or cookie IDs to in-store purchases for the purposes of segmentation, targeting, or tracking / measurement.
✔ ✔
Offline - Traditional Media Schedules (TV, Print, Radio, OOH)
Schedules that track quantity, location, and type of offline media spending across traditional channels like TV, Radio, Print, or out-of-home billboards.
✔
3rd Party Digital Research
Data collected by third party research providers that provides analysis of how media exposure over time influences brand metrics (like awareness, purchase intent, or recall) or in store sales lift.
✔ ✔
IV. Organizational Readiness
Before evaluating the use of an MTA platform, every marketer needs to thoroughly weigh the pros and cons of these solutions against the specific needs of their business. MTA implementation lead times can be long and require significant coordination across the various internal and external stakeholders that own the disparate marketing functions informing MTA models (creative agencies, media agencies, CRM platforms, analytics platforms, etc.). Before engaging in a potentially disruptive process, it's important for marketers to clarify the business and marketing needs that MTA solutions can address, and should be able to answer the following questions:
1. What do I want to achieve by using an MTA solution? a. Is it to gain consumer journey insights, to inform paid media budget allocations, to
optimize the consumer experience, or a combination of all? 2. What are my marketing objectives?
a. Which KPIs do you use to measure marketing success? b. Do your KPIs include both online and offline events? c. Can all of your KPIs be measured at a user level?

© 2017 Interactive Advertising Bureau 9
3. How many different channels do I use and plan to bring into the MTA solution (e.g. display, paid search, SEO, affiliate, email, website direct)?
4. How frequently do I plan media? a. How often do I optimize plans in market? b. Do I buy and optimize media programmatically?
5. How complex is my marketing taxonomy and associated reporting needs? a. For example, do I want to see MTA metrics by campaign, creative concept, creative
name, line of business, region, audience segment? Some other way? 6. How quickly do I want to start seeing attributed data? 7. Who will be the primary users of the attribution solution?
a. Will the users be in-house, within my agency, or a mix of both? b. Will the primary users be internal teams, external media planners/buyers, analysts, or a
combination of all?
V. Multi-Touch Attribution Platform Differentiation & Vetting
After making the determination to investigate MTA options, marketers then need to navigate a number of providers that have varying degrees of sophistication. This can result in very different capabilities and competencies. As such, each MTA provider will ingest and interact with data sets in slightly different ways. When evaluating possible MTA options, there are very specific lines inquiry that should be followed to vet the provider’s ability to meet long-term marketing needs.
Below are key questions that buy side practitioners can use to help determine key differentiators and core competencies across possible MTA solutions, and how well the provider's particular solutions fit with long-term goals. The selection of an MTA partner should be a comprehensive process given upfront implementation and resource costs, as well as the length of time MTA engagements tend to require in order to provide meaningful movement of brand's attribution model and optimization philosophy across channels and formats. Ultimately it should be an ongoing, consultative relationship that ultimately affects a brand’s bottom line results over time. MTA solutions should always be customized to meet a brand's long-term marketing needs instead of short term tactical goals.
1. Customer Service & Support - an MTA provider’s level and quality of dedicated support for the marketer or agency is often crucial to the success of a multi-touch attribution approach. Customer service and support is generally provided in two areas: initial onboarding and data analysis / interpretation.
a. Implementation and onboarding - Implementation is the process of setting up the infrastructure of an MTA solution so that it can continuously deliver relevant insights and recommendations. The important aspects of this are:
i. Resources: having a clear understanding of resource needs on both sides - marketer and vendor. These can include time, operational needs, or human capital.
ii. Feasibility: understanding of the options and possible limitations of setting up the necessary technology across the marketer’s existing systems. This can include setting up site analytics, placing campaign tags, setting up log file exports, building data feeds for offline information, or setting up other 3rd party integrations.
iii. Validation: developing an approach for collecting clean and robust data for use in the MTA solution
iv. Project Management: the approach to monitoring progress, identifying roadblocks, and resolving issues across multiple stakeholders.

© 2017 Interactive Advertising Bureau 10
b. Analysis & Interpretation of Results - Often times the insights generated from MTA platforms are going to require explanation by a client service team or analyst. Other times, it might not be obvious how best to operationalize certain pieces of information. Additionally, longer term consulting services are sometimes available to support monthly or quarterly business review sessions held by marketers that intended to provide a consistent customer success theme based on the data. These are usually done alongside dedicated analytics teams inside the marketing organization which has specific modelling needs.
Key Questions to Ask:
● What integration method(s) do you use to collect digital media touch points and conversions?
● What integration methods do you use to collect offline data, including addressable offline media touch points (e.g. direct mail) and offline conversions (e.g. call center, in-store conversions)?
● How long is the setup/onboarding process before you can build the first model? ● What is your approach to mapping users across devices? ● What types of reports do you offer, and what business question(s) will each one
answer? ● What resources or support do you offer to help my team interpret results?
2. Technology Foundation - An MTA provider’s technology foundation will affect the speed and
accuracy with which relevant insights can be delivered to inform decision making. It is important that the MTA vendor has the ability to deliver against the cadence of the marketer’s planning and optimization process. Speed is a function of the integrations used to access, process, and validate data as well as train and refine models. The major MTA functionality impacted by technology foundations are:
a. Attribution Reporting: The cycle time between conversions happening and the attribution reports that explain the impact of media on those conversions
b. Cost Data Integrations: The cycle time between the ingestion of spend in business KPI’s (CPA, RPI) and the time at which the media spend was executed
c. Model Refreshing: The cycle time between model re-builds
Key Questions to Ask:
● How does your technology integrate and manage with media cost data to ensure efficiency metrics such as CPA and ROAS are accurate and reconciled?
● What kind of techniques do you use to validate model effectiveness and recommendations?
○ Statistical, causal, A/B test, holdout tests? ● Do you measure for causal or incremental conversions to arrive at incrementality
measurement? ● How do you account for viewable impressions? ● How often do you refresh the MTA metrics for reporting? ● How often do you refresh the model to produce MTA metrics?

© 2017 Interactive Advertising Bureau 11
3. Planning and Optimization Integrations - Optimization capabilities enable marketers to quickly develop insights or put changes into market based on MTA recommendations. Depending on the vendor, the platform may offer scenario planning capabilities and/or automated activation capabilities within buying tools based on MTA insights.
a. Scenario Planning: Allows a marketer to input parameters for a potential media plan to experiment with outcomes. The scenario planning tool will use MTA to recommend optimal budget allocations based on those parameters. Advanced solutions will allow marketers to input a desired budget, desired channels, a KPI goal (e.g. target CPA), and buying constraints (e.g. inventory limits, non-cancellable buys). Additionally, advanced solutions will provide recommended budget allocations at a granular level (e.g. publisher, placement, keyword) so marketers can buy media against those recommendations
b. RTB & Programmatic Buying Integrations: MTA vendor provides an automated feed of MTA metrics to marketer’s automated bidding/buying platforms (e.g. bid management platforms, DSP’s) in order to inform real-time buying decisions based on MTA metrics, rather than last touch metrics or CTR
c. Automated Insights: MTA vendors proactively suggest specific keyword/creative/placement level changes that can reduce need for dedicated human operation. These insights come from automated machine learning techniques that evaluate the complete breadth of the media plan and identify the most impactful items to act on
Key Questions to Ask:
● At what level of granularity can you provide optimization recommendations (e.g. channel, placement, creative, and keyword)?
● Do you offer a scenario planning tool that can account for my specific media buying constraints?
● Which RTB and programmatic buying vendors do you have integrations with? ○ What method of integration is used to pass data? ○ How often is data passed to partner platforms? ○ At what level of granularity is the data passed?
4. Platform Flexibility - Marketers often have very different needs from MTA platforms, so they
should be flexible enough to accommodate various organizational, reporting, or visualization customizations. Although all MTA technologies require some level of standardization to collect cross-channel data in an efficient and organized manner, some technologies offer greater flexibility than others in terms of accommodating each marketer’s specific business needs. One size does not fit all. These customizations manifest in many ways, but the most prominent are:
a. Taxonomy - Marketers buy in diverse ways using different tactics, tools and terminology specific to their business. Often these nuances result in structuring campaigns a certain way in ad servers and DSPs (package / placement structures), which in turn impacts the way that data is generated. Ultimately this flow of data need to aligned with MTA measurement, data collection, and visualization tools. Additionally, terminology used to describe specific elements of a campaign taxonomy in planning tools needs to be consistent in MTA platforms (eg. placement vs. ad group vs. campaign). Terminology will

© 2017 Interactive Advertising Bureau 12
also be factor when organizing data against certain lines of business or brand/product families.
b. Reporting & Data Visualizations - the way that marketers prefer to visualize and organize data will be just as diverse as their businesses. Factors that come into play here include overview tabs, campaign or channel specific figures, or capabilities for raw data dumps. Export tools are usually bundled into this functionality, and allow the user to pull data out of the platform in excel, .pdf, or PowerPoint formats.
c. Security Protocols - data governance, privacy, and security are becoming increasingly important to marketers. MTA platforms need to have mechanisms in place pertaining to automated data deletion (after a certain event or period of time), have a POV on US and EU privacy laws / best practices, and have policies or technology that accounts for possibility for data leakage from tags on a page or the platform itself.
Key Questions to Ask:
● Can the platform provide results that align with my organization’s specific marketing taxonomy (e.g. lines of business, products, regions, offers)?
● Can the platform integrate first and third party audience data so I can see results by key audience segments (e.g. demographic segments, new vs. existing customers, high lifetime value customers)?
● Can I create custom dashboards and/or easily export all of my data? ● How does the platform account for the disparate rules and regulations pertaining to
data collection and use across national boundaries?
VI. The Role of Change Management MTA model selection and implementation often requires many different constituents within and across marketing organizations to coordinate. Additionally, once MTA data starts being generated the insights / implications can extend well beyond the advertising team like IT, finance, procurement, or other parts of marketing (email, affiliates, offers). The end goal of adopting an MTA approach is to change behavior to help improve your business, which requires working across your company to ensure all colleagues’ who have an interest in measurement are onboard with this change.
To help make this change smoother, it's important to a) obtain organizational alignment from each key group affected by MTA platform implementation or reporting, b) have a clear understanding of model implementation and validation timelines, and c) make sure that success is defined consistently between and within departments:
• Organizational alignment - Ensure the right people are at the table, and that colleagues across your company have the opportunity to meet with prospective measurement providers. They can ask questions of most relevance to them and make sure the provider can satisfy needs on their mind.
• Establish and distribute timelines for implementation and model validation - Setting up the necessary processes and systems for sound media measurement takes time. Tracking all your media, calibrating an attribution model, testing optimizations based off new measurement insights, and ultimately building confidence in a new model will often be a long-term process over 12-18 months. It’s often helpful for marketers to establish a timeline for execution and align with internal stakeholders on the process to set proper expectations. Given that measurement can be an esoteric subject, it’s important to set expectations early across the

© 2017 Interactive Advertising Bureau 13
organization that this process cannot happen overnight. Timelines can help stakeholders appreciate the nuance and complexity of the project.
• Align on outcomes - Make sure relevant stakeholders not only agree on a timeline but also on what success looks like, both in terms of media performance and overall ROI of the MTA solution. Measurement can get technical and it’s all-too-easy to get lost in methodologies or technicalities during a conversation. When working across teams, make it clear what outcomes everyone wants to achieve against an agreed upon time frame.
Visit the IAB Attribution Hub for additional information: www.iab.com/attribution

![CONCERNING AND CONCERNING BETWEEN IA AND CMR …...problem could be resolved by Mr and Mrs CMR paying Mr IA’s fees. [15] Mr IA’s reasons for wanting Mr and Mrs CMR to underwrite](https://img.dokumen.tips/doc/110x75/604e63b95f861c61730fa07d/concerning-and-concerning-between-ia-and-cmr-problem-could-be-resolved-by-mr.jpg)


![MTA - Unopomp · TM01 8522 0300 MTA 3 MTA 4 L[mm] 35 45 TM01 8657 0600 TM01 8658 0600 TM01 9076 1000 10 L 10 125 45 Min. 20 mm General data MTA. 6 Technical data MTA 3 MTA 4 ... 105](https://img.dokumen.tips/doc/110x75/5be789d309d3f246788ca2ff/mta-tm01-8522-0300-mta-3-mta-4-lmm-35-45-tm01-8657-0600-tm01-8658-0600-tm01.jpg)