Embed Size (px)
Citation preview
MU-MIMO Tech Brief
Version 1.0.1 Authors: Contributors: Anisha Teckchandani Andrew Tanguay Meggie Yao
About This Document | 2
Contents About This Document ............................................................. 3
Intended Audience .............................................................................. 3
Typographical Conventions ............................................................... 3
Informational Icons ............................................................................. 4
Graphical Icons .................................................................................... 4
802.11ac Wave 2 ...................................................................... 5
Data Rate Evolution ............................................................................ 5
Channel Plan ........................................................................................ 8
Key Features ........................................................................................ 9
MIMO ...................................................................................... 11
Background ........................................................................................ 11
MU-MIMO ........................................................................................... 11 Overview ............................................................................................................................................... 11 Advantages ........................................................................................................................................... 12 Beamforming ....................................................................................................................................... 15 Transmit Beamforming vs. Spatial Multiplexing ............................................................................. 21 Sounding Overhead ............................................................................................................................ 21
Design Considerations ..................................................................... 22
Best Practices .................................................................................... 22
Device Capabilities ................................................................ 23
Nomenclature .................................................................................... 23
Grouping ............................................................................................ 23
Performance Testing ........................................................................ 24
Omnipeek Plugin ................................................................... 26
Installation ......................................................................................... 26
Modules .............................................................................................. 26 Airtime Graph ...................................................................................................................................... 27 MCS ....................................................................................................................................................... 28 Received Signal Strength Indicator (RSSI) ......................................................................................... 29 Sounding Intervals .............................................................................................................................. 30 Sounding Groups ................................................................................................................................. 30
Conclusion .............................................................................. 32
About This Document | 3
About This Document This tech note was intended to be a brief document describing the Multiple Input Multiple Output (MU-MIMO) enhancement utilized by 802.11 technology. A key area of focus for the document is highlighting the OmniPeek plugin developed by the Chief technology Officer (CTO) team at Aruba, a Hewlett Packard Enterprise company (Aruba). This versatile tool that works alongside OmniPeek offers valuable insight into MU-MIMO packet captures and assists administrators with troubleshooting network issues.
Intended Audience This Tech Brief is primarily intended for those looking to gain a deeper understanding of MU-MIMO technology as well as how Aruba utilizes them in deployments. The document was primarily written for the benefit of Aruba’s valued partners and end customers. Readers of this document should have CWNA-level knowledge or at least a working understanding of key WLAN concepts.
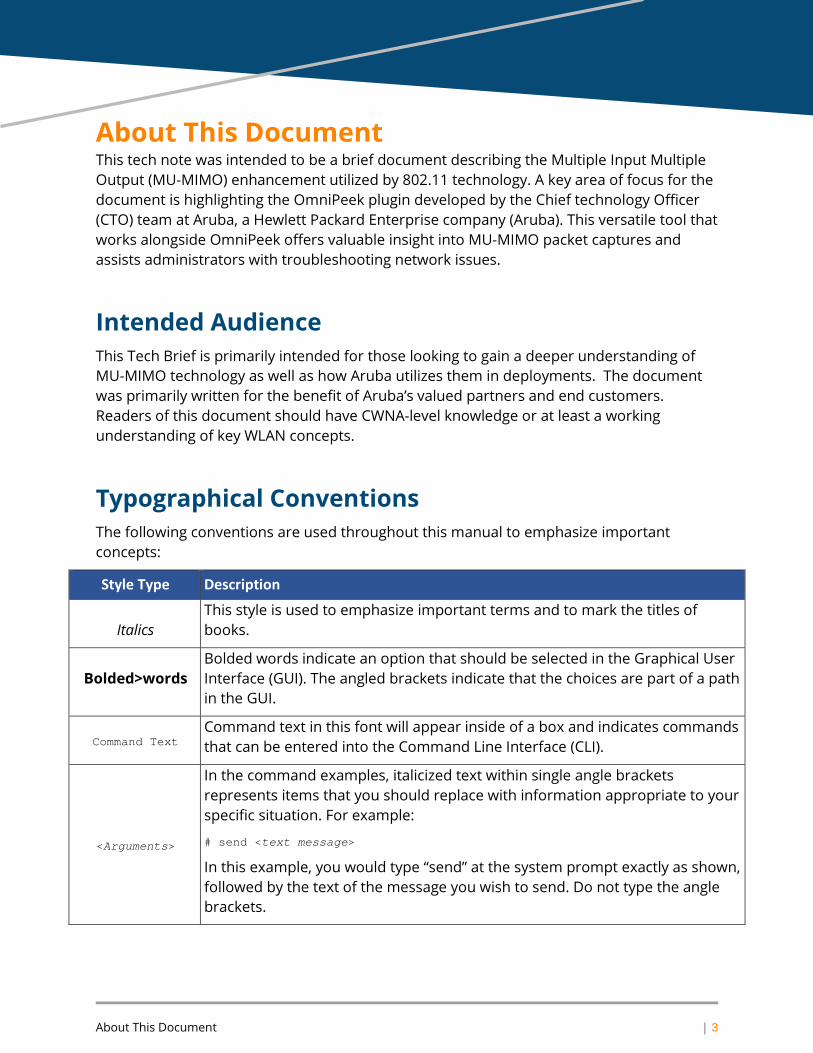
Typographical Conventions The following conventions are used throughout this manual to emphasize important concepts:
Style Type Description
Italics This style is used to emphasize important terms and to mark the titles of books.
Bolded>words Bolded words indicate an option that should be selected in the Graphical User Interface (GUI). The angled brackets indicate that the choices are part of a path in the GUI.
Command Text Command text in this font will appear inside of a box and indicates commands that can be entered into the Command Line Interface (CLI).
<Arguments>
In the command examples, italicized text within single angle brackets represents items that you should replace with information appropriate to your specific situation. For example:
# send <text message>
In this example, you would type “send” at the system prompt exactly as shown, followed by the text of the message you wish to send. Do not type the angle brackets.
About This Document | 4
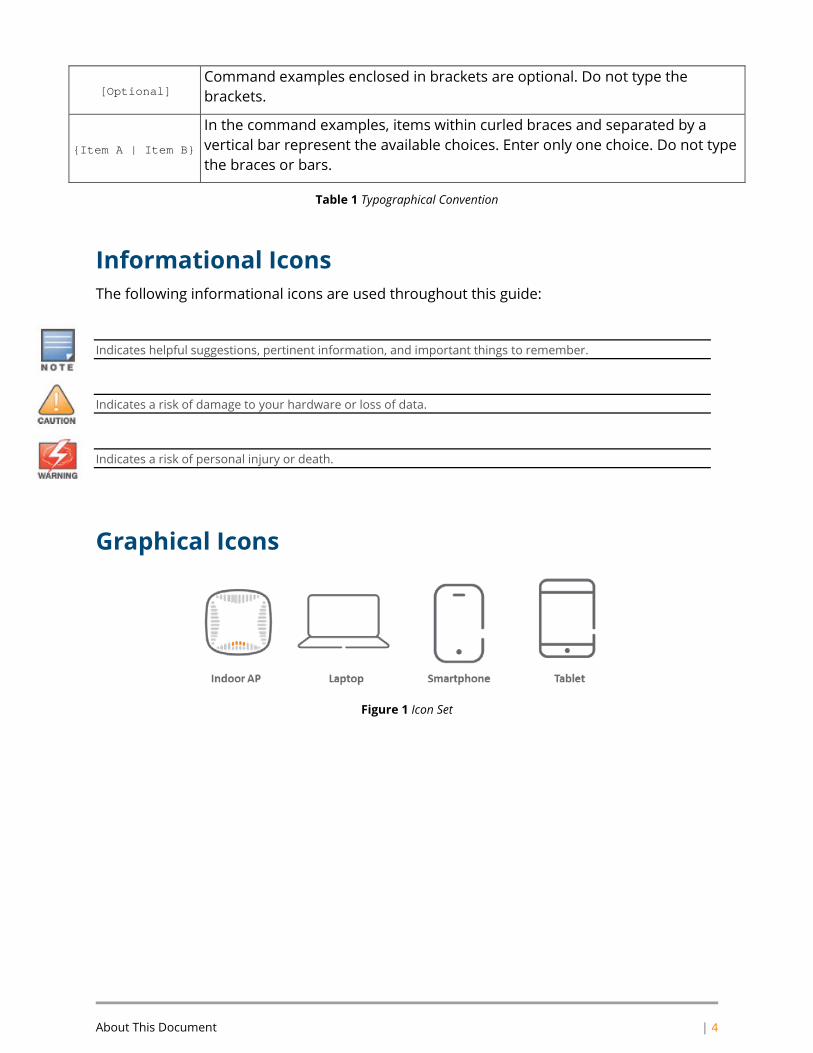
[Optional] Command examples enclosed in brackets are optional. Do not type the brackets.
{Item A | Item B}
In the command examples, items within curled braces and separated by a vertical bar represent the available choices. Enter only one choice. Do not type the braces or bars.
Table 1 Typographical Convention
Informational Icons The following informational icons are used throughout this guide:
Indicates helpful suggestions, pertinent information, and important things to remember.
Indicates a risk of damage to your hardware or loss of data.
Indicates a risk of personal injury or death.
Graphical Icons
Figure 1 Icon Set
802.11ac Wave 2 | 5
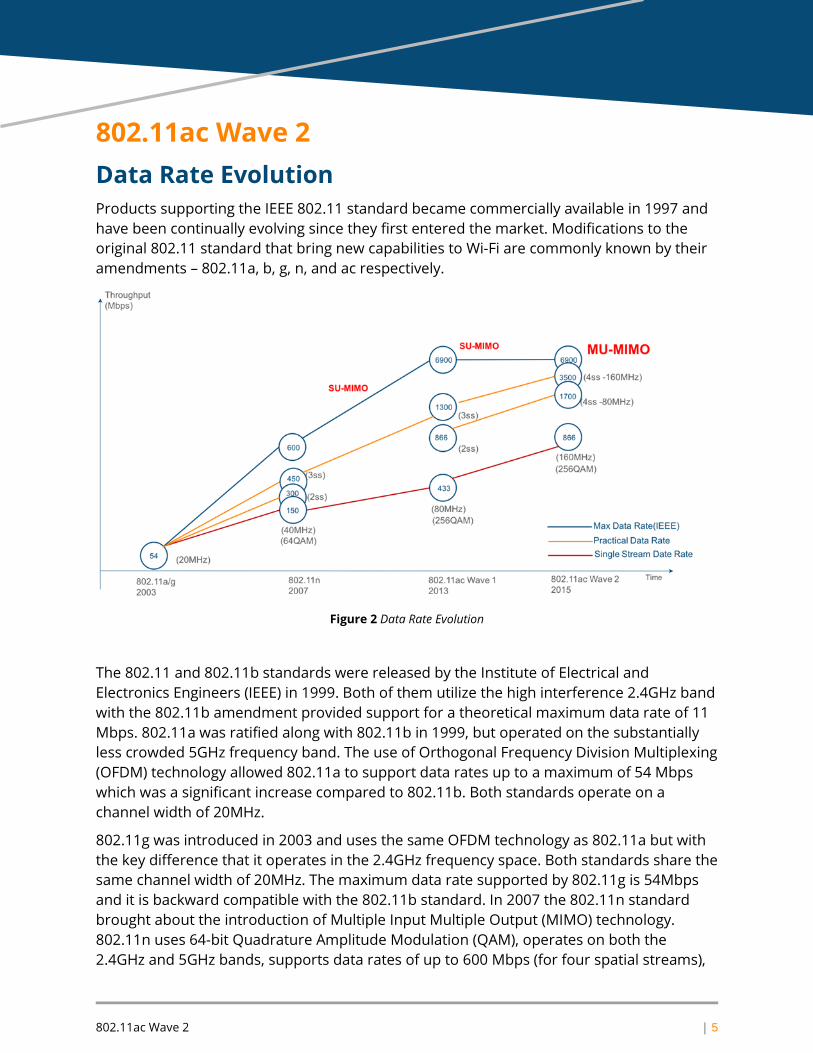
802.11ac Wave 2 Data Rate Evolution Products supporting the IEEE 802.11 standard became commercially available in 1997 and have been continually evolving since they first entered the market. Modifications to the original 802.11 standard that bring new capabilities to Wi-Fi are commonly known by their amendments – 802.11a, b, g, n, and ac respectively.
Figure 2 Data Rate Evolution
The 802.11 and 802.11b standards were released by the Institute of Electrical and Electronics Engineers (IEEE) in 1999. Both of them utilize the high interference 2.4GHz band with the 802.11b amendment provided support for a theoretical maximum data rate of 11 Mbps. 802.11a was ratified along with 802.11b in 1999, but operated on the substantially less crowded 5GHz frequency band. The use of Orthogonal Frequency Division Multiplexing (OFDM) technology allowed 802.11a to support data rates up to a maximum of 54 Mbps which was a significant increase compared to 802.11b. Both standards operate on a channel width of 20MHz.
802.11g was introduced in 2003 and uses the same OFDM technology as 802.11a but with the key difference that it operates in the 2.4GHz frequency space. Both standards share the same channel width of 20MHz. The maximum data rate supported by 802.11g is 54Mbps and it is backward compatible with the 802.11b standard. In 2007 the 802.11n standard brought about the introduction of Multiple Input Multiple Output (MIMO) technology. 802.11n uses 64-bit Quadrature Amplitude Modulation (QAM), operates on both the 2.4GHz and 5GHz bands, supports data rates of up to 600 Mbps (for four spatial streams),
802.11ac Wave 2 | 6
and has an operational channel width of both 20 and 40MHz. The substantially higher data rates were achievable via 802.11n due to the use of MIMO which employs multiple antennas at the transmitting and receiving ends of the signal.
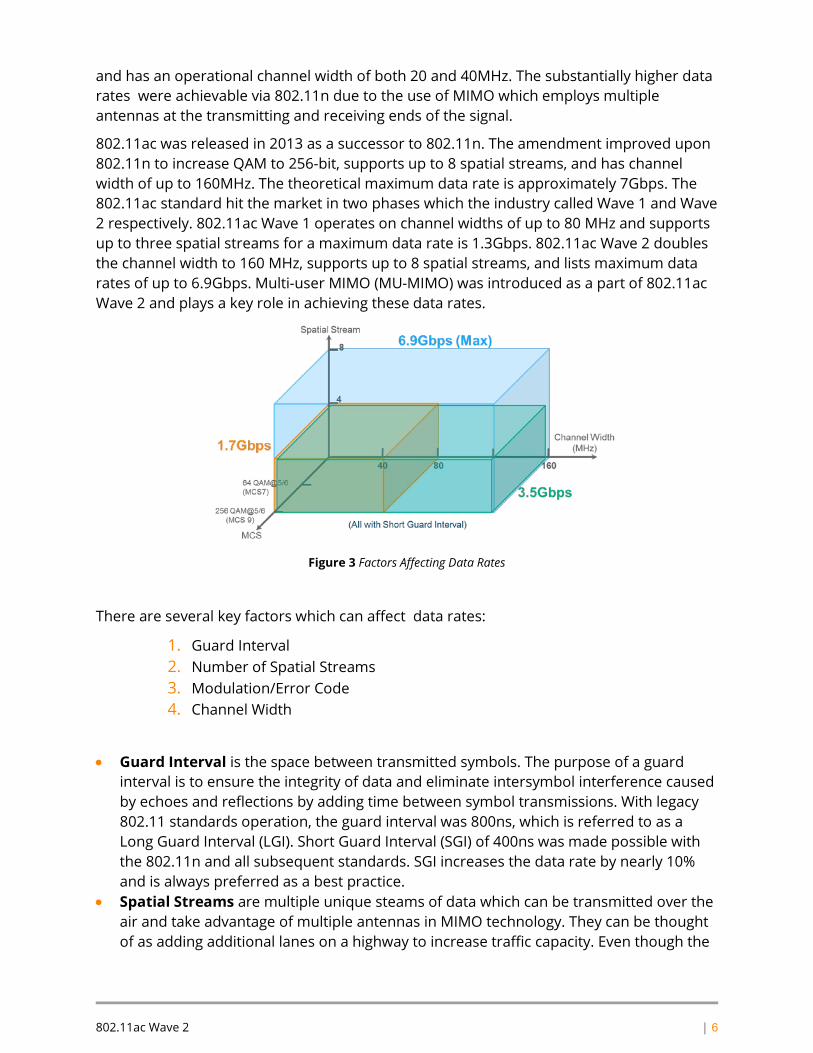
802.11ac was released in 2013 as a successor to 802.11n. The amendment improved upon 802.11n to increase QAM to 256-bit, supports up to 8 spatial streams, and has channel width of up to 160MHz. The theoretical maximum data rate is approximately 7Gbps. The 802.11ac standard hit the market in two phases which the industry called Wave 1 and Wave 2 respectively. 802.11ac Wave 1 operates on channel widths of up to 80 MHz and supports up to three spatial streams for a maximum data rate is 1.3Gbps. 802.11ac Wave 2 doubles the channel width to 160 MHz, supports up to 8 spatial streams, and lists maximum data rates of up to 6.9Gbps. Multi-user MIMO (MU-MIMO) was introduced as a part of 802.11ac Wave 2 and plays a key role in achieving these data rates.
Figure 3 Factors Affecting Data Rates
There are several key factors which can affect data rates:
1. Guard Interval 2. Number of Spatial Streams 3. Modulation/Error Code 4. Channel Width
• Guard Interval is the space between transmitted symbols. The purpose of a guard interval is to ensure the integrity of data and eliminate intersymbol interference caused by echoes and reflections by adding time between symbol transmissions. With legacy 802.11 standards operation, the guard interval was 800ns, which is referred to as a Long Guard Interval (LGI). Short Guard Interval (SGI) of 400ns was made possible with the 802.11n and all subsequent standards. SGI increases the data rate by nearly 10% and is always preferred as a best practice.
• Spatial Streams are multiple unique steams of data which can be transmitted over the air and take advantage of multiple antennas in MIMO technology. They can be thought of as adding additional lanes on a highway to increase traffic capacity. Even though the
802.11ac Wave 2 | 7
802.11ac Wave 2 standard allows support for up to 8 spatial streams, access points (APs) typically only support 3 spatial streams due to chipset limitations.
• Modulation Coding Scheme (MCS) Index takes into account values such as modulation type, number of spatial streams, code rate, etc. to derive a value for each possible combination. This unique number provides information about the theoretical data rates of an AP. The MCS Index for the 802.11ac standard specifies a range of values between 0 and 9 where a higher value indicates a higher theoretical data rate.
• Channel Width refers to the width of the signal carrying data. The wider the signal, the higher the data rate which may be achieved. Channel width is directly proportional to data rates.
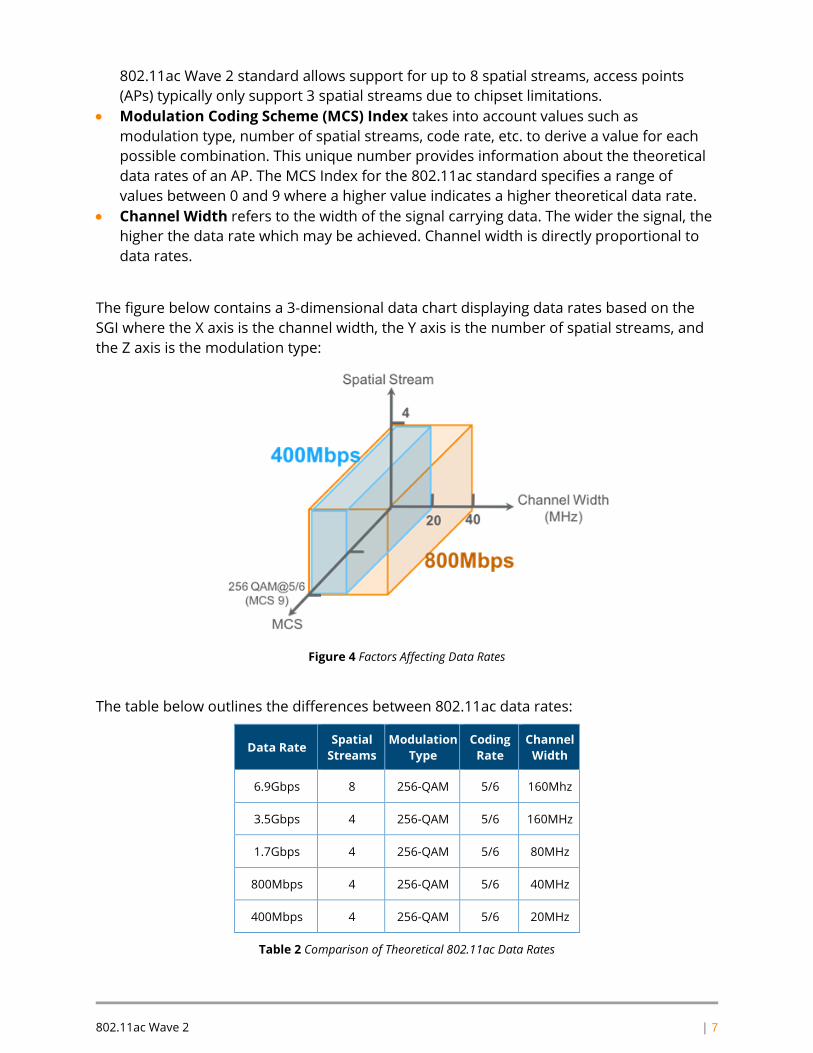
The figure below contains a 3-dimensional data chart displaying data rates based on the SGI where the X axis is the channel width, the Y axis is the number of spatial streams, and the Z axis is the modulation type:
Figure 4 Factors Affecting Data Rates
The table below outlines the differences between 802.11ac data rates:
Data Rate Spatial Streams
Modulation Type
Coding Rate
Channel Width
6.9Gbps 8 256-QAM 5/6 160Mhz
3.5Gbps 4 256-QAM 5/6 160MHz
1.7Gbps 4 256-QAM 5/6 80MHz
800Mbps 4 256-QAM 5/6 40MHz
400Mbps 4 256-QAM 5/6 20MHz
Table 2 Comparison of Theoretical 802.11ac Data Rates
802.11ac Wave 2 | 8
The highest theoretical data rate for an 802.11ac wave 2 capable AP is 6.9Gbps, which could be achieved with eight spatial streams, 160MHz channel width, and 256 QAM, and a 5/6 code rate. However, four is the maximum number of spatial streams currently used in modern production environments.
The next highest data rate with 802.11ac utilizing 4 spatial streams is 3.5Gbps. Since a channel width of 160MHz is not very practical on a large scale it is typically only used in private residences and small clinic environments and is not commonly deployed in enterprise networks.
The highest 802.11ac data rate that utilizes 80MHz channels and 4 spatial streams is 1.7Gbps. 4x4 access points are available from most vendors, so 1.7Gbps data rate is realistic for production environments.
Compared to 1.7Gbps, 800Mbps is a more practical data rate since it is achieved with 4 spatial streams, an MCS score of 9, and a 40MHz channel. In a very high-density environment, 20MHz channels width may be used instead of 40MHz which allows for a 400Mbps data rate with 4 spatial streams.
Most wireless clients in the market today are either capable of supporting either 1 or 2 spatial streams. With these specifications, a data rate of 200Mbps can be achieved for a 1 spatial stream client, or 400Mbps for 2 spatial stream clients with a 40MHz channel.
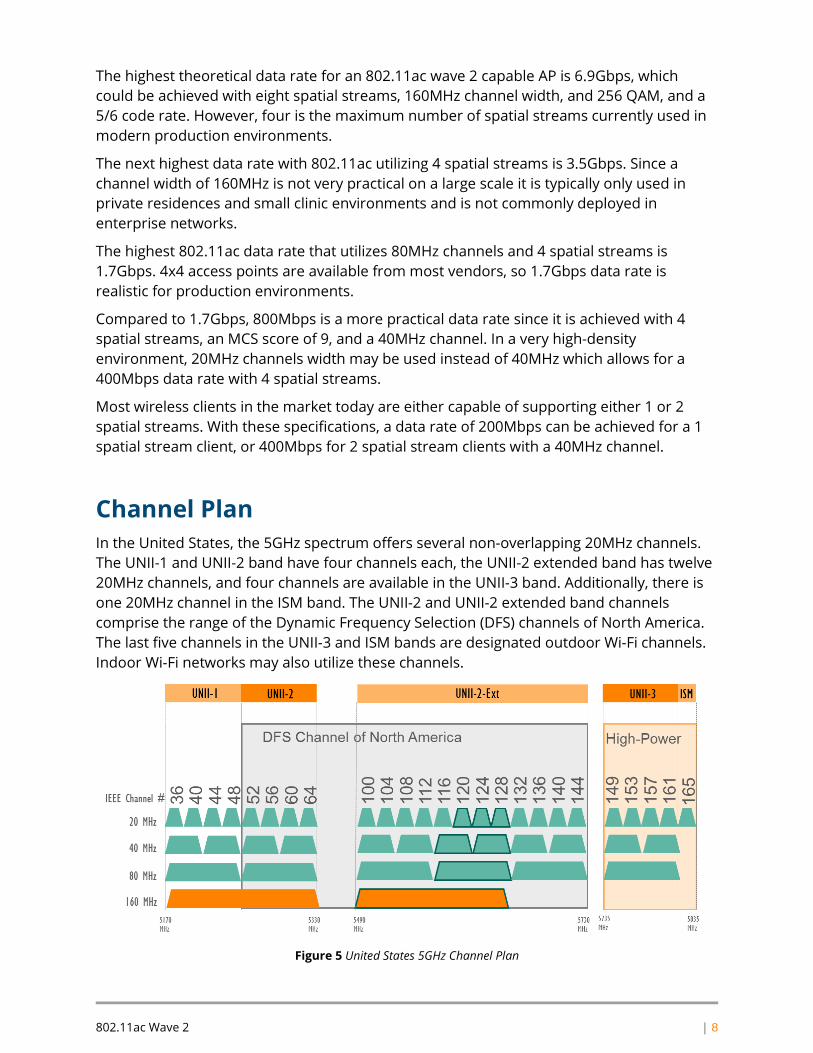
Channel Plan In the United States, the 5GHz spectrum offers several non-overlapping 20MHz channels. The UNII-1 and UNII-2 band have four channels each, the UNII-2 extended band has twelve 20MHz channels, and four channels are available in the UNII-3 band. Additionally, there is one 20MHz channel in the ISM band. The UNII-2 and UNII-2 extended band channels comprise the range of the Dynamic Frequency Selection (DFS) channels of North America. The last five channels in the UNII-3 and ISM bands are designated outdoor Wi-Fi channels. Indoor Wi-Fi networks may also utilize these channels.
Figure 5 United States 5GHz Channel Plan
802.11ac Wave 2 | 9
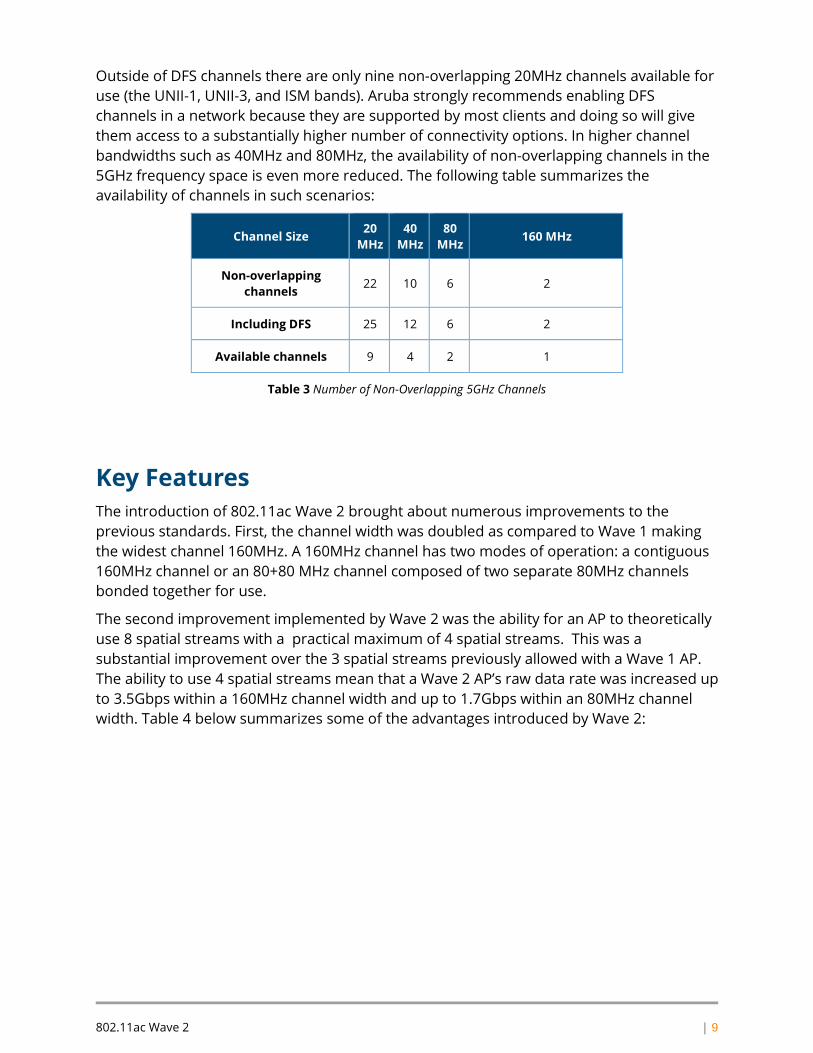
Outside of DFS channels there are only nine non-overlapping 20MHz channels available for use (the UNII-1, UNII-3, and ISM bands). Aruba strongly recommends enabling DFS channels in a network because they are supported by most clients and doing so will give them access to a substantially higher number of connectivity options. In higher channel bandwidths such as 40MHz and 80MHz, the availability of non-overlapping channels in the 5GHz frequency space is even more reduced. The following table summarizes the availability of channels in such scenarios:
Channel Size 20 MHz
40 MHz
80 MHz 160 MHz
Non-overlapping channels 22 10 6 2
Including DFS 25 12 6 2
Available channels 9 4 2 1
Table 3 Number of Non-Overlapping 5GHz Channels
Key Features The introduction of 802.11ac Wave 2 brought about numerous improvements to the previous standards. First, the channel width was doubled as compared to Wave 1 making the widest channel 160MHz. A 160MHz channel has two modes of operation: a contiguous 160MHz channel or an 80+80 MHz channel composed of two separate 80MHz channels bonded together for use.
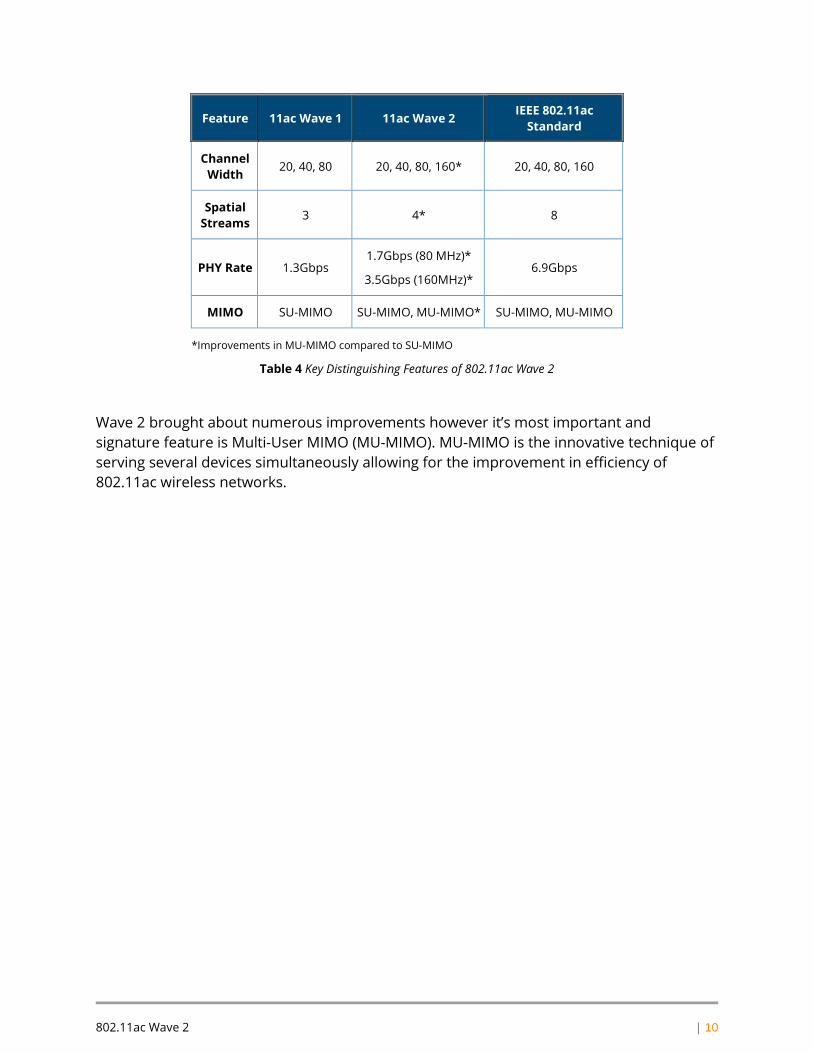
The second improvement implemented by Wave 2 was the ability for an AP to theoretically use 8 spatial streams with a practical maximum of 4 spatial streams. This was a substantial improvement over the 3 spatial streams previously allowed with a Wave 1 AP. The ability to use 4 spatial streams mean that a Wave 2 AP’s raw data rate was increased up to 3.5Gbps within a 160MHz channel width and up to 1.7Gbps within an 80MHz channel width. Table 4 below summarizes some of the advantages introduced by Wave 2:
802.11ac Wave 2 | 10
Feature 11ac Wave 1 11ac Wave 2 IEEE 802.11ac Standard
Channel Width 20, 40, 80 20, 40, 80, 160* 20, 40, 80, 160
Spatial Streams 3 4* 8
PHY Rate 1.3Gbps 1.7Gbps (80 MHz)*
3.5Gbps (160MHz)* 6.9Gbps
MIMO SU-MIMO SU-MIMO, MU-MIMO* SU-MIMO, MU-MIMO
*Improvements in MU-MIMO compared to SU-MIMO
Table 4 Key Distinguishing Features of 802.11ac Wave 2
Wave 2 brought about numerous improvements however it’s most important and signature feature is Multi-User MIMO (MU-MIMO). MU-MIMO is the innovative technique of serving several devices simultaneously allowing for the improvement in efficiency of 802.11ac wireless networks.
MIMO | 11
MIMO Background IEEE’s 802.11n standard was characterized by the usage of Multiple Input Multiple Output or “MIMO” technology. MIMO allows APs to multiply throughput with the use of multiple antennas at the transmitting as well as the receiving end. The AP sends traffic only to one client at a time and the airtime is shared between the clients. This technology is more commonly referred to as Single User MIMO or “SU-MIMO”. 802.11ac Wave 1 also utilizes SU-MIMO technology as the vast majority of the client market consists of single antenna chain devices i.e. 1x1 devices.
The terms 1x1, 2x2, 3x3 and 4x4 are representative of the following nomenclature: Transmitting Antennas x Receiving Antennas.
There are some client devices feature dual antenna chains i.e. 2x2 however only the Apple MacBook Pro is a 3x3 client meaning it has 3 antenna chains. Most APs today are 3x3 or 4x4 devices meaning that the APs will not be able to take advantage of its full spectrum when it communicates with clients with fewer antenna chains. This results in a situation where the spectrum efficiency of a SU-MIMO AP is relatively low.
MU-MIMO Overview In June 2016, the Wi-Fi alliance extended support for 802.11ac and introduced Wave 2 to address the shortcomings of its predecessor. Wave 2 makes use of Multi-User MIMO or “MU-MIMO” on the downlink to substantially improve network performance. MU-MIMO-capable APs are able to send multiple data streams to multiple clients simultaneously allowing for full utilization of the AP’s spectrum and maximizing spectrum efficiency.
Due to the aforementioned increase in spectral efficiency the network capacity/throughput is much higher for Wave 2-capable APs. In addition, these advances in efficiency are also transferrable to 1x1 or 2x2 clients such as cellphones and tablets as well. The end result is that MU-MIMO increases total network throughput by talking to multiple devices at once. Because more data can now be transmitted in a given period of time, MU-MIMO networks are faster and network latency is greatly reduced.
MU-MIMO is especially beneficial with the proliferation of smartphones in the market. In a MU-MIMO system with three clients, all of them can receive a single spatial stream from the AP simultaneously. To achieve the same throughput in SU-MIMO, each client would
MIMO | 12
require three antennas receiving data from the AP one-third of the time. In contrast, the faster throughput enabled through MU-MIMO means that the device only needs one or two antennas instead of three to receive data from the AP which greatly reduces the cost and space requirements for the end user devices.
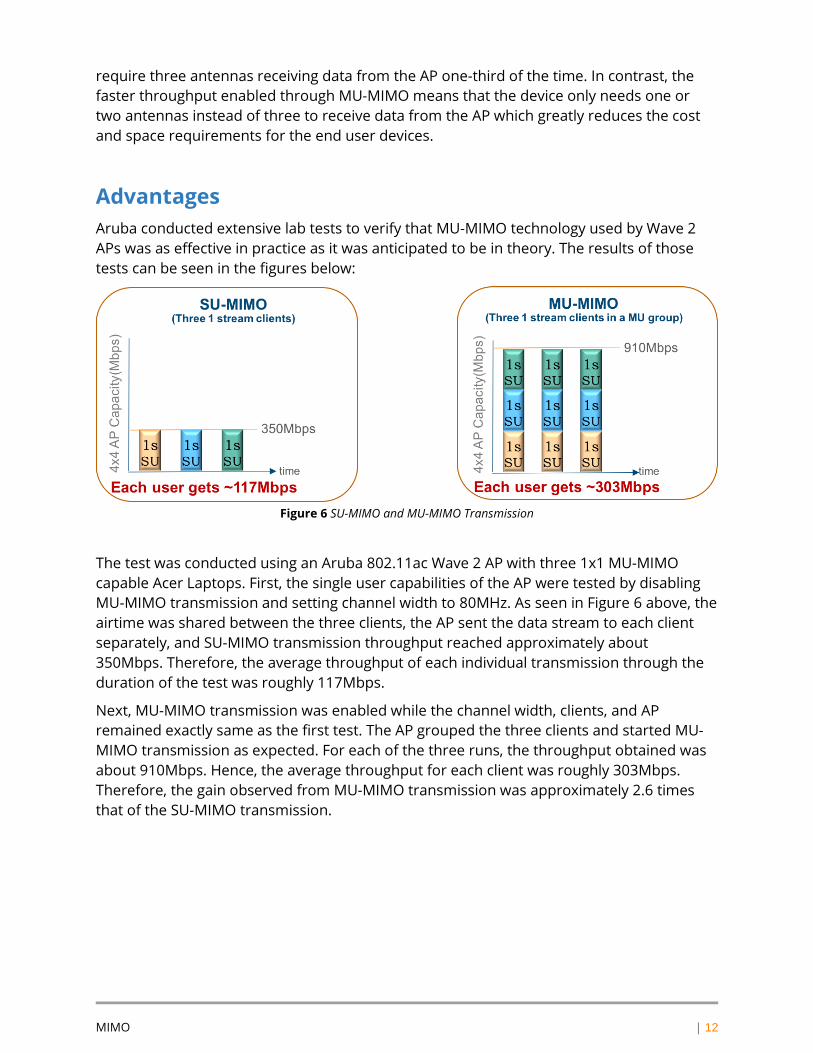
Advantages Aruba conducted extensive lab tests to verify that MU-MIMO technology used by Wave 2 APs was as effective in practice as it was anticipated to be in theory. The results of those tests can be seen in the figures below:
Figure 6 SU-MIMO and MU-MIMO Transmission
The test was conducted using an Aruba 802.11ac Wave 2 AP with three 1x1 MU-MIMO capable Acer Laptops. First, the single user capabilities of the AP were tested by disabling MU-MIMO transmission and setting channel width to 80MHz. As seen in Figure 6 above, the airtime was shared between the three clients, the AP sent the data stream to each client separately, and SU-MIMO transmission throughput reached approximately about 350Mbps. Therefore, the average throughput of each individual transmission through the duration of the test was roughly 117Mbps.
Next, MU-MIMO transmission was enabled while the channel width, clients, and AP remained exactly same as the first test. The AP grouped the three clients and started MU-MIMO transmission as expected. For each of the three runs, the throughput obtained was about 910Mbps. Hence, the average throughput for each client was roughly 303Mbps. Therefore, the gain observed from MU-MIMO transmission was approximately 2.6 times that of the SU-MIMO transmission.
MIMO | 13
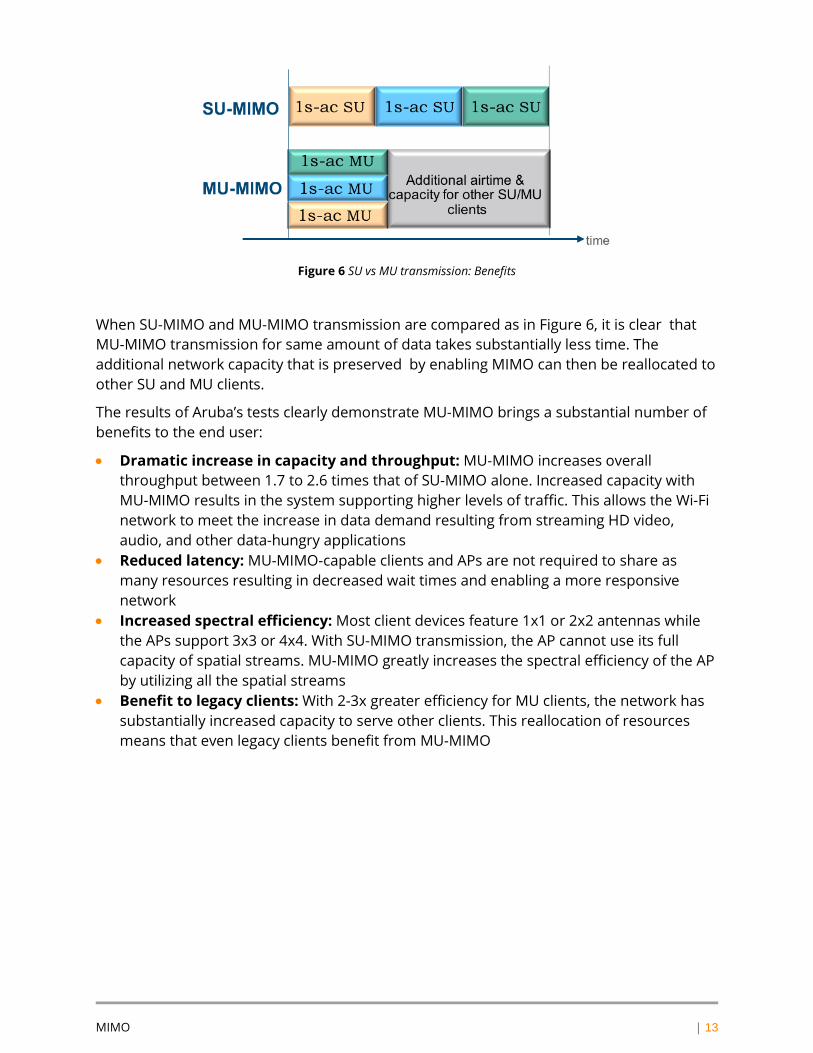
Figure 6 SU vs MU transmission: Benefits
When SU-MIMO and MU-MIMO transmission are compared as in Figure 6, it is clear that MU-MIMO transmission for same amount of data takes substantially less time. The additional network capacity that is preserved by enabling MIMO can then be reallocated to other SU and MU clients.
The results of Aruba’s tests clearly demonstrate MU-MIMO brings a substantial number of benefits to the end user:
• Dramatic increase in capacity and throughput: MU-MIMO increases overall throughput between 1.7 to 2.6 times that of SU-MIMO alone. Increased capacity with MU-MIMO results in the system supporting higher levels of traffic. This allows the Wi-Fi network to meet the increase in data demand resulting from streaming HD video, audio, and other data-hungry applications
• Reduced latency: MU-MIMO-capable clients and APs are not required to share as many resources resulting in decreased wait times and enabling a more responsive network
• Increased spectral efficiency: Most client devices feature 1x1 or 2x2 antennas while the APs support 3x3 or 4x4. With SU-MIMO transmission, the AP cannot use its full capacity of spatial streams. MU-MIMO greatly increases the spectral efficiency of the AP by utilizing all the spatial streams
• Benefit to legacy clients: With 2-3x greater efficiency for MU clients, the network has substantially increased capacity to serve other clients. This reallocation of resources means that even legacy clients benefit from MU-MIMO
MIMO | 14
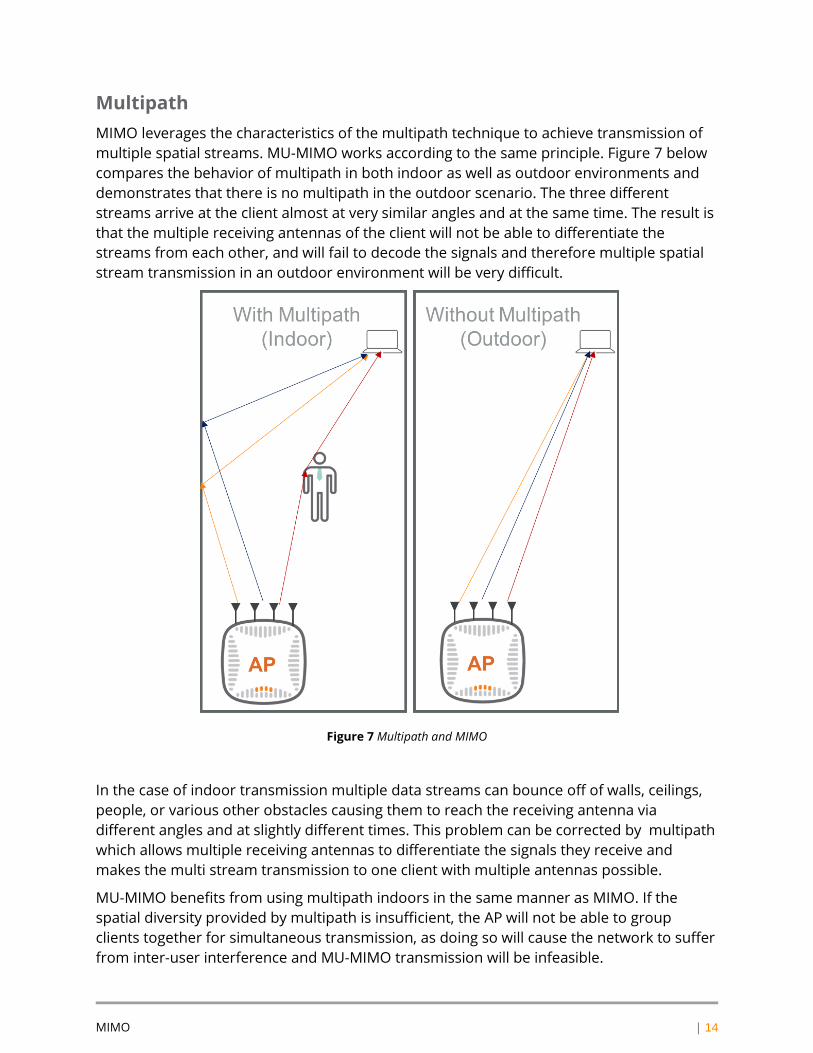
Multipath MIMO leverages the characteristics of the multipath technique to achieve transmission of multiple spatial streams. MU-MIMO works according to the same principle. Figure 7 below compares the behavior of multipath in both indoor as well as outdoor environments and demonstrates that there is no multipath in the outdoor scenario. The three different streams arrive at the client almost at very similar angles and at the same time. The result is that the multiple receiving antennas of the client will not be able to differentiate the streams from each other, and will fail to decode the signals and therefore multiple spatial stream transmission in an outdoor environment will be very difficult.
Figure 7 Multipath and MIMO
In the case of indoor transmission multiple data streams can bounce off of walls, ceilings, people, or various other obstacles causing them to reach the receiving antenna via different angles and at slightly different times. This problem can be corrected by multipath which allows multiple receiving antennas to differentiate the signals they receive and makes the multi stream transmission to one client with multiple antennas possible.
MU-MIMO benefits from using multipath indoors in the same manner as MIMO. If the spatial diversity provided by multipath is insufficient, the AP will not be able to group clients together for simultaneous transmission, as doing so will cause the network to suffer from inter-user interference and MU-MIMO transmission will be infeasible.
MIMO | 15
Beamforming
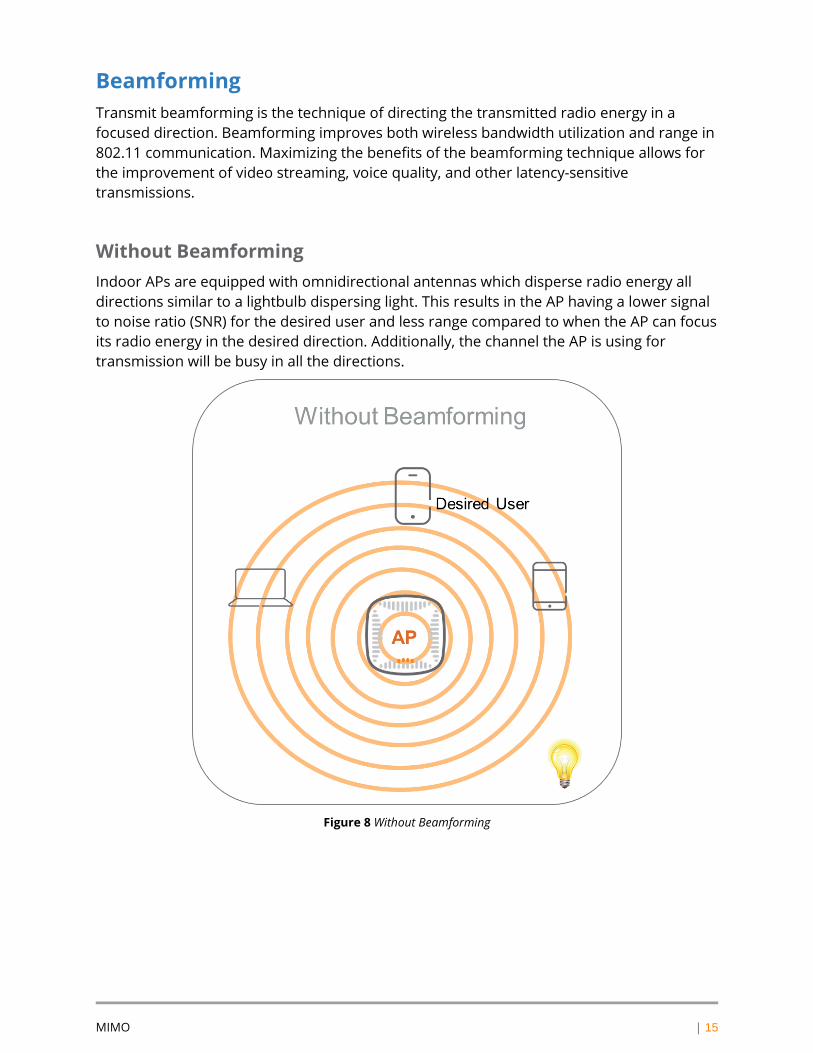
Transmit beamforming is the technique of directing the transmitted radio energy in a focused direction. Beamforming improves both wireless bandwidth utilization and range in 802.11 communication. Maximizing the benefits of the beamforming technique allows for the improvement of video streaming, voice quality, and other latency-sensitive transmissions.
Without Beamforming Indoor APs are equipped with omnidirectional antennas which disperse radio energy all directions similar to a lightbulb dispersing light. This results in the AP having a lower signal to noise ratio (SNR) for the desired user and less range compared to when the AP can focus its radio energy in the desired direction. Additionally, the channel the AP is using for transmission will be busy in all the directions.
Figure 8 Without Beamforming
MIMO | 16
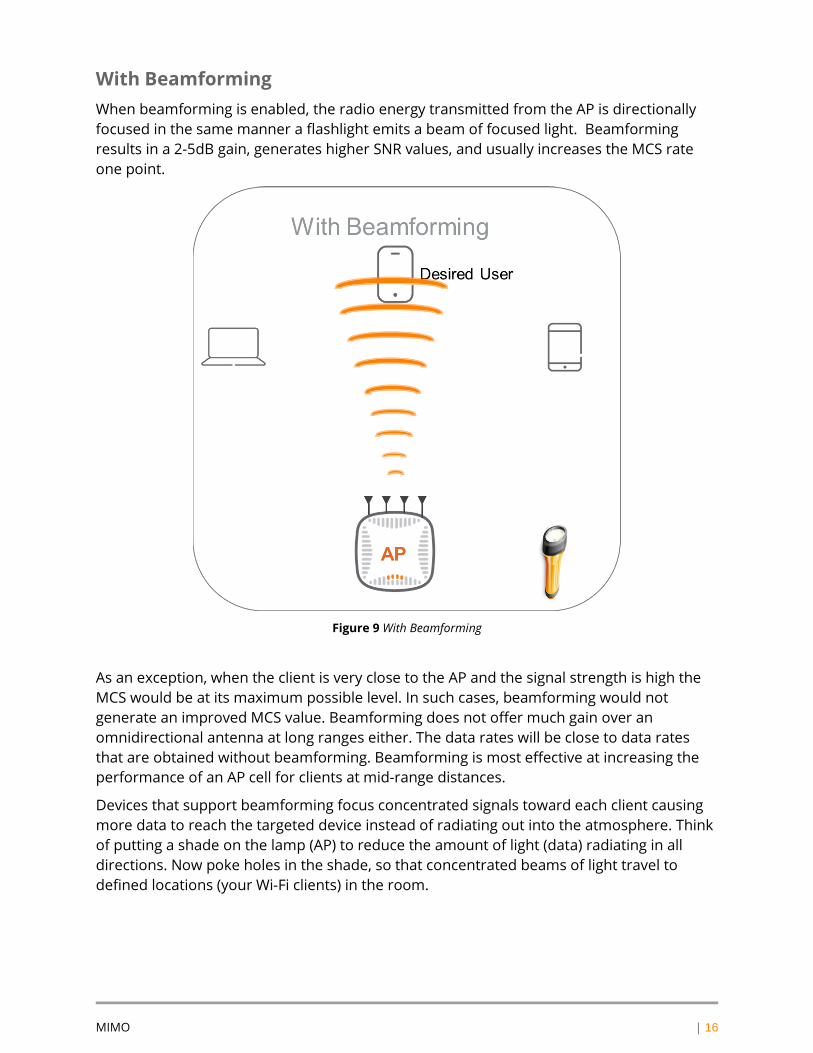
With Beamforming When beamforming is enabled, the radio energy transmitted from the AP is directionally focused in the same manner a flashlight emits a beam of focused light. Beamforming results in a 2-5dB gain, generates higher SNR values, and usually increases the MCS rate one point.
Figure 9 With Beamforming
As an exception, when the client is very close to the AP and the signal strength is high the MCS would be at its maximum possible level. In such cases, beamforming would not generate an improved MCS value. Beamforming does not offer much gain over an omnidirectional antenna at long ranges either. The data rates will be close to data rates that are obtained without beamforming. Beamforming is most effective at increasing the performance of an AP cell for clients at mid-range distances.
Devices that support beamforming focus concentrated signals toward each client causing more data to reach the targeted device instead of radiating out into the atmosphere. Think of putting a shade on the lamp (AP) to reduce the amount of light (data) radiating in all directions. Now poke holes in the shade, so that concentrated beams of light travel to defined locations (your Wi-Fi clients) in the room.
MIMO | 17
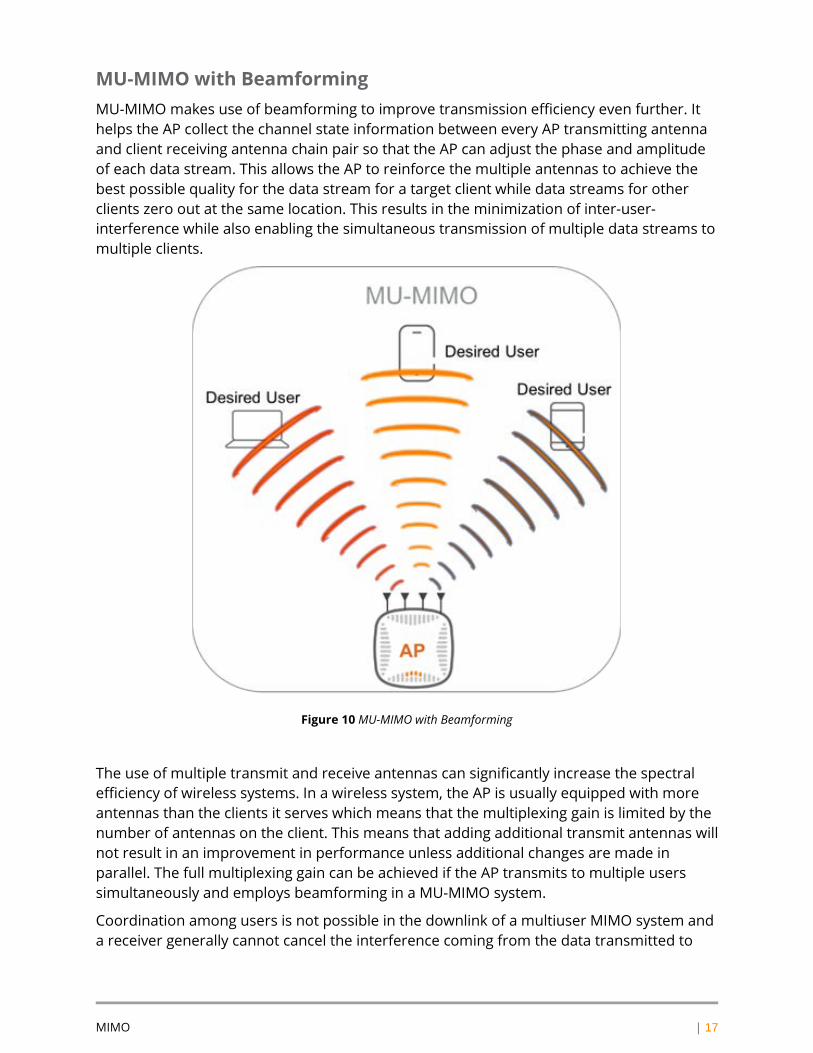
MU-MIMO with Beamforming MU-MIMO makes use of beamforming to improve transmission efficiency even further. It helps the AP collect the channel state information between every AP transmitting antenna and client receiving antenna chain pair so that the AP can adjust the phase and amplitude of each data stream. This allows the AP to reinforce the multiple antennas to achieve the best possible quality for the data stream for a target client while data streams for other clients zero out at the same location. This results in the minimization of inter-user-interference while also enabling the simultaneous transmission of multiple data streams to multiple clients.
Figure 10 MU-MIMO with Beamforming
The use of multiple transmit and receive antennas can significantly increase the spectral efficiency of wireless systems. In a wireless system, the AP is usually equipped with more antennas than the clients it serves which means that the multiplexing gain is limited by the number of antennas on the client. This means that adding additional transmit antennas will not result in an improvement in performance unless additional changes are made in parallel. The full multiplexing gain can be achieved if the AP transmits to multiple users simultaneously and employs beamforming in a MU-MIMO system.
Coordination among users is not possible in the downlink of a multiuser MIMO system and a receiver generally cannot cancel the interference coming from the data transmitted to
MIMO | 18
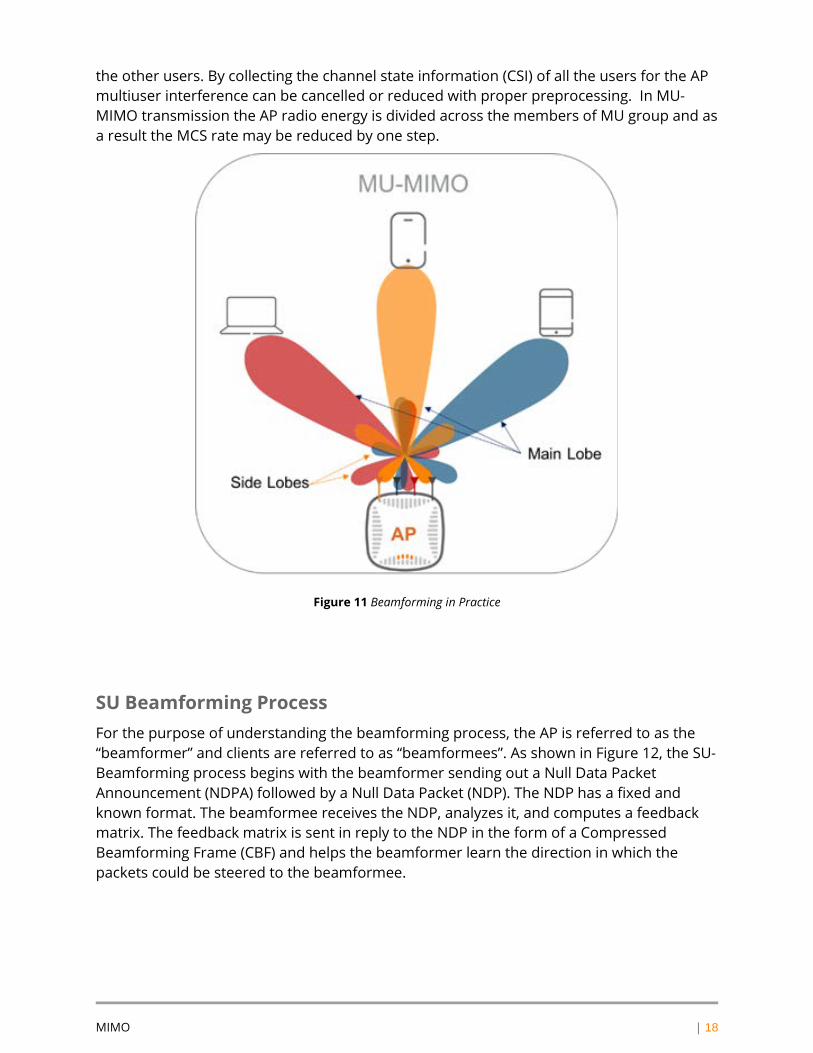
the other users. By collecting the channel state information (CSI) of all the users for the AP multiuser interference can be cancelled or reduced with proper preprocessing. In MU-MIMO transmission the AP radio energy is divided across the members of MU group and as a result the MCS rate may be reduced by one step.
Figure 11 Beamforming in Practice
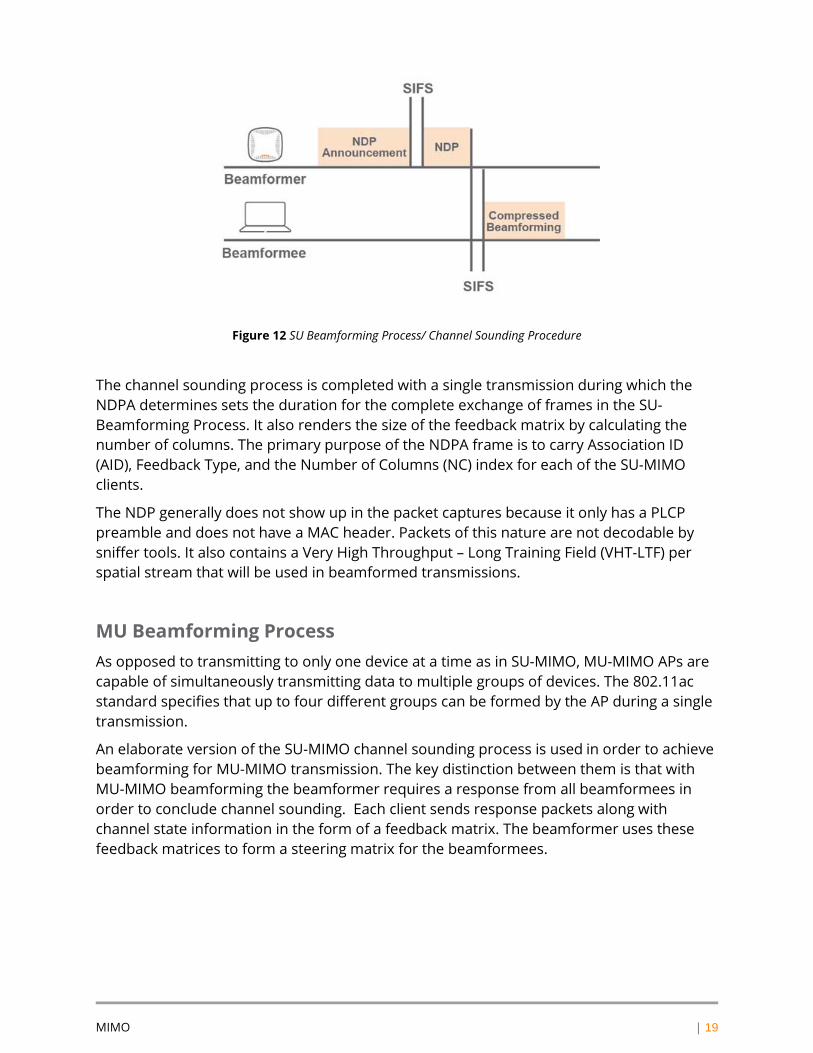
SU Beamforming Process For the purpose of understanding the beamforming process, the AP is referred to as the “beamformer” and clients are referred to as “beamformees”. As shown in Figure 12, the SU-Beamforming process begins with the beamformer sending out a Null Data Packet Announcement (NDPA) followed by a Null Data Packet (NDP). The NDP has a fixed and known format. The beamformee receives the NDP, analyzes it, and computes a feedback matrix. The feedback matrix is sent in reply to the NDP in the form of a Compressed Beamforming Frame (CBF) and helps the beamformer learn the direction in which the packets could be steered to the beamformee.
MIMO | 19
Figure 12 SU Beamforming Process/ Channel Sounding Procedure
The channel sounding process is completed with a single transmission during which the NDPA determines sets the duration for the complete exchange of frames in the SU-Beamforming Process. It also renders the size of the feedback matrix by calculating the number of columns. The primary purpose of the NDPA frame is to carry Association ID (AID), Feedback Type, and the Number of Columns (NC) index for each of the SU-MIMO clients.
The NDP generally does not show up in the packet captures because it only has a PLCP preamble and does not have a MAC header. Packets of this nature are not decodable by sniffer tools. It also contains a Very High Throughput – Long Training Field (VHT-LTF) per spatial stream that will be used in beamformed transmissions.
MU Beamforming Process As opposed to transmitting to only one device at a time as in SU-MIMO, MU-MIMO APs are capable of simultaneously transmitting data to multiple groups of devices. The 802.11ac standard specifies that up to four different groups can be formed by the AP during a single transmission.
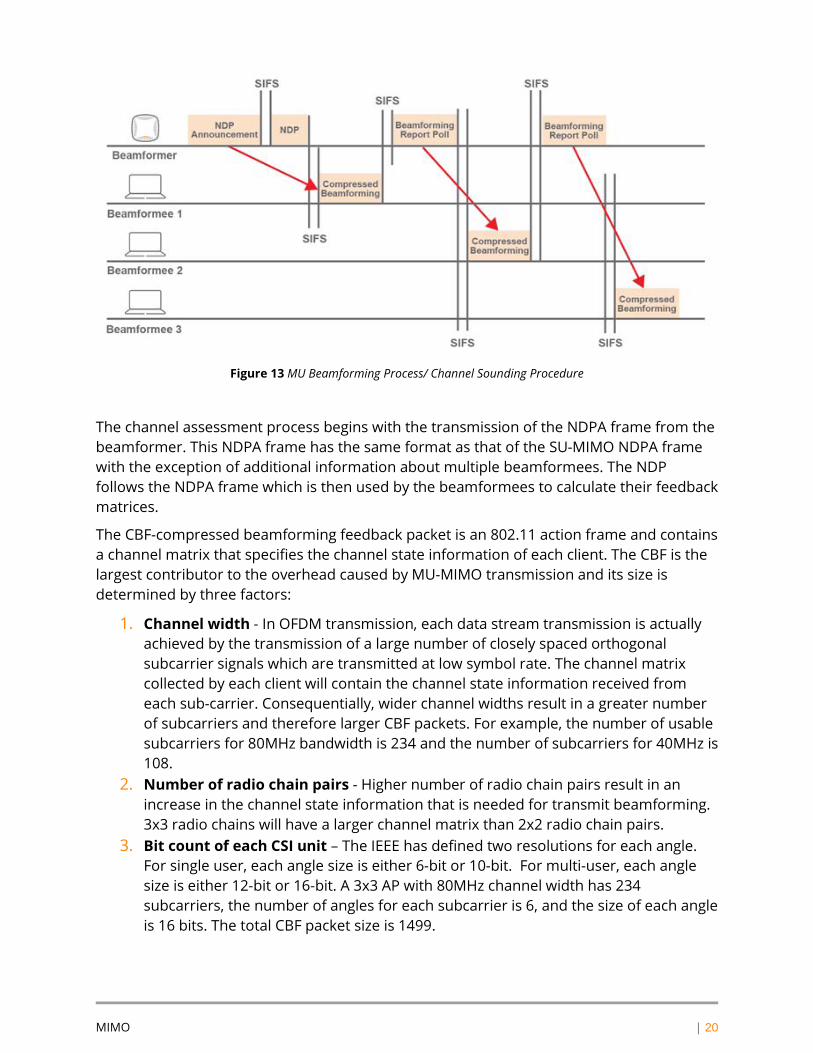
An elaborate version of the SU-MIMO channel sounding process is used in order to achieve beamforming for MU-MIMO transmission. The key distinction between them is that with MU-MIMO beamforming the beamformer requires a response from all beamformees in order to conclude channel sounding. Each client sends response packets along with channel state information in the form of a feedback matrix. The beamformer uses these feedback matrices to form a steering matrix for the beamformees.
MIMO | 20
Figure 13 MU Beamforming Process/ Channel Sounding Procedure
The channel assessment process begins with the transmission of the NDPA frame from the beamformer. This NDPA frame has the same format as that of the SU-MIMO NDPA frame with the exception of additional information about multiple beamformees. The NDP follows the NDPA frame which is then used by the beamformees to calculate their feedback matrices.
The CBF-compressed beamforming feedback packet is an 802.11 action frame and contains a channel matrix that specifies the channel state information of each client. The CBF is the largest contributor to the overhead caused by MU-MIMO transmission and its size is determined by three factors:
1. Channel width - In OFDM transmission, each data stream transmission is actually achieved by the transmission of a large number of closely spaced orthogonal subcarrier signals which are transmitted at low symbol rate. The channel matrix collected by each client will contain the channel state information received from each sub-carrier. Consequentially, wider channel widths result in a greater number of subcarriers and therefore larger CBF packets. For example, the number of usable subcarriers for 80MHz bandwidth is 234 and the number of subcarriers for 40MHz is 108.
2. Number of radio chain pairs - Higher number of radio chain pairs result in an increase in the channel state information that is needed for transmit beamforming. 3x3 radio chains will have a larger channel matrix than 2x2 radio chain pairs.
3. Bit count of each CSI unit – The IEEE has defined two resolutions for each angle. For single user, each angle size is either 6-bit or 10-bit. For multi-user, each angle size is either 12-bit or 16-bit. A 3x3 AP with 80MHz channel width has 234 subcarriers, the number of angles for each subcarrier is 6, and the size of each angle is 16 bits. The total CBF packet size is 1499.
MIMO | 21
Transmit Beamforming vs. Spatial Multiplexing Spatial Division Multiplexing (SDM) was first introduced with 802.11n and subsequently became known as SDMA with the development of MU-MIMO in 802.11ac. SDM uses the multipath technique where more than one independent RF path exists between a pair of devices. In its simplest form, the transmitter divides the data stream into two spatial streams and directs each spatial stream to a different antenna. By definition, spatial multiplexing is different from transmit beamforming in the sense that it is the process where the same information is placed across two or more of the available antennas in an AP or Client device. Unlike beamforming, there is no channel sounding procedure that takes place in order to determine an optimal phase for the spatial streams. In addition, spatial multiplexing doesn’t setup initial coordination between the AP and clients.
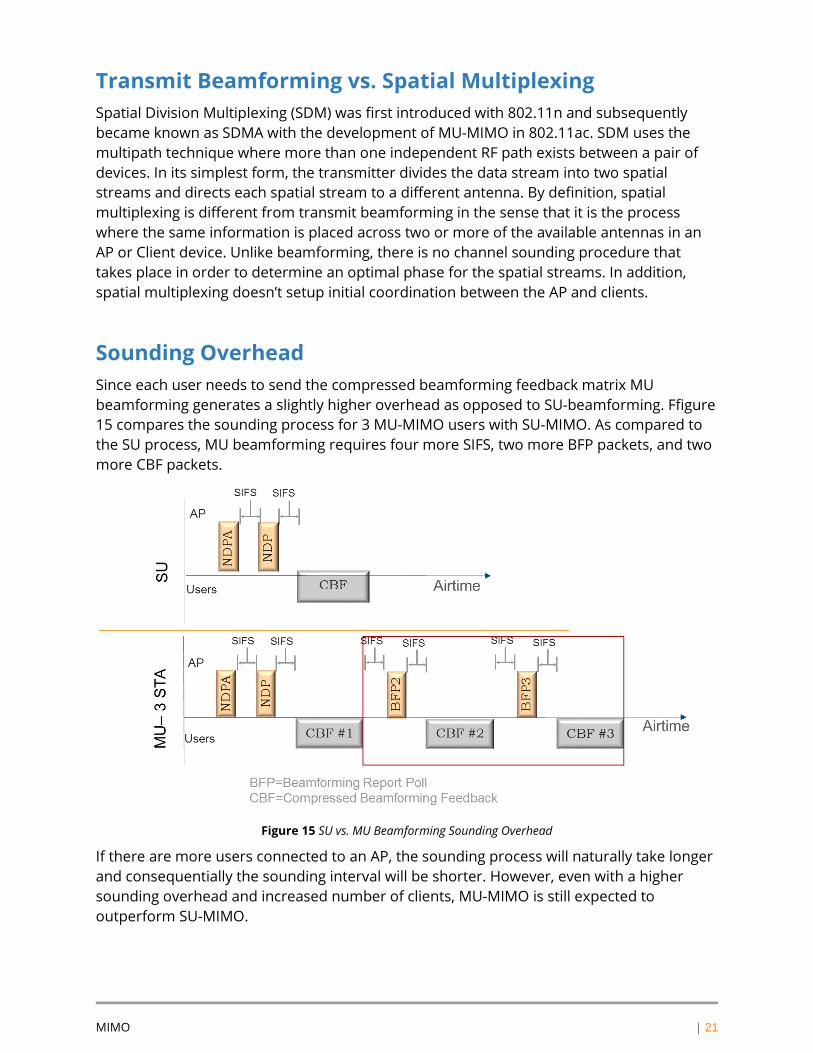
Sounding Overhead Since each user needs to send the compressed beamforming feedback matrix MU beamforming generates a slightly higher overhead as opposed to SU-beamforming. Ffigure 15 compares the sounding process for 3 MU-MIMO users with SU-MIMO. As compared to the SU process, MU beamforming requires four more SIFS, two more BFP packets, and two more CBF packets.
Figure 15 SU vs. MU Beamforming Sounding Overhead
If there are more users connected to an AP, the sounding process will naturally take longer and consequentially the sounding interval will be shorter. However, even with a higher sounding overhead and increased number of clients, MU-MIMO is still expected to outperform SU-MIMO.
MIMO | 22
Design Considerations Several factors affect the performance of an AP. From an RF perspective, Sounding Overhead and Channel Correlation are a couple of things that can variably affect the capabilities of a MU-MIMO device. The availability and orientation of clients can also cause the performance of the AP to go down. Hence, the following design considerations must be borne in mind while adopting MU-MIMO in enterprise Wi-Fi networks:
1. In the current market, MU-MIMO support in wireless clients is very limited. Most clients today are SU-MIMO with either one or two spatial streams.
2. Higher the number of clients in a network, higher is the sounding overhead. 3. Throughput values are highly sensitive to MCS rates in a group of MU-MIMO clients.
A large delta in performance values may be observed for as small as one step change in MCS Index of transmitted packets.
Best Practices Aruba has put forward a list of best practices to enhance the performance of MU-MIMO APs. The recommendation for these best practices remain mostly unchanged for MU-MIMO networks:
1. Recommended AP counts for MU-MIMO:
1 AP per 2,500ft2
50 clients per AP
2. 20-MHz channels should still be used for high density and VHD network 3. Enable DFS channels if possible 4. Increase basic rate to 24Mbps
Device Capabilities | 23
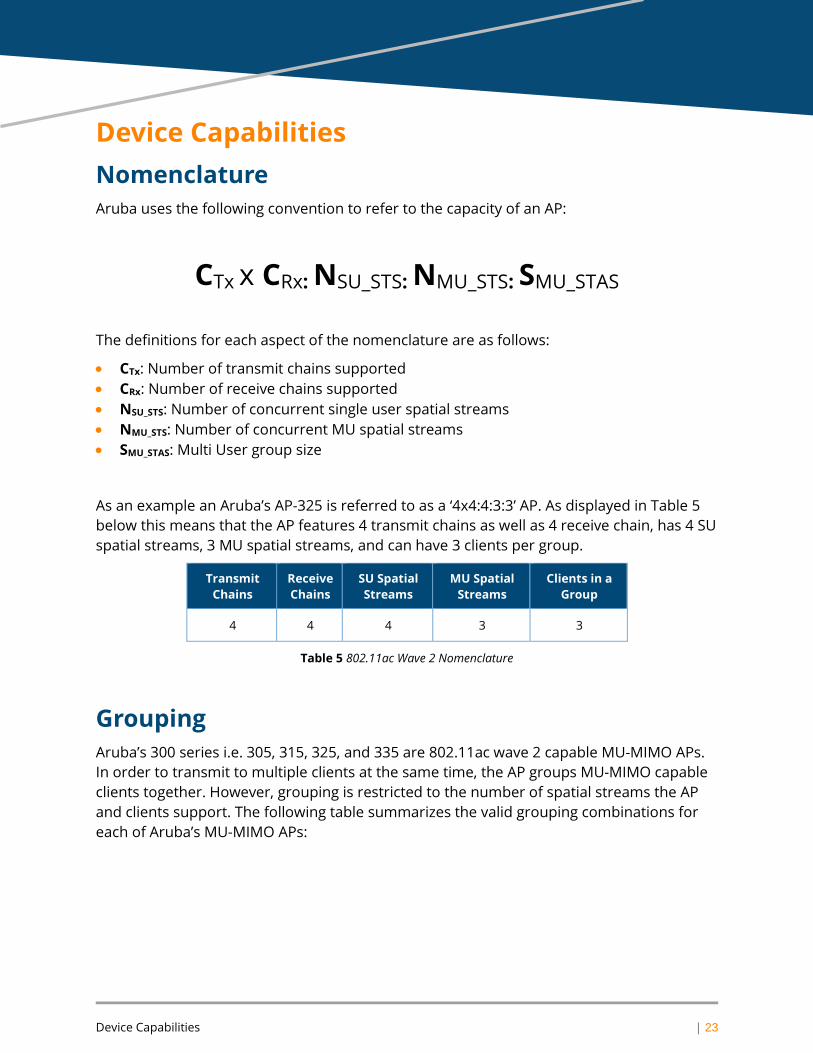
Device Capabilities Nomenclature Aruba uses the following convention to refer to the capacity of an AP:
CTx x CRx: NSU_STS: NMU_STS: SMU_STAS
The definitions for each aspect of the nomenclature are as follows:
• CTx: Number of transmit chains supported • CRx: Number of receive chains supported • NSU_STS: Number of concurrent single user spatial streams • NMU_STS: Number of concurrent MU spatial streams • SMU_STAS: Multi User group size
As an example an Aruba’s AP-325 is referred to as a ‘4x4:4:3:3’ AP. As displayed in Table 5 below this means that the AP features 4 transmit chains as well as 4 receive chain, has 4 SU spatial streams, 3 MU spatial streams, and can have 3 clients per group.
Transmit Chains
Receive Chains
SU Spatial Streams
MU Spatial Streams
Clients in a Group
4 4 4 3 3
Table 5 802.11ac Wave 2 Nomenclature
Grouping Aruba’s 300 series i.e. 305, 315, 325, and 335 are 802.11ac wave 2 capable MU-MIMO APs. In order to transmit to multiple clients at the same time, the AP groups MU-MIMO capable clients together. However, grouping is restricted to the number of spatial streams the AP and clients support. The following table summarizes the valid grouping combinations for each of Aruba’s MU-MIMO APs:
Device Capabilities | 24
Valid Multi-User STA Combinations
MU Spatial Streams
MU Group Size
(STAs)
Aruba 325
(4x4:4:3:3)
Aruba 335
(4x4:4:4:3)
Aruba 315
(4x4:4:4:3)
Aruba 305
(3x3:3:2:2)
1SS+1SS 2 2
1SS+2SS 3 2
2SS+2SS 4 2
1SS+1SS+1SS 3 3
1SS+1SS+2SS 4 3
Table 6 Valid Grouping Combinations of Aruba APs
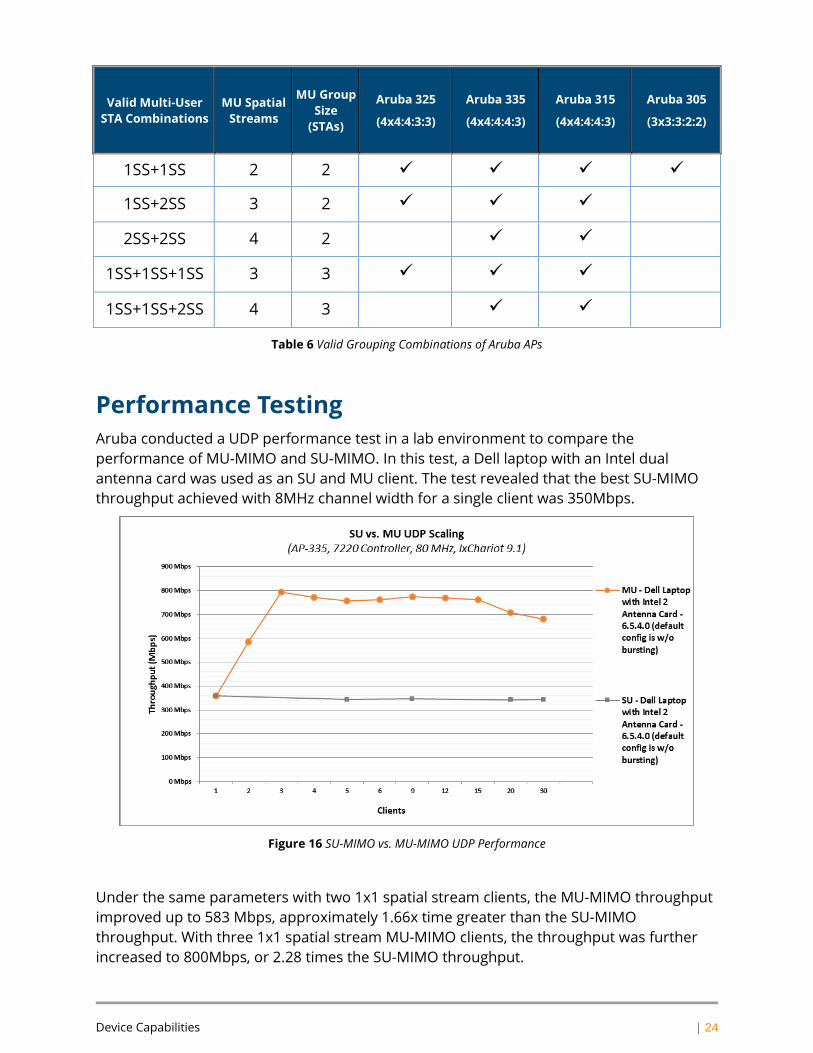
Performance Testing Aruba conducted a UDP performance test in a lab environment to compare the performance of MU-MIMO and SU-MIMO. In this test, a Dell laptop with an Intel dual antenna card was used as an SU and MU client. The test revealed that the best SU-MIMO throughput achieved with 8MHz channel width for a single client was 350Mbps.
Figure 16 SU-MIMO vs. MU-MIMO UDP Performance
Under the same parameters with two 1x1 spatial stream clients, the MU-MIMO throughput improved up to 583 Mbps, approximately 1.66x time greater than the SU-MIMO throughput. With three 1x1 spatial stream MU-MIMO clients, the throughput was further increased to 800Mbps, or 2.28 times the SU-MIMO throughput.
Device Capabilities | 25
MU-MIMO was scale tested with up to 35 MU-MIMO clients. Despite the high number of clients, the MU-MIMO throughput number remained stable throughout the duration of the test. Even with 35 clients, the MU-MIMO AP still achieved gain 2 times higher compared to SU-MIMO.
Aruba’s testing conclusively demonstrated constant throughput values and an optimized sounding process. This result was achieved due to the sounding interval not only increasing with the number of clients but also automatically adjusting with Packet Error Rate (PER).
Omnipeek Plugin | 26
Omnipeek Plugin Aruba has developed a custom plugin for OmniPeek that visualizes analytics of packet captures creating a very powerful tool for wireless diagnostics and analytics with OmniPeek. While this tool is especially powerful for MU-MIMO it can be used effectively in a variety of diagnostic scenarios.
Installation The tool is available for download on the Aruba Support Website. OmniPeek 10.x or higher is a prerequisite for installation and use. The recommended version of OmniPeek is 10.0.1. The installation steps are explained in detail in the user manual of the tool.
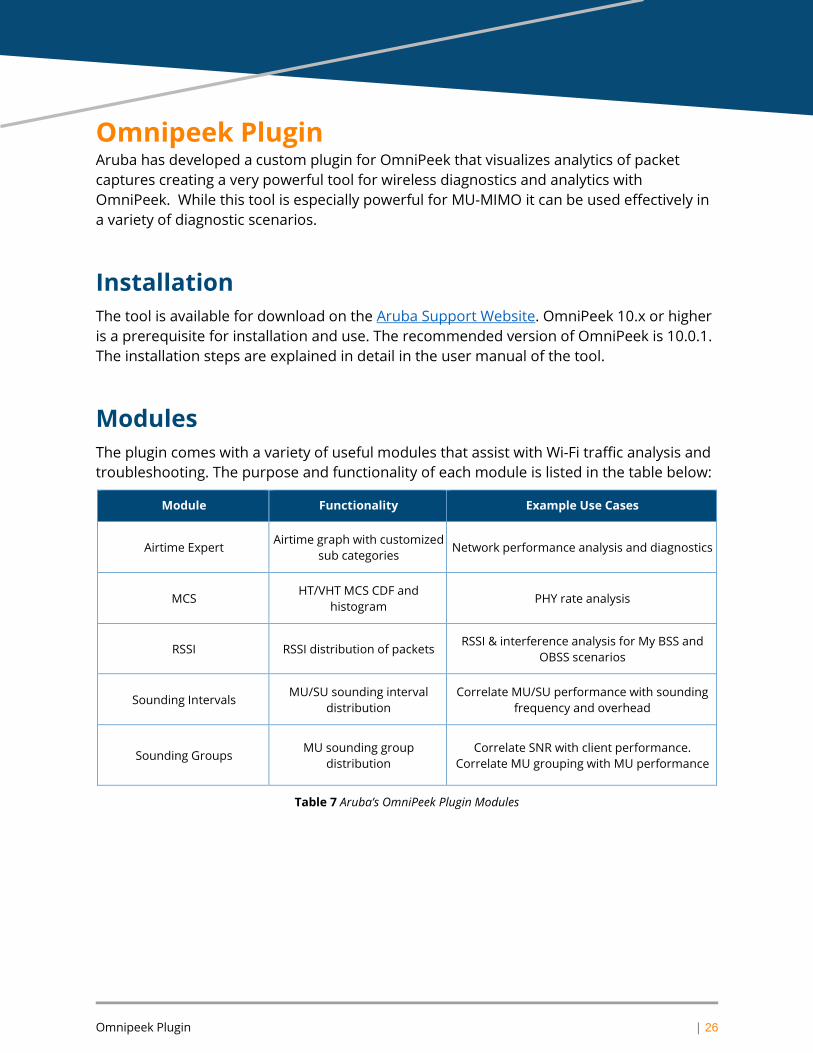
Modules The plugin comes with a variety of useful modules that assist with Wi-Fi traffic analysis and troubleshooting. The purpose and functionality of each module is listed in the table below:
Module Functionality Example Use Cases
Airtime Expert Airtime graph with customized
sub categories Network performance analysis and diagnostics
MCS HT/VHT MCS CDF and
histogram PHY rate analysis
RSSI RSSI distribution of packets RSSI & interference analysis for My BSS and
OBSS scenarios
Sounding Intervals MU/SU sounding interval
distribution Correlate MU/SU performance with sounding
frequency and overhead
Sounding Groups MU sounding group
distribution Correlate SNR with client performance.
Correlate MU grouping with MU performance
Table 7 Aruba’s OmniPeek Plugin Modules
Omnipeek Plugin | 27
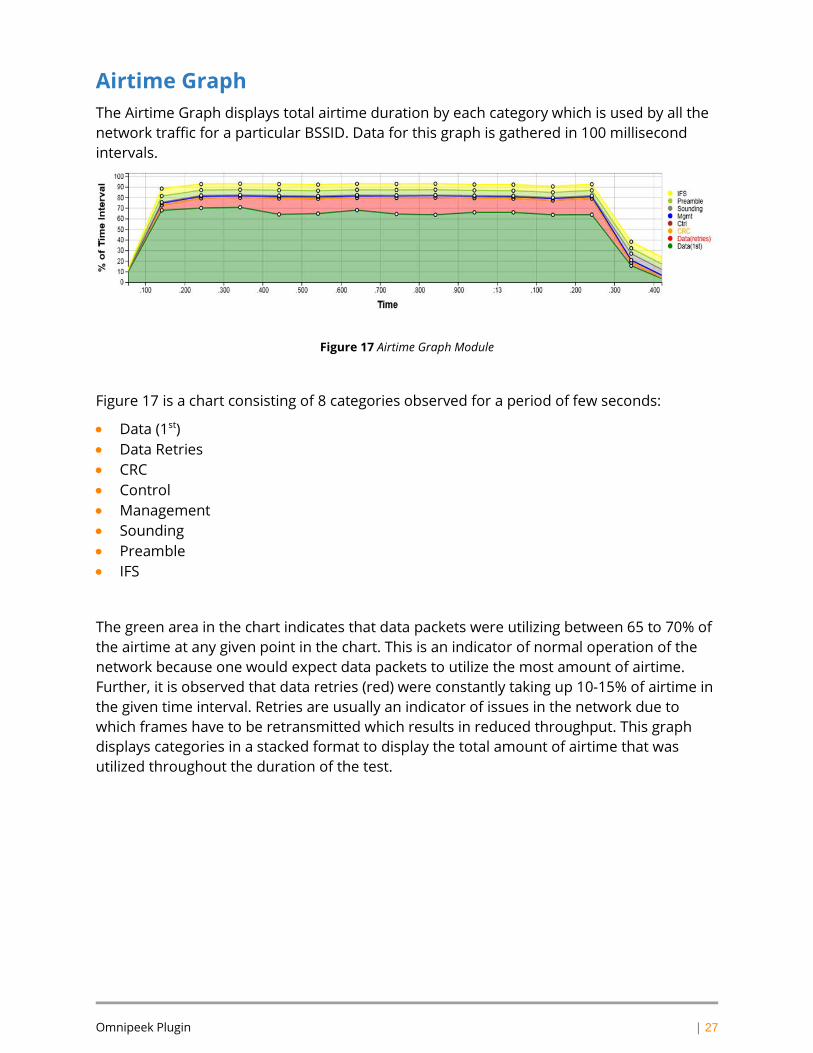
Airtime Graph The Airtime Graph displays total airtime duration by each category which is used by all the network traffic for a particular BSSID. Data for this graph is gathered in 100 millisecond intervals.
Figure 17 Airtime Graph Module
Figure 17 is a chart consisting of 8 categories observed for a period of few seconds:
• Data (1st) • Data Retries • CRC • Control • Management • Sounding • Preamble • IFS
The green area in the chart indicates that data packets were utilizing between 65 to 70% of the airtime at any given point in the chart. This is an indicator of normal operation of the network because one would expect data packets to utilize the most amount of airtime. Further, it is observed that data retries (red) were constantly taking up 10-15% of airtime in the given time interval. Retries are usually an indicator of issues in the network due to which frames have to be retransmitted which results in reduced throughput. This graph displays categories in a stacked format to display the total amount of airtime that was utilized throughout the duration of the test.
Omnipeek Plugin | 28
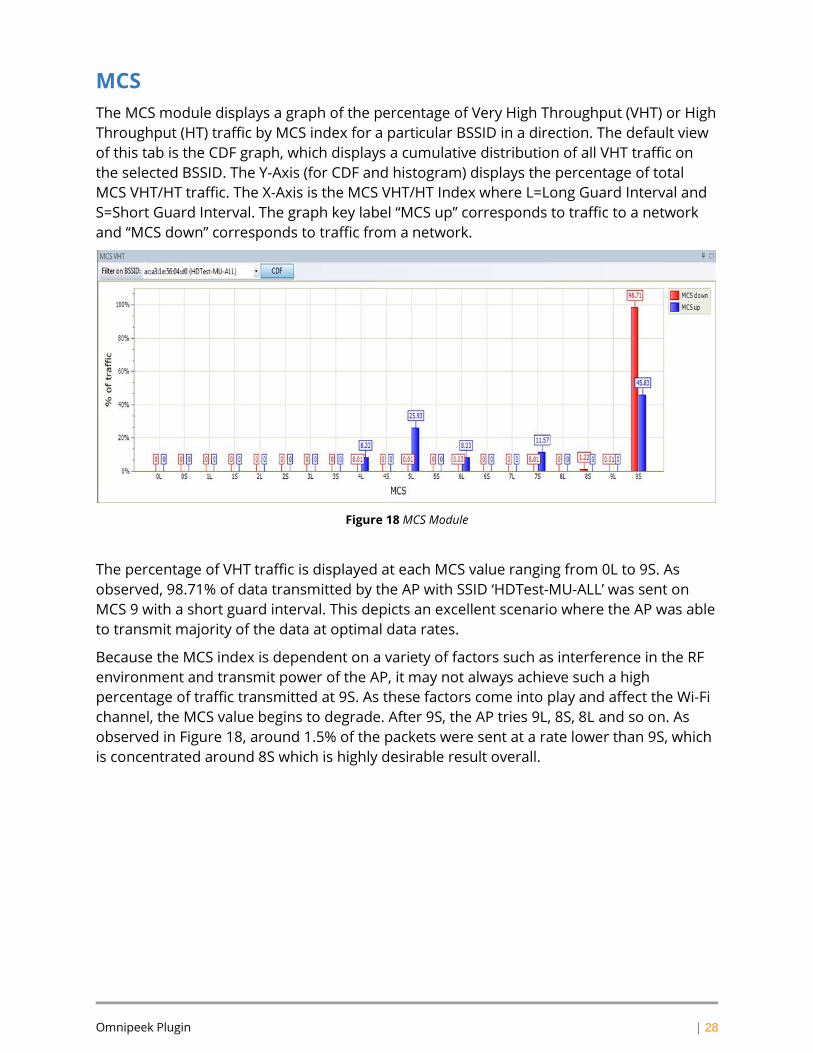
MCS The MCS module displays a graph of the percentage of Very High Throughput (VHT) or High Throughput (HT) traffic by MCS index for a particular BSSID in a direction. The default view of this tab is the CDF graph, which displays a cumulative distribution of all VHT traffic on the selected BSSID. The Y-Axis (for CDF and histogram) displays the percentage of total MCS VHT/HT traffic. The X-Axis is the MCS VHT/HT Index where L=Long Guard Interval and S=Short Guard Interval. The graph key label “MCS up” corresponds to traffic to a network and “MCS down” corresponds to traffic from a network.
Figure 18 MCS Module
The percentage of VHT traffic is displayed at each MCS value ranging from 0L to 9S. As observed, 98.71% of data transmitted by the AP with SSID ‘HDTest-MU-ALL’ was sent on MCS 9 with a short guard interval. This depicts an excellent scenario where the AP was able to transmit majority of the data at optimal data rates.
Because the MCS index is dependent on a variety of factors such as interference in the RF environment and transmit power of the AP, it may not always achieve such a high percentage of traffic transmitted at 9S. As these factors come into play and affect the Wi-Fi channel, the MCS value begins to degrade. After 9S, the AP tries 9L, 8S, 8L and so on. As observed in Figure 18, around 1.5% of the packets were sent at a rate lower than 9S, which is concentrated around 8S which is highly desirable result overall.
Omnipeek Plugin | 29
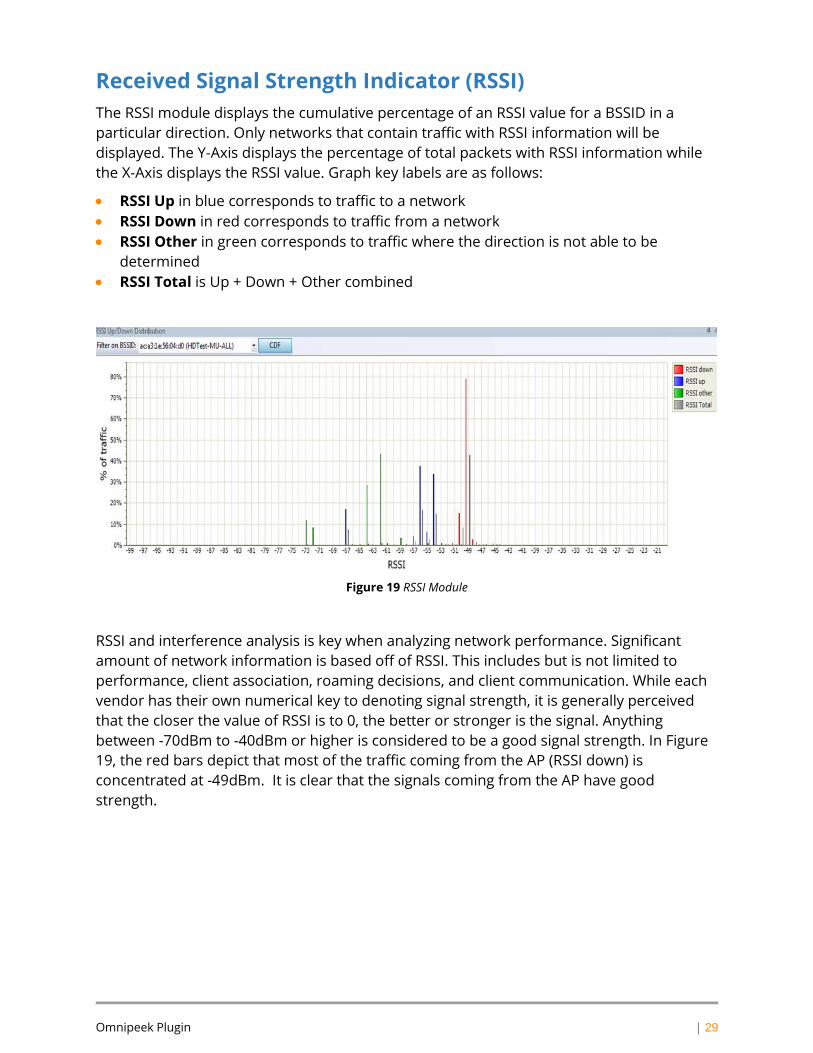
Received Signal Strength Indicator (RSSI) The RSSI module displays the cumulative percentage of an RSSI value for a BSSID in a particular direction. Only networks that contain traffic with RSSI information will be displayed. The Y-Axis displays the percentage of total packets with RSSI information while the X-Axis displays the RSSI value. Graph key labels are as follows:
• RSSI Up in blue corresponds to traffic to a network • RSSI Down in red corresponds to traffic from a network • RSSI Other in green corresponds to traffic where the direction is not able to be
determined • RSSI Total is Up + Down + Other combined
Figure 19 RSSI Module
RSSI and interference analysis is key when analyzing network performance. Significant amount of network information is based off of RSSI. This includes but is not limited to performance, client association, roaming decisions, and client communication. While each vendor has their own numerical key to denoting signal strength, it is generally perceived that the closer the value of RSSI is to 0, the better or stronger is the signal. Anything between -70dBm to -40dBm or higher is considered to be a good signal strength. In Figure 19, the red bars depict that most of the traffic coming from the AP (RSSI down) is concentrated at -49dBm. It is clear that the signals coming from the AP have good strength.
Omnipeek Plugin | 30
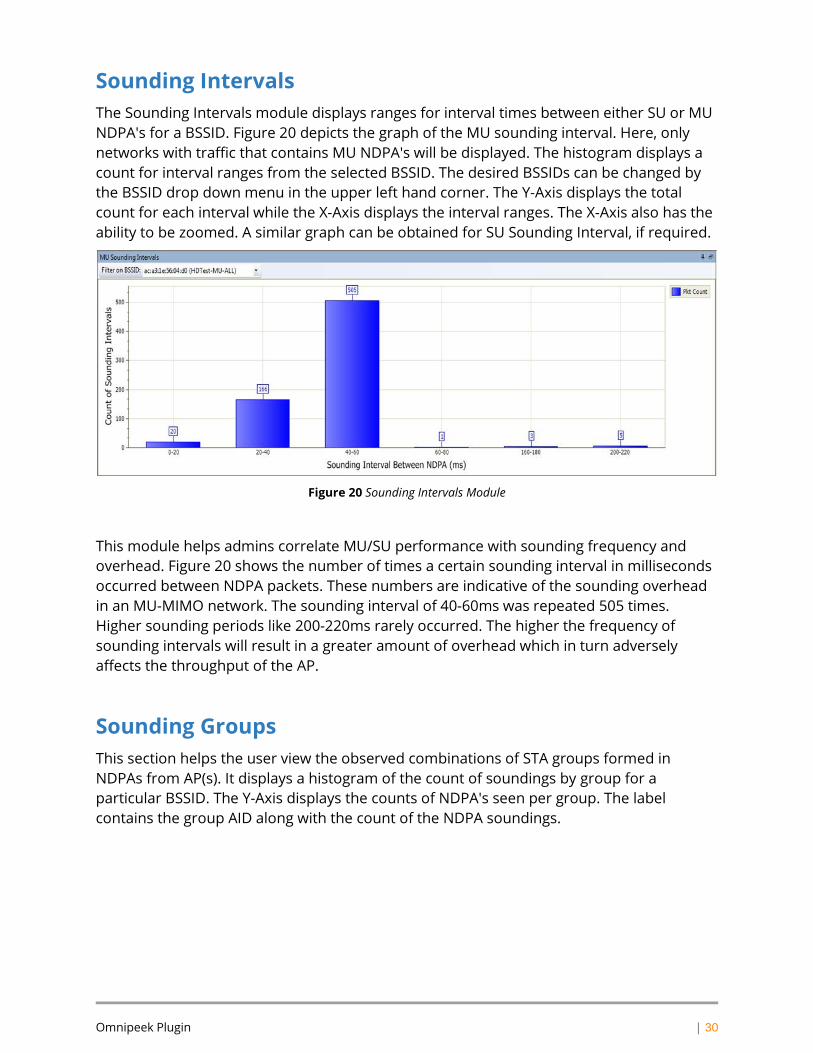
Sounding Intervals The Sounding Intervals module displays ranges for interval times between either SU or MU NDPA's for a BSSID. Figure 20 depicts the graph of the MU sounding interval. Here, only networks with traffic that contains MU NDPA's will be displayed. The histogram displays a count for interval ranges from the selected BSSID. The desired BSSIDs can be changed by the BSSID drop down menu in the upper left hand corner. The Y-Axis displays the total count for each interval while the X-Axis displays the interval ranges. The X-Axis also has the ability to be zoomed. A similar graph can be obtained for SU Sounding Interval, if required.
Figure 20 Sounding Intervals Module
This module helps admins correlate MU/SU performance with sounding frequency and overhead. Figure 20 shows the number of times a certain sounding interval in milliseconds occurred between NDPA packets. These numbers are indicative of the sounding overhead in an MU-MIMO network. The sounding interval of 40-60ms was repeated 505 times. Higher sounding periods like 200-220ms rarely occurred. The higher the frequency of sounding intervals will result in a greater amount of overhead which in turn adversely affects the throughput of the AP.
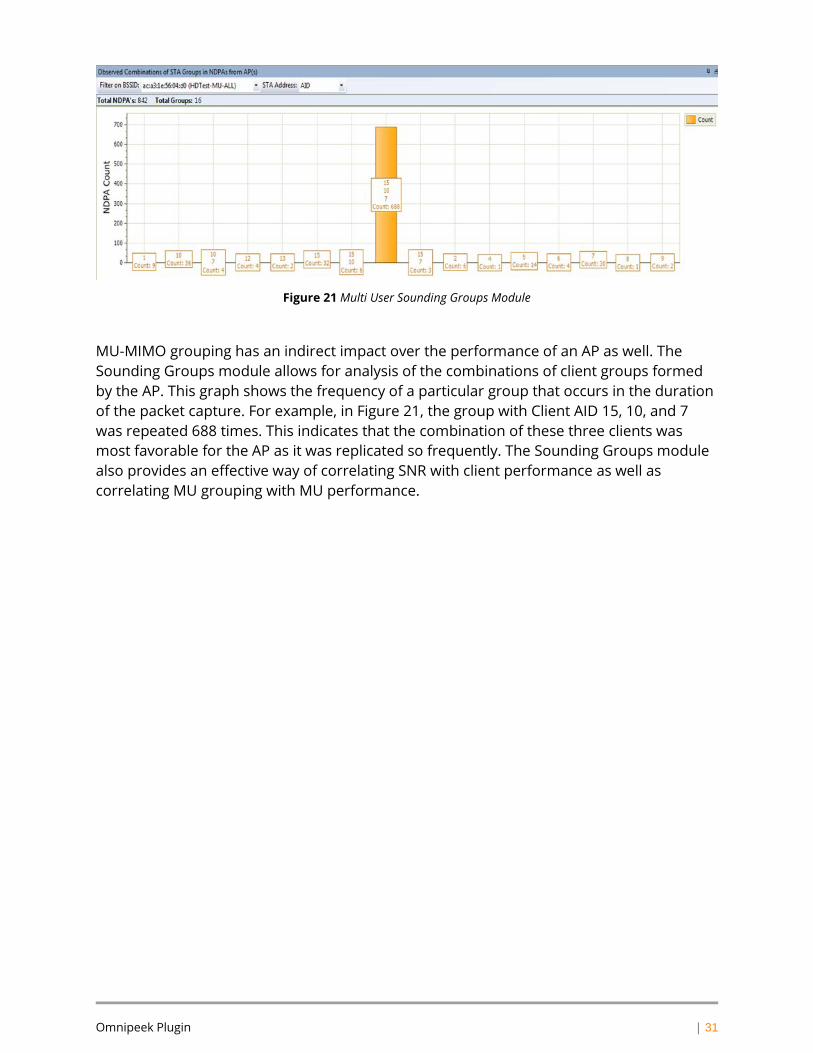
Sounding Groups This section helps the user view the observed combinations of STA groups formed in NDPAs from AP(s). It displays a histogram of the count of soundings by group for a particular BSSID. The Y-Axis displays the counts of NDPA's seen per group. The label contains the group AID along with the count of the NDPA soundings.
Omnipeek Plugin | 31
Figure 21 Multi User Sounding Groups Module
MU-MIMO grouping has an indirect impact over the performance of an AP as well. The Sounding Groups module allows for analysis of the combinations of client groups formed by the AP. This graph shows the frequency of a particular group that occurs in the duration of the packet capture. For example, in Figure 21, the group with Client AID 15, 10, and 7 was repeated 688 times. This indicates that the combination of these three clients was most favorable for the AP as it was replicated so frequently. The Sounding Groups module also provides an effective way of correlating SNR with client performance as well as correlating MU grouping with MU performance.
Conclusion | 32
Conclusion Over the years, Wi-Fi performance has drastically changed as new standards have emerged. Although many factors have played a role in bringing about change MU-MIMO is the current cause of revolution. With the use of beamforming and simultaneous transmission of data to multiple users at a time, MU-MIMO has facilitated a dramatic increase in achievable data rates. Despite the overhead caused by the sounding procedure and limited availability of clients, MU-MIMO has improved the performance of 802.11ac Wave 2 devices up 2 times more than 802.11ac Wave 1.